
The .NET Developer's Guide to Memory and Performance Profiling
39
CHRISTOPHER BRIAN EARGLE TELERIK | 201 Jones Rd, Waltham, MA 02451 Rough Cut Telerik Q3 2012 The .NET Developer’s Guide Memory and Performance Profiling
Transcript of The .NET Developer's Guide to Memory and Performance Profiling

CHRISTOPHER BRIAN EARGLE TELERIK | 201 Jones Rd, Waltham, MA 02451
Rough Cut
Telerik Q3
2012
The .NET Developer’s Guide Memory and Performance Profiling

The .NET Developer's Guide to Memory and Performance Profiling
by Christopher Brian Eargle
Copyright © 2012 Telerik, All rights reserved.
No part of this publication may be reproduced, distributed, or transmitted in any
form or by any means, including photocopying, recording, or other electronic or
mechanical methods, without the prior written permission of Telerik, except in the
case of brief quotations embodied in critical reviews and certain other
noncommercial uses permitted by copyright law.
Derivative works rights shared with Christopher Brian Eargle.
For inquiries regarding this work, such as to obtain reproduction permission, please
contact Telerik:
Telerik
201 Jones Rd
Waltham, MA 02451
email: [email protected]
phone: +1-888-365-2779
fax: +1-617-249-2116
Edition History
October 2012: Rough Cut, Telerik Q3 2012

ABOUT THE AUTHOR
Christopher Brian Eargle is a Telerik Technical
Evangelist with over a decade of experience
designing and developing enterprise
applications, and he runs the local .NET User
Group: the Columbia Enterprise Developers
Guild. He is a frequent guest of conferences and community events
promoting best practices and new technologies.
Chris is a native Carolinian; his family settled the Dutch Form region of
South Carolina in 1752. He currently resides in Columbia with his wife,
Binyue, his dog, Laika, and his three cats: Meeko, Tigger, and Sookie.
Amazingly, they all get along… except for Meeko, who is by no means
meek.
Chris is a Microsoft C# MVP currently serves on the INETA Board of
Directors. He is in charge of the Community Speakers Program, having
come from the program himself before he began working at Telerik. If
you are passionate about software development, you are encouraged
to join INETA to be connected to hundreds of groups. It is free to join,
and INETA helps cover your travel expenses for speaking.
Chris’ blog, kodefuguru.com, features content to guide you in
becoming a .NET Ninja!
ABOUT THIS EDITION
Telerik released its first .NET memory and performance profiler,
JustTrace, in 2011. Since then, we have published a lot of good material
on the product, and we felt like we should move beyond that by
providing general resources to our users.
Books take time to write, and this is especially true for technical books,
which may require intense research. Since this is to be published on
the web, we decided to start releasing material with cycles. You are
currently reading the very first rough cut coincides with the Telerik Q3
2012 product release. If significant time has passed, be sure to check
the site for an update.
This edition is released free of charge. If you paid for it, you paid too
much.
TABLE OF CONTENTS
About the Author .................................................................................... 2
About This Edition ................................................................................... 3
Getting Started ........................................................................................ 6
What is Profiling? ................................................................................ 6
What is Optimization? ......................................................................... 6
Optimizing Versus Tuning .................................................................... 7
When to Optimize ............................................................................... 7
Four Steps ............................................................................................ 7
Assess ...................................................................................................... 9
Comparative Assessment .................................................................... 9
Reactive Assessment ......................................................................... 10
Proactive Assessment ........................................................................ 11
Acquire .................................................................................................. 12
Obtain a Tool ..................................................................................... 12
Obtain Data ....................................................................................... 13
Analyze .................................................................................................. 15
Performance Snapshots .................................................................... 15
Memory Snapshots ........................................................................... 16
Act ......................................................................................................... 18
String Concatenation ......................................................................... 18
Numeric Overflow ............................................................................. 21
Collection Types................................................................................. 23
Delayed Evaluation with Yield ........................................................... 27
Delegates ........................................................................................... 30
Fragmentation ................................................................................... 35
Excessive Writes ................................................................................ 36
Excessive References ......................................................................... 37
Long Lived Objects............................................................................. 37
Appendix ............................................................................................... 38
Table of Figures.................................................................................. 38
Index .................................................................................................. 38
GETTING STARTED
WHAT IS PROFILING?
Profiling is a form of program analysis to collect metrics on properties
of software such as memory usage and execution time. Memory and
performance profiling is used to detect memory and performance
issues to optimize an application.
WHAT IS OPTIMIZATION?
Optimizing involves making small changes to code to improve
performance or memory management without changing the external
behavior. These goals can sometimes conflicts. For example, improving
performance may require loading a large amount of data in memory.
An optimization that does this is memoization, a form of caching that
stores results of a function call so subsequent calls receive it faster.
Both optimizations and refactorings have names and involve making
small changes. The example given is called MEMOIZE FUNCTION.
The primary difference is that refactorings address readability and
maintainability. Optimizations often negatively affect the goals of
refactoring.
OPTIMIZING VERSUS TUNING
Optimization can be considered part of performance tuning, which
addresses the system as a whole. I find it most useful to use tuning in
reference to environmental issues such as bottlenecks and solutions
such as load balancing.
WHEN TO OPTIMIZE
Life is rarely black and white, and choosing to optimize requires the
ability to see in shades of gray as well. Acceptable limits should be
established in the assessment phase, and the further it is outside of
limits, the more severe the issue is. There are other considerations for
severity; I would address a heavily used function that is moderately
outside the limit sooner than I would a function that is rarely called but
even less performant. It is also important to know if the necessary
optimization will negatively affect other non-functional requirements.
In software, compromises are necessary.
FOUR STEPS
Profiling and optimizing your application can be broken down into four
steps:
1. Assess 2. Acquire 3. Analyze
4. Act
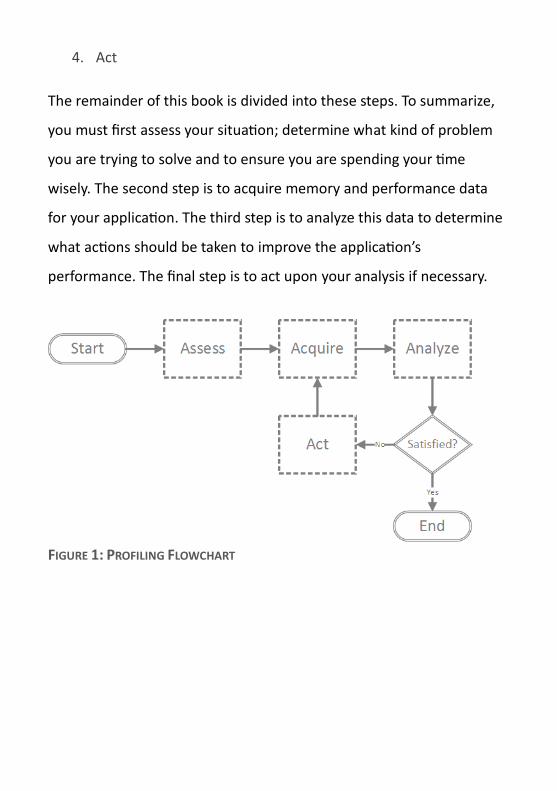
The remainder of this book is divided into these steps. To summarize,
you must first assess your situation; determine what kind of problem
you are trying to solve and to ensure you are spending your time
wisely. The second step is to acquire memory and performance data
for your application. The third step is to analyze this data to determine
what actions should be taken to improve the application’s
performance. The final step is to act upon your analysis if necessary.
FIGURE 1: PROFILING FLOWCHART
ASSESS
COMPARATIVE ASSESSMENT
Comparative assessment is most commonly used when a developer is
attempting to determine a particular strategy in designing a piece of a
system. For example, many different search algorithms are more or less
efficient depending on the data structures used and the data these
structures contain. You may want to know which would be best for
data received from an external service. You can obtain a few data sets
and profile the application to determine which algorithm performs
best. It is essential to have test data that appropriately represents data
commonly retrieved by the system. However, testing unproven data
sets is better than making an arbitrary decision based on personal
preference.
This form of assessment can also aid an architect in deciding on
whether to use a particular component or service. Here is another
example: You are working for a corporation that is deciding on whether
a move to Oracle would be wise. They currently have data stored in
SQL Server. You can set up identical VMs for both servers and create
packages to copy the data into Oracle. The application uses Entity
Framework, so you first run integration tests to determine if there are
compatibility issues then profile the applications to determine which is
better from a performance perspective. In this situation, there may be
other factors at play, so the results are primarily to provide feedback
on potential issues or benefits gained by switching systems.
REACTIVE ASSESSMENT
Reactive assessments involve attention given to performance and
memory management when an issue surfaced.
Here is a scenario with which you may be familiar:
Multiple bug reports were received that the application was
unstable and caused the workstation to slow down. This was
never noticed by development or quality assurance. After
interviewing the users reporting the bugs, it was found that
these particular users very rarely closed their applications or
rebooted their workstations. Further investigation on their
stations revealed that the application was consuming several
gigs of RAM. When the application was first opened, it only
consumed a hundred MB of RAM. The application had a
memory leak.
Profiling the application was predicated upon an identified issue.
PROACTIVE ASSESSMENT
In contrast to reactive assessment, proactive assessment includes
profiling as part of the development process. There are many non-
functional requirements that are part of the system, and use cases
must be established for acceptable performance, or responsiveness,
and reliability, or probability of failure. To connect the last part to
JustTrace, consider the reactive scenario that was presented. The
software worked fine at first, but it caused issues over time. In other
words, its reliability was dependent on the length and frequency of its
usage.
Due to the growing complexity of maintaining software, it is often best
to write maintainable code first, then optimize as needed. Having
performance and reliability requirements documented enables this. A
danger some fall into is the desire to squeeze the most performance
out of a system. Oftentimes, this is a waste of time and may even cause
issues, as the application becomes a Byzantine mess of extremely
performant code.
We recommend that you establish your non-functional requirements
up-front and regularly profile your solution. When the metrics go
beyond the acceptable range, you should concern yourself with
optimizing a particular piece of the system.
ACQUIRE
This section will contain information on acquiring data that can be
analyzed to determine memory and performance issues. This is a rough
cut of the book and is not ready.
This book is meant to provide general information about memory and
performance profiling. Since this portion is not quite ready, we are
including product specific information from the author’s introductory
article on Telerik JustTrace. At the very least, it will be useful for Telerik
users seeking guidance.
OBTAIN A TOOL
To acquire performance and memory usage data, you will need a tool.
You can try Telerik JustTrace for 30 days by going to
http://www.telerik.com/justtrace. Best of all, it contains what you need
to determine both performance and reliability by including
performance and memory profilers. JustTrace is available as a
standalone tool, but it is also packaged with Visual Studio Integration
components. Which one you choose to run it depends on your
workflow and preference.
Run JustTrace to begin a new profiling session.
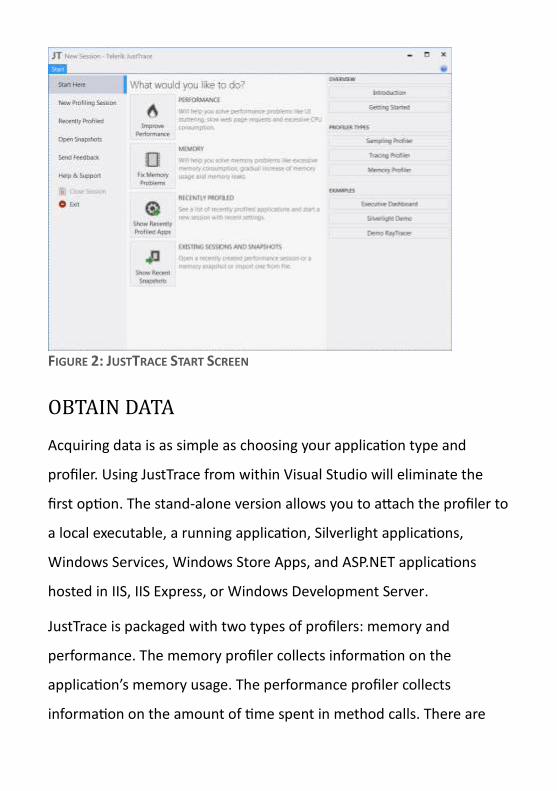
FIGURE 2: JUSTTRACE START SCREEN
OBTAIN DATA
Acquiring data is as simple as choosing your application type and
profiler. Using JustTrace from within Visual Studio will eliminate the
first option. The stand-alone version allows you to attach the profiler to
a local executable, a running application, Silverlight applications,
Windows Services, Windows Store Apps, and ASP.NET applications
hosted in IIS, IIS Express, or Windows Development Server.
JustTrace is packaged with two types of profilers: memory and
performance. The memory profiler collects information on the
application’s memory usage. The performance profiler collects
information on the amount of time spent in method calls. There are
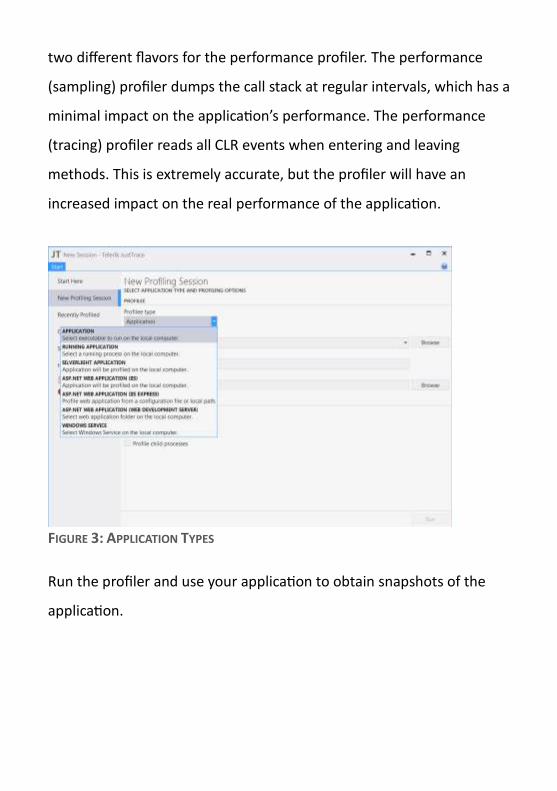
two different flavors for the performance profiler. The performance
(sampling) profiler dumps the call stack at regular intervals, which has a
minimal impact on the application’s performance. The performance
(tracing) profiler reads all CLR events when entering and leaving
methods. This is extremely accurate, but the profiler will have an
increased impact on the real performance of the application.
FIGURE 3: APPLICATION TYPES
Run the profiler and use your application to obtain snapshots of the
application.
ANALYZE
This section will explain how to analyze profiling data to determine
potential memory and performance issues. This is a rough cut of the
book and is not ready.
This book is meant to provide general information about memory and
performance profiling. Since this portion is not quite ready, we are
including product specific information from the author’s introductory
article on Telerik JustTrace. At the very least, it will be useful for Telerik
users seeking guidance.
With the profile of your application on hand, the next step is to analyze
the data acquired to track down issues.
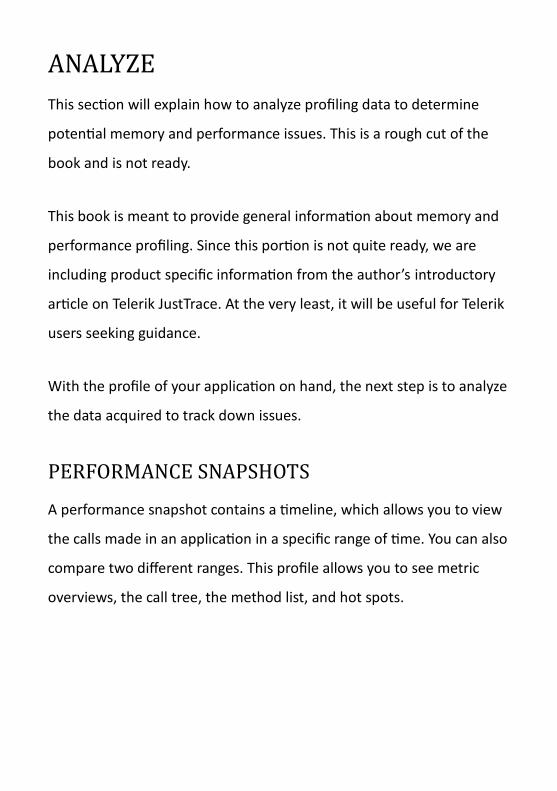
PERFORMANCE SNAPSHOTS
A performance snapshot contains a timeline, which allows you to view
the calls made in an application in a specific range of time. You can also
compare two different ranges. This profile allows you to see metric
overviews, the call tree, the method list, and hot spots.
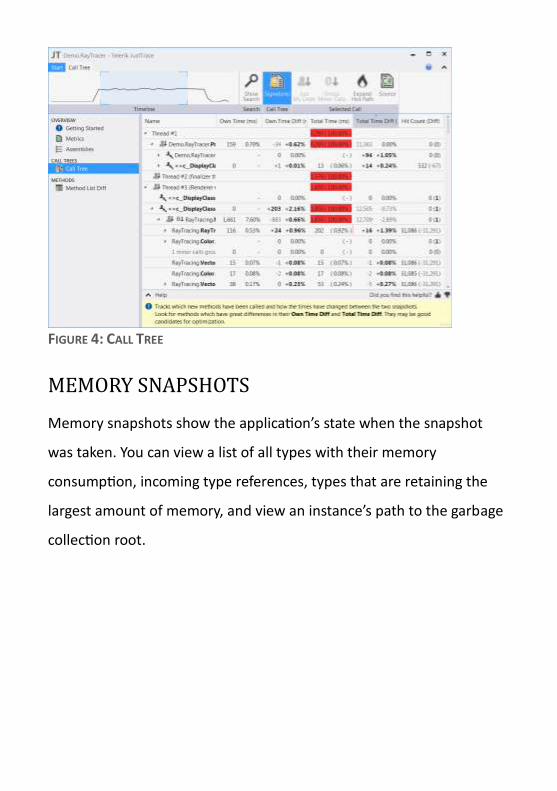
FIGURE 4: CALL TREE
MEMORY SNAPSHOTS
Memory snapshots show the application’s state when the snapshot
was taken. You can view a list of all types with their memory
consumption, incoming type references, types that are retaining the
largest amount of memory, and view an instance’s path to the garbage
collection root.
FIGURE 5: MEMORY SNAPSHOT SUMMARY
ACT
This section consists of issues you may an encounter and potential
solutions. This is a rough cut and will contain more information in
future releases.
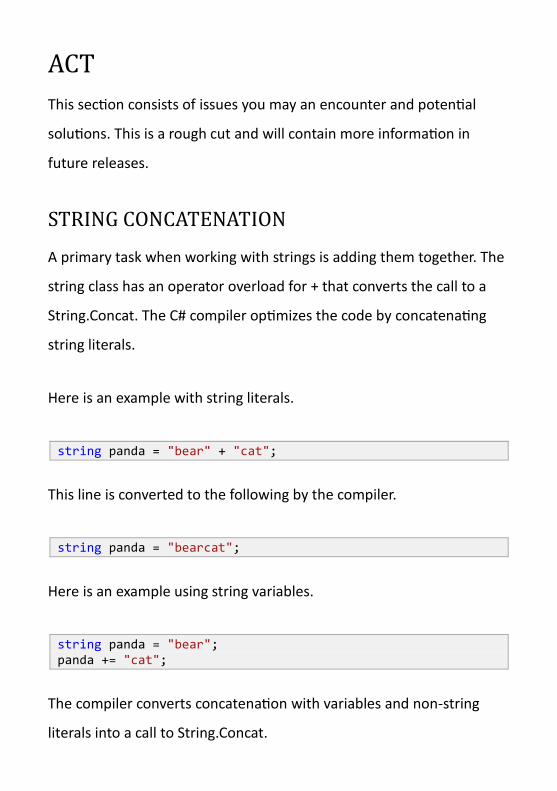
STRING CONCATENATION
A primary task when working with strings is adding them together. The
string class has an operator overload for + that converts the call to a
String.Concat. The C# compiler optimizes the code by concatenating
string literals.
Here is an example with string literals.
string panda = "bear" + "cat";
This line is converted to the following by the compiler.
string panda = "bearcat";
Here is an example using string variables.
string panda = "bear"; panda += "cat";
The compiler converts concatenation with variables and non-string
literals into a call to String.Concat.
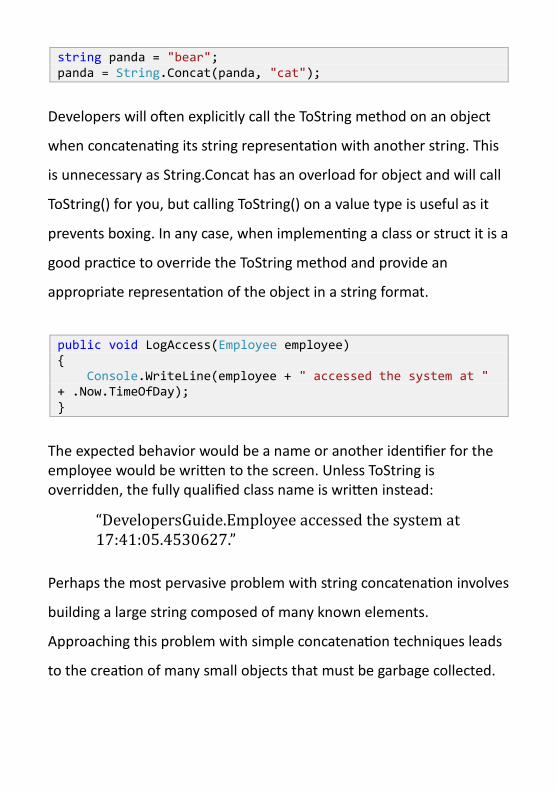
string panda = "bear"; panda = String.Concat(panda, "cat");
Developers will often explicitly call the ToString method on an object
when concatenating its string representation with another string. This
is unnecessary as String.Concat has an overload for object and will call
ToString() for you, but calling ToString() on a value type is useful as it
prevents boxing. In any case, when implementing a class or struct it is a
good practice to override the ToString method and provide an
appropriate representation of the object in a string format.
public void LogAccess(Employee employee) { Console.WriteLine(employee + " accessed the system at " + .Now.TimeOfDay); }
The expected behavior would be a name or another identifier for the employee would be written to the screen. Unless ToString is overridden, the fully qualified class name is written instead:
“DevelopersGuide.Employee accessed the system at 17:41:05.4530627.”
Perhaps the most pervasive problem with string concatenation involves
building a large string composed of many known elements.
Approaching this problem with simple concatenation techniques leads
to the creation of many small objects that must be garbage collected.
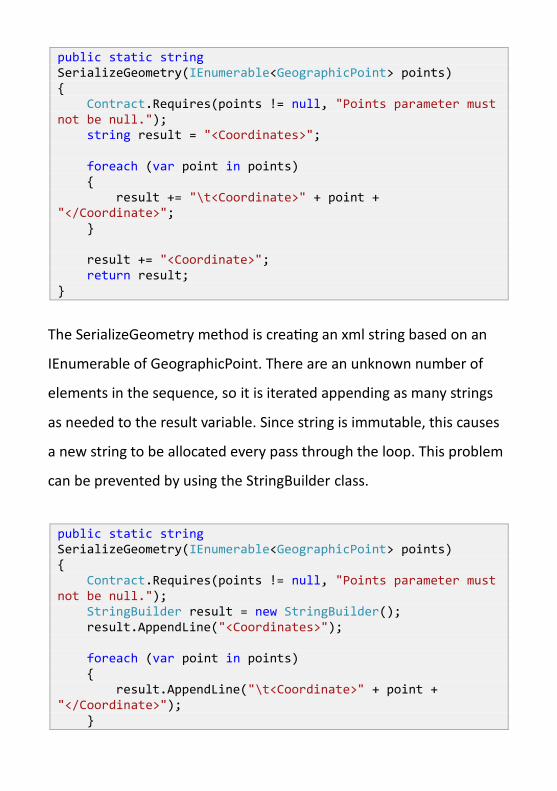
public static string SerializeGeometry(IEnumerable<GeographicPoint> points) { Contract.Requires(points != null, "Points parameter must not be null."); string result = "<Coordinates>"; foreach (var point in points) { result += "\t<Coordinate>" + point + "</Coordinate>"; } result += "<Coordinate>"; return result; }
The SerializeGeometry method is creating an xml string based on an
IEnumerable of GeographicPoint. There are an unknown number of
elements in the sequence, so it is iterated appending as many strings
as needed to the result variable. Since string is immutable, this causes
a new string to be allocated every pass through the loop. This problem
can be prevented by using the StringBuilder class.
public static string SerializeGeometry(IEnumerable<GeographicPoint> points) { Contract.Requires(points != null, "Points parameter must not be null."); StringBuilder result = new StringBuilder(); result.AppendLine("<Coordinates>"); foreach (var point in points) { result.AppendLine("\t<Coordinate>" + point + "</Coordinate>"); }
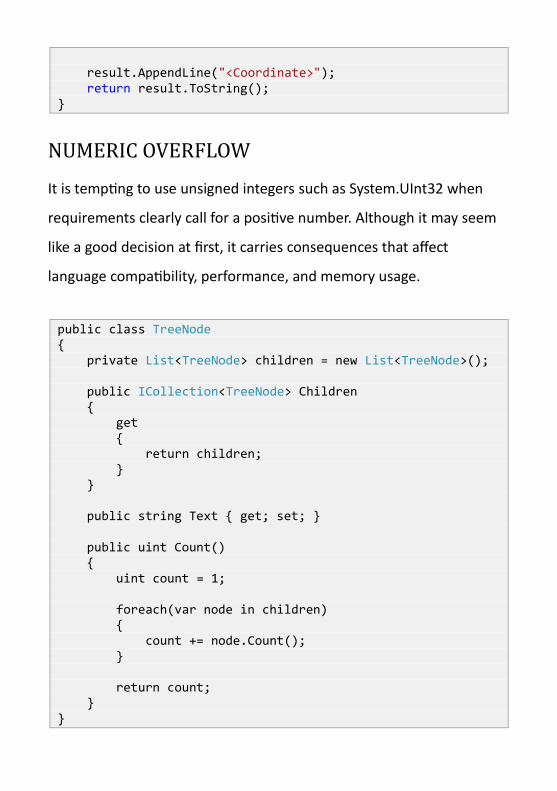
result.AppendLine("<Coordinate>"); return result.ToString(); }
NUMERIC OVERFLOW
It is tempting to use unsigned integers such as System.UInt32 when
requirements clearly call for a positive number. Although it may seem
like a good decision at first, it carries consequences that affect
language compatibility, performance, and memory usage.
public class TreeNode { private List<TreeNode> children = new List<TreeNode>(); public ICollection<TreeNode> Children { get { return children; } } public string Text { get; set; } public uint Count() { uint count = 1; foreach(var node in children) { count += node.Count(); } return count; } }
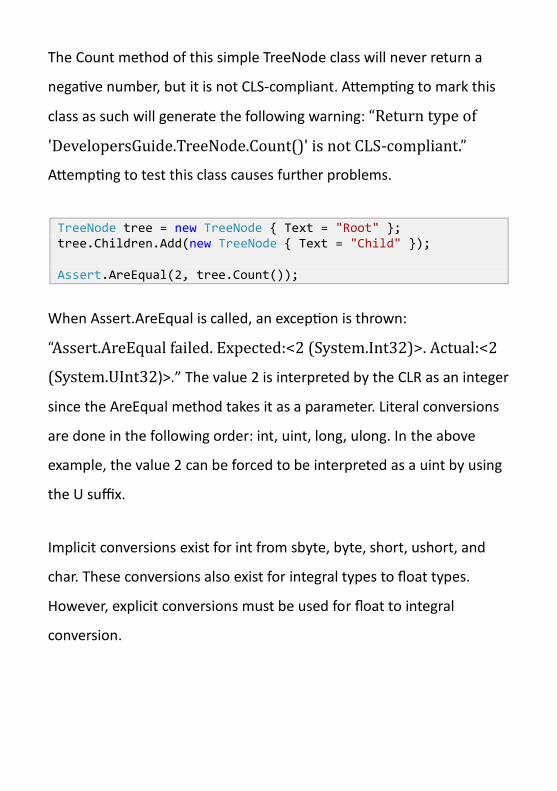
The Count method of this simple TreeNode class will never return a
negative number, but it is not CLS-compliant. Attempting to mark this
class as such will generate the following warning: “Return type of
'DevelopersGuide.TreeNode.Count()' is not CLS-compliant.”
Attempting to test this class causes further problems.
TreeNode tree = new TreeNode { Text = "Root" }; tree.Children.Add(new TreeNode { Text = "Child" }); Assert.AreEqual(2, tree.Count());
When Assert.AreEqual is called, an exception is thrown:
“Assert.AreEqual failed. Expected:<2 (System.Int32)>. Actual:<2
(System.UInt32)>.” The value 2 is interpreted by the CLR as an integer
since the AreEqual method takes it as a parameter. Literal conversions
are done in the following order: int, uint, long, ulong. In the above
example, the value 2 can be forced to be interpreted as a uint by using
the U suffix.
Implicit conversions exist for int from sbyte, byte, short, ushort, and
char. These conversions also exist for integral types to float types.
However, explicit conversions must be used for float to integral
conversion.
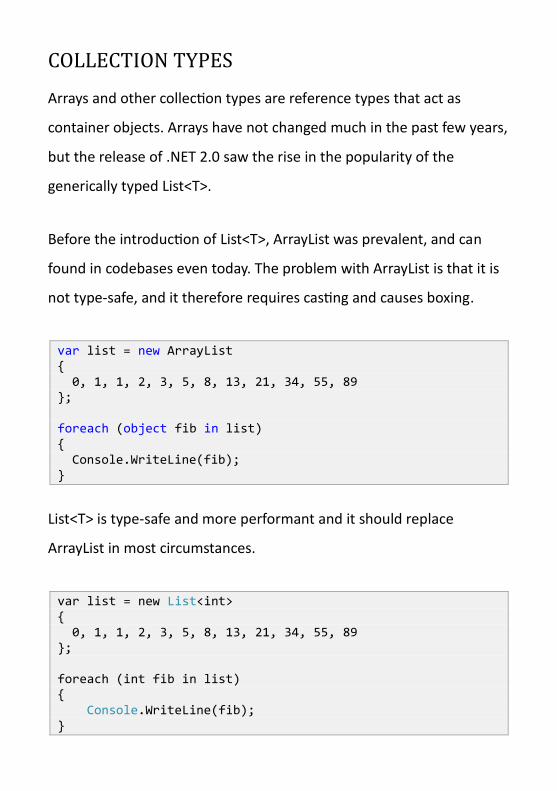
COLLECTION TYPES
Arrays and other collection types are reference types that act as
container objects. Arrays have not changed much in the past few years,
but the release of .NET 2.0 saw the rise in the popularity of the
generically typed List<T>.
Before the introduction of List<T>, ArrayList was prevalent, and can
found in codebases even today. The problem with ArrayList is that it is
not type-safe, and it therefore requires casting and causes boxing.
var list = new ArrayList { 0, 1, 1, 2, 3, 5, 8, 13, 21, 34, 55, 89 }; foreach (object fib in list) { Console.WriteLine(fib); }
List<T> is type-safe and more performant and it should replace
ArrayList in most circumstances.
var list = new List<int> { 0, 1, 1, 2, 3, 5, 8, 13, 21, 34, 55, 89 }; foreach (int fib in list) { Console.WriteLine(fib); }
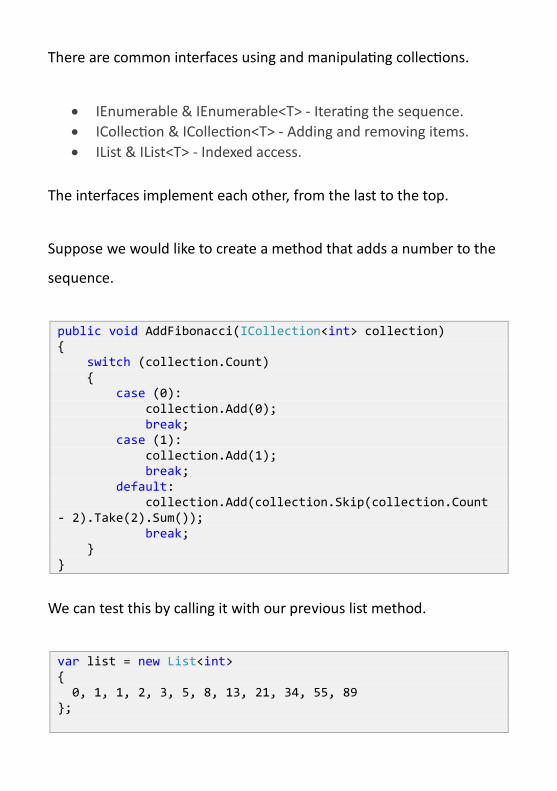
There are common interfaces using and manipulating collections.
IEnumerable & IEnumerable<T> - Iterating the sequence.
ICollection & ICollection<T> - Adding and removing items.
IList & IList<T> - Indexed access.
The interfaces implement each other, from the last to the top.
Suppose we would like to create a method that adds a number to the
sequence.
public void AddFibonacci(ICollection<int> collection) { switch (collection.Count) { case (0): collection.Add(0); break; case (1): collection.Add(1); break; default: collection.Add(collection.Skip(collection.Count - 2).Take(2).Sum()); break; } }
We can test this by calling it with our previous list method.
var list = new List<int> { 0, 1, 1, 2, 3, 5, 8, 13, 21, 34, 55, 89 };
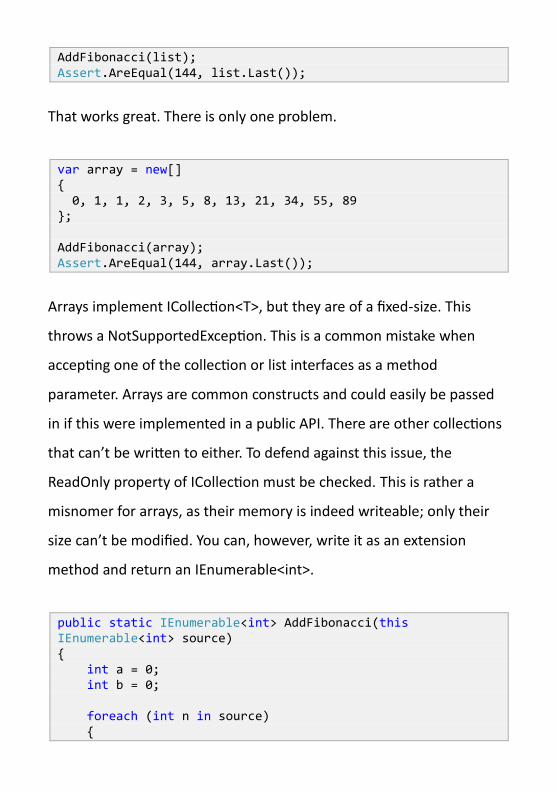
AddFibonacci(list); Assert.AreEqual(144, list.Last());
That works great. There is only one problem.
var array = new[] { 0, 1, 1, 2, 3, 5, 8, 13, 21, 34, 55, 89 }; AddFibonacci(array); Assert.AreEqual(144, array.Last());
Arrays implement ICollection<T>, but they are of a fixed-size. This
throws a NotSupportedException. This is a common mistake when
accepting one of the collection or list interfaces as a method
parameter. Arrays are common constructs and could easily be passed
in if this were implemented in a public API. There are other collections
that can’t be written to either. To defend against this issue, the
ReadOnly property of ICollection must be checked. This is rather a
misnomer for arrays, as their memory is indeed writeable; only their
size can’t be modified. You can, however, write it as an extension
method and return an IEnumerable<int>.
public static IEnumerable<int> AddFibonacci(this IEnumerable<int> source) { int a = 0; int b = 0; foreach (int n in source) {
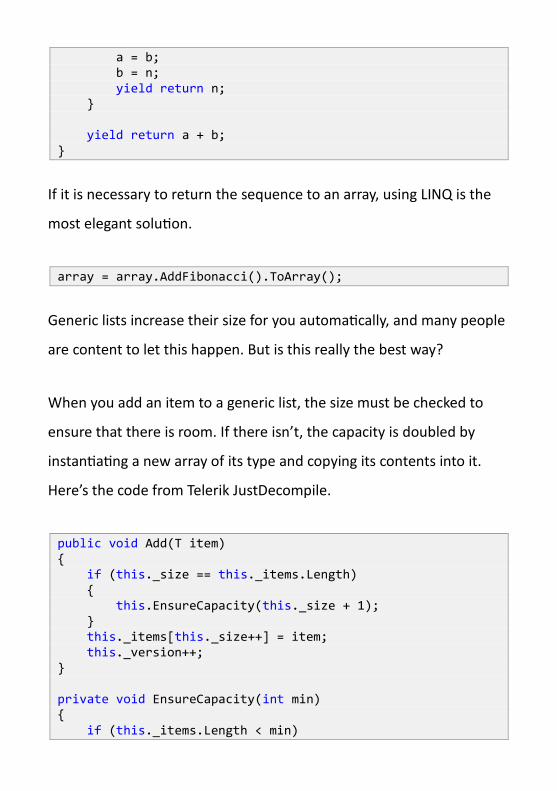
a = b; b = n; yield return n; } yield return a + b; }
If it is necessary to return the sequence to an array, using LINQ is the
most elegant solution.
array = array.AddFibonacci().ToArray();
Generic lists increase their size for you automatically, and many people
are content to let this happen. But is this really the best way?
When you add an item to a generic list, the size must be checked to
ensure that there is room. If there isn’t, the capacity is doubled by
instantiating a new array of its type and copying its contents into it.
Here’s the code from Telerik JustDecompile.
public void Add(T item) { if (this._size == this._items.Length) { this.EnsureCapacity(this._size + 1); } this._items[this._size++] = item; this._version++; } private void EnsureCapacity(int min) { if (this._items.Length < min)
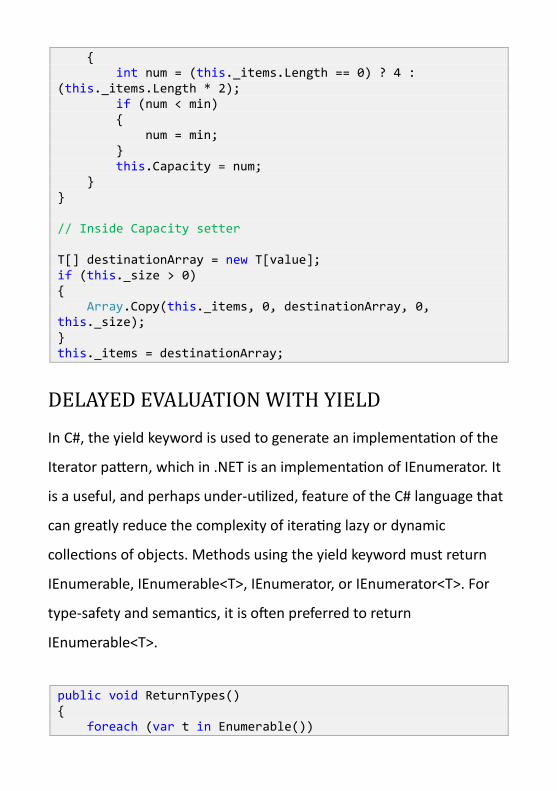
{ int num = (this._items.Length == 0) ? 4 : (this._items.Length * 2); if (num < min) { num = min; } this.Capacity = num; } } // Inside Capacity setter T[] destinationArray = new T[value]; if (this._size > 0) { Array.Copy(this._items, 0, destinationArray, 0, this._size); } this._items = destinationArray;
DELAYED EVALUATION WITH YIELD
In C#, the yield keyword is used to generate an implementation of the
Iterator pattern, which in .NET is an implementation of IEnumerator. It
is a useful, and perhaps under-utilized, feature of the C# language that
can greatly reduce the complexity of iterating lazy or dynamic
collections of objects. Methods using the yield keyword must return
IEnumerable, IEnumerable<T>, IEnumerator, or IEnumerator<T>. For
type-safety and semantics, it is often preferred to return
IEnumerable<T>.
public void ReturnTypes() { foreach (var t in Enumerable())
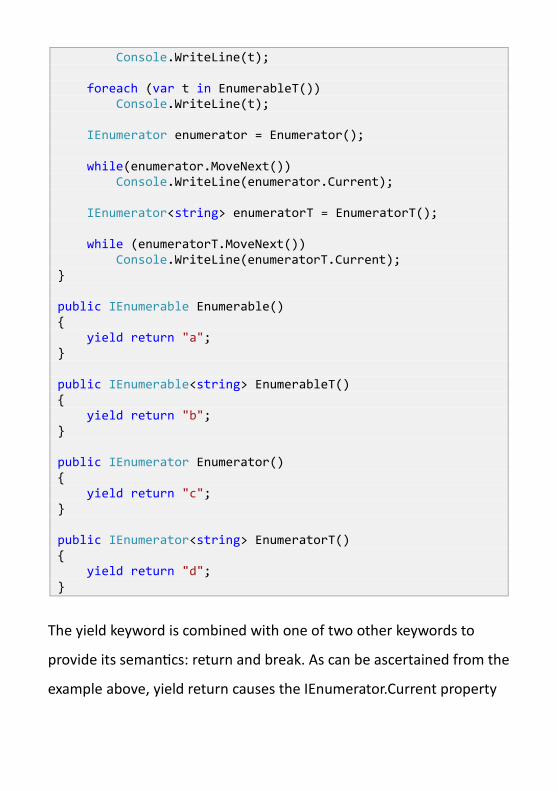
Console.WriteLine(t); foreach (var t in EnumerableT()) Console.WriteLine(t); IEnumerator enumerator = Enumerator(); while(enumerator.MoveNext()) Console.WriteLine(enumerator.Current); IEnumerator<string> enumeratorT = EnumeratorT(); while (enumeratorT.MoveNext()) Console.WriteLine(enumeratorT.Current); } public IEnumerable Enumerable() { yield return "a"; } public IEnumerable<string> EnumerableT() { yield return "b"; } public IEnumerator Enumerator() { yield return "c"; } public IEnumerator<string> EnumeratorT() { yield return "d"; }
The yield keyword is combined with one of two other keywords to
provide its semantics: return and break. As can be ascertained from the
example above, yield return causes the IEnumerator.Current property
to change. The example did not show yield break, but it causes control
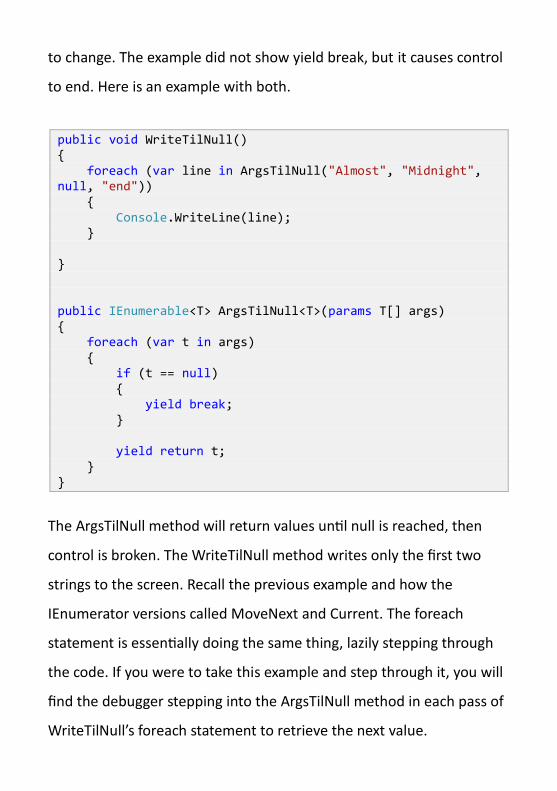
to end. Here is an example with both.
public void WriteTilNull() { foreach (var line in ArgsTilNull("Almost", "Midnight", null, "end")) { Console.WriteLine(line); } } public IEnumerable<T> ArgsTilNull<T>(params T[] args) { foreach (var t in args) { if (t == null) { yield break; } yield return t; } }
The ArgsTilNull method will return values until null is reached, then
control is broken. The WriteTilNull method writes only the first two
strings to the screen. Recall the previous example and how the
IEnumerator versions called MoveNext and Current. The foreach
statement is essentially doing the same thing, lazily stepping through
the code. If you were to take this example and step through it, you will
find the debugger stepping into the ArgsTilNull method in each pass of
WriteTilNull’s foreach statement to retrieve the next value.
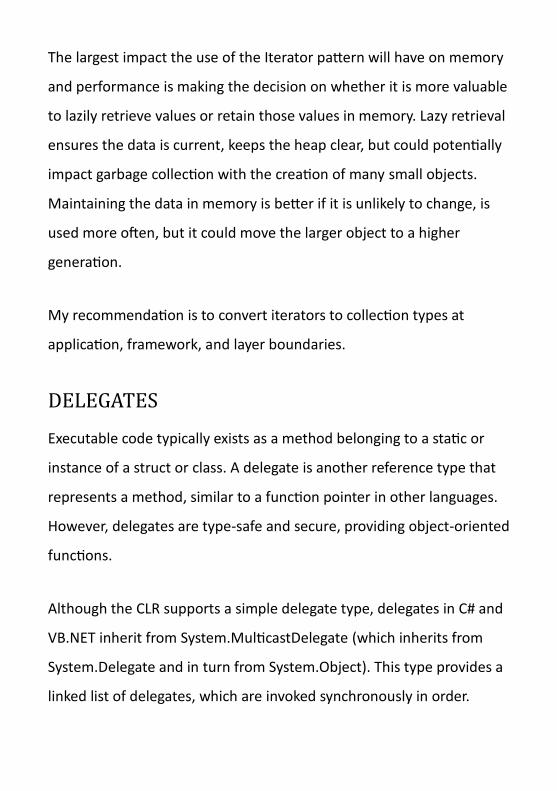
The largest impact the use of the Iterator pattern will have on memory
and performance is making the decision on whether it is more valuable
to lazily retrieve values or retain those values in memory. Lazy retrieval
ensures the data is current, keeps the heap clear, but could potentially
impact garbage collection with the creation of many small objects.
Maintaining the data in memory is better if it is unlikely to change, is
used more often, but it could move the larger object to a higher
generation.
My recommendation is to convert iterators to collection types at
application, framework, and layer boundaries.
DELEGATES
Executable code typically exists as a method belonging to a static or
instance of a struct or class. A delegate is another reference type that
represents a method, similar to a function pointer in other languages.
However, delegates are type-safe and secure, providing object-oriented
functions.
Although the CLR supports a simple delegate type, delegates in C# and
VB.NET inherit from System.MulticastDelegate (which inherits from
System.Delegate and in turn from System.Object). This type provides a
linked list of delegates, which are invoked synchronously in order.
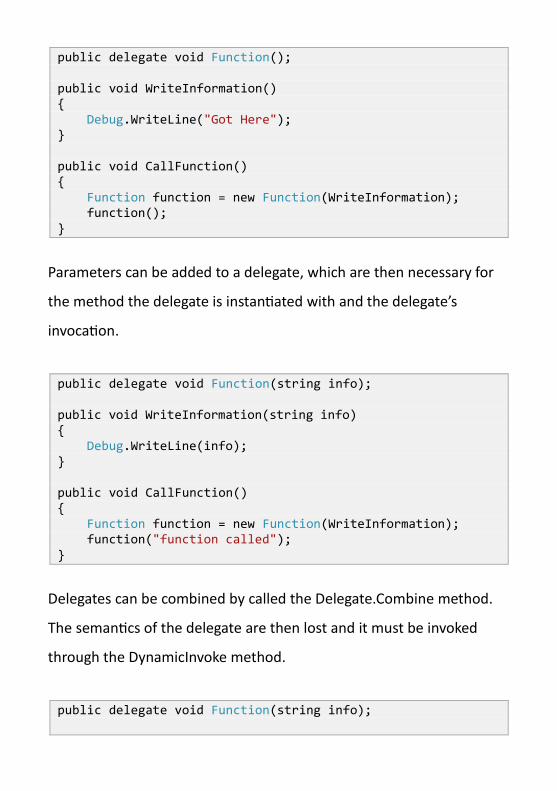
public delegate void Function(); public void WriteInformation() { Debug.WriteLine("Got Here"); } public void CallFunction() { Function function = new Function(WriteInformation); function(); }
Parameters can be added to a delegate, which are then necessary for
the method the delegate is instantiated with and the delegate’s
invocation.
public delegate void Function(string info); public void WriteInformation(string info) { Debug.WriteLine(info); } public void CallFunction() { Function function = new Function(WriteInformation); function("function called"); }
Delegates can be combined by called the Delegate.Combine method.
The semantics of the delegate are then lost and it must be invoked
through the DynamicInvoke method.
public delegate void Function(string info);
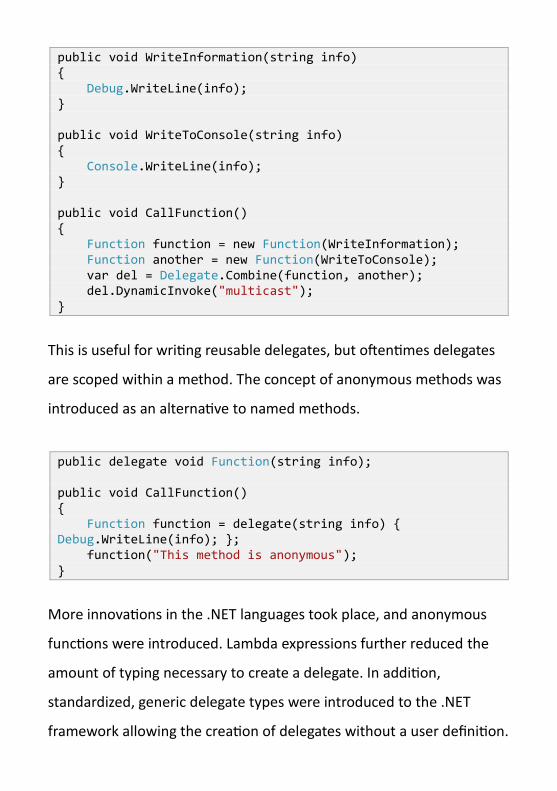
public void WriteInformation(string info) { Debug.WriteLine(info); } public void WriteToConsole(string info) { Console.WriteLine(info); } public void CallFunction() { Function function = new Function(WriteInformation); Function another = new Function(WriteToConsole); var del = Delegate.Combine(function, another); del.DynamicInvoke("multicast"); }
This is useful for writing reusable delegates, but oftentimes delegates
are scoped within a method. The concept of anonymous methods was
introduced as an alternative to named methods.
public delegate void Function(string info); public void CallFunction() { Function function = delegate(string info) { Debug.WriteLine(info); }; function("This method is anonymous"); }
More innovations in the .NET languages took place, and anonymous
functions were introduced. Lambda expressions further reduced the
amount of typing necessary to create a delegate. In addition,
standardized, generic delegate types were introduced to the .NET
framework allowing the creation of delegates without a user definition.
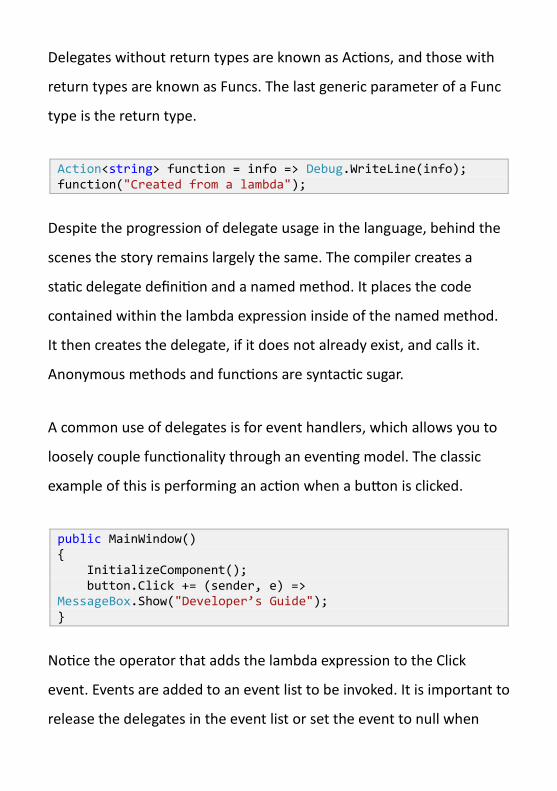
Delegates without return types are known as Actions, and those with
return types are known as Funcs. The last generic parameter of a Func
type is the return type.
Action<string> function = info => Debug.WriteLine(info); function("Created from a lambda");
Despite the progression of delegate usage in the language, behind the
scenes the story remains largely the same. The compiler creates a
static delegate definition and a named method. It places the code
contained within the lambda expression inside of the named method.
It then creates the delegate, if it does not already exist, and calls it.
Anonymous methods and functions are syntactic sugar.
A common use of delegates is for event handlers, which allows you to
loosely couple functionality through an eventing model. The classic
example of this is performing an action when a button is clicked.
public MainWindow() { InitializeComponent(); button.Click += (sender, e) => MessageBox.Show("Developer’s Guide"); }
Notice the operator that adds the lambda expression to the Click
event. Events are added to an event list to be invoked. It is important to
release the delegates in the event list or set the event to null when
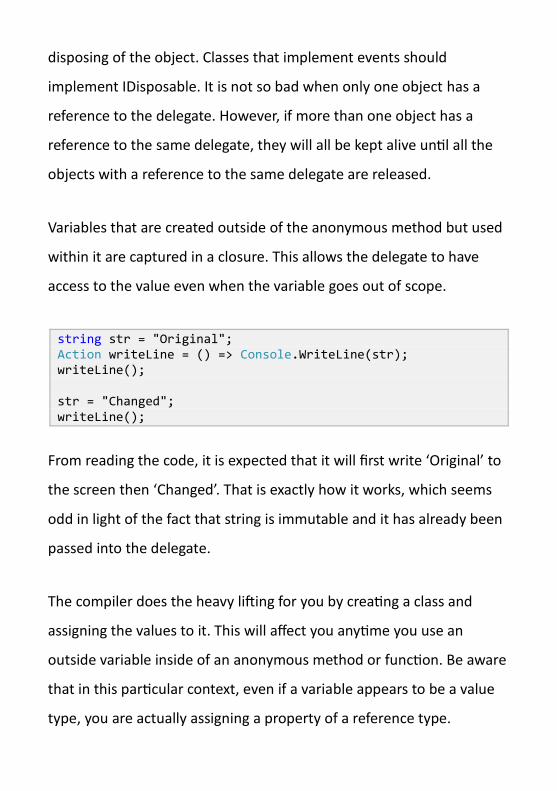
disposing of the object. Classes that implement events should
implement IDisposable. It is not so bad when only one object has a
reference to the delegate. However, if more than one object has a
reference to the same delegate, they will all be kept alive until all the
objects with a reference to the same delegate are released.
Variables that are created outside of the anonymous method but used
within it are captured in a closure. This allows the delegate to have
access to the value even when the variable goes out of scope.
string str = "Original"; Action writeLine = () => Console.WriteLine(str); writeLine(); str = "Changed"; writeLine();
From reading the code, it is expected that it will first write ‘Original’ to
the screen then ‘Changed’. That is exactly how it works, which seems
odd in light of the fact that string is immutable and it has already been
passed into the delegate.
The compiler does the heavy lifting for you by creating a class and
assigning the values to it. This will affect you anytime you use an
outside variable inside of an anonymous method or function. Be aware
that in this particular context, even if a variable appears to be a value
type, you are actually assigning a property of a reference type.
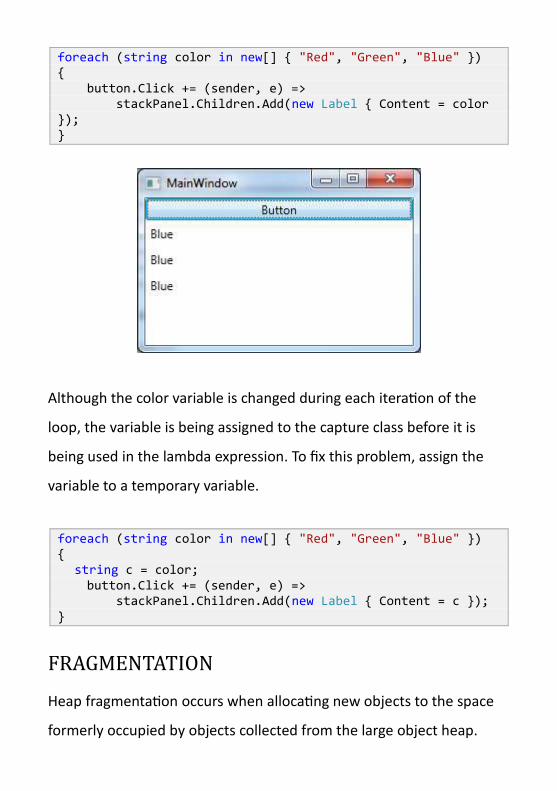
foreach (string color in new[] { "Red", "Green", "Blue" }) { button.Click += (sender, e) => stackPanel.Children.Add(new Label { Content = color }); }
Although the color variable is changed during each iteration of the
loop, the variable is being assigned to the capture class before it is
being used in the lambda expression. To fix this problem, assign the
variable to a temporary variable.
foreach (string color in new[] { "Red", "Green", "Blue" }) { string c = color; button.Click += (sender, e) => stackPanel.Children.Add(new Label { Content = c }); }
FRAGMENTATION
Heap fragmentation occurs when allocating new objects to the space
formerly occupied by objects collected from the large object heap.
Memory containing pinned objected is not compacted, leaving behind
gaps. In long running applications with large objects, this can result in
out of memory exceptions despite the availability of memory. There
just is not a large enough block of memory for an object to fit in. This is
typically a generation 2 problem, and you can detect it by comparing
free blocks of memory versus the total size of memory.
Some fragmentation will occur in the life of an application. Avoid
pinning to avoid this problem. Pinning occurs when using fixed
variables or fixed size buffers to create a guaranteed location and size
for a variable. You can then pass these variables to an external,
unmanaged DLL.
EXCESSIVE WRITES
Writing to a memory address by modifying an old object flags a range
of memory as modified. The garbage collector then treats these
objects as roots to analyze when determining if any objects need to be
collected. This is efficient in many programs, as older objects are less
likely to be modified. However, writing to longer-lived, complex object
models can cause the garbage collector to analyze the entire object
graph, affecting performance.
EXCESSIVE REFERENCES
The garbage collector must analyze the entire graph to discover which
objects can be collected. Complex models tax the collector, affecting
performance. The solution is to use architectural designs that load
information as needed and release it when it is no longer necessary to
maintain the reference.
LONG LIVED OBJECTS
Only a full garbage collection will take care of an object that has made
it to Gen 2, and these objects can possibly consume memory long after
they are dead. Therefore, it is best to make sure that these object sizes
are kept to a minimum.
Inefficient code can make objects live longer than they should,
reaching Gen 2 and wasting memory unnecessarily. Avoid this by only
allocating objects you need and letting go of references when they are
no longer necessary: references on the stack cause rooted objects for
the garbage collector. I sometimes review code that has been rewritten
several times without attention to cleanup.
Keep your methods small, create objects as close as possible to when
you’re going to use them, and always remember to call Dispose() on
your disposable objects.
APPENDIX
TABLE OF FIGURES
PROFILING FLOWCHART .......................................................................................................8
JUSTTRACE START SCREEN ..................................................................................................13
APPLICATION TYPES ...........................................................................................................14
CALL TREE .......................................................................................................................16
MEMORY SNAPSHOT SUMMARY ..........................................................................................17
INDEX
boxing ............................................. 23
concatenation ................................. 18
event handler .................................. 33
heap fragmentation ........................ 35
Iterator pattern ............................... 27
MulticastDelegate ............................30
optimizing ..........................................6
StringBuilder ....................................20
tuning .................................................7
unsigned integers.............................21