
POLM2: Automatic Profiling for Object Lifetime-Aware ...pjpf/C119-POLM2... · Rodrigo Bruno, Paulo...
14
POLM2: Automatic Profiling for Object Lifetime-Aware Memory Management for HotSpot Big Data Applications Rodrigo Bruno, Paulo Ferreira INESC-ID / Instituto Superior Técnico, University of Lisbon [email protected],[email protected] Abstract Big Data applications suffer from unpredictable and unacceptably high pause times due to bad memory management (Garbage Col- lection, GC) decisions. This is a problem for all applications but it is even more important for applications with low pause time requirements such as credit-card fraud detection or targeted web- site advertisement systems, which can easily fail to comply with Service Level Agreements due to long GC cycles (during which the application is stopped). This problem has been previously identified and is related to Big Data applications keeping in memory (for a long period of time, from the GC’s perspective) massive amounts of data objects. Memory management approaches have been proposed to reduce the GC pause time by allocating objects with similar lifetimes close to each other. However, they either do not provide a general solution for all types of Big Data applications (thus only solving the problem for a specific set of applications), and/or require programmer effort and knowledge to change/annotate the application code. This paper proposes POLM2, a profiler that automatically: i) es- timates application allocation profiles based on execution records, and ii) instruments application bytecode to help the GC taking advantage of the profiling information. Thus, no programmer effort is required to change the source code to allocate objects according to their lifetimes. POLM2 is implemented for the OpenJDK HotSpot Java Virtual Machine 8 and uses NG2C, a recently proposed GC which supports multi-generational pretenuring. Results show that POLM2 is able to: i) achieve pauses as low as NG2C (which requires manual source code modification), and ii) significantly reduce appli- cation pauses by up to 80% when compared to G1 (default collector in OpenJDK). POLM2 does not negatively impact neither applica- tion throughput nor memory utilization. CCS Concepts • Software and its engineering → Allocation / deallocation strategies; Keywords Profiling, Bytecode, Generational Heap, Garbage Col- lection, CRIU ACM Reference format: Rodrigo Bruno, Paulo Ferreira. 2017. POLM2: Automatic Profiling for Object Lifetime-Aware Memory Management for HotSpot Big Data Applications. In Proceedings of Middleware ’17, Las Vegas, NV, USA, December 11–15, 2017, 14 pages. DOI: 10.1145/3135974.3135986 Permission to make digital or hard copies of all or part of this work for personal or classroom use is granted without fee provided that copies are not made or distributed for profit or commercial advantage and that copies bear this notice and the full citation on the first page. Copyrights for components of this work owned by others than ACM must be honored. Abstracting with credit is permitted. To copy otherwise, or republish, to post on servers or to redistribute to lists, requires prior specific permission and/or a fee. Request permissions from [email protected]. Middleware ’17, Las Vegas, NV, USA © 2017 ACM. 978-1-4503-4720-4/17/12. . . $15.00 DOI: 10.1145/3135974.3135986 1 Introduction Big Data applications suffer from unpredictable and unaccept- ably high pause times due to automatic memory management, i.e., Garbage Collection (GC). Therefore, applications such as credit- card fraud detection or targeted website advertisement systems, that rely on fast access to data stored/processed by underlying Big Data platforms (BGPLATs), such as graph-based computing or in-memory databases, can easily fail to comply with their target re- sponse time (usually specified in Service Level Agreements, SLAs). This problem is even more important if multiple platforms work together (for example in a stack of BGPLATs, one depending on the output of the other to produce output). In this scenario, the proba- bility of incurring into a long GC pause (and potentially failing an SLA) increases with the number of BGPLATs in the stack. High GC pauses in HotSpot applications is a well studied prob- lem [10, 20, 21]. Its root cause can be decomposed in two sub- problems: i) Big Data applications hold large volumes of data in memory (e.g., to provide fast access), and ii) data stays in memory for a long period of time (from the GC perspective), violating the widely accepted assumption that most objects die young and only a negligible amount of objects become old [31, 49]. Holding large amounts of middle to long-lived objects in memory leads to an extreme GC effort mainly due to en masse object promotion (i.e., copying objects into older generations) and compaction (compact- ing memory to reduce fragmentation). This results in long and frequent applications pauses (during which the GC is promoting or compacting objects) compromising applications’ SLAs. To solve this problem (reducing application pauses due to an extreme GC effort to promote objects and compact memory), previ- ous works propose the use of: i) off-heap memory 1 [37, 39, 42], ii) scope limited allocation regions [4, 9, 18, 19, 23–25, 28, 32, 42, 46], or iii) multiple generations [7, 10, 29, 38, 45]. While the use of off- heap memory can reduce some GC effort by reducing the number of objects managed by the GC, it has two main drawbacks: i) it forces the programmer to allocate and deallocate memory explic- itly (which is error prone), and ii) it does not completely solve the problem since objects describing data stored off-heap remain in the GC-managed heap (as shown in Bruno et al. [10]). Regarding scope- based allocation spaces (in which all objects allocated in a particular scope are deallocated at once, freeing the GC from handling those objects), this technique cannot be used for a wide spectrum of BG- PLATs, in particular storage oriented platforms, since data objects typically live across many scopes [10]. For example, if a storage oriented platform keeps an in-memory data structure (such as a data cache/table), objects placed in the data structure have a lifetime that is independent of the duration of the scope where the objects were created (typically these objects escape the scope where they 1 Off-heap is a way to allocate objects outside the scope of the automatic memory management system (i.e., Garbage Collector). While using off-heap memory, the programmer is responsible for collecting memory (by deallocating allocated objects). 147
Transcript of POLM2: Automatic Profiling for Object Lifetime-Aware ...pjpf/C119-POLM2... · Rodrigo Bruno, Paulo...
POLM2: Automatic Profiling for Object Lifetime-Aware MemoryManagement for HotSpot Big Data Applications
Rodrigo Bruno, Paulo Ferreira
INESC-ID / Instituto Superior Técnico, University of Lisbon
[email protected],[email protected]
AbstractBig Data applications suffer from unpredictable and unacceptably
high pause times due to bad memory management (Garbage Col-
lection, GC) decisions. This is a problem for all applications but
it is even more important for applications with low pause time
requirements such as credit-card fraud detection or targeted web-
site advertisement systems, which can easily fail to comply with
Service Level Agreements due to long GC cycles (during which the
application is stopped). This problem has been previously identified
and is related to Big Data applications keeping in memory (for a
long period of time, from the GC’s perspective) massive amounts
of data objects.
Memory management approaches have been proposed to reduce
the GC pause time by allocating objects with similar lifetimes close
to each other. However, they either do not provide a general solution
for all types of Big Data applications (thus only solving the problem
for a specific set of applications), and/or require programmer effort
and knowledge to change/annotate the application code.
This paper proposes POLM2, a profiler that automatically: i) es-
timates application allocation profiles based on execution records,
and ii) instruments application bytecode to help the GC taking
advantage of the profiling information. Thus, no programmer effort
is required to change the source code to allocate objects according
to their lifetimes. POLM2 is implemented for the OpenJDK HotSpot
Java Virtual Machine 8 and uses NG2C, a recently proposed GC
which supports multi-generational pretenuring. Results show that
POLM2 is able to: i) achieve pauses as low as NG2C (which requires
manual source code modification), and ii) significantly reduce appli-
cation pauses by up to 80% when compared to G1 (default collector
in OpenJDK). POLM2 does not negatively impact neither applica-
tion throughput nor memory utilization.
CCS Concepts • Software and its engineering→ Allocation/ deallocation strategies;
Keywords Profiling, Bytecode, Generational Heap, Garbage Col-
lection, CRIU
ACM Reference format:Rodrigo Bruno, Paulo Ferreira. 2017. POLM2: Automatic Profiling for Object
Lifetime-Aware Memory Management for HotSpot Big Data Applications.
In Proceedings of Middleware ’17, Las Vegas, NV, USA, December 11–15, 2017,14 pages.
DOI: 10.1145/3135974.3135986
Permission to make digital or hard copies of all or part of this work for personal or
classroom use is granted without fee provided that copies are not made or distributed
for profit or commercial advantage and that copies bear this notice and the full citation
on the first page. Copyrights for components of this work owned by others than ACM
must be honored. Abstracting with credit is permitted. To copy otherwise, or republish,
to post on servers or to redistribute to lists, requires prior specific permission and/or
a fee. Request permissions from [email protected].
Middleware ’17, Las Vegas, NV, USA© 2017 ACM. 978-1-4503-4720-4/17/12. . . $15.00
DOI: 10.1145/3135974.3135986
1 IntroductionBig Data applications suffer from unpredictable and unaccept-
ably high pause times due to automatic memory management,
i.e., Garbage Collection (GC). Therefore, applications such as credit-
card fraud detection or targeted website advertisement systems,
that rely on fast access to data stored/processed by underlying
Big Data platforms (BGPLATs), such as graph-based computing or
in-memory databases, can easily fail to comply with their target re-
sponse time (usually specified in Service Level Agreements, SLAs).
This problem is even more important if multiple platforms work
together (for example in a stack of BGPLATs, one depending on the
output of the other to produce output). In this scenario, the proba-
bility of incurring into a long GC pause (and potentially failing an
SLA) increases with the number of BGPLATs in the stack.
High GC pauses in HotSpot applications is a well studied prob-
lem [10, 20, 21]. Its root cause can be decomposed in two sub-
problems: i) Big Data applications hold large volumes of data in
memory (e.g., to provide fast access), and ii) data stays in memory
for a long period of time (from the GC perspective), violating the
widely accepted assumption that most objects die young and only
a negligible amount of objects become old [31, 49]. Holding large
amounts of middle to long-lived objects in memory leads to an
extreme GC effort mainly due to en masse object promotion (i.e.,
copying objects into older generations) and compaction (compact-
ing memory to reduce fragmentation). This results in long and
frequent applications pauses (during which the GC is promoting or
compacting objects) compromising applications’ SLAs.
To solve this problem (reducing application pauses due to an
extreme GC effort to promote objects and compact memory), previ-
ous works propose the use of: i) off-heap memory1[37, 39, 42], ii)
scope limited allocation regions [4, 9, 18, 19, 23–25, 28, 32, 42, 46],
or iii) multiple generations [7, 10, 29, 38, 45]. While the use of off-
heap memory can reduce some GC effort by reducing the number
of objects managed by the GC, it has two main drawbacks: i) it
forces the programmer to allocate and deallocate memory explic-
itly (which is error prone), and ii) it does not completely solve the
problem since objects describing data stored off-heap remain in the
GC-managed heap (as shown in Bruno et al. [10]). Regarding scope-
based allocation spaces (in which all objects allocated in a particular
scope are deallocated at once, freeing the GC from handling those
objects), this technique cannot be used for a wide spectrum of BG-
PLATs, in particular storage oriented platforms, since data objects
typically live across many scopes [10]. For example, if a storage
oriented platform keeps an in-memory data structure (such as a
data cache/table), objects placed in the data structure have a lifetime
that is independent of the duration of the scope where the objects
were created (typically these objects escape the scope where they
1Off-heap is a way to allocate objects outside the scope of the automatic memory
management system (i.e., Garbage Collector). While using off-heap memory, the
programmer is responsible for collecting memory (by deallocating allocated objects).
147
Middleware ’17, December 11–15, 2017, Las Vegas, NV, USA Rodrigo Bruno, Paulo Ferreira
were created). Finally, using multiple generations can effectively
reduce the GC effort by organizing the heap accordingly [10], i.e.,
each generation containing objects with similar lifetimes (more
details in Section 2). However, this solution has two drawbacks: i)
programmers’ knowledge and effort is required to change/anno-
tate the application code in order to tell the GC which objects live
longer than others (this can be a long and difficult task that needs
to be redone every time the application code is updated), and ii)
it requires code access, which can be non trivial if the code to be
changed/annotated is located in third-party libraries (or inside the
Java Development Kit).
This paper proposes a solution (POLM2) for the above mentioned
problems. POLM2 is: i) an off-line profiler that automatically gathers
application allocation profiling information, and ii) an application
bytecode instrumenter that instruments the application to take
advantage of the profiling information to help the GC taking better
decisions. POLM2 strives to reduce HotSpot applications’ pause
time (due to GC en masse object promotion and compaction) with-
out requiring any programmers’ effort, and for any type of Big Data
applications. In addition, no source code access is required in order
for POLM2 to work. POLM2 must reduce application pause times
while not degrading other performance metrics such as throughput
and memory usage.
Automatically adapting memory management decisions for a
particular application is non-trivial, and two challenges can be eas-
ily identified. First, one must extract and analyze an application
allocation profile, i.e., identify which data objects are being held in
memory for a long time (thus putting extra effort on the GC), and
where they are allocated. This is a hard task since it is difficult to
efficiently record each object allocation and also be able to identify
when each object dies (i.e., it is no longer reachable). Second, one
must process all the gathered information and instrument the ap-
plication in order to improve memory management decisions (to
take into consideration its allocation profile).
POLM2 builds upon NG2C [10], a GC algorithm which, with the
help of the programmer, allocates objects with similar lifetimes close
to each other (in the same generation to be more specific), leading
to much reduced GC effort and, consequently, reduced application
pauses. To free the programmer from having to change/annotate
the application code, POLM2 automatically instruments application
bytecode based on off-line profiling information.
The proposed solution includes four components: i) a Recorderthat records object allocations and informs the Heap Dumper (de-
scribed next) when it should create a new heap snapshot; ii) a
Dumper that creates heap snapshots (containing all living objects);
iii) an Analyzer, a component that processes both allocation records
and heap dumps to estimate object lifetimes per allocation site,
producing an allocation profile for the application/workload; iv)
an Instrumenter, a component that, taking as input the application
allocation profile, instruments the application bytecode (at load
time) in order to give the GC (i.e., NG2C) the necessary information
to allocate application objects in specific generations (according to
their lifetime), thus reducing GC effort to manage them (resulting
in shorter application pauses).
Using POLM2 is divided in two phases: i) profiling, and ii) produc-
tion. During the profiling phase, the goal is to learn the application
allocation profile. For this purpose, the Recorder, Dumper, and the
Analyzer are necessary to record allocations, dump heap objects,
and analyze all this information. The output of the profiling phase is
an application allocation profile that is the input for the production
phase. In the production phase, the Instrumenter rewrites applica-tion bytecode (at load time) in order to make memory management
lifetime-aware, leading to reduced application pause times.
In short, POLM2 makes Big Data applications to better use the
underlying GC, with shorter pauses, without imposing any effort on
the programmer. The profiller is instrumental to attain the overall
goal.
POLM2 is implemented for the OpenJDK 8 HotSpot JVM and
uses NG2C, a recently proposed GC for HotSpot that supports
multi-generational pretenuring (i.e., allocating an object in any
generation). Java Agents (a Java Agent is a pluggable component
that runs attached to the JVM) are used to implement the Recorderand the Instrumenter, that changes the bytecode at load time, either
to record allocations (Recorder) or to use NG2C’s API (Instrumenter).The Dumper is built on top of CRIU, a Checkpoint-Restore tool for
Linux. Using CRIU, it is possible to efficiently create incremental
JVM heap snapshots.
Evaluation results are very encouraging as POLM2 can provide
application pause times very similar to the ones achieved using
NG2C (which requires developers’ effort). In addition, POLM2 sig-
nificantly reduces application pause timeswhen compared toGarbage
First (G1) [16], the new by-default GC for OpenJDK HotSpot JVM.
POLM22represents an important contribution as it provides
a way to automatically perform object lifetime-aware memory
management. Thus, POLM2 solves the two main problems of NG2C:
i) requiring developer’s effort and knowledge, and ii) requiring
source code access. This system and its usefulness are demonstrated
through thorough evaluation experiments using real BGPLATs:
Apache Cassandra [35], GraphChi [34], and Apache Lucene [40].
The paper is organized as follows. Section 2 gives a concise
background, introducing important concepts in which POLM2 is
built upon. Section 3 presents POLM2 by discussing its architec-
ture, used algorithms, and how to use it. Sections 4 and 5 contain
a short description of the implementation details and the evalua-
tion experiments (respectively). The paper closes with a study of
the state-of-the-art and with some conclusions and future work
directions.
2 BackgroundThis section provides the necessary background to understand the
motivation, goal, and design decisions in POLM2. The section starts
with some background on generational GC, explaining its key in-
sights and why most implementations, available in industrial JVMs,
are not suited for low-latency BGPLATs. Then, we describe NG2C,
a recently proposed pretenuring multi-generational collector.
2.1 Generational Garbage CollectionNowadays, generational GC is a widely used solution [30]. It is
based on the observation that objects have different lifetimes and
that, in order to optimize the collection process, objects with shorter
lifetimes should be collected more frequently than middle to long-
lived objects (simply because the short lived objects die first when
compared to middle and long-lived objects). To take advantage
of this observation, generational collectors divide the heap (mem-
ory space where application objects live) into generations, from
youngest to oldest. Most generational collectors allocate all objects
2POLM2’s code is available at github.com/rodrigo-bruno/polm2.
148
Automatic Profiling for Object Lifetime-Aware Memory Management Middleware ’17, December 11–15, 2017, Las Vegas, NV, USA
in the youngest generation and, as objects survive collections, sur-
vivor objects are copied to older generations, which are collected
less frequently.
Most popular JVMs, and specifically the most recent HotSpot
collector, Garbage First (G1) [16], also takes advantage of the weak
generational hypothesis [49] that, as previously mentioned, states
that most objects die young. By relying on this hypothesis, G1
divides heaps in two generations, young (where all objects are
allocated in) and old (where all objects that survive a configurable
number of collections are promoted/copied to).
While this solution works well for applications that follow the
weak generational hypothesis, it raises some problems to applica-
tions that handle many middle to long-lived objects. These objects
(which do not die young) will be promoted and compacted through
time until they become unreachable (i.e., garbage). In the case of
BGPLATs that hold massive amounts of middle to long-lived objects
in memory, the cost of promoting and compacting these objects be-
comes prohibitive, leading to long and frequent application pauses.
In sum, all generational collectors either assume or estimate the
lifetime of an object. Most common collectors simply assume that
most objects will die young, and pay the price of promoting and
compacting survivor objects. As discussed next, some collectors, in
particular NG2C, require application-level knowledge to decide in
which generation to allocate an object. By allocating objects directly
into a specific generation (and not assuming that all objects die
young), NG2C is able to greatly reduce the amount of promotion and
compaction effort, reducing the number and duration of application
pauses.
2.2 NG2C - Pretenuring GC with Dynamic GenerationsNG2C [10] extends 2-generational collectors (which only contain
two generations: young and old) into N generations (an arbitrary
number dynamically changed at runtime). In addition, it allows
objects to be pretenured into any of the N generations, i.e., objects
can be allocated directly into any generation.
To decide where to allocate objects, NG2C relies mostly on pro-
grammer knowledge and effort to change application code. By de-
fault, i.e., with no code modification, all objects are allocated in the
youngest generation (young generation). In order to allocate objects
in older generations, NG2C provides a special code annotation @Genand three JVM calls: System.newGeneration, System.getGenera-tion, and System.setGeneration. The annotation must be used
to annotate allocation sites that allocate objects that should be allo-
cated in a old generation. To control in which generation objects
are allocated into, NG2C uses the concept of target generation, a
thread-local variable that indicates where objects annotated with
@Gen should be allocated in. To change a thread’s target generation,System.setGeneration must be used. Finally, it is also possible
to create an arbitrary number of generations at runtime by calling
System.newGeneration.As presented by the authors of NG2C, pretenuring objects with
similar lifetimes into the same generation leads to significant re-
duction in the number of object promotions and less compaction
cost, leading to reduced application pauses times. However, in or-
der to present good results, NG2C relies on source code changes
that require programmer’s effort and knowledge to correctly un-
derstand how the code must be changed. In addition, it is very
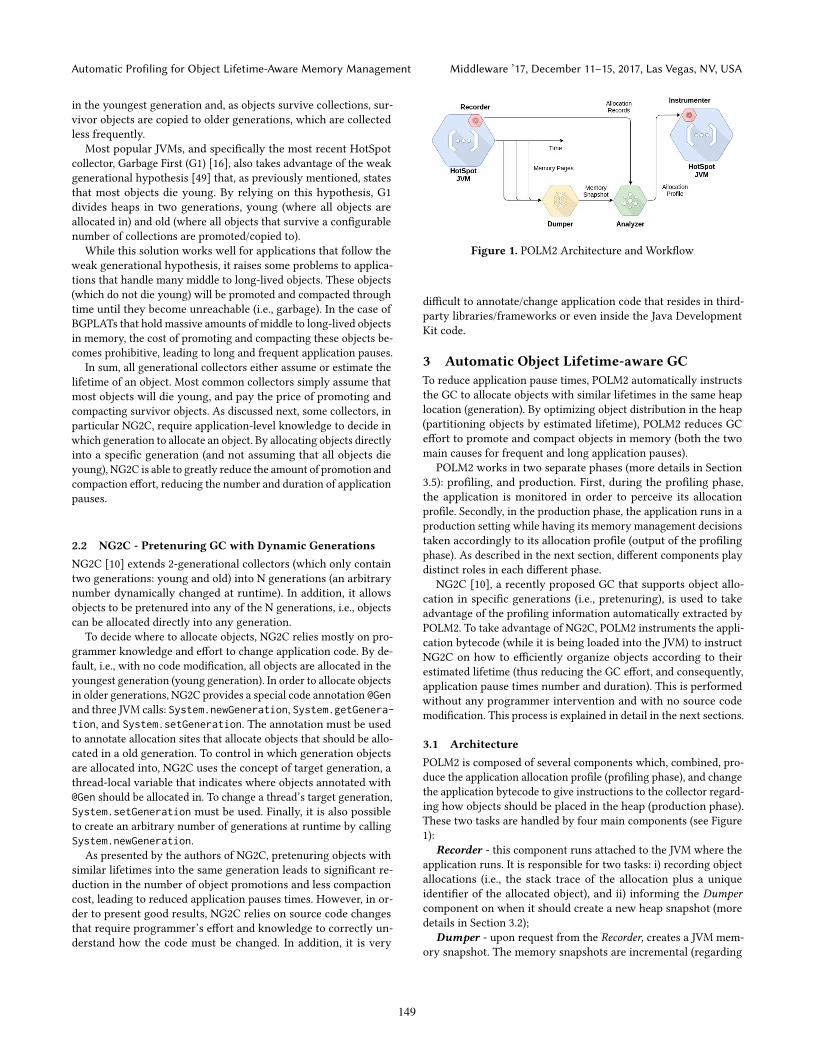
Figure 1. POLM2 Architecture and Workflow
difficult to annotate/change application code that resides in third-
party libraries/frameworks or even inside the Java Development
Kit code.
3 Automatic Object Lifetime-aware GCTo reduce application pause times, POLM2 automatically instructs
the GC to allocate objects with similar lifetimes in the same heap
location (generation). By optimizing object distribution in the heap
(partitioning objects by estimated lifetime), POLM2 reduces GC
effort to promote and compact objects in memory (both the two
main causes for frequent and long application pauses).
POLM2 works in two separate phases (more details in Section
3.5): profiling, and production. First, during the profiling phase,
the application is monitored in order to perceive its allocation
profile. Secondly, in the production phase, the application runs in a
production setting while having its memory management decisions
taken accordingly to its allocation profile (output of the profiling
phase). As described in the next section, different components play
distinct roles in each different phase.
NG2C [10], a recently proposed GC that supports object allo-
cation in specific generations (i.e., pretenuring), is used to take
advantage of the profiling information automatically extracted by
POLM2. To take advantage of NG2C, POLM2 instruments the appli-
cation bytecode (while it is being loaded into the JVM) to instruct
NG2C on how to efficiently organize objects according to their
estimated lifetime (thus reducing the GC effort, and consequently,
application pause times number and duration). This is performed
without any programmer intervention and with no source code
modification. This process is explained in detail in the next sections.
3.1 ArchitecturePOLM2 is composed of several components which, combined, pro-
duce the application allocation profile (profiling phase), and change
the application bytecode to give instructions to the collector regard-
ing how objects should be placed in the heap (production phase).
These two tasks are handled by four main components (see Figure
1):
Recorder - this component runs attached to the JVM where the
application runs. It is responsible for two tasks: i) recording object
allocations (i.e., the stack trace of the allocation plus a unique
identifier of the allocated object), and ii) informing the Dumpercomponent on when it should create a new heap snapshot (more
details in Section 3.2);
Dumper - upon request from the Recorder, creates a JVM mem-
ory snapshot. The memory snapshots are incremental (regarding
149
Middleware ’17, December 11–15, 2017, Las Vegas, NV, USA Rodrigo Bruno, Paulo Ferreira
the previous one) and do not include unreachable objects (more
details in Section 3.2);
Analyzer - this component takes as input: i) the allocation
records created by the Recorder (that states which objects were
allocated and where) and, ii) the memory snapshots created by
the Dumper. By analyzing a sequence of memory snapshots, the
Analyzer is able to detect when objects start and stop being in-
cluded in the snapshot, meaning that it is possible to perceive the
lifetime of every application object. By combining this information
with the allocation records, it is possible to estimate the lifetime
distribution for each allocation site (more details in Section 3.3).
This information composes the application allocation profile;
Instrumenter - taking as input the application allocation profileproduced by the Analyzer, this component instruments (rewrites)
the application bytecode while it is being loaded into the JVM.
Based on the allocation profile, the Instrumenter instructs the GCon how to improve the distribution of objects in the heap (more
details in Section 3.4);
3.2 Object Lifetime RecordingTo record object lifetimes, two pieces of information are required.
First, all object allocations must be recorded, i.e., for each object
allocation, both a unique object identifier and the stack trace of
the corresponding allocation site must be included in the alloca-
tion record. Second, information regarding how long each allocated
object lives is gathered through periodic memory snapshots, that in-
clude all live objects; thus, for each memory snapshot, it is possible
to determine which objects are still reachable or not. By combining
these two sources of information (where objects are allocated, and
how long they live), POLM2 is able to estimate, for each alloca-
tion site, the lifetime distribution of objects allocated through that
allocation site. This information is then used to instruct NG2C.
Allocation records are created by the Recorder, a component that
runs attached to the JVM. The Recorder has twomain purposes. First,
it instruments application bytecode (during application bytecode
loading) to add calls to the Recorder logging methods. This ensures
that whenever an application thread allocates an object, that thread
will immediately (after allocating the object) call the Recorder codeto log the allocation. Upon each allocation log call, the Recorderrecords the current stack trace plus the id of the object that is being
allocated (more details on how the id is obtained in Section 4).
To avoid extreme memory and CPU overhead, the Recorder onlykeeps in memory a table with all the stack traces that have been
used for allocations (i.e., allocation sites) and continuously writes
(to disk) the ids of the allocated objects (using a separate stream
for each allocation site). Allocation stack traces are only flushed to
disk at the end of the application execution (in the profiling phase).
This ensures that POLM2 writes each allocation stack trace once to
disk.
Apart from logging allocations, the Recorder is also responsible
for periodically requesting new memory snapshots (by calling the
Dumper component). By default (this is configurable), the Recorderasks for a new memory snapshot at the end of every GC cycle.
In other words, after each heap collection (which collects all un-
reachable objects), a new memory snapshot is created. In order to
optimize this process of creating a memory snapshot (which can
take a long time for large heaps and, since collections can occur
very frequently), POLM2 offers two optimizations:
• the snapshot includes memory that contains only reachable
data. To accomplish this optimization, the NG2C collector
is modified to include an additional method call (accessible
to the Recorder) that marks (more details in Section 4) all
heap memory pages which contain no reachable objects (i.e.,
unused heap memory). Thus, before calling the Dumperfor creating a new memory snapshot, the Recorder calls
NG2C to mark all unused pages. Upon snapshot creation,
the Dumper is able to detect which pages are marked or not,
and simply avoids marked pages;
• only memory modified since the last snapshot is included
in the current one. Every time the Dumper creates a newmemory snapshot, all memory pages that were part of the
previous one, are marked clean (more details in Section
4). During application execution, changed memory pages
are automatically marked dirty. Upon a new snapshot, the
Dumper is able to create an incremental snapshot that con-
tains only the pages dirtied since the last snapshot. This
results in much smaller snapshots (containing only modified
memory pages) that are much faster to create.
Using these two optimizations, the time required to take a JVM
memory snapshot is greatly reduced (evidence of this performance
optimization is shown in Section 5). Thus, by reducing the time
required to take a memory snapshot, POLM2 reduces the negative
impact on application profiling (more details in Section 3.5).
3.3 Estimating Object Lifetime Per Allocation SiteAfter profiling an application for some time, the Analyzer can be
started, taking as input: i) allocation records that include, per al-
location site, the corresponding stack traces and allocated object
ids (provided by the Recorder), and ii) memory snapshots (created
by the Dumper). Using this information, it is possible to obtain an
object lifetime distribution for each allocation site, which enables
the Analyzer to estimate the optimal generation to allocate objects
per allocation site.
In order to determine the optimal generation for each allocation
site, the Analyzer implements an algorithm with the following
steps:
• load allocation stack traces and, for each one, associate a
sequence of buckets/sets (each one representing a genera-
tion);
• load allocated object ids and insert them into the first bucket
(generation zero) associated to the corresponding stack trace
(where the object was allocated);
• load JVM memory snapshots (sorted by time of creation)
and, for each reachable object included in the snapshot,
move the object id into the next bucket.
After these steps, it is possible to know, for each stack trace, how
many objects survived up to N collections (representing the number
of created memory snapshots). With this information, it is possible
to obtain the number of collections that most objects allocated in a
particular stack trace survive, which is a good estimation for the
optimal generation to use for objects allocated in the allocation site.
However, one problem remains: it is possible to have two stack
traces, with different estimated generations, sharing the same al-
location site. For example, if two different code locations use the
same sequence of method calls to allocate objects with very dif-
ferent lifetimes, both stack traces will share the final stack trace
150
Automatic Profiling for Object Lifetime-Aware Memory Management Middleware ’17, December 11–15, 2017, Las Vegas, NV, USA
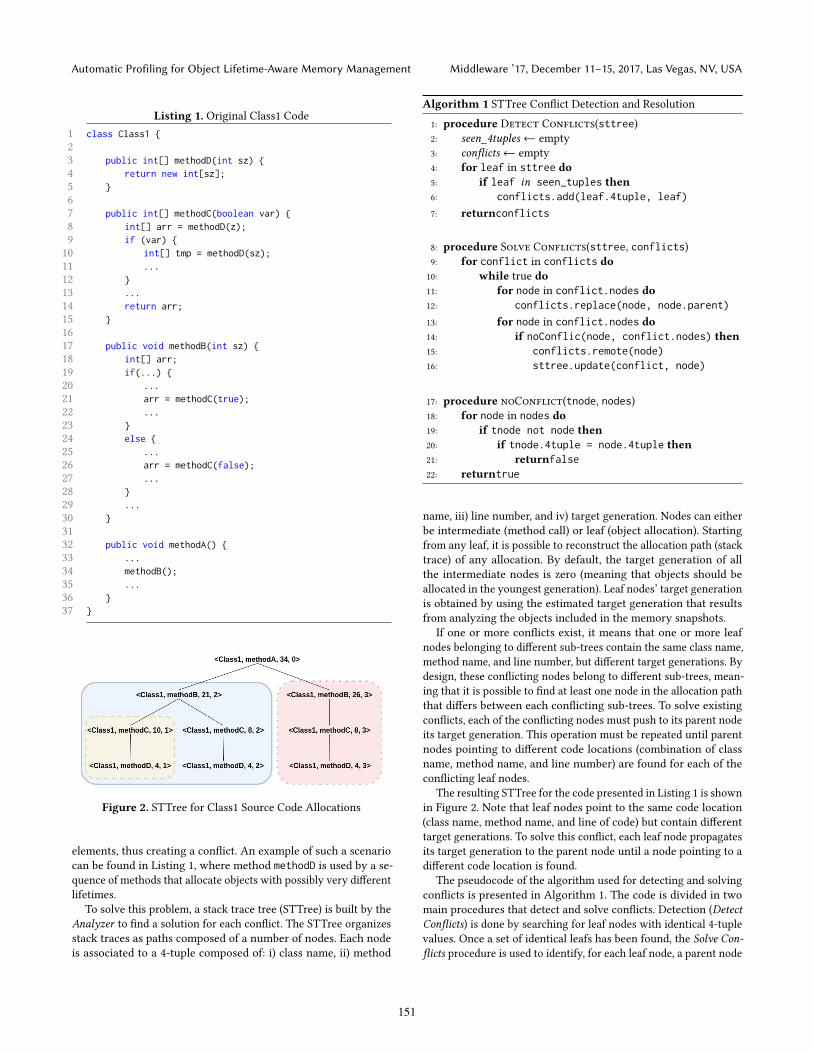
Listing 1. Original Class1 Code1 class Class1 {2
3 public int[] methodD(int sz) {4 return new int[sz];5 }6
7 public int[] methodC(boolean var) {8 int[] arr = methodD(z);9 if (var) {10 int[] tmp = methodD(sz);11 ...12 }13 ...14 return arr;15 }16
17 public void methodB(int sz) {18 int[] arr;19 if(...) {20 ...21 arr = methodC(true);22 ...23 }24 else {25 ...26 arr = methodC(false);27 ...28 }29 ...30 }31
32 public void methodA() {33 ...34 methodB();35 ...36 }37 }
Figure 2. STTree for Class1 Source Code Allocations
elements, thus creating a conflict. An example of such a scenario
can be found in Listing 1, where method methodD is used by a se-
quence of methods that allocate objects with possibly very different
lifetimes.
To solve this problem, a stack trace tree (STTree) is built by the
Analyzer to find a solution for each conflict. The STTree organizes
stack traces as paths composed of a number of nodes. Each node
is associated to a 4-tuple composed of: i) class name, ii) method
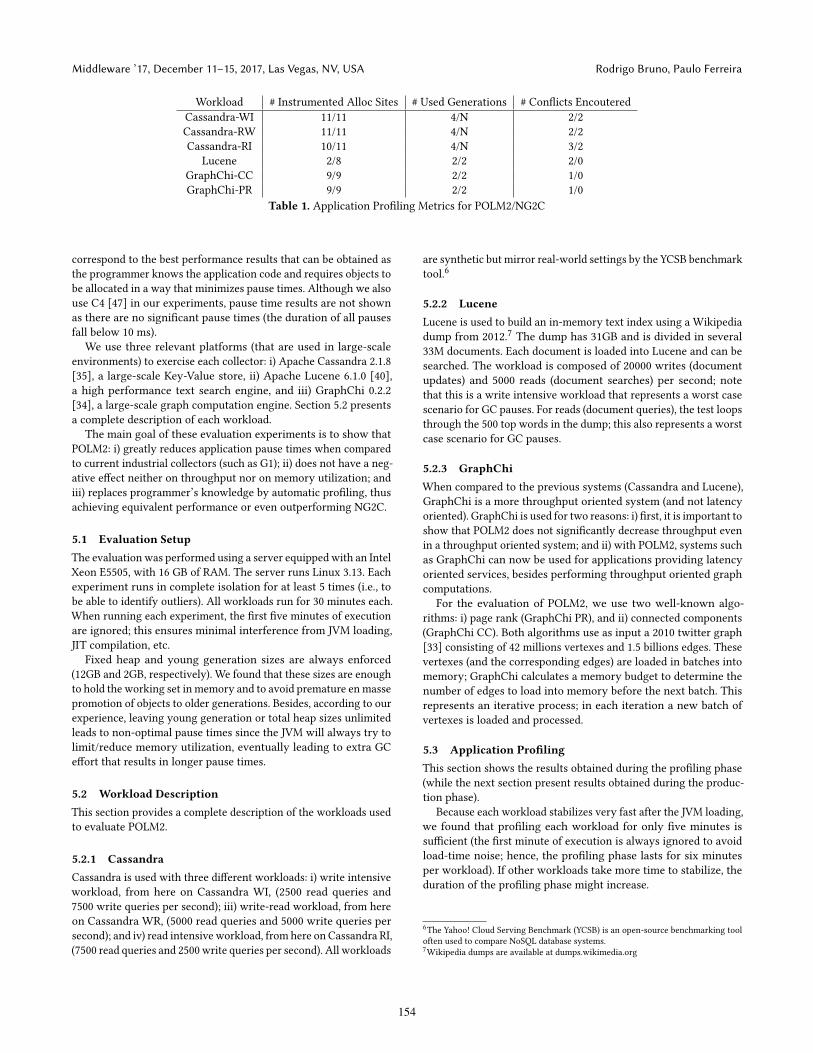
Algorithm 1 STTree Conflict Detection and Resolution
1: procedure Detect Conflicts(sttree)2: seen_4tuples← empty
3: conflicts← empty
4: for leaf in sttree do5: if leaf in seen_tuples then6: conflicts.add(leaf.4tuple, leaf)
7: returnconflicts
8: procedure Solve Conflicts(sttree, conflicts)9: for conflict in conflicts do10: while true do11: for node in conflict.nodes do12: conflicts.replace(node, node.parent)
13: for node in conflict.nodes do14: if noConflic(node, conflict.nodes) then15: conflicts.remote(node)16: sttree.update(conflict, node)
17: procedure noConflict(tnode, nodes)18: for node in nodes do19: if tnode not node then20: if tnode.4tuple = node.4tuple then21: returnfalse22: returntrue
name, iii) line number, and iv) target generation. Nodes can either
be intermediate (method call) or leaf (object allocation). Starting
from any leaf, it is possible to reconstruct the allocation path (stack
trace) of any allocation. By default, the target generation of all
the intermediate nodes is zero (meaning that objects should be
allocated in the youngest generation). Leaf nodes’ target generation
is obtained by using the estimated target generation that results
from analyzing the objects included in the memory snapshots.
If one or more conflicts exist, it means that one or more leaf
nodes belonging to different sub-trees contain the same class name,
method name, and line number, but different target generations. By
design, these conflicting nodes belong to different sub-trees, mean-
ing that it is possible to find at least one node in the allocation path
that differs between each conflicting sub-trees. To solve existing
conflicts, each of the conflicting nodes must push to its parent node
its target generation. This operation must be repeated until parent
nodes pointing to different code locations (combination of class
name, method name, and line number) are found for each of the
conflicting leaf nodes.
The resulting STTree for the code presented in Listing 1 is shown
in Figure 2. Note that leaf nodes point to the same code location
(class name, method name, and line of code) but contain different
target generations. To solve this conflict, each leaf node propagates
its target generation to the parent node until a node pointing to a
different code location is found.
The pseudocode of the algorithm used for detecting and solving
conflicts is presented in Algorithm 1. The code is divided in two
main procedures that detect and solve conflicts. Detection (DetectConflicts) is done by searching for leaf nodes with identical 4-tuple
values. Once a set of identical leafs has been found, the Solve Con-flicts procedure is used to identify, for each leaf node, a parent node
151
Middleware ’17, December 11–15, 2017, Las Vegas, NV, USA Rodrigo Bruno, Paulo Ferreira
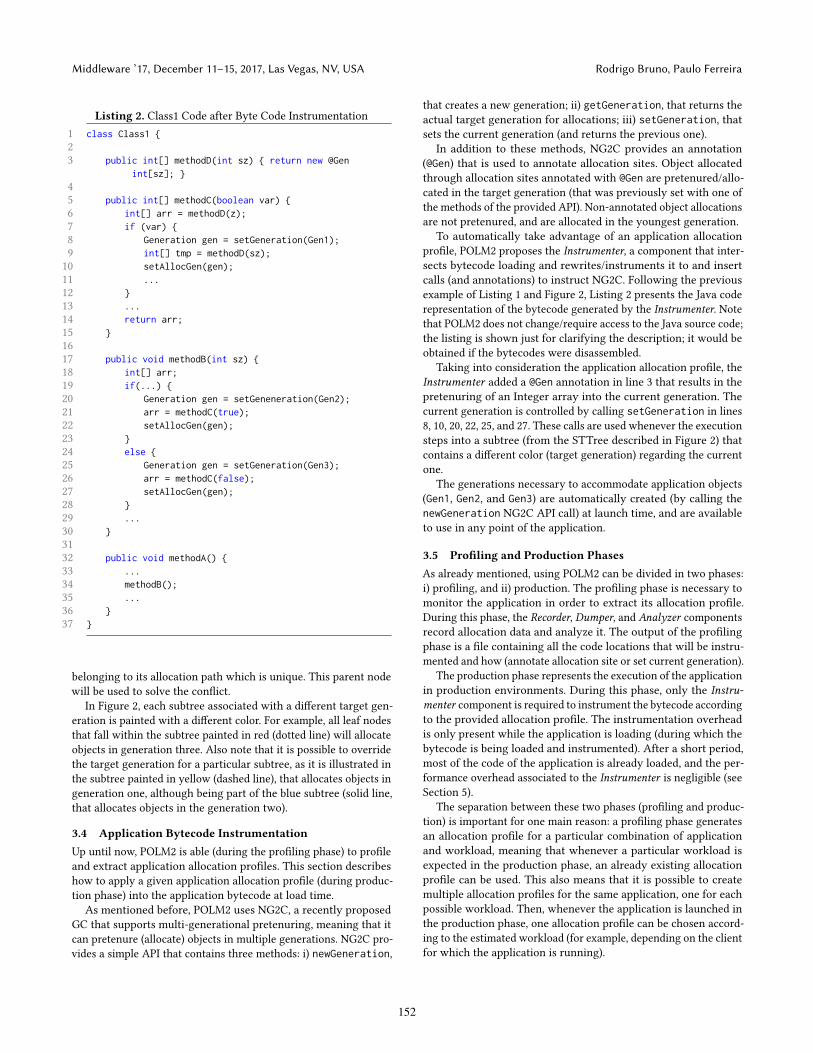
Listing 2. Class1 Code after Byte Code Instrumentation
1 class Class1 {2
3 public int[] methodD(int sz) { return new @Genint[sz]; }
4
5 public int[] methodC(boolean var) {6 int[] arr = methodD(z);7 if (var) {8 Generation gen = setGeneration(Gen1);9 int[] tmp = methodD(sz);10 setAllocGen(gen);11 ...12 }13 ...14 return arr;15 }16
17 public void methodB(int sz) {18 int[] arr;19 if(...) {20 Generation gen = setGeneneration(Gen2);21 arr = methodC(true);22 setAllocGen(gen);23 }24 else {25 Generation gen = setGeneration(Gen3);26 arr = methodC(false);27 setAllocGen(gen);28 }29 ...30 }31
32 public void methodA() {33 ...34 methodB();35 ...36 }37 }
belonging to its allocation path which is unique. This parent node
will be used to solve the conflict.
In Figure 2, each subtree associated with a different target gen-
eration is painted with a different color. For example, all leaf nodes
that fall within the subtree painted in red (dotted line) will allocate
objects in generation three. Also note that it is possible to override
the target generation for a particular subtree, as it is illustrated in
the subtree painted in yellow (dashed line), that allocates objects in
generation one, although being part of the blue subtree (solid line,
that allocates objects in the generation two).
3.4 Application Bytecode InstrumentationUp until now, POLM2 is able (during the profiling phase) to profile
and extract application allocation profiles. This section describes
how to apply a given application allocation profile (during produc-
tion phase) into the application bytecode at load time.
As mentioned before, POLM2 uses NG2C, a recently proposed
GC that supports multi-generational pretenuring, meaning that it
can pretenure (allocate) objects in multiple generations. NG2C pro-
vides a simple API that contains three methods: i) newGeneration,
that creates a new generation; ii) getGeneration, that returns theactual target generation for allocations; iii) setGeneration, thatsets the current generation (and returns the previous one).
In addition to these methods, NG2C provides an annotation
(@Gen) that is used to annotate allocation sites. Object allocated
through allocation sites annotated with @Gen are pretenured/allo-cated in the target generation (that was previously set with one of
the methods of the provided API). Non-annotated object allocations
are not pretenured, and are allocated in the youngest generation.
To automatically take advantage of an application allocation
profile, POLM2 proposes the Instrumenter, a component that inter-
sects bytecode loading and rewrites/instruments it to and insert
calls (and annotations) to instruct NG2C. Following the previous
example of Listing 1 and Figure 2, Listing 2 presents the Java code
representation of the bytecode generated by the Instrumenter. Notethat POLM2 does not change/require access to the Java source code;
the listing is shown just for clarifying the description; it would be
obtained if the bytecodes were disassembled.
Taking into consideration the application allocation profile, the
Instrumenter added a @Gen annotation in line 3 that results in the
pretenuring of an Integer array into the current generation. The
current generation is controlled by calling setGeneration in lines
8, 10, 20, 22, 25, and 27. These calls are used whenever the execution
steps into a subtree (from the STTree described in Figure 2) that
contains a different color (target generation) regarding the current
one.
The generations necessary to accommodate application objects
(Gen1, Gen2, and Gen3) are automatically created (by calling the
newGeneration NG2C API call) at launch time, and are available
to use in any point of the application.
3.5 Profiling and Production PhasesAs already mentioned, using POLM2 can be divided in two phases:
i) profiling, and ii) production. The profiling phase is necessary to
monitor the application in order to extract its allocation profile.
During this phase, the Recorder, Dumper, and Analyzer components
record allocation data and analyze it. The output of the profiling
phase is a file containing all the code locations that will be instru-
mented and how (annotate allocation site or set current generation).
The production phase represents the execution of the application
in production environments. During this phase, only the Instru-menter component is required to instrument the bytecode according
to the provided allocation profile. The instrumentation overhead
is only present while the application is loading (during which the
bytecode is being loaded and instrumented). After a short period,
most of the code of the application is already loaded, and the per-
formance overhead associated to the Instrumenter is negligible (seeSection 5).
The separation between these two phases (profiling and produc-
tion) is important for one main reason: a profiling phase generates
an allocation profile for a particular combination of application
and workload, meaning that whenever a particular workload is
expected in the production phase, an already existing allocation
profile can be used. This also means that it is possible to create
multiple allocation profiles for the same application, one for each
possible workload. Then, whenever the application is launched in
the production phase, one allocation profile can be chosen accord-
ing to the estimated workload (for example, depending on the client
for which the application is running).
152
Automatic Profiling for Object Lifetime-Aware Memory Management Middleware ’17, December 11–15, 2017, Las Vegas, NV, USA
4 ImplementationPOLM2 is composed of a collection of components that, as described
in Section 3, work towards the same goal. This section describes
some implementation techniques that are relevant for POLM2 being
efficiently implemented.
4.1 Java AgentsBoth the Recorder and Instrumenter are implemented as Java Agents.
These are pluggable components that run attached to the JVM.
Both agents (Recorder and Instrumenter) use ASM3, a Java bytecode
manipulation library, to rewrite bytecode at load time. The Recorderuses ASM to add callbacks to the recording code on every object
allocation while the Instrumenter uses NG2C API to direct object
allocations to different generations.
In addition to recording allocations, the Recorder also serves
a second purpose. It prepares the heap for a memory snapshot,
and signals the Dumper component for creating a new snapshot.
By default (this is configurable), upon each GC cycle finish, the
Recorder instructs the Dumper to create a new snapshot. However,
to avoid snapshotting memory pages that are not being used by
the application and therefore to reduce the size of the snapshot,
the Recorder traverses the Java heap and sets a special bit in the
kernel page table (from here on called no-need bit) for all pages
containing no live objects. This no-need bit that is set using the
madvise system call, is used by the Dumper to avoid pages with
the bit set (i.e., unnecessary pages) while creating the memory
snapshot.
4.2 Efficient JVM Snapshots with CRIUTo perform JVM snapshots, POLM2 uses CRIU
4. CRIU allows any
process to be checkpointed, i.e., all its resources (including its mem-
ory pages) are captured in a snapshot.
CRIU supports incremental checkpoints by relying on a kernel
memory page table dirty bit that indicates if a particular page was
dirtied or not, since the last snapshot. Upon each memory snapshot,
CRIU cleans the bit and therefore, when a new snapshot is requested
again, only pages with the dirty bit captured into the snapshot.
Finally, CRIU also ignores pages which are marked as not neces-
sary by checking the no-need bit in the page table of a particular
process. This no-need bit is set by the Recorder and is used to discardevery page that contains no live objects.
By combining CRIU with the Recorder, POLM2 is able to create
snapshots whose size (and consequently the time necessary to
create them) is greatly reduced when compared to a usual approach
using usual JVM tools such as jmap5 (see results in Section 5).
4.3 Finding Recorded Objects in JVM SnapshotsMatching the objects’ ids recorded by the Recorder with the ids of
the objects included in the JVM memory snapshot is also a non-
trivial implementation challenge. In particular, simply using the
jmap tool would not be possible because the ids of objects included
in the heap dumps produced by jmap change over time as they
are generated using their corresponding memory addresses. Since
an object might be moved (promoted or compacted), its id might
change, therefore breaking the goal of tracking the object until
3ASM is a bytecode manipulation library that is available at asm.ow2.org
4CRIU is a Checkpoint-Restore tool for Linux processes. It is available at criu.org.
5Java Memory Map, or jmap, is a tool for Java applications that can create application
heap dumps.
it becomes unreachable. Thus, in order to properly match the ids
provided by the Recorder and the Dumper, another solution is used.
The objects’ ids recorded by the Recorder are obtained by calling
the method System.identityHashCode for each recorded object.
Each id is generated by hashing the corresponding object and is
stored internally in the JVM in the object’s header. In order to
successfully match object ids included in the snapshot, the Analyzermust read each object header in order to extract the object id and
match it with the ids reported by the Recorder. Note, however, thatit is possible that many objects recorded by the Recorder did not
appear in the JVM snapshots since the Analyzer only traverses live
objects.
4.4 Reducing Changes Between GenerationsAs discussed in Section 3.4, for each STTree leaf node (object alloca-tion) that is not included in any conflict, there are two calls to the
NG2C API: one to change the target generation of the leaf node,
and one to go back to the previous target generation.
In order to reduce the overhead associated to calling NG2C
multiple times, POLM2 avoids many of these calls by pushing the
target generation to parent nodes in the hope that other leaf nodes
in the same subtree also share the same target generation. Thus,
if no conflicts are created, the target generation is set only when
the execution enters into a specific subtree, and all the leaf nodes
included in the subtree inherit the target generation; thus, there is
no need to call NG2C multiple times.
This optimization leads to a significant reduction in the number
of calls to NG2C, therefore reducing the overhead associated with
selecting the correct generation for object allocations.
4.5 Profiling Information for Generational GCsAs already mentioned, the overall goal of this work is to reduce Big
Data application pause times by performing lifetime-aware memory
management. To this end, POLM2 uses NG2C, a GC which exports
an API to specify where objects should be allocated, decision that
must take into consideration the expected lifetime of each object.
However, it is important to note that POLM2 is completely inde-
pendent of the GC that is being used. In other words, POLM2 can
be used with any generational GC that supports pretenuring. The
only code that would have to be changed is the GC-specific code in
the Instrumenter (that specifies in which generation objects should
be allocated in).
5 EvaluationThis section presents the results of several experiments regarding
the three most relevant metrics for POLM2: i) the size of JVM
snapshots, and the time to create them; ii) application pause times;
and iii) application throughput and memory usage.
Thus, for the first set of results, we compare the size and time
to create JVM snapshots with Dumper, and the widely used JVM
tool jmap. Then, application pause times obtained with POLM2 are
analyzed and compared to the pauses obtained with: i) NG2C with
manual code modifications, i.e. with programmers’ knowledge of
the application and the corresponding source code modifications
(to allocate objects with similar lifetimes close to each other), and
ii) G1, the default collector for recent OpenJDK versions that uses
no profiling information or programmers’ help to estimate objects
lifetime, and therefore simply assumes that most objects die young.
Note that the use of NG2C with manual code modifications should
153
Middleware ’17, December 11–15, 2017, Las Vegas, NV, USA Rodrigo Bruno, Paulo Ferreira
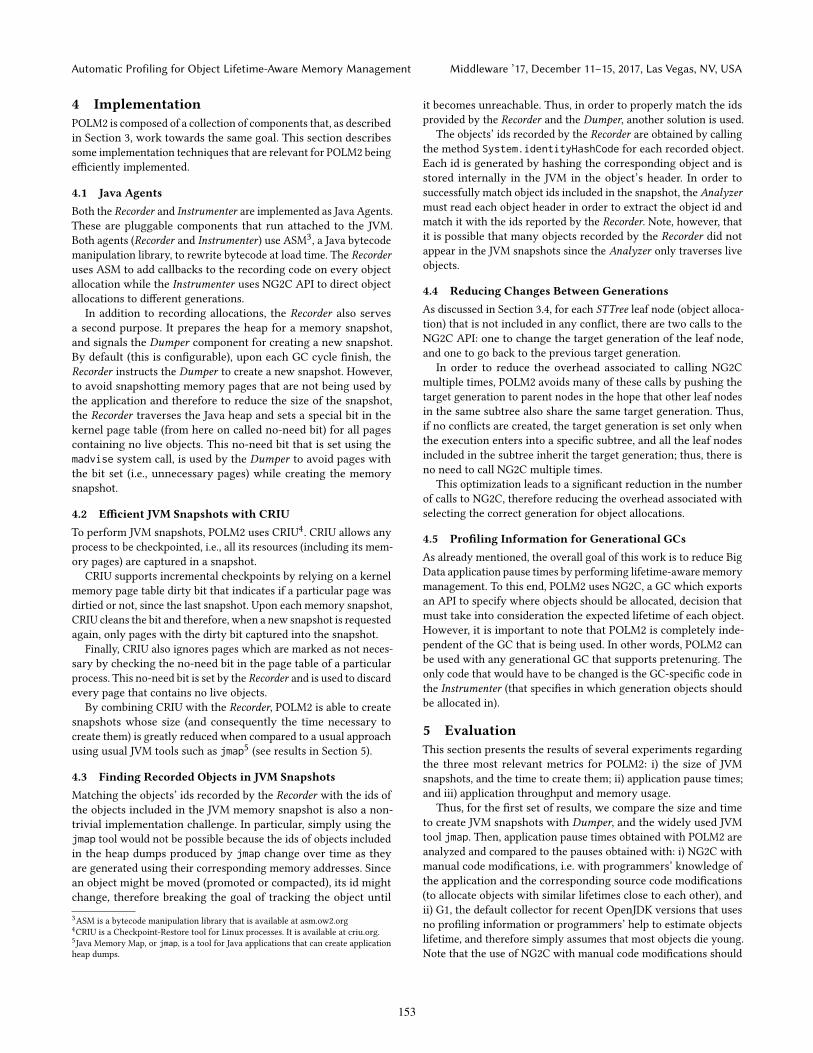
Workload # Instrumented Alloc Sites # Used Generations # Conflicts Encoutered
Cassandra-WI 11/11 4/N 2/2
Cassandra-RW 11/11 4/N 2/2
Cassandra-RI 10/11 4/N 3/2
Lucene 2/8 2/2 2/0
GraphChi-CC 9/9 2/2 1/0
GraphChi-PR 9/9 2/2 1/0
Table 1. Application Profiling Metrics for POLM2/NG2C
correspond to the best performance results that can be obtained as
the programmer knows the application code and requires objects to
be allocated in a way that minimizes pause times. Although we also
use C4 [47] in our experiments, pause time results are not shown
as there are no significant pause times (the duration of all pauses
fall below 10 ms).
We use three relevant platforms (that are used in large-scale
environments) to exercise each collector: i) Apache Cassandra 2.1.8
[35], a large-scale Key-Value store, ii) Apache Lucene 6.1.0 [40],
a high performance text search engine, and iii) GraphChi 0.2.2
[34], a large-scale graph computation engine. Section 5.2 presents
a complete description of each workload.
The main goal of these evaluation experiments is to show that
POLM2: i) greatly reduces application pause times when compared
to current industrial collectors (such as G1); ii) does not have a neg-
ative effect neither on throughput nor on memory utilization; and
iii) replaces programmer’s knowledge by automatic profiling, thus
achieving equivalent performance or even outperforming NG2C.
5.1 Evaluation SetupThe evaluation was performed using a server equipped with an Intel
Xeon E5505, with 16 GB of RAM. The server runs Linux 3.13. Each
experiment runs in complete isolation for at least 5 times (i.e., to
be able to identify outliers). All workloads run for 30 minutes each.
When running each experiment, the first five minutes of execution
are ignored; this ensures minimal interference from JVM loading,
JIT compilation, etc.
Fixed heap and young generation sizes are always enforced
(12GB and 2GB, respectively). We found that these sizes are enough
to hold the working set in memory and to avoid premature enmasse
promotion of objects to older generations. Besides, according to our
experience, leaving young generation or total heap sizes unlimited
leads to non-optimal pause times since the JVM will always try to
limit/reduce memory utilization, eventually leading to extra GC
effort that results in longer pause times.
5.2 Workload DescriptionThis section provides a complete description of the workloads used
to evaluate POLM2.
5.2.1 CassandraCassandra is used with three different workloads: i) write intensive
workload, from here on Cassandra WI, (2500 read queries and
7500 write queries per second); iii) write-read workload, from here
on Cassandra WR, (5000 read queries and 5000 write queries per
second); and iv) read intensive workload, from here on Cassandra RI,
(7500 read queries and 2500write queries per second). All workloads
are synthetic but mirror real-world settings by the YCSB benchmark
tool.6
5.2.2 LuceneLucene is used to build an in-memory text index using a Wikipedia
dump from 2012.7The dump has 31GB and is divided in several
33M documents. Each document is loaded into Lucene and can be
searched. The workload is composed of 20000 writes (document
updates) and 5000 reads (document searches) per second; note
that this is a write intensive workload that represents a worst case
scenario for GC pauses. For reads (document queries), the test loops
through the 500 top words in the dump; this also represents a worst
case scenario for GC pauses.
5.2.3 GraphChiWhen compared to the previous systems (Cassandra and Lucene),
GraphChi is a more throughput oriented system (and not latency
oriented). GraphChi is used for two reasons: i) first, it is important to
show that POLM2 does not significantly decrease throughput even
in a throughput oriented system; and ii) with POLM2, systems such
as GraphChi can now be used for applications providing latency
oriented services, besides performing throughput oriented graph
computations.
For the evaluation of POLM2, we use two well-known algo-
rithms: i) page rank (GraphChi PR), and ii) connected components
(GraphChi CC). Both algorithms use as input a 2010 twitter graph
[33] consisting of 42 millions vertexes and 1.5 billions edges. These
vertexes (and the corresponding edges) are loaded in batches into
memory; GraphChi calculates a memory budget to determine the
number of edges to load into memory before the next batch. This
represents an iterative process; in each iteration a new batch of
vertexes is loaded and processed.
5.3 Application ProfilingThis section shows the results obtained during the profiling phase
(while the next section present results obtained during the produc-
tion phase).
Because each workload stabilizes very fast after the JVM loading,
we found that profiling each workload for only five minutes is
sufficient (the first minute of execution is always ignored to avoid
load-time noise; hence, the profiling phase lasts for six minutes
per workload). If other workloads take more time to stabilize, the
duration of the profiling phase might increase.
6The Yahoo! Cloud Serving Benchmark (YCSB) is an open-source benchmarking tool
often used to compare NoSQL database systems.
7Wikipedia dumps are available at dumps.wikimedia.org
154
Automatic Profiling for Object Lifetime-Aware Memory Management Middleware ’17, December 11–15, 2017, Las Vegas, NV, USA
5.3.1 Profiling Allocation SitesFor each application and workload, a number of allocation sites are
identified as candidates for instrumentation. Each allocation site
can be selected for a different generation, according to the estimated
lifetime of objects allocated through that particular allocation site.
Finally, encountered conflicts are also solved, resulting in additional
code changes (see Section 3.3 for more details).
Table 1 shows the abovementioned applications profilingmetrics
for each workload, for both POLM2 and NG2C (with manual code
modifications). Regarding the number of instrumented allocation
sites, both POLM2 and NG2C are very similar. For Cassandra-RI
and Lucene, POLM2 did not consider as many allocation sites as
NG2C which, as discussed in the next sections, is a correct decision.
Regarding the number of generations used, the only difference is on
how Cassandra workloads are handled; POLM2 uses only four gen-
erations while NG2C uses an undetermined number of generations
(in fact, NG2C creates one generation each time a memory table
is flushed; the new generation is used to accommodate the new
memory table). As can be seen in the next sections, this difference
has no performance impact (neither positive nor negative).
Finally, POLM2 is able to detect conflicts in Lucene, GraphChi-
CC, and GraphChi-PR, that were not correctly identified in NG2C.
As discussed in the next section, this leads to some performance
penalties for NG2C.
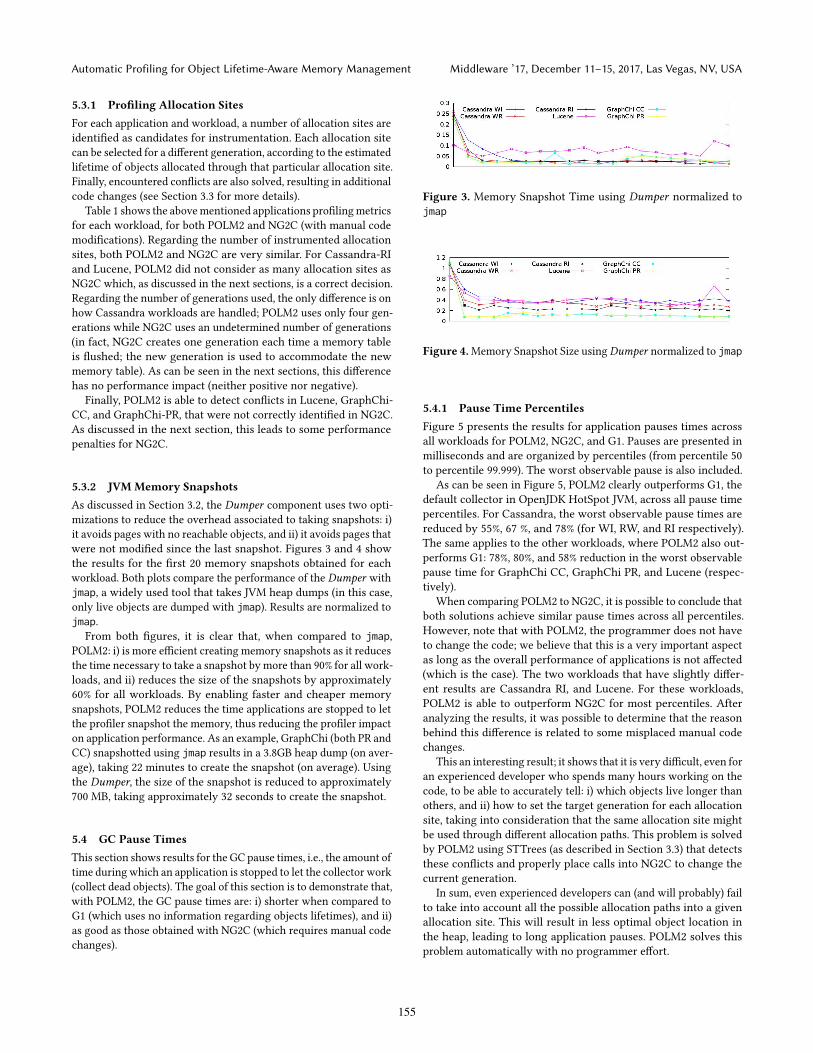
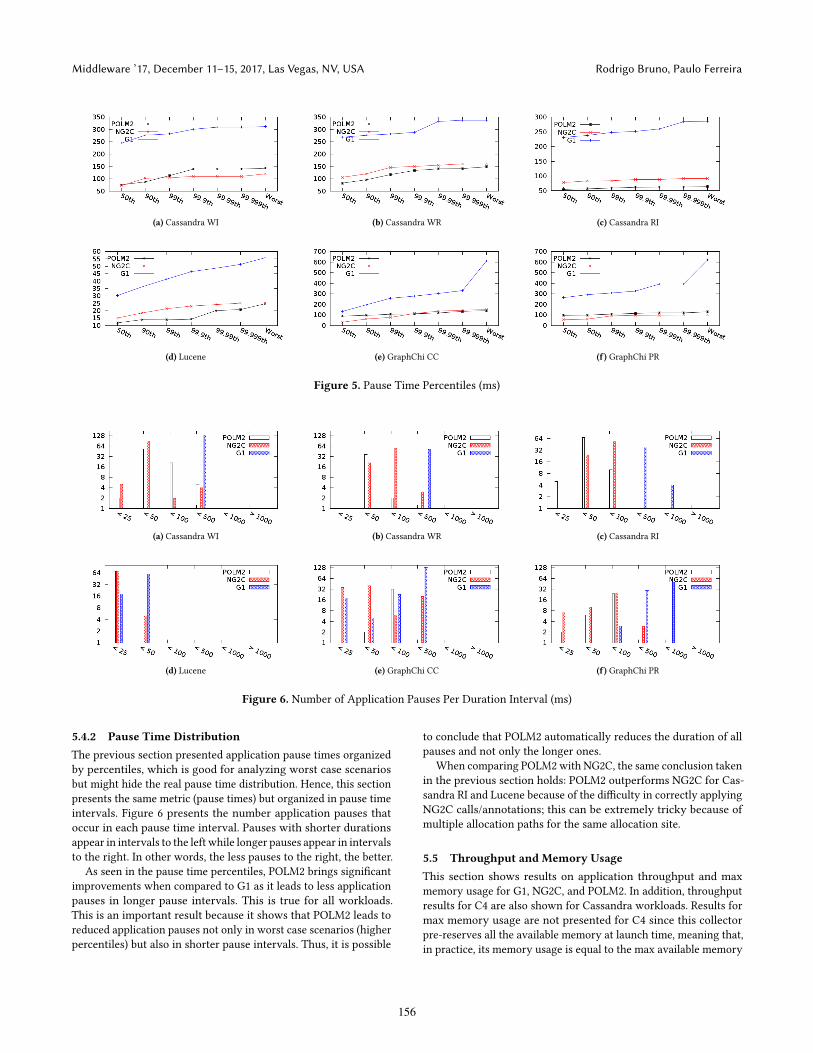
5.3.2 JVM Memory SnapshotsAs discussed in Section 3.2, the Dumper component uses two opti-
mizations to reduce the overhead associated to taking snapshots: i)
it avoids pages with no reachable objects, and ii) it avoids pages that
were not modified since the last snapshot. Figures 3 and 4 show
the results for the first 20 memory snapshots obtained for each
workload. Both plots compare the performance of the Dumper withjmap, a widely used tool that takes JVM heap dumps (in this case,
only live objects are dumped with jmap). Results are normalized to
jmap.From both figures, it is clear that, when compared to jmap,
POLM2: i) is more efficient creating memory snapshots as it reduces
the time necessary to take a snapshot by more than 90% for all work-
loads, and ii) reduces the size of the snapshots by approximately
60% for all workloads. By enabling faster and cheaper memory
snapshots, POLM2 reduces the time applications are stopped to let
the profiler snapshot the memory, thus reducing the profiler impact
on application performance. As an example, GraphChi (both PR and
CC) snapshotted using jmap results in a 3.8GB heap dump (on aver-
age), taking 22 minutes to create the snapshot (on average). Using
the Dumper, the size of the snapshot is reduced to approximately
700 MB, taking approximately 32 seconds to create the snapshot.
5.4 GC Pause TimesThis section shows results for the GC pause times, i.e., the amount of
time during which an application is stopped to let the collector work
(collect dead objects). The goal of this section is to demonstrate that,
with POLM2, the GC pause times are: i) shorter when compared to
G1 (which uses no information regarding objects lifetimes), and ii)
as good as those obtained with NG2C (which requires manual code
changes).
Figure 3. Memory Snapshot Time using Dumper normalized to
jmap
Figure 4.Memory Snapshot Size usingDumper normalized to jmap
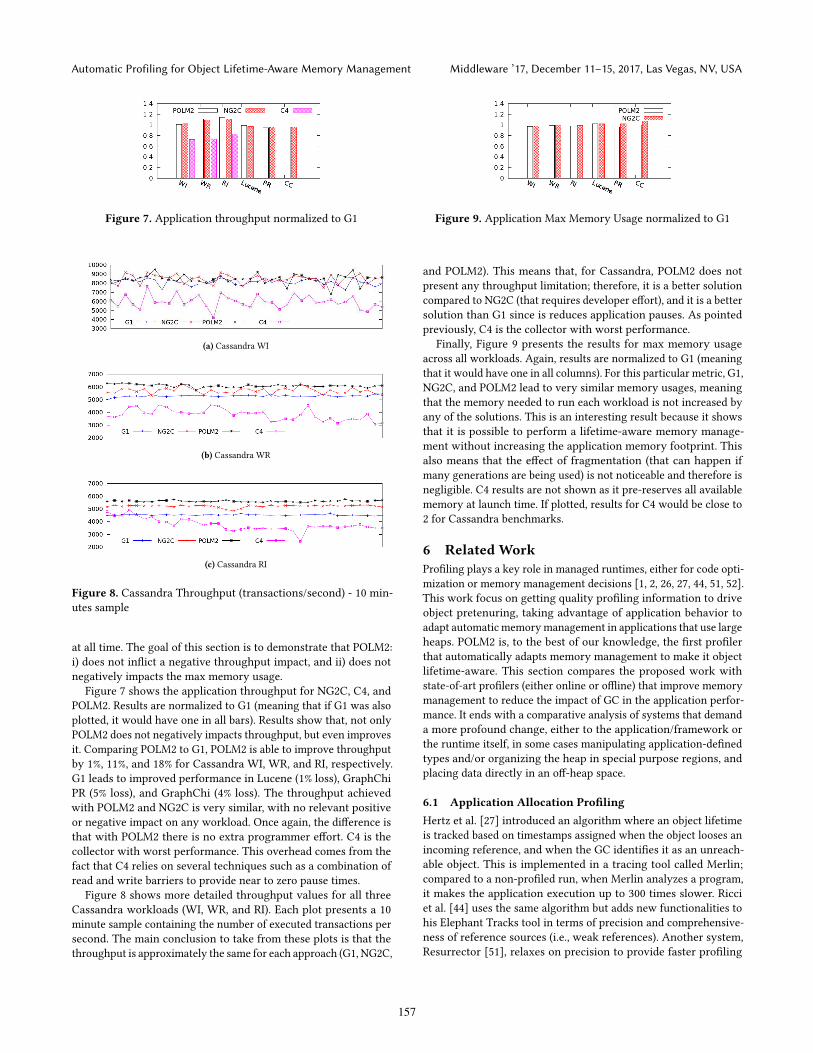
5.4.1 Pause Time PercentilesFigure 5 presents the results for application pauses times across
all workloads for POLM2, NG2C, and G1. Pauses are presented in
milliseconds and are organized by percentiles (from percentile 50
to percentile 99.999). The worst observable pause is also included.
As can be seen in Figure 5, POLM2 clearly outperforms G1, the
default collector in OpenJDK HotSpot JVM, across all pause time
percentiles. For Cassandra, the worst observable pause times are
reduced by 55%, 67 %, and 78% (for WI, RW, and RI respectively).
The same applies to the other workloads, where POLM2 also out-
performs G1: 78%, 80%, and 58% reduction in the worst observable
pause time for GraphChi CC, GraphChi PR, and Lucene (respec-
tively).
When comparing POLM2 to NG2C, it is possible to conclude that
both solutions achieve similar pause times across all percentiles.
However, note that with POLM2, the programmer does not have
to change the code; we believe that this is a very important aspect
as long as the overall performance of applications is not affected
(which is the case). The two workloads that have slightly differ-
ent results are Cassandra RI, and Lucene. For these workloads,
POLM2 is able to outperform NG2C for most percentiles. After
analyzing the results, it was possible to determine that the reason
behind this difference is related to some misplaced manual code
changes.
This an interesting result; it shows that it is very difficult, even for
an experienced developer who spends many hours working on the
code, to be able to accurately tell: i) which objects live longer than
others, and ii) how to set the target generation for each allocation
site, taking into consideration that the same allocation site might
be used through different allocation paths. This problem is solved
by POLM2 using STTrees (as described in Section 3.3) that detects
these conflicts and properly place calls into NG2C to change the
current generation.
In sum, even experienced developers can (and will probably) fail
to take into account all the possible allocation paths into a given
allocation site. This will result in less optimal object location in
the heap, leading to long application pauses. POLM2 solves this
problem automatically with no programmer effort.
155
Middleware ’17, December 11–15, 2017, Las Vegas, NV, USA Rodrigo Bruno, Paulo Ferreira
(a) Cassandra WI (b) Cassandra WR (c) Cassandra RI
(d) Lucene (e) GraphChi CC (f) GraphChi PR
Figure 5. Pause Time Percentiles (ms)
(a) Cassandra WI (b) Cassandra WR (c) Cassandra RI
(d) Lucene (e) GraphChi CC (f) GraphChi PR
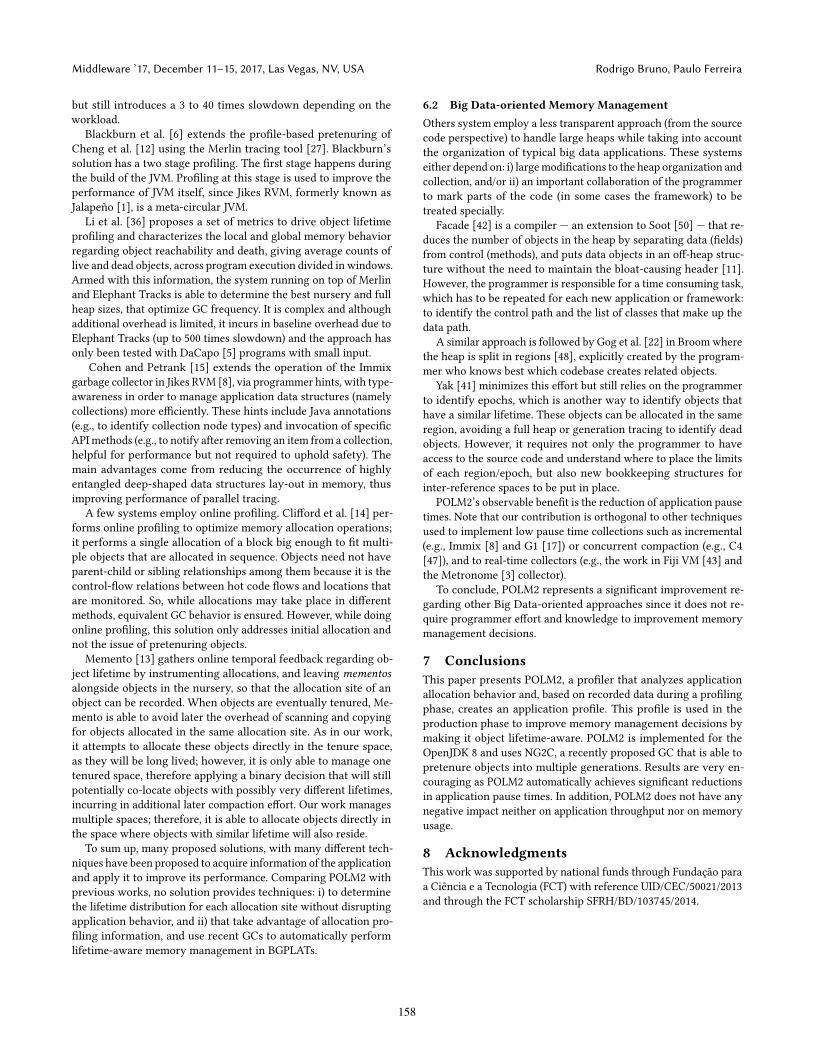
Figure 6. Number of Application Pauses Per Duration Interval (ms)
5.4.2 Pause Time DistributionThe previous section presented application pause times organized
by percentiles, which is good for analyzing worst case scenarios
but might hide the real pause time distribution. Hence, this section
presents the same metric (pause times) but organized in pause time
intervals. Figure 6 presents the number application pauses that
occur in each pause time interval. Pauses with shorter durations
appear in intervals to the left while longer pauses appear in intervals
to the right. In other words, the less pauses to the right, the better.
As seen in the pause time percentiles, POLM2 brings significant
improvements when compared to G1 as it leads to less application
pauses in longer pause intervals. This is true for all workloads.
This is an important result because it shows that POLM2 leads to
reduced application pauses not only in worst case scenarios (higher
percentiles) but also in shorter pause intervals. Thus, it is possible
to conclude that POLM2 automatically reduces the duration of all
pauses and not only the longer ones.
When comparing POLM2with NG2C, the same conclusion taken
in the previous section holds: POLM2 outperforms NG2C for Cas-
sandra RI and Lucene because of the difficulty in correctly applying
NG2C calls/annotations; this can be extremely tricky because of
multiple allocation paths for the same allocation site.
5.5 Throughput and Memory UsageThis section shows results on application throughput and max
memory usage for G1, NG2C, and POLM2. In addition, throughput
results for C4 are also shown for Cassandra workloads. Results for
max memory usage are not presented for C4 since this collector
pre-reserves all the available memory at launch time, meaning that,
in practice, its memory usage is equal to the max available memory
156
Automatic Profiling for Object Lifetime-Aware Memory Management Middleware ’17, December 11–15, 2017, Las Vegas, NV, USA
Figure 7. Application throughput normalized to G1
(a) Cassandra WI
(b) Cassandra WR
(c) Cassandra RI
Figure 8. Cassandra Throughput (transactions/second) - 10 min-
utes sample
at all time. The goal of this section is to demonstrate that POLM2:
i) does not inflict a negative throughput impact, and ii) does not
negatively impacts the max memory usage.
Figure 7 shows the application throughput for NG2C, C4, and
POLM2. Results are normalized to G1 (meaning that if G1 was also
plotted, it would have one in all bars). Results show that, not only
POLM2 does not negatively impacts throughput, but even improves
it. Comparing POLM2 to G1, POLM2 is able to improve throughput
by 1%, 11%, and 18% for Cassandra WI, WR, and RI, respectively.
G1 leads to improved performance in Lucene (1% loss), GraphChi
PR (5% loss), and GraphChi (4% loss). The throughput achieved
with POLM2 and NG2C is very similar, with no relevant positive
or negative impact on any workload. Once again, the difference is
that with POLM2 there is no extra programmer effort. C4 is the
collector with worst performance. This overhead comes from the
fact that C4 relies on several techniques such as a combination of
read and write barriers to provide near to zero pause times.
Figure 8 shows more detailed throughput values for all three
Cassandra workloads (WI, WR, and RI). Each plot presents a 10
minute sample containing the number of executed transactions per
second. The main conclusion to take from these plots is that the
throughput is approximately the same for each approach (G1, NG2C,
Figure 9. Application Max Memory Usage normalized to G1
and POLM2). This means that, for Cassandra, POLM2 does not
present any throughput limitation; therefore, it is a better solution
compared to NG2C (that requires developer effort), and it is a better
solution than G1 since is reduces application pauses. As pointed
previously, C4 is the collector with worst performance.
Finally, Figure 9 presents the results for max memory usage
across all workloads. Again, results are normalized to G1 (meaning
that it would have one in all columns). For this particular metric, G1,
NG2C, and POLM2 lead to very similar memory usages, meaning
that the memory needed to run each workload is not increased by
any of the solutions. This is an interesting result because it shows
that it is possible to perform a lifetime-aware memory manage-
ment without increasing the application memory footprint. This
also means that the effect of fragmentation (that can happen if
many generations are being used) is not noticeable and therefore is
negligible. C4 results are not shown as it pre-reserves all available
memory at launch time. If plotted, results for C4 would be close to
2 for Cassandra benchmarks.
6 Related WorkProfiling plays a key role in managed runtimes, either for code opti-
mization or memory management decisions [1, 2, 26, 27, 44, 51, 52].
This work focus on getting quality profiling information to drive
object pretenuring, taking advantage of application behavior to
adapt automatic memorymanagement in applications that use large
heaps. POLM2 is, to the best of our knowledge, the first profiler
that automatically adapts memory management to make it object
lifetime-aware. This section compares the proposed work with
state-of-art profilers (either online or offline) that improve memory
management to reduce the impact of GC in the application perfor-
mance. It ends with a comparative analysis of systems that demand
a more profound change, either to the application/framework or
the runtime itself, in some cases manipulating application-defined
types and/or organizing the heap in special purpose regions, and
placing data directly in an off-heap space.
6.1 Application Allocation ProfilingHertz et al. [27] introduced an algorithm where an object lifetime
is tracked based on timestamps assigned when the object looses an
incoming reference, and when the GC identifies it as an unreach-
able object. This is implemented in a tracing tool called Merlin;
compared to a non-profiled run, when Merlin analyzes a program,
it makes the application execution up to 300 times slower. Ricci
et al. [44] uses the same algorithm but adds new functionalities to
his Elephant Tracks tool in terms of precision and comprehensive-
ness of reference sources (i.e., weak references). Another system,
Resurrector [51], relaxes on precision to provide faster profiling
157
Middleware ’17, December 11–15, 2017, Las Vegas, NV, USA Rodrigo Bruno, Paulo Ferreira
but still introduces a 3 to 40 times slowdown depending on the
workload.
Blackburn et al. [6] extends the profile-based pretenuring of
Cheng et al. [12] using the Merlin tracing tool [27]. Blackburn’s
solution has a two stage profiling. The first stage happens during
the build of the JVM. Profiling at this stage is used to improve the
performance of JVM itself, since Jikes RVM, formerly known as
Jalapeño [1], is a meta-circular JVM.
Li et al. [36] proposes a set of metrics to drive object lifetime
profiling and characterizes the local and global memory behavior
regarding object reachability and death, giving average counts of
live and dead objects, across program execution divided in windows.
Armed with this information, the system running on top of Merlin
and Elephant Tracks is able to determine the best nursery and full
heap sizes, that optimize GC frequency. It is complex and although
additional overhead is limited, it incurs in baseline overhead due to
Elephant Tracks (up to 500 times slowdown) and the approach has
only been tested with DaCapo [5] programs with small input.
Cohen and Petrank [15] extends the operation of the Immix
garbage collector in Jikes RVM [8], via programmer hints, with type-
awareness in order to manage application data structures (namely
collections) more efficiently. These hints include Java annotations
(e.g., to identify collection node types) and invocation of specific
API methods (e.g., to notify after removing an item from a collection,
helpful for performance but not required to uphold safety). The
main advantages come from reducing the occurrence of highly
entangled deep-shaped data structures lay-out in memory, thus
improving performance of parallel tracing.
A few systems employ online profiling. Clifford et al. [14] per-
forms online profiling to optimize memory allocation operations;
it performs a single allocation of a block big enough to fit multi-
ple objects that are allocated in sequence. Objects need not have
parent-child or sibling relationships among them because it is the
control-flow relations between hot code flows and locations that
are monitored. So, while allocations may take place in different
methods, equivalent GC behavior is ensured. However, while doing
online profiling, this solution only addresses initial allocation and
not the issue of pretenuring objects.
Memento [13] gathers online temporal feedback regarding ob-
ject lifetime by instrumenting allocations, and leaving mementosalongside objects in the nursery, so that the allocation site of an
object can be recorded. When objects are eventually tenured, Me-
mento is able to avoid later the overhead of scanning and copying
for objects allocated in the same allocation site. As in our work,
it attempts to allocate these objects directly in the tenure space,
as they will be long lived; however, it is only able to manage one
tenured space, therefore applying a binary decision that will still
potentially co-locate objects with possibly very different lifetimes,
incurring in additional later compaction effort. Our work manages
multiple spaces; therefore, it is able to allocate objects directly in
the space where objects with similar lifetime will also reside.
To sum up, many proposed solutions, with many different tech-
niques have been proposed to acquire information of the application
and apply it to improve its performance. Comparing POLM2 with
previous works, no solution provides techniques: i) to determine
the lifetime distribution for each allocation site without disrupting
application behavior, and ii) that take advantage of allocation pro-
filing information, and use recent GCs to automatically perform
lifetime-aware memory management in BGPLATs.
6.2 Big Data-oriented Memory ManagementOthers system employ a less transparent approach (from the source
code perspective) to handle large heaps while taking into account
the organization of typical big data applications. These systems
either depend on: i) largemodifications to the heap organization and
collection, and/or ii) an important collaboration of the programmer
to mark parts of the code (in some cases the framework) to be
treated specially.
Facade [42] is a compiler — an extension to Soot [50] — that re-
duces the number of objects in the heap by separating data (fields)
from control (methods), and puts data objects in an off-heap struc-
ture without the need to maintain the bloat-causing header [11].
However, the programmer is responsible for a time consuming task,
which has to be repeated for each new application or framework:
to identify the control path and the list of classes that make up the
data path.
A similar approach is followed by Gog et al. [22] in Broom where
the heap is split in regions [48], explicitly created by the program-
mer who knows best which codebase creates related objects.
Yak [41] minimizes this effort but still relies on the programmer
to identify epochs, which is another way to identify objects that
have a similar lifetime. These objects can be allocated in the same
region, avoiding a full heap or generation tracing to identify dead
objects. However, it requires not only the programmer to have
access to the source code and understand where to place the limits
of each region/epoch, but also new bookkeeping structures for
inter-reference spaces to be put in place.
POLM2’s observable benefit is the reduction of application pause
times. Note that our contribution is orthogonal to other techniques
used to implement low pause time collections such as incremental
(e.g., Immix [8] and G1 [17]) or concurrent compaction (e.g., C4
[47]), and to real-time collectors (e.g., the work in Fiji VM [43] and
the Metronome [3] collector).
To conclude, POLM2 represents a significant improvement re-
garding other Big Data-oriented approaches since it does not re-
quire programmer effort and knowledge to improvement memory
management decisions.
7 ConclusionsThis paper presents POLM2, a profiler that analyzes application
allocation behavior and, based on recorded data during a profiling
phase, creates an application profile. This profile is used in the
production phase to improve memory management decisions by
making it object lifetime-aware. POLM2 is implemented for the
OpenJDK 8 and uses NG2C, a recently proposed GC that is able to
pretenure objects into multiple generations. Results are very en-
couraging as POLM2 automatically achieves significant reductions
in application pause times. In addition, POLM2 does not have any
negative impact neither on application throughput nor on memory
usage.
8 AcknowledgmentsThis work was supported by national funds through Fundação para
a Ciência e a Tecnologia (FCT) with reference UID/CEC/50021/2013
and through the FCT scholarship SFRH/BD/103745/2014.
158
Automatic Profiling for Object Lifetime-Aware Memory Management Middleware ’17, December 11–15, 2017, Las Vegas, NV, USA
References[1] MatthewArnold, Stephen Fink, David Grove, Michael Hind, and Peter F. Sweeney.
2000. Adaptive Optimization in the Jalapeño JVM. In Proceedings of the 15thACM SIGPLAN Conference on Object-oriented Programming, Systems, Languages,and Applications (OOPSLA ’00). ACM, New York, NY, USA, 47–65. DOI:https://doi.org/10.1145/353171.353175
[2] M. Arnold, S. J. Fink, D. Grove, M. Hind, and P. F. Sweeney. 2005. A Survey of
Adaptive Optimization in Virtual Machines. Proc. IEEE 93, 2 (Feb 2005), 449–466.
[3] David F. Bacon, Perry Cheng, and V. T. Rajan. 2003. Controlling Fragmentation
and Space Consumption in the Metronome, a Real-time Garbage Collector for
Java. In Proceedings of the 2003 ACM SIGPLAN Conference on Language, Compiler,and Tool for Embedded Systems (LCTES ’03). ACM, New York, NY, USA, 81–92.
DOI:https://doi.org/10.1145/780732.780744[4] William S Beebee Jr and Martin Rinard. 2001. An implementation of scoped
memory for Real-Time Java. In International Workshop on Embedded Software.Springer, 289–305.
[5] Stephen M. Blackburn, Robin Garner, Chris Hoffmann, Asjad M. Khang,
Kathryn S. McKinley, Rotem Bentzur, Amer Diwan, Daniel Feinberg, Daniel
Frampton, Samuel Z. Guyer, Martin Hirzel, Antony Hosking, Maria Jump, Han
Lee, J. Eliot B. Moss, Aashish Phansalkar, Darko Stefanović, Thomas VanDrunen,
Daniel von Dincklage, and Ben Wiedermann. 2006. The DaCapo Benchmarks:
Java Benchmarking Development and Analysis. In Proceedings of the 21st An-nual ACM SIGPLAN Conference on Object-oriented Programming Systems, Lan-guages, and Applications (OOPSLA ’06). ACM, New York, NY, USA, 169–190. DOI:https://doi.org/10.1145/1167473.1167488
[6] Stephen M. Blackburn, Matthew Hertz, Kathryn S. Mckinley, J. Eliot B. Moss,
and Ting Yang. 2007. Profile-based Pretenuring. ACM Trans. Program. Lang. Syst.29, 1, Article 2 (Jan. 2007). http://doi.acm.org/10.1145/1180475.1180477
[7] Stephen M Blackburn, Richard Jones, Kathryn S. McKinley, and J Eliot B Moss.
2002. Beltway: Getting Around Garbage Collection Gridlock. In Proceedingsof the ACM SIGPLAN 2002 Conference on Programming Language Design andImplementation (PLDI ’02). ACM, New York, NY, USA, 153–164. DOI:https://doi.org/10.1145/512529.512548
[8] Stephen M. Blackburn and Kathryn S. McKinley. 2008. Immix: A Mark-region
Garbage Collector with Space Efficiency, Fast Collection, and Mutator Per-
formance. In Proceedings of the 29th ACM SIGPLAN Conference on Program-ming Language Design and Implementation (PLDI ’08). ACM, 22–32. http://doi.acm.org/10.1145/1375581.1375586
[9] Chandrasekhar Boyapati, Alexandru Salcianu, William Beebee, Jr., and Martin
Rinard. 2003. Ownership Types for Safe Region-based Memory Management
in Real-time Java. In Proceedings of the ACM SIGPLAN 2003 Conference on Pro-gramming Language Design and Implementation (PLDI ’03). ACM, New York, NY,
USA, 324–337. DOI:https://doi.org/10.1145/781131.781168[10] Rodrigo Bruno, Luís Picciochi Oliveira, and Paulo Ferreira. 2017. NG2C: Pre-
tenuring Garbage Collection with Dynamic Generations for HotSpot Big Data
Applications. In Proceedings of the 2017 ACM SIGPLAN International Symposiumon Memory Management (ISMM 2017). ACM, New York, NY, USA, 2–13. DOI:https://doi.org/10.1145/3092255.3092272
[11] Yingyi Bu, Vinayak Borkar, Guoqing Xu, and Michael J. Carey. 2013. A Bloat-
aware Design for Big Data Applications. In Proceedings of the 2013 InternationalSymposium on Memory Management (ISMM ’13). ACM, New York, NY, USA,
119–130. DOI:https://doi.org/10.1145/2464157.2466485[12] Perry Cheng, Robert Harper, and Peter Lee. 1998. Generational Stack Collection
and Profile-driven Pretenuring. In Proceedings of the ACM SIGPLAN 1998 Confer-ence on Programming Language Design and Implementation (PLDI ’98). 162–173.http://doi.acm.org/10.1145/277650.277718
[13] Daniel Clifford, Hannes Payer, Michael Stanton, and Ben L. Titzer. 2015. Memento
Mori: Dynamic Allocation-site-based Optimizations. SIGPLAN Not. 50, 11 (June2015), 105–117. DOI:https://doi.org/10.1145/2887746.2754181
[14] Daniel Clifford, Hannes Payer, Michael Starzinger, and Ben L. Titzer. 2014. Al-
location Folding Based on Dominance. In Proceedings of the 2014 InternationalSymposium on Memory Management (ISMM ’14). ACM, New York, NY, USA,
15–24. DOI:https://doi.org/10.1145/2602988.2602994[15] Nachshon Cohen and Erez Petrank. 2015. Data Structure Aware Garbage Collec-
tor. In Proceedings of the 2015 International Symposium on Memory Management(ISMM ’15). ACM, New York, NY, USA, 28–40. DOI:https://doi.org/10.1145/2754169.2754176
[16] David Detlefs, Christine Flood, Steve Heller, and Tony Printezis. 2004. Garbage-
first Garbage Collection. In Proceedings of the 4th International Symposium onMemory Management (ISMM ’04). ACM, New York, NY, USA, 37–48. DOI:https://doi.org/10.1145/1029873.1029879
[17] David Detlefs, Christine Flood, Steve Heller, and Tony Printezis. 2004. Garbage-
first Garbage Collection. In Proceedings of the 4th International Symposium onMemory Management (ISMM ’04). ACM, New York, NY, USA, 37–48. DOI:https://doi.org/10.1145/1029873.1029879
[18] David Gay and Alex Aiken. 2001. Language Support for Regions. In Proceedingsof the ACM SIGPLAN 2001 Conference on Programming Language Design andImplementation (PLDI ’01). ACM, New York, NY, USA, 70–80. DOI:https://doi.org/10.1145/378795.378815
[19] David Gay and Bjarne Steensgaard. 2000. Fast Escape Analysis and Stack Alloca-
tion for Object-Based Programs. In Proceedings of the 9th International Conferenceon Compiler Construction (CC ’00). Springer-Verlag, London, UK, UK, 82–93.
[20] Lokesh Gidra, Gaël Thomas, Julien Sopena, and Marc Shapiro. 2012. Assessing
the Scalability of Garbage Collectors on Many Cores. SIGOPS Oper. Syst. Rev. 45,3 (Jan. 2012), 15–19. DOI:https://doi.org/10.1145/2094091.2094096
[21] Lokesh Gidra, Gaël Thomas, Julien Sopena, and Marc Shapiro. 2013. A Study
of the Scalability of Stop-the-world Garbage Collectors on Multicores. In Pro-ceedings of the Eighteenth International Conference on Architectural Support forProgramming Languages and Operating Systems (ASPLOS ’13). ACM, New York,
NY, USA, 229–240. DOI:https://doi.org/10.1145/2451116.2451142[22] Ionel Gog, Jana Giceva, Malte Schwarzkopf, Kapil Vaswani, Dimitrios Vytinio-
tis, Ganesan Ramalingam, Manuel Costa, Derek G. Murray, Steven Hand, and
Michael Isard. 2015. Broom: Sweeping Out Garbage Collection from Big Data Sys-
tems. In 15th Workshop on Hot Topics in Operating Systems (HotOS XV). USENIXAssociation, Kartause Ittingen, Switzerland. https://www.usenix.org/conference/hotos15/workshop-program/presentation/gog
[23] Ionel Gog, Jana Giceva, Malte Schwarzkopf, Kapil Vaswani, Dimitrios Vytiniotis,
Ganesan Ramalingan, Derek Murray, Steven Hand, and Michael Isard. 2015.
Broom: Sweeping out Garbage Collection from Big Data Systems. In Proceedingsof the 15th USENIX Conference on Hot Topics in Operating Systems (HOTOS’15).USENIX Association, Berkeley, CA, USA, 2–2.
[24] Dan Grossman, Greg Morrisett, Trevor Jim, Michael Hicks, Yanling Wang, and
James Cheney. 2002. Region-based Memory Management in Cyclone. In Pro-ceedings of the ACM SIGPLAN 2002 Conference on Programming Language De-sign and Implementation (PLDI ’02). ACM, New York, NY, USA, 282–293. DOI:https://doi.org/10.1145/512529.512563
[25] Niels Hallenberg, Martin Elsman, and Mads Tofte. 2002. Combining Region
Inference and Garbage Collection. In Proceedings of the ACM SIGPLAN 2002Conference on Programming Language Design and Implementation (PLDI ’02).ACM, New York, NY, USA, 141–152. DOI:https://doi.org/10.1145/512529.512547
[26] Timothy L. Harris. 2000. Dynamic Adaptive Pre-tenuring. In Proceedings of the2nd International Symposium on Memory Management (ISMM ’00). ACM, 127–136.
http://doi.acm.org/10.1145/362422.362476[27] Matthew Hertz, Stephen M. Blackburn, J. Eliot B. Moss, Kathryn S. McKinley,
and Darko Stefanović. 2006. Generating Object Lifetime Traces with Merlin.
ACM Trans. Program. Lang. Syst. 28, 3 (May 2006), 476–516. http://doi.acm.org/10.1145/1133651.1133654
[28] Michael Hicks, Greg Morrisett, Dan Grossman, and Trevor Jim. 2004. Experience
with Safe Manual Memory-management in Cyclone. In Proceedings of the 4thInternational Symposium on Memory Management (ISMM ’04). ACM, New York,
NY, USA, 73–84. DOI:https://doi.org/10.1145/1029873.1029883[29] Richard L. Hudson, Ron Morrison, J. Eliot B. Moss, and David S. Munro. 1997.
Garbage Collecting the World: One Car at a Time. In Proceedings of the 12thACM SIGPLAN Conference on Object-oriented Programming, Systems, Languages,and Applications (OOPSLA ’97). ACM, New York, NY, USA, 162–175. DOI:https://doi.org/10.1145/263698.264353
[30] Richard Jones, Antony Hosking, and Eliot Moss. 2016. The garbage collectionhandbook: the art of automatic memory management. CRC Press.
[31] Richard E. Jones and Chris Ryder. 2008. A Study of Java Object Demographics. In
Proceedings of the 7th International Symposium on Memory Management (ISMM’08). ACM, New York, NY, USA, 121–130. DOI:https://doi.org/10.1145/1375634.1375652
[32] Sumant Kowshik, Dinakar Dhurjati, and Vikram Adve. 2002. Ensuring Code
Safety Without Runtime Checks for Real-time Control Systems. In Proceedingsof the 2002 International Conference on Compilers, Architecture, and Synthesisfor Embedded Systems (CASES ’02). ACM, New York, NY, USA, 288–297. DOI:https://doi.org/10.1145/581630.581678
[33] Haewoon Kwak, Changhyun Lee, Hosung Park, and Sue Moon. 2010. What is
Twitter, a Social Network or a News Media?. In Proceedings of the 19th Interna-tional Conference on World Wide Web (WWW ’10). ACM, New York, NY, USA,
591–600. DOI:https://doi.org/10.1145/1772690.1772751[34] Aapo Kyrola, Guy Blelloch, and Carlos Guestrin. 2012. GraphChi: Large-scale
Graph Computation on Just a PC. In Proceedings of the 10th USENIX Conferenceon Operating Systems Design and Implementation (OSDI’12). USENIX Association,
Berkeley, CA, USA, 31–46. http://dl.acm.org/citation.cfm?id=2387880.2387884[35] Avinash Lakshman and Prashant Malik. 2010. Cassandra: A Decentralized
Structured Storage System. SIGOPS Oper. Syst. Rev. 44, 2 (April 2010), 35–40.
DOI:https://doi.org/10.1145/1773912.1773922[36] Pengcheng Li, Chen Ding, and Hao Luo. 2014. Modeling Heap Data Growth
Using Average Liveness. In Proceedings of the 2014 International Symposiumon Memory Management (ISMM ’14). ACM, New York, NY, USA, 71–82. DOI:https://doi.org/10.1145/2602988.2602997
[37] Lu Lu, Xuanhua Shi, Yongluan Zhou, Xiong Zhang, Hai Jin, Cheng Pei, Ligang He,
and Yuanzhen Geng. 2016. Lifetime-based Memory Management for Distributed
Data Processing Systems. Proc. VLDB Endow. 9, 12 (Aug. 2016), 936–947. DOI:https://doi.org/10.14778/2994509.2994513
[38] Simon Marlow, Tim Harris, Roshan P. James, and Simon Peyton Jones. 2008.
Parallel Generational-copying Garbage Collection with a Block-structured Heap.
In Proceedings of the 7th International Symposium on Memory Management (ISMM’08). ACM, New York, NY, USA, 11–20. DOI:https://doi.org/10.1145/1375634.
159

Middleware ’17, December 11–15, 2017, Las Vegas, NV, USA Rodrigo Bruno, Paulo Ferreira
1375637[39] Luis Mastrangelo, Luca Ponzanelli, Andrea Mocci, Michele Lanza, Matthias
Hauswirth, and Nathaniel Nystrom. 2015. Use at Your Own Risk: The Java
Unsafe API in the Wild. In Proceedings of the 2015 ACM SIGPLAN InternationalConference on Object-Oriented Programming, Systems, Languages, and Applications(OOPSLA 2015). ACM, New York, NY, USA, 695–710. DOI:https://doi.org/10.1145/2814270.2814313
[40] Michael McCandless, Erik Hatcher, and Otis Gospodnetic. 2010. Lucene in Action,Second Edition: Covers Apache Lucene 3.0. Manning Publications Co., Greenwich,
CT, USA.
[41] Khanh Nguyen, Lu Fang, Guoqing Xu, Brian Demsky, Shan Lu, Sanazsadat
Alamian, and Onur Mutlu. 2016. Yak: A High-performance Big-data-friendly
Garbage Collector. In Proceedings of the 12th USENIX Conference on OperatingSystems Design and Implementation (OSDI’16). USENIX Association, Berkeley,
CA, USA, 349–365. http://dl.acm.org/citation.cfm?id=3026877.3026905[42] Khanh Nguyen, Kai Wang, Yingyi Bu, Lu Fang, Jianfei Hu, and Guoqing Xu.
2015. FACADE: A Compiler and Runtime for (Almost) Object-Bounded Big
Data Applications. In Proceedings of the Twentieth International Conference onArchitectural Support for Programming Languages and Operating Systems (ASPLOS’15). ACM, 675–690. http://doi.acm.org/10.1145/2694344.2694345
[43] Filip Pizlo, Lukasz Ziarek, and Jan Vitek. 2009. Real Time Java on Resource-
constrained Platforms with Fiji VM. In Proceedings of the 7th International Work-shop on Java Technologies for Real-Time and Embedded Systems (JTRES ’09). ACM,
New York, NY, USA, 110–119. DOI:https://doi.org/10.1145/1620405.1620421[44] Nathan P. Ricci, Samuel Z. Guyer, and J. Eliot B. Moss. 2011. Elephant Tracks:
Generating Program Traces with Object Death Records. In Proceedings of the 9thInternational Conference on Principles and Practice of Programming in Java (PPPJ’11). 139–142. http://doi.acm.org/10.1145/2093157.2093178
[45] Jacob Seligmann and Steffen Grarup. 1995. Incremental mature garbage col-
lection using the train algorithm. In European Conference on Object-OrientedProgramming. Springer, 235–252.
[46] Codruţ Stancu, Christian Wimmer, Stefan Brunthaler, Per Larsen, and Michael
Franz. 2015. Safe and Efficient Hybrid Memory Management for Java. In Proceed-ings of the 2015 International Symposium on Memory Management (ISMM ’15).ACM, New York, NY, USA, 81–92. DOI:https://doi.org/10.1145/2754169.2754185
[47] Gil Tene, Balaji Iyengar, and Michael Wolf. 2011. C4: The Continuously Con-
current Compacting Collector. In Proceedings of the International Symposiumon Memory Management (ISMM ’11). ACM, New York, NY, USA, 79–88. DOI:https://doi.org/10.1145/1993478.1993491
[48] Mads Tofte and Jean-Pierre Talpin. 1997. Region-BasedMemoryManagement. Inf.Comput. 132, 2 (Feb. 1997), 109–176. DOI:https://doi.org/10.1006/inco.1996.2613
[49] David Ungar. 1984. Generation Scavenging: A Non-disruptive High Perfor-
mance Storage Reclamation Algorithm. In Proceedings of the First ACM SIG-SOFT/SIGPLAN Software Engineering Symposium on Practical Software Devel-opment Environments (SDE 1). ACM, New York, NY, USA, 157–167. DOI:https://doi.org/10.1145/800020.808261
[50] Raja Vallée-Rai, Etienne Gagnon, Laurie J. Hendren, Patrick Lam, Patrice Pom-
inville, and Vijay Sundaresan. 2000. Optimizing Java Bytecode Using the Soot
Framework: Is It Feasible?. In Proceedings of the 9th International Conferenceon Compiler Construction (CC ’00). Springer-Verlag, London, UK, UK, 18–34.http://dl.acm.org/citation.cfm?id=647476.727758
[51] Guoqing Xu. 2013. Resurrector: A Tunable Object Lifetime Profiling Technique
for Optimizing Real-world Programs. In Proceedings of the 2013 ACM SIGPLANInternational Conference on Object Oriented Programming Systems Languages& Applications (OOPSLA ’13). ACM, 111–130. http://doi.acm.org/10.1145/2509136.2509512
[52] Yudi Zheng, Lubomír Bulej, and Walter Binder. 2015. Accurate Profiling in the
Presence of Dynamic Compilation. In Proceedings of the 2015 ACM SIGPLANInternational Conference on Object-Oriented Programming, Systems, Languages,and Applications (OOPSLA 2015). ACM, New York, NY, USA, 433–450. http://doi.acm.org/10.1145/2814270.2814281
160


![Using Lifetime-Aware Progressive Programming to Improve SLC … › ~tzhang › pub › SLCTVLSI2014.pdf · 2014-10-04 · capacitance-coupling effect [14]. This is referred to as](https://static.fdocuments.in/doc/165x107/5f262b032a4eaa00092eca19/using-lifetime-aware-progressive-programming-to-improve-slc-a-tzhang-a-pub.jpg)


![Lifetime-aware, Fault-aware and Energy-aware SDN and CDC ......140 160 180 0 1000 2000 3000 4000 5000 6000 7000 20 30 40 50 60 70 80 90 100 Power Consumption [W] Temperature [Celsius]](https://static.fdocuments.in/doc/165x107/5fef672207b1d04f00291669/lifetime-aware-fault-aware-and-energy-aware-sdn-and-cdc-140-160-180-0-1000.jpg)