The Macroeconomic and Other Benefits of Energy Efficiency · The macro-level and sectoral impacts...
211
June 2017 1 The macro-level and sectoral impacts of Energy Efficiency policies Final report
Transcript of The Macroeconomic and Other Benefits of Energy Efficiency · The macro-level and sectoral impacts...

June 2017 1
The macro-level and sectoral impacts of Energy Efficiency
policies
Final report
June 2017 2
Prepared by Hector Pollitt, Cambridge Econometrics
Eva Alexandri, Cambridge Econometrics
Filippos Anagnostopoulos, EY
Antonio De Rose, EY
Cyrus Farhangi, EY
Thijs Hoste, EY
Sanna Markkanen, Cambridge Econometrics
Perrine Theillard, EY
Coralie Vergez, EY
Monique Voogt, SQ Consult
Contact:
Hector Pollitt
Cambridge Econometrics Ltd,
Covent Garden
Cambridge, UK
CB1 2HT
Tel: +44 1223 533100
This study was ordered and paid for by the European Commission, Directorate-General
for Energy, Contract no. ENER/C3/2013-484/10/FV2015-602 under the Multiple
Framework Service Contract ENER/C3/2013-484. The information and views set out in
this study are those of the author(s) and do not necessarily reflect the official opinion
of the Commission. The Commission does not guarantee the accuracy of the data
included in this study. Neither the Commission nor any person acting on the
Commission’s behalf may be held responsible for the use which may be made of the
information contained therein.
© European Union, July 2017
Reproduction is authorised provided the source is acknowledged.
More information on the European Union is available at http://europa.eu.

June 2017 3
Table of Contents
Executive Summary ........................................................................................................ 10
Part I. Introduction ........................................................................................ 16 1 Introduction to the project ..................................................................................................... 16 2 Introduction to this report....................................................................................................... 18
Part II. Scenarios ................................................................................................ 19 1 Introduction ........................................................................................................................................ 19 2 Reference option ............................................................................................................................. 19 3 Energy efficiency target scenarios .................................................................................... 20
Part III. Methodological Approach .......................................................... 23 1 Introduction ........................................................................................................................................ 23 2 Economy and labour market ................................................................................................. 23 3 Health ...................................................................................................................................................... 31 4 Environmental impacts .............................................................................................................. 34 5 Social aspects .................................................................................................................................... 37 6 Public budgets ................................................................................................................................... 39 7 Industrial competitiveness ...................................................................................................... 45
Part IV. Results ..................................................................................................... 49 1 Introduction ........................................................................................................................................ 49 2 Economy and labour market ................................................................................................. 51 3 Health ...................................................................................................................................................... 71 4 Environmental impacts .............................................................................................................. 75 5 Social impacts ................................................................................................................................... 83 6 Public budgets ................................................................................................................................... 89 7 Industrial competitiveness ...................................................................................................... 95
Part V. Conclusions ........................................................................................ 110
1 Overview of the study ............................................................................................................. 110 2 Conclusions in each impact area ..................................................................................... 111 3 Allocation of impacts to EU policies .............................................................................. 115 4 Key issues to consider ............................................................................................................. 116 5 Closing remarks and policy interactions ................................................................... 119
Appendices 121
Appendix A Short Description of E3ME ...................................................... 122
1 Introduction ..................................................................................................................................... 122 2 How energy efficiency is modelled in E3ME ........................................................... 123
Appendix B The Reference and Policy Scenarios ................................... 127
1 The reference scenario ........................................................................................................... 127 2 The policy scenarios .................................................................................................................. 129
Appendix C Further policy details ...................................................................... 131
Appendix D Review of Previous Studies ....................................................... 132
June 2017 4
1 Introduction ..................................................................................................................................... 132 2 Economy and labour market .............................................................................................. 132 3 Health ................................................................................................................................................... 147 4 Environmental impacts ........................................................................................................... 151 5 Social aspects ................................................................................................................................. 157 6 Public budgets ................................................................................................................................ 159 7 Industrial competitiveness ................................................................................................... 163
Appendix E Additional Results at Member State level .................. 174
Appendix F Country classification ................................................................. 194
Appendix G References .......................................................................................... 195 1 References in the main report .......................................................................................... 195 2 References in the appendices ............................................................................................ 199
List of Figures
Figure III.1 Summary of main steps in the analysis ..............................................23 Figure III.2 Main Model Linkages ........................................................................24 Figure III.3: Rates of capacity utilisation in manufacturing (%) ..............................27 Figure III.4: Construction firms reporting no constraints on production (% of total) ..27 Figure III.5 The effects of energy efficiency on public budgets ................................40 Figure IV.1 EU28 Final energy demand, % from EUCO27 scenario (no crowding out) 49 Figure IV.2 EU28 GDP, 2016-2030, % from EUCO27 scenario (no crowding out) ......51 Figure IV.3 EU28 GDP, 2016-2030, % from EUCO27 scenario (partial crowding out) .52 Figure IV.4 EU28 employment, 2016-2030, % from EUCO27 scenario (no crowding out)
......................................................................................................................55 Figure IV.5 EU28 employment, 2016-2030, % from EUCO27 scenario (partial crowding
out) ................................................................................................................55 Figure IV.6 EU28 unemployment in 2030, absolute difference from EUCO27 scenario
(thousands of people) (no crowding out) .............................................................57 Figure IV.7 EU28 unemployment in 2030, absolute difference from EUCO27 scenario
(thousands of people) (partial crowding out) ........................................................57 Figure IV.8 EU28 Summary of output impacts by sector in 2030, % difference from
EUCO27 scenario (no crowding out) ....................................................................62 Figure IV.9: EU28 Summary of employment impacts by sector in 2030, % difference
from EUCO27 scenario (no crowding out) ............................................................63 Figure IV.10: EU28 energy imports as a share of GDP in 2030, % difference from
EUCO27 scenario (no crowding out) ....................................................................68 Figure IV.11: Energy poverty alleviation impact of the different policy options in
residential buildings using AKW as indicator .........................................................89 Figure IV.12: Change in public budget balance by Member State in 2030, as a % of GDP
for EUCO33 compared to EUCO27 (no crowding out) .............................................93 Figure IV.13: EU28 Average energy intensity, 2015-2030 ......................................95 Figure IV.14: EU28 Energy cost impact, 2015-2030 ..............................................96 Figure IV.15: EU28 Energy intensity (Iron and Steel), 2015-2030 ...........................97 Figure IV.16: EU28 Energy intensity (non-ferrous metals), 2015-2030 ....................97 Figure IV.17 EU28 Energy intensity (chemicals), 2015-2030 ..................................98 Figure IV.18 EU28 Energy intensity (non-metallic minerals), 2015-2030 ..................99 Figure IV.19 EU28 Energy intensity (paper and pulp), 2015-2030 ...........................99

June 2017 5
Figure IV.20 % of SMEs in total value added, by energy-intensive sector in EU 28 .. 103 Figure IV.21 % of SMEs in total value added, by energy-intensive sector in EU 28 .. 104 Figure IV.22: Value added shares of the EU and other world regions ..................... 105 Figure IV.23 Electricity costs for global EIIs since 1990 ....................................... 106 Figure IV.24 Patent applications for EIIs, by world regions ................................... 107 Figure IV.25: Construction value added, global market shares ............................. 108 Figure IV.26: Global ESCO market, 2015 ........................................................... 109 Figure 0.1 E3ME's modules .............................................................................. 123 Figure 0.2 Main Model Linkages ........................................................................ 124 Figure 0.3: Potential increases in investments related to energy efficiency ............. 141 Figure 0.4 The effects of energy efficiency on public budgets ............................... 160 Figure 0.5 Public budget impacts by Member State in 2030, EUCO30, as a % of GDP
compared to EUCO27) (no crowding out) ........................................................... 185 Figure 0.6 Public budget impacts by Member State in 2030, EUCO33, as a % of GDP
compared to EUCO27) (no crowding out) ........................................................... 185 Figure 0.7 Public budget impacts by Member State in 2030, EUCO35, as a % of GDP
compared to EUCO27) (no crowding out) ........................................................... 186 Figure 0.8 Public budget impacts by Member State in 2030, EUCO40, as a % of GDP
compared to EUCO27) (no crowding out) ........................................................... 186 Figure 0.9 Public budget impacts by Member State in 2030, EUCO30, as a % of GDP
compared to EUCO27) (partial crowding out) ..................................................... 187 Figure 0.10 Public budget impacts by Member State in 2030, EUCO33, as a % of GDP
compared to EUCO27) (partial crowding out) ..................................................... 187 Figure 0.11 Public budget impacts by Member State in 2030, EUCO35, as a % of GDP
compared to EUCO27) (partial crowding out) ..................................................... 188 Figure 0.12 Public budget impacts by Member State in 2030, EUCO40, as a % of GDP
compared to EUCO27) (partial crowding out) ..................................................... 188
List of Tables
Table I-1: Summary of GDP and employment impacts, EU28, % from EUCO27 ........11 Table I-2: Potential health benefits in 2030, EU28, % from EUCO27 scenario ...........12 Table I-3: Potential reductions in energy poverty by 2030 compared to reference based
on three different indicators of energy poverty (thousands of households in the EU,
ambitious scenario) ..........................................................................................13 Table II-1 Primary and final energy consumption in Mtoe, in 2030 ..........................20 Table III-1 Share of investment that is crowded out in partial crowding case, % .....29 Table III-2: Average damages per tonne of emission for the EU25 (excluding Cyprus),
euros ..............................................................................................................33 Table III-3: Average emission coefficients, EU28 ..................................................35 Table III-4: Water withdrawals by generation technology ......................................36 Table III-5 Factors in the budget calculations .......................................................42 Table IV-1: The scale of indirect rebound effects and implications on energy savings
achieved (compared to 2007 baseline), EU28 in 2030 ...........................................50 Table IV-2 EU28 summary of macroeconomic impacts, 2030, % from EUCO27 scenario
......................................................................................................................53 Table IV-3 EU28 unemployment in 2030, absolute difference from EUCO27 scenario
(thousands of people) .......................................................................................56 Table IV-4 GDP by Member State, 2030, % difference from EUCO27 scenario ..........58 Table IV-5 Employment by Member State, 2030, % difference from EUCO27 scenario
......................................................................................................................60

June 2017 6
Table IV-6: EU28 Impacts on sectoral output by 2030, % difference from EUCO27
scenario ..........................................................................................................64 Table IV-7: EU28 Sectoral employment impacts in 2030, % difference from EUCO27
scenario ..........................................................................................................64 Table IV-8: Energy imports as a share of GDP in 2030, % .....................................66 Table IV-9: Largest gas suppliers to selected Member States (% of total gas supply,
2016) ..............................................................................................................67 Table IV-10: GDP impacts in the public financing case (% from EUCO27) ................69 Table IV-11: Employment impacts in the public financing case (% from EUCO27) .....69 Table IV-12: EU28 summary of macroeconomic impacts in public finance variant, 2030,
% from EUCO27 scenario ..................................................................................69 Table IV-13 EU28 Annual health cost impacts, difference from EUCO27 ...................72 Table IV-14: Health impacts by Member State (m€ pa), % difference from EUCO27 in
2030 ...............................................................................................................73 Table IV-15 EU28 Final energy demand by sector, 2030, % from EUCO27 scenario (no
crowding out)...................................................................................................76 Table IV-16 Final energy demand by Member State, 2030, % from EUCO27 scenario (no
crowding out)...................................................................................................77 Table IV-17: GHG emissions in the scenarios, excluding rebound effects (2030, %
change from 1990 levels) ..................................................................................78 Table IV-18: GHG emissions in the scenarios, including rebound and other secondary
effects (2030, % change from 1990 levels) ..........................................................78 Table IV-19: SO2 and NOx impacts in the scenarios (% change from EUCO27, no
crowding out)...................................................................................................79 Table IV-20 Impact on material consumption (excl fuels), 2030, % difference from
EUCO27 scenario ..............................................................................................80 Table IV-21 Changes in water consumption by the power sector in 2030, % difference
from EUCO27 scenario ......................................................................................82 Table IV-22: Real incomes by socio-economic group, 2030, EUCO30 (% difference from
EUCO27 scenario) (no crowding out) ...................................................................84 Table IV-23: Real incomes by socio-economic group, 2030, EUCO30 (% difference from
EUCO27 scenario) (partial crowding out) .............................................................85 Table IV-24: EU real incomes in EUCO30 and EUCO33 scenarios (% difference from
EUCO27 scenario in 2030) .................................................................................86 Table IV-25 Real incomes by socio-economic group, 2030, EUCO30 (% difference from
EUCO27 scenario) .............................................................................................86 Table IV-26: Total reduction in energy poverty (thousands of households) ..............88 Table IV-27: EU28 impact on public budgets, €m difference from EUCO27 scenario, 2030
(current prices) (no crowding out) ......................................................................91 Table IV-28 Impact on public budgets, €m difference from EUCO27 scenario at EU level,
2030 (current prices) (partial crowding out) .........................................................92 Table IV-29: Impacts of the public financing variant on public budgets, % of GDP from
EUCO27 in 2030 ...............................................................................................94 Table IV-30 Total energy consumption (ktoe) / value added (millions of euros) ...... 100 Table IV-31 Total energy cost (millions of euros) / value added (millions of euros),
Cambridge Econometrics, PRIMES .................................................................... 101 Table IV-32 Data on SMEs in the EIIs, 2013 ....................................................... 102 Table IV-33: Energy cost shares by manufacturing industry in basic prices (in % of gross
output) ......................................................................................................... 106 Table V-1 Key results from the analysis (EU28, difference to EUCO27 in 2030) ...... 111 Table V-2: Impacts on EU GDP and employment in 2030, % difference from EUCO27
.................................................................................................................... 112 Table V-3: Potential health benefits in 2030, EU28, difference from EUCO27 scenario
.................................................................................................................... 112

June 2017 7
Table V-4: Summary of environmental impacts, % difference from EUCO27 scenario
.................................................................................................................... 113 Table V-5: Potential reductions in energy poverty by 2030 compared to reference
(thousands of households in the EU, ambitious scenario) ..................................... 114 Table V-6: Impact on public budgets, as % of EU GDP in 2030 (difference from EUCO27)
.................................................................................................................... 115 Table V-7: The scale of indirect rebound effects and implications on energy savings
achieved (compared to 2007 baseline), EU28 in 2030 ......................................... 117 Table V-8: Impacts on EU GDP and employment in 2030, % difference from EUCO27
.................................................................................................................... 118 Table V-9: Impacts of changing the financing method, EU28, 2030 (no crowding out)
.................................................................................................................... 119 Table 0-1 PRIMES reference scenario energy prices, euro 2013/boe ...................... 128 Table 0-2 PRIMES reference scenario CO2 price, euro 2013/tCO2 .......................... 128 Table 0-3 The policy scenarios ......................................................................... 129 Table 0-4 Policy scenario EU-ETS prices, 2013euro/tCO2 ..................................... 130 Table 0-5 GDP impacts of investing in energy efficiency ...................................... 135 Table 0-6 Overview of available methodologies for assessment of the rebound effect
.................................................................................................................... 137 Table 0-7 Previous assessments of the rebound effect ......................................... 138 Table 0-8 Previous research on the impact of energy efficiency on employment ..... 142 Table 0-9: Comparison of results with 2015 study (30% efficiency scenario compared
to reference case, no crowding out) .................................................................. 146 Table 0-10 Data sources for health impacts of air quality ..................................... 147 Table 0-11 Overview of studies on the impact of energy efficiency on the environment
.................................................................................................................... 152 Table 0-12: Water withdrawals by generation technology .................................... 156 Table 0-13 An overview of relevant studies on the impact of energy efficiency on public
budgets ......................................................................................................... 162 Table 0-14 Energy Efficiency and its effects on competitiveness ........................... 165 Table 0-15 Main findings of the literature review ................................................ 169 Table 0-16: Degree of crowding out in each scenario at Member State level (%) .... 174 Table 0-17 Real incomes by socio-economic group, 2030, EUCO27 (no crowding out)
.................................................................................................................... 175 Table 0-18 Real incomes by socio-economic group, 2030, EUCO30 (% difference from
EUCO27 scenario) (no crowding out) ................................................................. 176 Table 0-19 Real incomes by socio-economic group, 2030, EUCO33 (% difference from
EUCO27 scenario) (no crowding out) ................................................................. 177 Table 0-20 Real incomes by socio-economic group, 2030, EUCO35 (% difference from
EUCO27 scenario) (no crowding out) ................................................................. 178 Table 0-21 Real incomes by socio-economic group, 2030, EUCO40 (% difference from
EUCO27 scenario) (no crowding out) ................................................................. 179 Table 0-22 Real incomes by socio-economic group, 2030, EUCO27 (partial crowding out)
.................................................................................................................... 180 Table 0-23 Real incomes by socio-economic group, 2030, EUCO30 (% difference from
EUCO27 scenario) (partial crowding out) ........................................................... 181 Table 0-24 Real incomes by socio-economic group, 2030, EUCO33 (% difference from
EUCO27 scenario) (partial crowding out) ........................................................... 182 Table 0-25 Real incomes by socio-economic group, 2030, EUCO35 (% difference from
EUCO27 scenario) (partial crowding out) ........................................................... 183 Table 0-26 Real incomes by socio-economic group, 2030, EUCO40 (% difference from
EUCO27 scenario) (partial crowding out) ........................................................... 184 Table 0-27 Environmental Indicators, SO2 & NOx, EUCO27, 2030 ......................... 189 Table 0-28 Environmental Indicators, SO2 & NOx, EUCO30, 2030, (% difference from
EUCO27 scenario) ........................................................................................... 190

June 2017 8
Table 0-29 Environmental Indicators, SO2 & NOx, EUCO33, 2030, (% difference from
reference scenario) ......................................................................................... 191 Table 0-30 Environmental Indicators, SO2 & NOx, EUCO35, 2030, (% difference from
reference scenario) ......................................................................................... 192 Table 0-31 Environmental Indicators, SO2 & NOx, EUCO40, 2030, (% difference from
reference scenario) ......................................................................................... 193 Table 0-32 Mapping of country abbreviations ..................................................... 194

June 2017 9
Glossary of acronyms and abbreviations Commission European Commission, unless specified otherwise
DG Directorate-General
Directive Energy Efficiency Directive, unless specified otherwise
EcoDesign EcoDesign Directive (2009/125/EC)
EE Energy efficiency
EEA European Economic Area
EED Energy Efficiency Directive (2012/27/EU)
EPBD Energy Performance of Buildings Directive (2010/31/EU)
ESD Effort Sharing Decision (DECISION No 406/2009/EC)
ETS Emissions Trading System
EU PDA EU Project Development Assistance
FI Energy agency or regulator
GHG Greenhouse Gas
GDP Gross Domestic Product
GVA Gross Value Added
ICT Information and Communication Technologies
IEM Internal Energy Market legislation
ktoe kilotonnes of oil equivalent
MS Member State(s)
MSR Market Stability Reserve under the ETS
mtoe Million tonnes of oil equivalent
NEEAP National Energy Efficiency Action Plan
RES Renewable Energy
SME Small- and medium-sized enterprise

June 2017 10
Executive Summary
1.1 Purpose and scope of this report
This report sets out the potential positive and negative impacts of improvements to
energy efficiency in Europe. The analysis presented in this report covers the
macroeconomic, social and environmental impacts that could come about through
increasing the EU’s 2030 target for energy efficiency beyond a level of 27% in
comparison to baseline projections, to 30% or beyond. Parts of this report (notably the
literature review included in Appendix D) build also on the work carried out for a previous
study for the European Commission1, which focused on the economic, environmental
and social impacts of improved energy efficiency in buildings. This is referred to in the
text as ‘the EPBD report’.
Successive studies have shown that energy efficiency offers many of the most cost-
effective options for meeting global greenhouse gas emission reduction targets. In many
cases, energy efficiency measures have been shown to be ‘negative cost’, meaning that
it would be economically advantageous to implement them. In this analysis, a wide
range of potential effects is considered, covering the three pillars of economic, social
and environmental sustainability.
In this report, four different scenarios are assessed, based upon the policy options set
out in the EED Impact Assessment (EC, 2016). The timeframe for the analysis is 2030.
Some of the results of the work undertaken have been included already in the EED
Impact Assessment. This report offers a more detailed explanation of the methodology
used and additional results from scenarios produced by the E3ME model which are not
fully comparable to the results of scenarios presented in the EED Impact Assessment.
The inputs for each scenario have been derived from PRIMES model results, providing
consistency with the full Impact Assessment. Six impact areas have been covered:
▪ Economy and labour market
▪ Health
▪ The environment
▪ Social cohesion
▪ Public budgets
▪ Industrial competitiveness
All other factors apart from energy efficiency policy are assumed to remain constant
across the scenarios, so that the model results isolate the effects of the specific policy
changes. The investments are assumed to be self-financed, meaning that the agents
that benefit from the energy efficiency must pay the up-front costs, leading to:
• A substitution away from consumption of other goods (households)
• Additional costs met through increases in final product prices (businesses)
• An increase in VAT rates to fund public investment (government)
An additional variant, in which all the investment is financed by the public sector (with
tax increases to fund it) is also considered. This provides a closer comparison with a
previous analysis carried out in 20152.
Two further variants of the scenarios are presented throughout this report, based on
different assumptions about how the European economy might be able to meet the
challenge of large-scale improvements to energy efficiency. In the first set it is assumed
that firms can produce and install new efficient equipment using existing spare capacity,
1 https://ec.europa.eu/energy/sites/ener/files/documents/final_report_v4_final.pdf 2 http://ec.europa.eu/energy/sites/ener/files/documents/CE_EE_Jobs_main%2018Nov2015.pdf

June 2017 11
meaning that no other economic production is ‘crowded out’. In the second set of results,
some of the additional economic production replaces production in other sectors.
1.2 Economic and labour market impacts
Macro economy
Implementing measures to meet the energy efficiency targets has a positive impact on
both GDP and employment. As the extent of energy efficiency improvements increase,
so do the positive impacts on GDP and employment. In the scenario with a 30% energy
efficiency target, GDP increases by 0.4% compared to the (27% target) by 2030 and
employment increases by 0.4%. In the most ambitious EUCO40 scenario, there is the
potential for GDP to increase by more than 4% and employment by more than 2%.
Many of the jobs would be created in sectors directly relevant to energy efficiency (e.g.
construction, engineering) but there would also be increases in employment in the wider
economy. Unemployment in the EU could be reduced by up to 3 million people by 2030.
Table I-1: Summary of GDP and employment impacts, EU28, % from EUCO27
Degree of crowding out
EUCO30 EUCO33 EUCO35 EUCO40
Efficiency target 30% 33% 35% 40%
GDP No crowding out 0.4 1.5 2.1 4.1 Partial crowding out 0.4 1.3 1.6 2.2
Employment No crowding out 0.2 0.7 1.0 2.1
Partial crowding out 0.2 0.6 0.9 1.4
Source(s): E3ME, Cambridge Econometrics
The degree of crowding out is clearly important in determining the macroeconomic
outcomes. If European industry is able to increase production to the levels required to
manufacture and install the energy efficient equipment, then the full benefits could be
realised. If investment in energy efficiency displaces other production, however, around
half of the benefits could be lost. While the actual degree of crowding out is uncertain,
policy makers could reduce it by signalling the ambition clearly to companies in advance;
they would then be able to take a view on the prospective increases in demand. Ensuring
an adequately skilled labour force could also mitigate potential crowding out.
There are also other economic benefits. Investment could increase substantially and
household consumption could also increase due to the incomes earned by the additional
people in employment. Reducing imports of fossil fuels would boost Europe’s trade
balance, and also improve the energy security of Member States that are exposed to a
highly concentrated source of supply for gas.
The sectors that benefit the most in the scenarios are those that produce and install
energy efficient equipment. These are principally the construction and engineering
sectors, where by 2030 output could increase by 2.5% compared to the reference case
in the 30% energy efficiency increase scenario and by more than 10% in the more
ambitious cases. A necessary condition for realising these increases is that companies
in these sectors have the capacity to increase production.
Public budgets
A more ambitious target for energy efficiency would have a positive effect on Member
States’ public sector budget balances. Meeting the energy efficiency targets set in the
June 2017 12
scenarios would impact on public budgets in several different ways. For example, the
public sector must fund some of the energy efficiency improvements (e.g. those in public
services) but would later benefit from lower energy bills. However, indirect effects would
have much larger impacts on public budgets. For example, as employment increases,
revenues from labour taxes and workers’ social contributions increase and social welfare
payments will be reduced.
The positive effects on public sector budget balances could be as high as 2% of GDP on
average in the EU. When compared with the 3% ceiling on budget deficits imposed by
Europe’s Stability and Growth Pact, this is a substantial amount.
Industrial competitiveness
Impacts on industrial competitiveness focus on the energy intensive industries in
Europe. Although these sectors account for a relatively small share of GDP they often
play an important role in the supply chains for manufactured goods (including some
energy efficient equipment). Even in a reference scenario, these sectors reduce their
use of energy (per unit of output) consistently over the period to 2050. However, in the
scenarios where the higher energy efficiency targets are met, firms in these sectors
reduce their use of energy further and may therefore see a boost to competitiveness.
1.3 Health impacts
The potential of energy efficiency measures to generate health-related cost savings is
considerable. The extent of cost savings related to healthcare costs, morbidity and
mortality are affected by the scale of investment in energy efficiency: greater savings
are derived from greater levels of investment, although it the relationship is not linear.
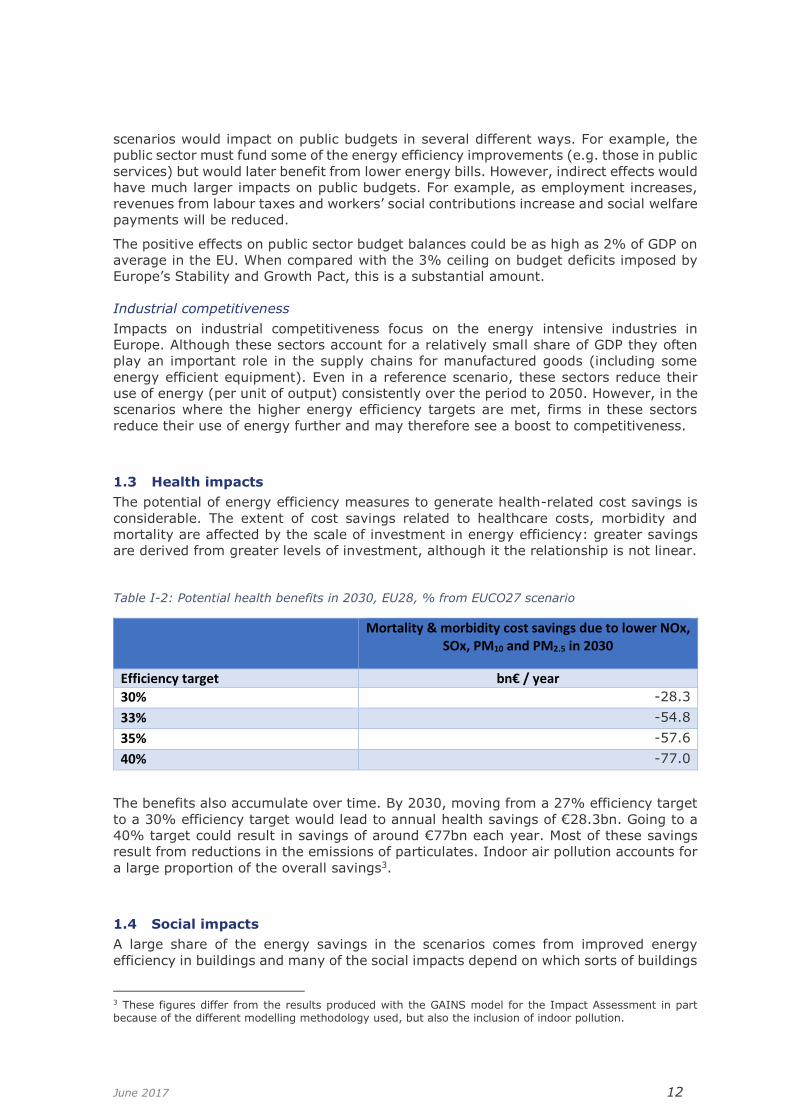
Table I-2: Potential health benefits in 2030, EU28, % from EUCO27 scenario
Mortality & morbidity cost savings due to lower NOx,
SOx, PM10 and PM2.5 in 2030
Efficiency target bn€ / year
30% -28.3
33% -54.8
35% -57.6
40% -77.0
The benefits also accumulate over time. By 2030, moving from a 27% efficiency target
to a 30% efficiency target would lead to annual health savings of €28.3bn. Going to a
40% target could result in savings of around €77bn each year. Most of these savings
result from reductions in the emissions of particulates. Indoor air pollution accounts for
a large proportion of the overall savings3.
1.4 Social impacts
A large share of the energy savings in the scenarios comes from improved energy
efficiency in buildings and many of the social impacts depend on which sorts of buildings
3 These figures differ from the results produced with the GAINS model for the Impact Assessment in part because of the different modelling methodology used, but also the inclusion of indoor pollution.
June 2017 13
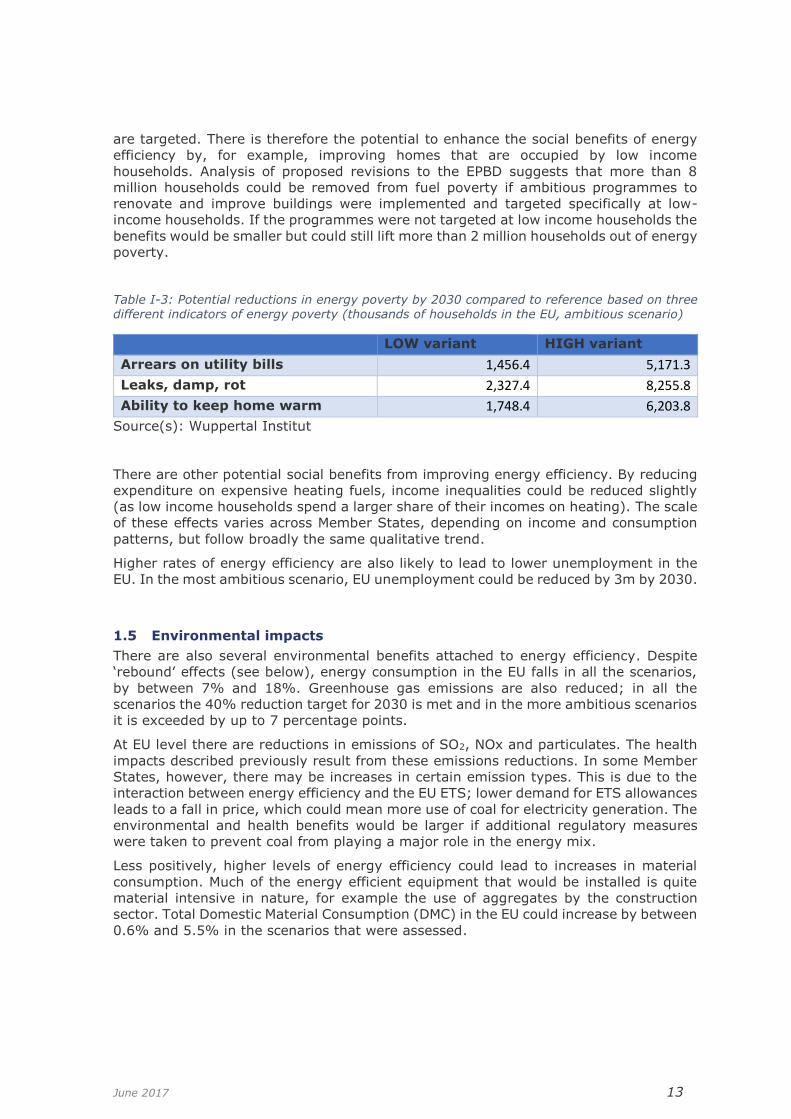
are targeted. There is therefore the potential to enhance the social benefits of energy
efficiency by, for example, improving homes that are occupied by low income
households. Analysis of proposed revisions to the EPBD suggests that more than 8
million households could be removed from fuel poverty if ambitious programmes to
renovate and improve buildings were implemented and targeted specifically at low-
income households. If the programmes were not targeted at low income households the
benefits would be smaller but could still lift more than 2 million households out of energy
poverty.
Table I-3: Potential reductions in energy poverty by 2030 compared to reference based on three different indicators of energy poverty (thousands of households in the EU, ambitious scenario)
LOW variant HIGH variant
Arrears on utility bills 1,456.4 5,171.3
Leaks, damp, rot 2,327.4 8,255.8
Ability to keep home warm 1,748.4 6,203.8
Source(s): Wuppertal Institut
There are other potential social benefits from improving energy efficiency. By reducing
expenditure on expensive heating fuels, income inequalities could be reduced slightly
(as low income households spend a larger share of their incomes on heating). The scale
of these effects varies across Member States, depending on income and consumption
patterns, but follow broadly the same qualitative trend.
Higher rates of energy efficiency are also likely to lead to lower unemployment in the
EU. In the most ambitious scenario, EU unemployment could be reduced by 3m by 2030.
1.5 Environmental impacts
There are also several environmental benefits attached to energy efficiency. Despite
‘rebound’ effects (see below), energy consumption in the EU falls in all the scenarios,
by between 7% and 18%. Greenhouse gas emissions are also reduced; in all the
scenarios the 40% reduction target for 2030 is met and in the more ambitious scenarios
it is exceeded by up to 7 percentage points.
At EU level there are reductions in emissions of SO2, NOx and particulates. The health
impacts described previously result from these emissions reductions. In some Member
States, however, there may be increases in certain emission types. This is due to the
interaction between energy efficiency and the EU ETS; lower demand for ETS allowances
leads to a fall in price, which could mean more use of coal for electricity generation. The
environmental and health benefits would be larger if additional regulatory measures
were taken to prevent coal from playing a major role in the energy mix.
Less positively, higher levels of energy efficiency could lead to increases in material
consumption. Much of the energy efficient equipment that would be installed is quite
material intensive in nature, for example the use of aggregates by the construction
sector. Total Domestic Material Consumption (DMC) in the EU could increase by between
0.6% and 5.5% in the scenarios that were assessed.

June 2017 14
1.6 Key factors in implementing the measures
Throughout the analysis, several themes emerge that influence the results across the
different impact areas and could have important policy implications:
• Rebound effects – Rebound effects are closely linked to the economic benefits
described above. They mean that the full energy savings are not realised
because, for example, the incomes generated in producing and installing energy
efficiency equipment may be spent on other products that require energy to
produce. While rebound effects reflect better economic and social outcomes, they
may lead to worse environmental outcomes, thus representing a trade-off
between benefits.
• Crowding out effects and constraints on production – If European firms are not
able to increase production in response to higher energy efficiency targets, then
the positive impacts on the economy and public budgets could be smaller. The
scenario variants assessed in this report consider a case where European firms
are only able to meet some of the additional demand, based on Eurostat data on
capacity utilisation. The results show that almost half the benefits could be lost.
• Financing the energy efficiency – How to finance the measures remains a key
question. This report does not attempt to answer the question of how different
financing measures might encourage the uptake of energy efficiency, but it does
consider how the split between public and private financing might influence the
economic impacts. The results from the exercise show that the choice of
financing method determines how the benefits of energy efficiency could be
shared between the public and private sectors.
1.7 Conclusions and policy measures
This report attempts to quantify many of the multiple benefits of energy efficiency that
have been identified by the IEA and others. It covers potential costs as well as benefits
but shows that, for the EU as a whole and for most of its Member States, the benefits
largely outweigh the costs. These benefits cover all three of the economic, social and
environmental spheres.
Several important policy measures have emerged from the analysis. In order to
maximise the potential benefits from energy efficiency, the following should be
considered:
• The EED and related policies must be implemented fully and properly enforced;
otherwise results will be weaker across all impact areas. The modelling results
show clearly that the higher the degree of energy efficiency that is achieved, the
more positive the results in most impact areas.
• There is an important question about how energy efficiency investment will be
financed. Aside from the crucial question of how to incentivise energy efficiency
improvements to make sure that the targets are met (especially for the most
ambitious 40% scenario), results in this report show that how the benefits of
energy efficiency are shared will depend on the financing mechanism.
• Competitiveness and economic benefits will be maximised if the energy efficient
equipment and materials are manufactured domestically (within the EU). Many
of the economic benefits accrue because spending on imported fuels is diverted
towards other areas of spending, not necessarily related to energy efficiency.
Although not assessed in this report, in the more ambitious scenarios it is
possible that a larger domestic market would incentivise more firms to locate
production in the EU, enhancing these benefits.

June 2017 15
• The potential crowding out of economic activities remains a key concern in the
more ambitious scenarios. If ambitious targets were to be met, firms that
manufacture and install energy efficient equipment would need to ensure that
they had adequate capacity to meet market demands. Providing advance
warning of future demands and ensuring a suitably skilled workforce will assist
in the process.
• The impacts on social welfare and income distribution could be enhanced if there
were specific measures to target energy efficiency in buildings at low income
households. Such measures could also reduce fuel poverty rates across the EU
by around 8 million households.
• The environmental impacts depend not only on the amount of energy efficiency
that is implemented but also what happens in the wider energy system. Most
notably, if more energy efficiency leads to a lower EU ETS price, this could
encourage more use of coal-fired power generation. To realise all the potential
benefits of energy efficiency, supporting policy measures will likely be required.
In summary, the EED provides the framework for advances in energy efficiency across
Europe which, as this report shows, could result in substantial economic, social and
environmental benefits. The challenge for policy makers is to further design specific
measures that will realise the full potential of the possible benefits, which may vary
between Member States. Most important, however, is to implement policy that ensures
that the energy efficiency improvements are actually carried out.

June 2017 16
Part I. Introduction
1 Introduction to the project
1.1 Overview
This document presents the final report for:
Study for a comprehensive assessment of the macro-level and sectoral impacts of
Energy Efficiency policies
The study team was led by Cambridge Econometrics and included Ernst & Young Special
Business Services (EY) and SQ Consult.
The report presents the full set of results from the study and describes the methodology
that was used in the assessment. The detailed literature review that was carried out for
the study is also provided in the appendices of this report.
1.2 Background to the study
The efficient use of energy is recognised as a key pillar of energy policy in the EU.
‘Energy Efficiency First’ is a central element of the Energy Union, and energy efficiency
sits alongside GHG reduction ambitions and renewables targets as part of the EU’s
overall climate and energy policy package. The Energy Efficiency Directive (2012/27/EU
and 2013/12/EU4, hereafter the EED) and the 2030 framework for climate and energy
policies have provided targets for reducing energy consumption for the years 2020 and
a first indication for 2030.
When first introduced in 2012, the EED established a set of binding measures to help
the EU reach its 20% energy efficiency target by 2020 and improve energy efficiency
beyond 2020. These measures cover all stages of the energy chain from its production
to its final consumption, and were informed by EU’s 2020 Energy Strategy objectives to
reduce greenhouse gases by at least 20%, to increase the share of renewable energy
in the EU's energy mix to at least 20% of consumption and to reduce energy demand
by at least 20% compared to baseline projections. To reach the EU's 20% energy
efficiency target by 2020, individual EU countries were required to set their own
indicative national energy efficiency targets. The Energy Roadmap 2050 was introduced
to provide a practical, independent and objective analysis of pathways to achieve a low-
carbon economy in Europe, in line with the energy security, environmental and economic
goals of the European Union.
On 30 November 2016, in the context of the “Clean Energy for All Europeans” package,
the Commission proposed amendments to the EED, including a new 30% energy
efficiency target for 2030, extending beyond 2020 the obligation to save 1.5% of energy
each year, and improving metering and billing of energy consumption for heating and
cooling customers. The overall legislative proposals included in the “Clean Energy for All
Europeans” package have three main goals: putting energy efficiency first, achieving
global leadership in renewable energies and providing a fair deal for consumers. The
key implementing measures cover energy efficiency, renewable energy, the design of
the electricity market, security of electricity supply and governance rules for the Energy
Union. The package also provides measures to encourage public and private investment,
to promote EU industrial competitiveness and to mitigate the societal impact of the clean
energy transition.
4 Available at: http://eur-lex.europa.eu/legal-content/EN/ALL/?uri=OJ:L:2012:315:TOC; http://eur-lex.europa.eu/legal-content/EN/TXT/?uri=celex:32013L0012

June 2017 17
In addition to the EED, relevant energy efficiency legislation at the European level
includes the Energy Performance of Buildings Directive (2010/31/EU, hereafter EPBD)
and the Ecodesign and Energy Labelling framework directives (2009/125/EC and
2010/30/EU). The EPBD addresses energy consumption in buildings, among others by
setting a target that all new buildings must be nearly zero energy buildings by 31
December 2020, and by requiring EU countries to set minimum energy performance
requirements for new buildings and for major building renovations or the replacement
or retrofit of building elements. The Ecodesign and Energy Labelling framework
directives set standards and labelling requirements for energy consumption for a range
of appliances used by households and commercial organisations. There are also many
measures that have been enacted at Member State or subnational level, covering a
range of different sectors.
Parts of this report (notably the literature review included in Appendix D) build on the
work carried out for a previous study for the European Commission, Directorate-General
for Energy (“The macroeconomic and other benefits of energy efficiency”, Contract no.
ENER/C3/2013-484/03/FV2015-523, submitted in August 20165), which focused on the
economic, environmental and social impacts of improved energy efficiency in buildings.
This is referred to in the text as ‘the EPBD report’. While the present report does not
aim to duplicate the findings from the EPBD report, there is a very large contribution to
energy efficiency from buildings in the scenarios assessed in later chapters, and hence
many of the findings from the EPBD report are also relevant here. However, the relative
importance of the different impact areas is not the same as in the EPBD report (e.g.
social impacts are more important when considering buildings; competitiveness impacts
can be more important when considering industrial energy efficiency).
Some of the results presented in this report fed in to a previously published Impact
Assessment (European Commission, 2016) for the proposal to amend the EED published
in November 2012 in the context of the “Clean Energy for All Europeans” package
(“Proposal for a Directive of the European Parliament and the Council amending
Directive 2012/27/EU on Energy Efficiency, which assessed a range of options for
achieving improved energy efficiency6). Different variants of target reductions of
primary energy by 2030 compared to a baseline scenario performed in the year 2007
were assessed: 27%, 30%, 33%, 35% and 40%. The analysis showed that as the level
of energy efficiency in 2030 increased, the investment requirements also increased, with
large increases in investment needed in the more ambitious cases. In addition to the
E3ME analysis presented in this report, the GEM-E3 model was also used to assess the
scenarios in the Impact Assessment. The GEM-E3 results showed that there could be
positive impacts on economic growth and employment, but the positive results depend
on how the energy efficiency investment is financed. Both the models found a positive
impact on the security of Europe’s energy supply, affecting the scale of gas imports in
particular.
Other previous studies of the EED include an evaluation of the EU Framework for
Metering and Billing of Energy Consumption (EC, SWD(2016) 399 final), an overview
and assessment of good practice in energy efficiency, and an evaluation of Articles 6
and 7 of the Energy Efficiency Directive (2012/27/EU) (EC, SWD(2016) 402 final), which
set out the requirements for the public sector in EU countries to purchase energy
efficient buildings, products and services; and for energy distributors and retail energy
sales companies to achieve an additional 1.5% energy savings per year through the
implementation of energy efficiency measures until 2020.
5 https://ec.europa.eu/energy/sites/ener/files/documents/final_report_v4_final.pdf 6 See http://eur-lex.europa.eu/legal-content/EN/TXT/PDF/?uri=CELEX:52016SC0405&from=EN

June 2017 18
1.3 The ‘multiple benefits’ of energy efficiency
Successive studies have shown that energy efficiency offers many of the most cost-
effective options for meeting global emission reduction targets. In many cases, energy
efficiency measures have been shown to be ‘negative cost’, meaning that it would be
economically advantageous to implement them as consumers will save money in the
long run.
The IEA’s authoritative report ‘Capturing the multiple benefits of energy efficiency’ (IEA,
2014) shows that the potential benefits from improved energy efficiency are not only
socio-economic but could help to address a range of political, social, economic and
environmental issues. In this study, we have divided these benefits into six impact
areas:
▪ economy and labour market
▪ health
▪ the environment
▪ social impacts
▪ public budgets
▪ industrial competitiveness
It is important to note that, although this report is structured around these six impact
categories, there is considerable cross-over and interaction between many of them.
2 Introduction to this report
The analysis in this report estimates the positive and negative impacts of improvements
in energy efficiency that could come about through a reduction of primary energy
consumption, compared to a 2007 baseline projection, of 27%, 30%, 33%, 35% and
40% by 2030. The specific policy scenarios are described in Part II and the approach
that was used to assess each of the six impact areas is described in Part III. Part IV
presents the detailed results from the analysis and the key policy messages are outlined
in Part V.
The appendices include further information about the E3ME macroeconomic model that
was core to the analysis, along with the literature review that was carried out early in
the study to inform its methodology.

June 2017 19
Part II. Scenarios
1 Introduction
In this report, the E3ME model has been applied to assess a range of scenarios related
to the Energy Efficiency 2016 Impact Assessment (SWD(2016) 405 final). E3ME is a
computer-based model with three modules – energy, environment and economy - that
is used to provide insights in interactions between these three modules and for
understanding and comparing the impact of different policy options7.
Six different scenarios were assessed. These include a reference scenario and five
different policy scenarios with different levels of ambition for energy efficiency policy.
The reference scenario is described as the ‘reference’ option and is discussed further in
the next section. The following sections then introduce and describe the wide range of
policy ‘measures’ that were considered and the five energy efficiency target scenarios
that included a selection of the different policy measures. These five energy efficiency
target scenarios form the scenarios that are assessed later in this report.
The scenario descriptions provided in this chapter are taken from European Commission
documentation8, calibrated or amended where necessary for consistency with the
modelling that was carried out.
2 Reference option
The reference option means no additional measures beyond the existing ones, including
continued implementation of the current EED and related regulatory and non-regulatory
instruments. All the EU initiatives in relation to energy efficiency are unchanged in the
reference option. Related legislation, such as the EPBD, are expected to continue in their
current form. It is to be noted, however, that the reference option doesn't mean
automatically that the current policies would remain and continue in the future with the
same intensity. This is notably the case for the provisions of the Art. 7 of the EED, which
in the current legislation is not supposed to continue after 2020.
The reference option used for the purpose of this report was developed with the PRIMES
model into the 2016 Reference Scenario9, which forms the starting point for the analysis
with the E3ME model that is at the heart of the analysis conducted in this study (see
Appendix A). Inputs to E3ME, including both assumptions (e.g. energy prices, economic
growth rates) and the full energy balances are taken from the detailed PRIMES model
spreadsheets.
The PRIMES Reference Scenario indicates that, with no new policies beyond those
adopted by the end of 2014, there is only an 18.4% reduction in primary energy
consumption compared to the 2007 baseline projections by 2020 (hence missing the
2020 indicative target of 20%). It is assumed that national policies to achieve the
required savings under Article 7 are mostly phased out after 2020 because of the expiry
of this article. A 23.9% primary energy consumption reduction compared to the 2007
baseline is projected for 203010. Renewable energy would account for 24.3% of gross
final energy consumption and greenhouse gas emissions would be reduced by 35.2%
7 A short description of E3ME is included in Appendix A. 8 Primarily the Energy Efficiency 2016 Impact Assessment (SWD(2016) 405 final). 9 https://ec.europa.eu/energy/en/data-analysis/energy-modelling 10 2007 Baseline modelled with PRIMES projected for 2030 primary energy consumption reaching 1,436 mtoe and final energy consumption 1,081 mtoe.

June 2017 20
(37.7% in the ETS sectors and 23.7% in the Effort Sharing Decision (ESD) sectors) by
2030.
3 Energy efficiency target scenarios
The reference scenario used in the PRIMES modelling assumes a continuation and
implementation of the energy efficiency framework beyond 2020. This includes, for
example, the renovation of public buildings under Article 5 of the EED or the further
development of the ESCO market according to Article 18. However, as described above,
Article 7 will not be obligatory post-2020.
To achieve energy efficiency savings greater than 23.9% by 2030 in the reference
scenario, energy consumption must decrease more rapidly than current policy measures
are projected to achieve. The PRIMES modelling results presented in the EED Impact
Assessment (European Commission, 2016) show the required reductions in final energy
demand or consumption (compared to the PRIMES reference scenario) that are needed
to achieve each of the energy efficiency target scenarios. These results are shown in
Table II-1 (below).
Table II-1 Primary and final energy consumption in Mtoe, in 2030
EUCO27 EUCO30 EUCO+33 EUCO+35 EUCO+40
Primary energy
consumption 1,369 1,321 1,260 1,220 1,129
Final energy
consumption 1,031 987 929 893 825
Reduction in PEC
compared to
reference scenario
-67 -115 -176 -216 -307
Reduction in FEC
compared to
reference scenario
-50 -94 -152 -189 -256
Source(s): PRIMES
The data presented in Table II-1 (above) cover the required energy consumption
reductions from all sectors under the different policy scenarios and represent savings
that are needed in addition to the existing energy efficiency framework that is
represented in the reference scenario. These additional savings in 2030 will need to be
compared with the anticipated impacts of the proposed, new energy efficiency policies.
The energy efficiency targets will also need to be assessed within the framework of the
other targets that have been agreed by the European Council and that are included as
modelling assumptions in the analysis of each of the energy efficiency target scenarios.
These include:
▪ An overall reduction in greenhouse gas (GHG) emissions (at least 40% with respect
to 1990).
▪ A reduction in GHG emissions in ETS sectors (43% with respect to 2005, including
the Market Stability Reserve and the proposed revision of the linear reduction
factor).
▪ A reduction in GHG emissions in sectors covered by the Effort Sharing Decision (30%
with respect to 2005).
June 2017 21
▪ A minimum share of renewable energy in final energy consumption (at least 27%).
The different policy areas reinforce each other and were analysed as a package. The
ETS and Effort Sharing Decision targets in 2030 are met by construction in the EUCO27
and EUCO30 scenarios, but overshoot in some of the more ambitious scenarios. In
contrast to the reference scenario, all policy scenarios are consistent with the EU's long-
term GHG reduction objective for 2050.
A wide range of policy alternatives was considered in the different scenarios. These
included both regulatory and non-regulatory measures, as well as action at different
spatial levels (EU, national, regional and local).
All measures build upon or amend the current EED and are linked explicitly to a series
of drivers for policy development in the Impact Assessment. In the PRIMES modelling,
different policy measures were packaged into broader sets of policy options, which
enable the delivery of energy efficiency targets that form the basis for the analysis in
this report.
3.1 Policy packages and energy efficiency target scenarios
The energy efficiency targets are achieved by simulating a realistic mix of European and
national energy efficiency policies in all sectors which was intensified with higher energy
efficiency levels in 2030: residential, tertiary, industrial, transport and energy supply.
This policy mix involves policy instruments, including carbon pricing to reduce emissions
in the ETS and non-CO2 emissions in the non-ETS sectors, performance standards,
policies leading to a reduction of market barriers, incentives and obligations related to
energy efficiency. These policies are implemented in a coherent manner across Member
States, taking into account the current policy framework (as developed in the reference
scenario).
The full Impact Assessment used results from the PRIMES model to show the impacts
of different energy efficiency levels on the energy system (e.g. the energy mix). In the
modelling, however, energy efficiency policies were depicted only in an aggregated and
stylised manner, which does not allow quantifying the achieved savings or costs of
individual policy measures (e.g. Article 7 or 9-11 of the EED).
3.2 Policy options
The first policy option is to achieve a target of 27% reduction of primary energy
consumption (compared to the 2007 baseline). This option corresponds to the minimum
energy efficiency ambition level agreed by the European Council in 2014, and can
therefore be considered to be the real "baseline" for the analysis in this report. As a
consequence, most the results are presented as a comparison to, or as a difference to,
the impacts corresponding to an energy efficiency target of 27%. Four further policy
options explore 2030 targets of 30%, 33%, 35% and 40% reductions in primary energy
consumption (compared to the 2007 baseline). A sensitivity with a 30% energy
efficiency level in 2030 and a RES share of 30% was also included which makes it closer
to the 2030 renewable energy target called for by the European Parliament.
The five policy scenarios which reflect the different policy options are called respectively
EUCO27, EUCO30, EUCO33, EUCO35 and EUCO4011. Comparing the policy scenarios
against reference scenario shows the costs (notably investment expenditure) necessary
to achieve the 2030 GHG targets, Effort Sharing Regulations and RES target all together.
11 In the Impact Assessment, these scenarios were referred to as EUCO27, EUCO30, EUCO+33, EUCO+35 and EUCO+40.

June 2017 22
Likewise, benefits shown by each policy scenario represent the combined benefits of
achieving all the targets.
To achieve a rate of at least 27% of energy efficiency, the policy scenarios assume for
the transport sector policies and measures that are currently under consideration at
European level. For the other final demand sectors, various standards and policies were
intensified in the model to reflect the proposed updates to the EED described in Appendix
C, to reflect current policies and the proposed policy changes to achieve different energy
efficiency targets by 2030. The adjustments or calibration of the E3ME model are made
to ensure consistency with the results from the PRIMES model. The adjustments
concern:
• Intensified standards: eco-design, building codes and CO2 standards
• Increase of Energy Efficiency Values, representing yet to be identified policy
measures aiming at energy savings
• Lower behavioural discount rates to address increased energy efficiency levels in
2030
• Increase in the efficiency of the transport system to reflect the effect of additional
transport measures
• Changes in the primary energy factor resulting from the uptake of heat pumps
and on-site renewable energy.
A more detailed description of these adjustments is available in Appendix C. A more
detailed description of the approaches and definition of the policy scenarios is available
in Annex 4 of the EED Impact Assessment.
June 2017 23
Part III. Methodological Approach
1 Introduction
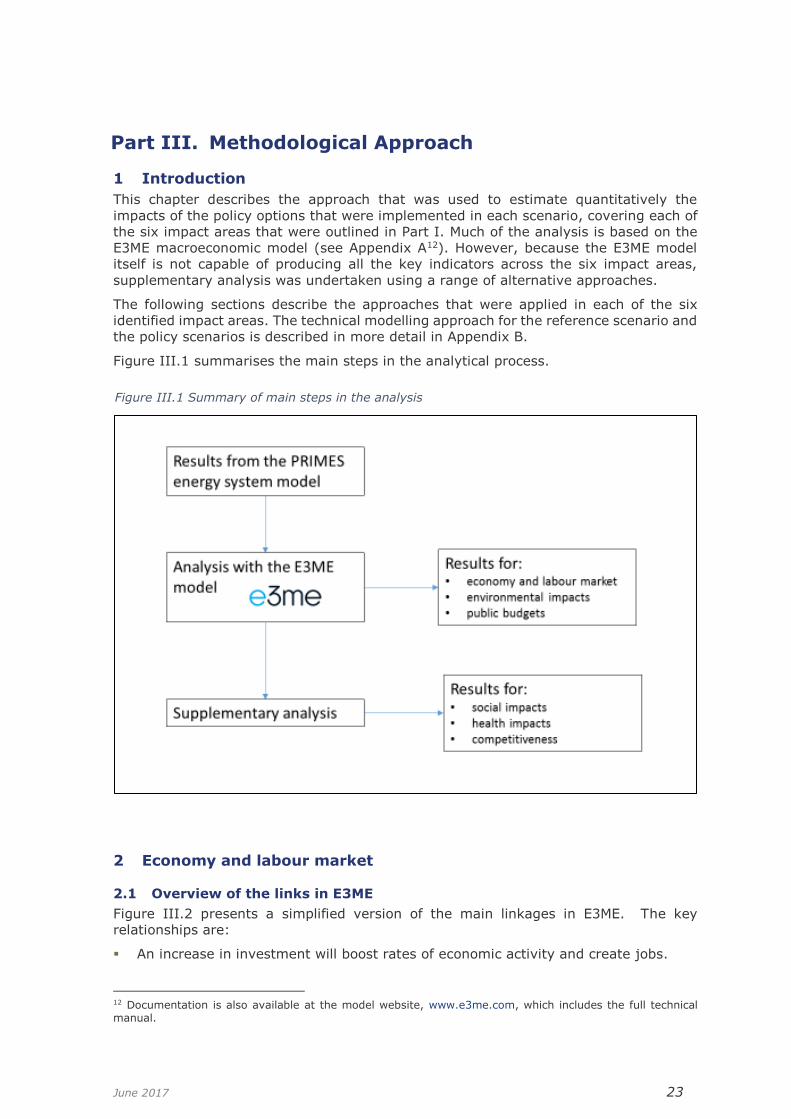
This chapter describes the approach that was used to estimate quantitatively the
impacts of the policy options that were implemented in each scenario, covering each of
the six impact areas that were outlined in Part I. Much of the analysis is based on the
E3ME macroeconomic model (see Appendix A12). However, because the E3ME model
itself is not capable of producing all the key indicators across the six impact areas,
supplementary analysis was undertaken using a range of alternative approaches.
The following sections describe the approaches that were applied in each of the six
identified impact areas. The technical modelling approach for the reference scenario and
the policy scenarios is described in more detail in Appendix B.
Figure III.1 summarises the main steps in the analytical process.
2 Economy and labour market
2.1 Overview of the links in E3ME
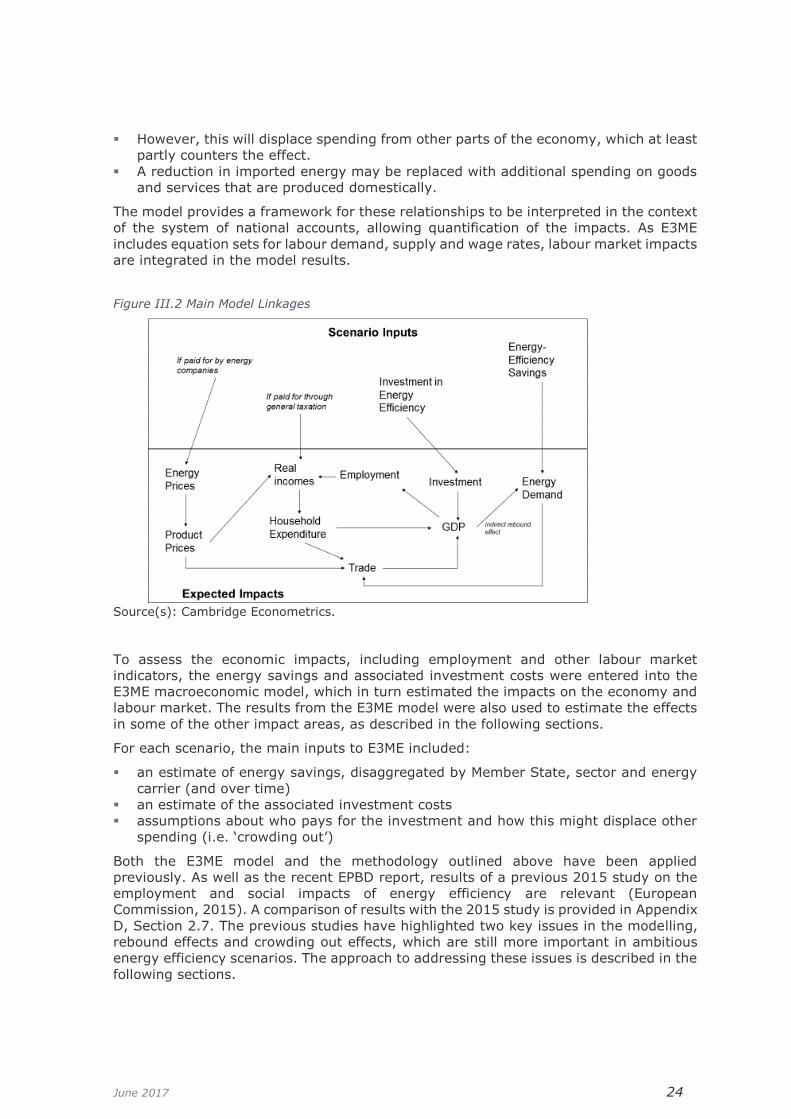
Figure III.2 presents a simplified version of the main linkages in E3ME. The key
relationships are:
▪ An increase in investment will boost rates of economic activity and create jobs.
12 Documentation is also available at the model website, www.e3me.com, which includes the full technical manual.
Figure III.1 Summary of main steps in the analysis
June 2017 24
▪ However, this will displace spending from other parts of the economy, which at least
partly counters the effect.
▪ A reduction in imported energy may be replaced with additional spending on goods
and services that are produced domestically.
The model provides a framework for these relationships to be interpreted in the context
of the system of national accounts, allowing quantification of the impacts. As E3ME
includes equation sets for labour demand, supply and wage rates, labour market impacts
are integrated in the model results.
Source(s): Cambridge Econometrics.
To assess the economic impacts, including employment and other labour market
indicators, the energy savings and associated investment costs were entered into the
E3ME macroeconomic model, which in turn estimated the impacts on the economy and
labour market. The results from the E3ME model were also used to estimate the effects
in some of the other impact areas, as described in the following sections.
For each scenario, the main inputs to E3ME included:
▪ an estimate of energy savings, disaggregated by Member State, sector and energy
carrier (and over time)
▪ an estimate of the associated investment costs
▪ assumptions about who pays for the investment and how this might displace other
spending (i.e. ‘crowding out’)
Both the E3ME model and the methodology outlined above have been applied
previously. As well as the recent EPBD report, results of a previous 2015 study on the
employment and social impacts of energy efficiency are relevant (European
Commission, 2015). A comparison of results with the 2015 study is provided in Appendix
D, Section 2.7. The previous studies have highlighted two key issues in the modelling,
rebound effects and crowding out effects, which are still more important in ambitious
energy efficiency scenarios. The approach to addressing these issues is described in the
following sections.
Figure III.2 Main Model Linkages

June 2017 25
2.2 Rebound effects
Rebound effects are increases in energy demand that result from the economic impacts
of implementing energy efficiency. They mean that the expected energy savings are not
fully realised. For example, if a household installs an efficient boiler they will not need
to purchase as much energy as previously, but may instead purchase other goods that
require energy in their production. Thus, while energy consumption falls, it will not fall
by as much as the additional savings from the efficient boiler alone.
Rebound effects are often split into direct and indirect effects. Direct rebound effects
relate to the specifics of the individual products (e.g. a more efficient boiler may be used
more often) whereas indirect rebound effects relate to redirected spending. The
literature review in Appendix D (Sections 2.2 and 2.5) highlights the importance of
accounting for rebound effects. At the macro level, rebound effects have been shown to
reduce the initial energy savings by up to 50% (Barker et al, 2009) while some studies
that consider specific sectors have found rebounds of more than 100% (e.g. Freire-
González, 2017).
In the modelling in this report, the direct energy savings are consistent with the results
from the PRIMES model and so follow the same assumptions on direct rebound effects.
The approach adopted in E3ME is designed to capture indirect rebound effects; if
households have additional income then they are likely to spend more on energy and/or
products that require energy. The extent of the indirect rebound effect is determined
endogenously by the model, based on its econometric parameters.
Estimates of the scale of the rebound effect are provided in Part IV, Section 1.1. The
economic impacts that drive the rebound effects are provided in Part IV, Section 2.
Results for energy consumption, including rebound effects are included in the
environmental indicators presented in Part IV, Section 4.
2.3 Crowding out effects13
Previous model-based studies have shown assumptions about crowding out to be critical
to determining the estimated impacts of energy efficiency scenarios (e.g. European
Commission, 2015b). Crowding out occurs due to supply constraints. If the economy is
operating at maximum capacity, then any additional activity in one part will have to
displace activity elsewhere, rather than be additional, for example through the
adjustment of prices. The term crowding out has in the past been used by economists
to refer to the specific case where additional public sector investment leads to lower
private sector investment, but here we use it to refer to the effect of capacity constraints
more generally.
Crowding out could occur in any economic market. Three important examples are:
▪ labour markets – if full employment is reached, it is not possible to increase
employment further.
▪ capital markets – if all available finance is used, it is not possible for banks to issue
new loans for investment.
▪ product markets – if companies are producing at full capacity they cannot produce
more.
Most macroeconomic models assume optimising behaviour14, which means that no spare
resources in the economy are left involuntarily unemployed, either in the baseline case
13 DG ENER is currently investigating this issue further, see https://ec.europa.eu/energy/en/data-analysis/energy-modelling/macroeconomic-modelling 14 Computable General Equilibrium (CGE) models are a standard tool for long-term macroeconomic and energy-environment-economy (E3) analysis. Unlike the E3ME model, CGE model frameworks typically assume

June 2017 26
or in any policy scenarios. Scenarios with increases in investment in energy efficiency
beyond the baseline case therefore imply reductions in investment elsewhere in the
economy. Furthermore, because of assumptions about optimisation, this type of
scenario will almost always lead to worse outcomes for GDP.
In contrast, simulation-based models such as E3ME allow for the possibility of spare
capacity in the economy. Although the model is subject to some fixed capacity
constraints (e.g. the total available stock of labour), these constraints are not breached
in any of the scenarios discussed in this report. Constraints in product markets are
handled through the model’s ‘normal’ output equations, which compare actual output
with expected output to give an implicit measure of how close production is to capacity.
Based on estimated parameters, these ratios feed into the model’s price equations and
several other equations (e.g. investment); hence, the behaviour of firms is modelled,
rather than an assumption made that any additional activity is necessarily fully crowded
out. Hence, economic activity that results from higher levels of investment in energy
efficiency need not necessarily displace activity in other parts of the economy.
This issue goes to the heart of debates between the different schools of macroeconomics
and is not unique to energy policy or energy efficiency. However, the debate is
particularly intense with regards to financial markets and policies that require high levels
of investment (e.g. energy efficiency, climate mitigation and adaptation). This is
because the mainstream branch of economics on which most macroeconomic models
are based assumes a fixed money supply (or supply of saving for investment), which
does not appear consistent with the activities of modern central banks (Pollitt and
Mercure, 2017; McLeay et al, 2014; Keen, 2011).
Unfortunately, the economic literature on the topic of crowding out and capacity
constraints in general tends to be quite theoretical rather than applied in nature. The
reason is that it is very difficult to construct counter-factual scenarios without making
prior assumptions about how the economy works. For example, in the evaluation of an
energy efficiency programme we do not know what would have happened if the
programme had not been implemented.
There are, however, data relating to capacity utilisation that are available from Eurostat.
These data cover the manufacturing and construction sectors and are based on a
combination of surveys and econometric analysis. The figures show that EU
manufacturing typically operates at 80-85% of available capacity and that, while rates
of capacity utilisation vary over the economic cycle, long-term trends are quite stable.
The rates are also broadly consistent across Member States, although it appears that
there may be more spare capacity available in southern Member States. For construction
(see Figure III.5), the data from Eurostat are based on surveys that ask what the
constraints are on production rather than the rate of capacity utilisation. This is not
directly comparable to the data for the manufacturing sector but the figures suggest
that around 30-40% of firms do not report constraints on production at any one time,
so it seems reasonable to draw a similar conclusion15.
optimal behaviour, meaning that output is determined by supply-side constraints and prices adjust fully so that all the available capacity is used. Unlike the E3ME model, CGE models also typically assume constant returns to scale, perfect competition in all markets, maximisation of social welfare measured by total discounted private consumption and no involuntary unemployment. Some CGE models, including GEM-E3, have been developed to relax some of these assumptions but the modelling approach and underlying theory still contrast to that of E3ME. 15 The Eurostat survey includes ‘lack of demand’ as a constraint on production, which explains why less firms report no constraints when output in the sector falls. The actual value for the share of firms facing no supply-side constraints may thus be higher than reported in the chart.

June 2017 27
Sources: Eurostat, ref teibs070
Sources: Eurostat, ref ei_bsbu_m_r2
Figure III.3: Rates of capacity utilisation in manufacturing (%)
Figure III.4: Construction firms reporting no constraints on production (% of total)
-12
-10
-8
-6
-4
-2
0
2
4
6
8
0
10
20
30
40
50
60
70
1993 1995 1997 1999 2001 2003 2005 2007 2009 2011 2013 2015 2017
Share reporting no constraints (left axis) Annual growth (right axis)

June 2017 28
These findings suggest that if there were sufficient demand, manufacturing and
construction firms in the EU would be able to increase production by around 15-20% in
the short run without facing hard capacity constraints16. What is less clear is whether
firms would ever be able to produce at 100% capacity; if not, then the potential for
raising production in some Member States could be lower, e.g. 5-10%.
Either way, firms are unlikely to increase production by this much without raising prices,
to reflect supply constraints. For example, costs could increase from paying staff
overtime or renting additional machinery on short-term leases.
The issue is particularly acute when a large amount of production is required in a short
period of time, as is the case in the scenarios presented in this report (see results in
Part IV). However, there is quite a long lead time, so any constraints on production
could potentially be offset by ensuring that firms prepare adequately, for example by
investing in new production capacity.
Regarding potential capacity constraints on finance and investment, there is little
empirical information in the published literature beyond that from central banks (McLeay
et al, 2014), even though this is recognised as a key issue. Limitations on data are
important here, as well as the absence of counter-factual scenarios to assess potential
effects. Many studies avoid the issue by either showing gross effects to the sectors
positively affected, or implicitly assume full crowding out. One of the few studies that
address the issue explicitly is Pollin et al (2014), which notes crowding of investment
out is unlikely to occur in a decarbonisation scenario because investment by the energy
sector overall is reduced compared to baseline (as, for example, investments related to
fossil fuel are displaced). However, this study covers the US only, where the domestic
energy sector is much larger than in Europe.
In summary, constraints on capacity and potential crowding out are recognised as key
uncertainties in the model results. The modelling approach adopted in this study
considers how crowding out might occur in all three markets outlined above. The
modelling results presented in Part IV include scenario versions without crowding out
and with partial crowding out, based on assumptions about the degree of crowding out
(the rate at which increases in one form of economic activity lead to reductions in
economic activity elsewhere in the economy). As the results show, this is a key
assumption, as it can directly impact on the magnitude and even direction of the results.
The first variant uses the default option in E3ME in which there is no crowding out of
finance and only limited crowding out in product markets (i.e. the prices increase
through the normal output equations described above). There is the potential for labour
market crowding out through increasing wage rates but the impacts on employment in
the scenarios in this report are not large enough to push Member States’ economies
towards full employment. It is important to be clear that all the investment is paid for
and the accounting identities in the model still hold (see next section), but there is no
constraint on the amount of finance or lending that is available to the economy.
The second variant assumes that there is ‘partial’ crowding out, which could result from
capacity limits in either capital or product markets. A fixed limit was imposed on the
increase in investment (compared to reference case). The following methodology was
developed:
1. Assess each scenario according to the approach outlined in the first variant.
2. In each Member State find the sector that grows by the most in each scenario.
16 There are no data available on long-term constraints. As discussed below, the direct translation from short run to long run that was used in the analysis is conservative in nature as firms could be expected to increase capacity if they expect higher rates of future production.

June 2017 29
3. Set a limit of 15% (above reference case) growth for any single sector in each
Member State up to 2030.
4. Assume any investment beyond the 15% limit in each Member State is fully
crowded out, impacting on all the sectors that supply investment goods.
In each case, the sector identified in the second stage is Construction, as it plays a
critical role in improving energy efficiency. It is assumed that if the construction sector
is unable to install new equipment in buildings then demand for the equipment itself will
fall, meaning that output in the supplying (i.e. manufacturing) sectors is also reduced.
The assumption that increases in sectoral output are limited to 15% is based on the
Eurostat data referenced above; it could be considered conservative as the figures
suggest larger increases in production would be possible. It is also reasonable to suggest
that firms would increase capacity in the period to 2030, if they expected higher rates
of demand, suggesting that the 15% constraint might be overly restrictive, i.e. the long-
term constraints may be less restrictive than the short-term ones identified in this
section.
The effect of the approach is to increase the degree of crowding out as the level of
ambition increases. It should be noted that some countries (Latvia and Hungary) reach
the 15% limit even in the EUCO30 scenario, but most of the larger Member States are
only affected in the EUCO35 and EUCO40 scenarios. Table III-1 summarises the degree
of investment that is crowded out at EU level in each scenario. A similar table with the
degree of crowding out at Member State level is provided in Appendix E.
Table III-1 Share of investment that is crowded out in partial crowding case, %
EUCO27 EUCO30 EUCO33 EUCO35 EUCO40
EU28 0.0 0.0 3.1 8.1 19.0
2.4 Financing the energy efficiency improvements
Another important assumption in the modelling is how the energy efficiency
improvements will be paid for. In the main scenarios reported in Part IV it is assumed
that the investment is ‘self-financed’, meaning that the sector that pays for the
measures is the one that benefits from reduced energy costs in later years. The exact
assumptions are:
▪ Households pay for investment in energy products by reducing spending on other
products (in proportion to baseline expenditure).
▪ Businesses pay for investment in energy products by raising prices.
▪ Government pays for investment in energy products by raising standard VAT rates.
As noted in the previous section, it is important to note that all the investment is paid
for and the scenarios represent shifts in expenditure patterns rather than additional
spending, for example with less spending on consumption goods and more on
investment goods. The discussion on crowding out in the previous sector relates largely
to whether this reallocation is possible or not, between time periods and within the
context and constraints of the wider economy.
This study considers one alternative option for financing the energy efficiency
investment, which is that the programmes are entirely funded with public money. The

June 2017 30
results for this option are presented separately in Part IV, Section 2.8; many of the
impacts are the same as in the main scenarios (as the level of energy efficiency is the
same) but there are some important differences in the economic results. Under this
alternative option national governments provide the financing for the energy efficiency
measures and increase VAT rates to cover the costs. The direct impact is therefore
budget-neutral.
It is important to note that the study is not able to address the important question of
how the financing arrangements might affect the degree of energy efficiency that is
implemented. This is due to the methodological approach used, in which the amount of
energy savings is taken from the results of the PRIMES model (i.e. they are fixed before
the assumption about financing is made).
2.5 Energy security
There are many different factors in energy security, including exposure to changes in
costs and restrictions to supplies either from international sources or domestic
providers. In general, an improvement in energy efficiency could be expected to lead
the economy being less exposed to shocks in energy supply, therefore improving
security. However, the actual situation may be more complicated than that and national
circumstances must be taken into account.
This study focuses on the share of energy imports in GDP as a key indicator of energy
security. A reduction in the ratio of energy imports to GDP for one country means that
it is less exposed to changes in international commodity prices or geopolitical
movements.
Although this is not a standard output from the E3ME model, this estimate of energy
security may be inferred from the model results. A similar indicator may be derived from
the PRIMES model results, but the E3ME figures include the effect of impacts on GDP
(see Part IV , Section 2) and further changes in energy demand due to rebound effects17.
Any further discussion of energy security becomes rather qualitative in nature, as it
must account for the risks associated with exposure to particular suppliers. The
European Commission published an assessment of exposure at Member State level in
201418; in this study an additional calculation was made using 2016 data. The method
applied was:
• Obtain shares of domestic gas extraction from the IEA or national government
estimates.
• Obtain from COMEXT data in the Eurostat database19 import shares for natural
gas and LNG natural gas for each Member State.
• If a Member State imports from another Member State, split this between the
second country’s domestic production and its imports (i.e. follow back along the
pipeline).
• Supplement missing data from COMEXT with IEA or national government
estimates.
Although the approach is quite simple, it gives quite a clear indication of exposure to
individual suppliers. Results are presented for key Member States in Part IV, Section
2.7. A list of references is provided in Appendix G.
17 i.e. GDP is given as exogenous in PRIMES but calculated endogenously in E3ME. 18 See https://ec.europa.eu/energy/en/topics/energy-strategy-and-energy-union/energy-security-strategy 19 See http://epp.eurostat.ec.europa.eu/newxtweb/

June 2017 31
3 Health
3.1 Key issues and scope of work
Outdoor (ambient) and indoor pollution have many negative effects on human health
and mortality. Even when concentrations are below the thresholds determined by the
EU and national regulations, health damage can be serious over the long run. Energy
efficiency has an important role to play in decreasing health problems related to both
indoor and outdoor pollution.
Being exposed to high levels of outdoor pollution is linked to a large range of health
complications and premature mortality related to respiratory, coronary and cardiac
diseases as well as cancers (e.g. lung cancer). The origin of ambient pollution is multi-
source, but a few sectors dominate. In France, for instance, the four main sectors that
contribute most to outdoor pollution are: transportation, residential (wood), industry,
agriculture (French Senate, 2015). At the scale of OECD countries, road transport is
likely responsible for about half the total health-related costs due to outdoor pollution
(OECD, 2014). Several studies have shown that actions to decrease air pollutant
concentrations bring about benefits to public health (OECD, 2014; WHO, 2004; WHO,
2014; WHO, 2016). Actions that would reduce key sources of outdoor air pollution
include supporting cleaner transport, power generation, industry and better municipal
waste management.
When it comes to indoor air pollution, properly designed actions to improve building
energy performance could have major co-benefits for public health. However, there are
also risks involved with the possibility of poorly designed interventions leading to
unintended consequences, as energy efficiency retrofits that alter the fabric heat loss
can also increase the air tightness of the dwelling. Living in cold and poorly ventilated
homes is linked to a range of health problems. Retrofits that improve indoor
temperatures may have positive impacts on mental health and cardiorespiratory
diseases, but could also have negative impacts on respiratory conditions due to the
increased levels of indoor pollutants.
To measure and quantify the major positive and negative impacts of energy efficiency,
this report focuses on outdoor air quality, as a decrease of the concentration of a variety
of air pollutants is likely to have considerable public health benefits. To measure and
quantify the major positive and negative impacts in improved energy performance of
buildings, this study focuses on the following issues that particularly affect public health:
▪ temperatures and ability to keep homes adequately warm, that are directly related
to energy efficiency improvements in buildings
▪ air tightness levels that are generally increased through energy efficiency
improvements, and adequate ventilation which needs to be considered cautiously
when setting energy efficiency requirements
▪ indoor air quality, resulting from the concentration of major indoor air pollutants
(VOC pollutants such as benzene, radon, carbon monoxide, NOx): indoor air
quality strongly depends on energy efficiency, even if the links can be either
positive or negative, depending on the ventilation level resulting from the
efficiency improvements
▪ mould and dampness, generally resulting from the temperature level and the
ventilation level of the building
▪ indoor lighting, which is in most cases improved thanks to energy efficiency
improvements, and has major impacts on occupants’ health and well-being

June 2017 32
3.2 Literature review and data sources
The literature review provides figures, ratios and statistics on the relationships between
air pollutant concentrations, health physical impacts (increase/decrease in mortality,
morbidity and sometimes other health damages) and the monetary valuation of these
outcomes.
The results in this report are based on the available literature on the health benefits of
energy efficiency and the impacts in terms of air quality. Using an approach based on
coefficients, these are translated into economic terms (e.g. health costs associated with
illnesses). The review of the literature from which the information has been gathered is
presented in Appendix D.
3.3 Detailed approach
The main output indicators for health and well-being are outlined below.
Baseline for current mortality and morbidity cost due to indoor and outdoor pollution
in the European Union
Some studies have monetised the annual economic cost of health impacts and mortality
from air pollution in France, the European Union or the OECD countries (French Senate,
2015; OECD, 2014; WHO Regional Office for Europe, 2015). We draw the following
figures and parameters from these reports:
• The cost of outdoor air pollution in OECD countries, both deaths and illness, was
about USD 1,7 trillion in 2010. Available evidence suggests that road transport
accounts for about 50% of this cost, or close to USD 1 trillion.
• The effects of air pollution in France cost some €100 bn each year, impact to
health being the major expense (between €68 bn and €97 bn euros).
• In the WHO European Region as a whole, the estimated mortality in 2010 was
approximately 600 000 premature deaths, which represents a marked decrease
from 2005 for the Region overall. The annual economic cost of premature deaths
from air pollution across the countries of the WHO European Region stood at USD
1.431 trillion. The overall annual economic cost of health impacts and mortality
from air pollution, including estimates for morbidity costs, stood at USD 1.575
trillion.
Methods employed to measure this output indicator are generally based on the mean
value of life, obtained through contingent valuation studies or willingness to pay
surveys.
Opportunity cost of mortality and morbidity due to outdoor air pollution
The opportunity cost indicator measures the cost of mortality and morbidity due to
outdoor air pollution. One previous study (AEA Technology Environment, 2005)
measures the marginal cost of damage caused per tonne of pollutant (PM2.5, SO2, NOx,
NH3 and VOCs) for health and crops for each EU country in 2005. The key results of this
study are shown in Table III-2.

June 2017 33
Table III-2: Average damages per tonne of emission for the EU25 (excluding Cyprus), euros
Minimum value Maximum value
NH3 11,000 31,000 NOx 4,400 12,000
PM2.5 26,000 75,000
SO2 5,600 16,000
VOCs 950 2,800
Source(s): AEA Technology Environment, 2005
By plugging in the estimated decrease in tonnes of pollutants for each EU country in the
different energy efficiency scenarios, it is possible to estimate the savings in health costs
for each scenario (by isolating the crop aspect, which is out of scope). Estimated
decrease in tonnes of pollutant (SOx, NOx and PM10) have been calculated through the
E3ME model, given the reduction in energy use compared to the EUCO27 scenario. The
detailed approach is described in Part IV, Section 3.1.
Healthcare costs
The healthcare costs describe the variation in public finance due to outdoor air pollution.
One study in the literature review calculated the impact on social security spending in
France (French Senate, 2015). It estimates that it costs France some €100 bn each
year, citing impact to health as the major expense (between €68 bn and €97 bn euros).
The results of this specific study could be used to approximate the impacts of health
care costs at European level. It is to be noted, however, that such approximation would
suffer from the limitations, as the French case might not be representative due to
multiple factors, including the following:
• Health costs vary between Member States, for example due to differences in
labour costs
• The types of treatments that are available may also vary between Member
States, and also over time (e.g. due to technological advances)
• The split of costs between public and private sectors is not constant; no
allowance is made for individuals who are unable to pay for treatment
Comparison with the results in the EED Impact Assessment
The EED Impact Assessment includes estimates of health impacts that are derived from
the GAINS model. GAINS is a highly sophisticated model that has been designed
specifically for this type of assessment. The model is more advanced than the approach
used here of linking E3ME results (see Section 4) to coefficients for healthcare
expenditure. However, there is one other important difference in that the application of
E3ME in this study also captures rebound and other indirect effects, which are not
included in the analysis by GAINS (which is linked directly to the results from PRIMES).

June 2017 34
4 Environmental impacts
4.1 Introduction
Energy efficiency improvements can positively affect the environment in several quite
different respects. Focusing our attention on the indicator framework for monitoring the
EU Sustainable Development Strategy20, the following three areas are addressed:
▪ Energy and climate change – Measures to improve energy efficiency naturally lead
to reductions in energy demand and thus consumption of fossil fuels. Reduced
consumption of fossil fuels implies reduced emissions of greenhouse gases.
▪ Sustainable consumption and production (SCP) - This category comprises items such
as the emission of local air pollutants and consumption of materials. Energy
efficiency could potentially reduce the level of emissions of sulphur, particulates and
other pollutants that are damaging to human health21. Energy efficiency measures
may also imply increases in Domestic Material Consumption (DMC) when measures
such as building retrofits are undertaken.
▪ Natural resources – Improved energy efficiency leading to reduced energy demand
could lead to reductions in water demand and land use by the power generation
sector.
The review of the relevant literature is presented in Appendix D, Section 4.
The assessment of the effect of energy efficiency measures on indicators covering the
themes discussed above is carried out using the E3ME model. The main quantitative
output indicators that E3ME can provide are:
▪ reductions in greenhouse gas emissions (Section 4.2)
▪ reductions in emissions of local air pollutants (e.g. SO2, NOx) (Section 4.3)
▪ benefits of reduced energy consumption (mainly impacts on water consumption)
(Section 4.4)
▪ impacts on material consumption (Section 4.5)
Some of these results also come from the PRIMES model but, as described in the
sections below, the results from E3ME include indirect impacts, including rebound
effects.
The approach for assessing each of these indicators is presented in the sections below.
4.2 Energy consumption and greenhouse gas emissions
The direct changes in energy consumption in the scenarios are given by the energy
savings that are taken from PRIMES, but the results from the modelling exercise with
E3ME include rebound effects and other indirect impacts. Here, the energy demand
equations in the model are important. These equations are estimated using econometric
methods, linking energy consumption to rates of economic production and energy
prices.
When modelling energy efficiency (and particularly rebound effects) the link between
rates of economic production and energy consumption (by fuel) are key. The
relationships are not necessarily linear, for example a 5% increase in production may
only require a 2% increase in energy consumption. The parameters are determined from
the historical data.
20 The framework provides the basis for monitoring economic, social and environmental progress. See http://ec.europa.eu/eurostat/web/sdi/indicator-framework 21 Although these are not assessed in detail here because this would entail double counting with the health impact area.

June 2017 35
The model also accounts for the energy consumption required to produce energy
efficient equipment and materials.
Total final energy consumption (see Part IV, Section 4.2) is disaggregated by carrier
using a further set of econometric equations. There are twelve energy carriers defined,
covering solids liquid and gaseous fuels, electricity and biomass. This approach allows
for fuel switching, for example if there are changes in relative fuel prices.
As with energy consumption, the impacts on greenhouse gas emissions are to a certain
extent determined by the results from the PRIMES model. However, the results from
PRIMES take into account only direct energy savings and do not incorporate indirect
rebound effects that may lead to additional energy consumption and emissions (see
Section 2.2). Applying a macroeconomic model such as E3ME makes it possible to
include these rebound effects.
The relationship between energy savings and CO2 emissions is relatively straightforward
to assess. Usually a linear approach is applied using fixed coefficients of units of CO2
per unit of fuel consumption. There are two ways of doing this: either deriving the
coefficients from historical data or using published coefficients (e.g. from the IPCC).
However, these two approaches should produce very similar results. E3ME uses the
former approach based on historical data, which allows the model to account for
differences in fuel grades between countries (see Table III-3).
Table III-3: Average emission coefficients, EU28
Average emission factors (tCO2 / toe)
Coal 3.44
Liquid fuels 3.04
Natural gas 2.45
Source: E3ME model
The total impact on CO2 depends on how the economy reacts to increases in investment
for energy efficiency and the link between the level of economic activity and fuel
consumption (by fuel type) – combined, these comprise the rebound effect.
The economic impacts are described earlier in this chapter. The impact on energy
demand in E3ME is determined by the model’s econometric equations that link energy
consumption to changes in energy prices and rates of economic production.
4.3 Impact on local air pollutants
The Impact Assessment for the Energy Efficiency Directive includes an assessment of
local air pollutants made by the GAINS model22. As noted in Section 3, GAINS is a
sophisticated tool that is built for the sole purpose of this type of assessment. It goes
far beyond the capabilities of E3ME in this area. However, the application of E3ME in
this study also captures rebound and other indirect effects, which are not included in
the analysis by GAINS (which is linked directly to PRIMES).
In the modelling with E3ME, pollution is linked to certain economic activities or fuel
consumption. E3ME includes a treatment of SO2 and NOx, but does not cover PM2.5.
Coal combustion is a key source of emissions of SO2 emissions and, to a lesser extent,
NOx. It is not the only source, however, for example activity in the agricultural and
22 http://gains.iiasa.ac.at/models/

June 2017 36
transport sectors can also lead to these types of emissions. The data for emissions are
taken from the EDGAR database23. All sources are included in the balances, even if they
cannot be modelled endogenously in E3ME.
It is quite common for emissions of SO2 and NOx to be converted to monetary terms.
Usually most of the cost is attributed to healthcare and loss of productivity. Since in this
study the estimation of the monetary effects is limited to human health effects (see
Section 3 above), to avoid double counting, the environmental impacts are not
monetised.
4.4 The energy sector’s water requirements
Section 4.5 in Appendix D describes how it is possible to estimate water consumption
by the power sector by converting from generation in GWh to cubic metres of water.
The coefficients that are taken from Macknick et al (2011) are provided in Table III-4.
Most of the water that is consumed by the power sector is used for cooling. Renewable
technologies have been allocated values of zero in the study because they do not use
water in generation (although water may be used in their production). Hydro power has
also been allocated a value of zero because its use of water does not preclude other use
and therefore it is not defined as a withdrawal.
The results from the calculation depend on the power sector fuel mixes, which are
derived from the PRIMES model. As EU ETS prices change in the EUCO scenarios there
is some substitution between conventional and renewable power generation
technologies which influences the results.
Table III-4: Water withdrawals by generation technology
Water withdrawals m3/MWh
Natural gas 1.16
Hydro 0.00
Nuclear 5.01
Wind 0.00
Biomass 3.99
Geothermal 0.00
Coal 4.57
Solar PV 0.00
Solar CSP 0.00
Source: Macknick et al (2011)
The literature review in Appendix D also presents an approach for land use requirements
for the power sector, suggesting a proxy that could be used as impact on the natural
environment. However, results tend to be dominated by changes in biomass use (which
has a far larger land requirement than any other generation technology), which does
not provide insights with respect to local amenity. As generation from biomass changes
23 http://edgar.jrc.ec.europa.eu/

June 2017 37
in the scenarios assessed in this report (again, for example, due to variations in the ETS
price), results from this type of analysis could be quite misleading.
4.5 Impacts on material consumption
E3ME’s submodel of material consumption is similar in approach to its energy submodel.
It consists of a set of econometric equations that assess the rate of material intensity
in each sector across seven material types (covering minerals and biomass), based on
rates of economic production and material prices. There is feedback to the economic
sectors that produce/extract materials (mainly agriculture, forestry and non-energy
mining) through modifications to the sectoral linkages that are built into E3ME’s
economic accounting framework.
As material prices do not change by much in the scenarios presented in this report, the
main impacts on material consumption are derived from changes in production. Even if
material intensity does not change, increases in economic production will lead to higher
usage of materials. In particular, the construction sector is an intensive user of materials
and so material consumption would be expected to increase in scenarios where there is
a rapid uptake of energy efficiency.
The main metric that comes from the modelling is Domestic Material Consumption
(DMC), which is used as a key indicator by DG Environment in its analysis24. DMC only
includes materials that are consumed domestically and does not include goods that are
exported outside Europe. DMC usually includes consumption of fuels but this is excluded
in the analysis in this report to avoid double counting.
5 Social aspects
5.1 Introduction
The E3ME model can only give a limited set of indicators for social impacts. The model
results include:
• estimates of effects on income distribution
• estimates of employment and unemployment impacts
These are described in the following two sections. The third section summarises the
findings from the EPBD report. These findings are highly relevant as many of the social
impacts arise from the investment in energy efficiency in buildings.
It should be noted that the analysis is limited by the fact that it does not make any
assumptions about the types of households that are most affected by the energy
efficiency improvements, as this depends on policy details that are not yet available (in
particular relating to finance mechanisms). However, it could be expected that if low
income households were targeted in the overall efficiency programmes for buildings,
then the results would be much more progressive than in the opposite case.
5.2 Impacts on purchasing power and the treatment in E3ME
In scenarios with more focus on energy efficiency in industrial sectors (or transport), it
is important to consider indirect effects. For example, household real incomes could be
24 See e.g. http://ec.europa.eu/environment/resource_efficiency/about/roadmap/index_en.htm

June 2017 38
affected by changes in food prices or changes in the prices of other household goods.
As different types of households have different purchasing patterns, the distribution of
the indirect impacts can be quite uneven.
Without going to micro level, it is possible to use data published by Eurostat on
household expenditure patterns to estimate the impacts of changes in product prices on
different socio-economic groups (drawing on the modelling results). This approach is
now well established through use in E3ME and other macroeconomic models (e.g. see
the review in Ekins et al, 2011). Nevertheless, the limitations of the approach should be
recognised, particularly with regard to the estimates of responses to changes in energy
prices across different socio-economic groups (for which the necessary data are not
available). The modelling therefore does not include the possibility that more wealthy
household groups have more potential to change consumption patterns in response to
changes in price. We provide a short separate discussion of this factor in Part IV.
The E3ME approach is based on two components. The first of these is the income
component. For each social group, the shares of income from wages, benefits and other
income (minus their tax deductions) are scaled in line with the aggregate model results
for wages and welfare benefit payments, and so forth. This means that a scenario that
includes increases in social benefit rates would show positive results for low income
groups who rely more on benefits. The second part links household expenditure survey
data to the model results for consumer prices by category of consumption. This is mainly
used to assess the effects of changes in energy prices, as in many countries low income
households use a larger share of their incomes for space heating; it is less relevant for
energy efficiency scenarios in which energy prices do not change, but it is noted that
the prices of other goods may change in the scenarios due to indirect effects.
5.3 Unemployment as a social indicator
Unemployment is one of the key social indicators that policy makers review. It is also
one of the outputs from the E3ME model. In the modelling, unemployment is defined as
the difference between labour supply and employment (labour demand) and so can be
affected by changes in either supply or demand. Labour market results are reported in
Part IV, Sections 2.2-2.5.
Issues relating to unemployment are not generally well explored in model-based
studies, in part because the standard CGE models that are often used are very limited
in their treatment of unemployment (GEM-E3 is an exception as it has been developed
further). The amount of literature that describes unemployment effects is therefore
quite limited, and it is usually left to the reader to infer changes in unemployment from
changes in employment (when gross impacts are quoted) or not mentioned as part of
the analysis.
A bigger issue, that is very difficult to explore with a modelling approach, relates to the
skills requirements across different sectors. This has been explored in considerable
detail in a study that was published by DG EMPL in 2011 (European Commission, 2011)25
and with reference to energy efficiency in the study for DG ENER in 2015 (European
Commission, 2015)26. The 2011 study in particular showed that skills constraints could
lead to both issues of displaced workers unable to find jobs and companies in growing
25 The full report Studies on Sustainability Issues – Green Jobs; Trade and Labour, Final Report for the European Commission, DG Employment, 2011. Available at: http://www.camecon.com/EnergyEnvironment/EnergyEnvironmentEurope/ModellingCapability/E3ME/public ations.aspx 26 The full report Assessing the Employment and Social Impact of Energy Efficiency (2015) is available from http://ec.europa.eu/energy/sites/ener/files/documents/CE_EE_Jobs_main%2018Nov2015.pdf

June 2017 39
sectors experiencing skill shortages. The result could be both higher unemployment
levels and a loss of production, potentially endangering the environmental targets that
have been set.
Macroeconomic models are unable to address this issue, because they do not have the
necessary detail in terms of skills. As outlined in the DG EMPL study (2015), available
modelling approaches can convert sectoral results into occupations and skills groups but
the skills groups are limited to low, medium and high. This is well short of the level of
detail (e.g. machine operator) that would be required to assess potential skills gaps. At
present, it is necessary to apply a qualitative assessment about whether it is possible
for the required number of workers to move between sectors. However, existing
literature has not sought to identify specific links of jobs resulting from energy efficiency
with unemployment, or types of unemployment.
5.4 Incorporating results from the EPBD report
Most of the social impacts from energy efficiency arise from efficiency measures that
are implemented in buildings. The EPBD report presents an approach with which to
assess impacts on fuel poverty from energy efficiency. The analysis is not duplicated in
this report, but given the relevance of those results in the context of this report, they
are summarised in Part IV.
A more detailed description of the approach, including how the levels of energy savings
were estimated at Member State level and how the approach was used to estimate
quantitatively the impacts of each policy option in each of the impact areas, is available
in Part III of the EPBD report.
6 Public budgets
6.1 Introduction
IEA (2014) provides a comprehensive overview of the potential public budget impacts
of energy efficiency. The evidence review presented in the IEA report informs the
discussion of public budget impacts presented both in the EBPD report and in this report.
The discussion of the impacts of energy efficiency on public budgets in the EPBD report
focused on the public budget impacts of energy efficiency in buildings. The approach
used in the EPBD report categorised the sources of the impacts of energy efficiency in
buildings into three groups:
▪ investment impacts
▪ energy cost reduction impacts
▪ public health impacts
The mechanisms through which public budgets are affected by energy efficiency are
largely the same, whether the efficiency measures are in buildings or other sectors of
the economy. A similar approach is therefore applied in this report. Taking IEA (2014)
as the starting point for assessing the effects of energy efficiency on public budgets,
the main impacts that have been identified in the literature are summarised in Figure
III.5. A review of the limited amount of relevant literature is presented in Appendix D.
6.2 Key issues and scope of work
A brief overview of the potential public budget impacts of energy efficiency across the
whole economy is summarised below. More detailed information is available in the
review of relevant literature in Appendix D.

June 2017 40
Investment impacts
Investment impacts are the fiscal budget effects arising from public and private
investment in energy efficiency. In many cases, investment is the first, essential, step
in order to secure future benefits associated with energy cost reduction or public health
outcomes (IEA, 2014).
The direct impacts of investment in energy efficiency include:
▪ changes to tax revenue
▪ public sector investment in energy efficiency
The indirect impacts of investment in energy efficiency include:
▪ changes to employment levels and income tax revenue
▪ additional public revenues from other sources
Figure III.5 The effects of energy efficiency on public budgets
Source: Cambridge Econometrics’ elaboration based on IEA (2014).

June 2017 41
Energy cost reduction impacts
Energy cost reduction impacts are the effects arising from a reduction in energy
expenditure as a result of improvements in energy efficiency. Assuming that there are
no increases in energy prices as a result of reduced demand, energy demand reductions
(or cost savings) can have a significant impact on the entire economy through second-
and third-round effects. The impact of the energy cost reduction is often estimated to
be significantly greater than investment effects, assuming that the energy efficiency
measures that are implemented are cost-effective.
The direct impacts of energy cost reduction include:
▪ reduction in (ongoing) public expenditure on public sector energy bills
▪ reduction in public investment in energy supply infrastructure and maintenance
(where this is a public sector responsibility)
▪ lower fiscal drain from energy subsidies
▪ decline in revenues from energy excise duty and any carbon tax
The indirect impacts of energy cost reductions arise primarily from changes to sales of
goods and services due to the spending effect from energy cost savings.
Public health impacts
A key outcome arising from the assessment of health impacts is an estimate of
reductions in healthcare costs (see Section 3). In most countries, at least part of these
savings will accrue to public budgets and there may be further impacts on public budgets
from changes to labour productivity induced by health impacts (e.g. reduced
absenteeism or presenteeism). The impacts of both types of change on public finances
can be substantial (see e.g. OECD, 2016) and, as noted by IEA (2014) are usually not
included in analyses of energy policy.
In this report, the impacts of improved health are quantified in monetary terms in the
health impact area. To avoid double counting they are not used in the calculation of
public budget impacts as well. However, when interpreting the results from a narrow
public budgets perspective it should be remembered that there will be additional impacts
within public health services.
Pathways to impacts
Not all impacts or potential impacts of energy efficiency on public budgets fall neatly
into one of the three categories presented here (investment impacts, energy cost
reduction impact and public health impacts). Many of the impacts listed here under one
heading can, at least potentially, generate further indirect (i.e. second- and third-round)
effects that lead to an increase in overall economic output. For example, if supply chains
increase production and employment rises as a result, this may cause further demand-
based growth as newly employed individuals spend their wages across the economy
(IEA, 2014), leading to further increases in taxation revenues.
6.3 Linkages to the modelling with E3ME
One of the main advantages of applying a macroeconomic modelling approach is that
many of the factors that affect public budgets are included automatically in the model
results, and they are fully consistent with the wider economic results, e.g. for GDP and
employment. However, the macro modelling cannot cover all relevant aspects to public
budgets and therefore the model results need to be extended. Our estimates therefore

June 2017 42
build on the results from E3ME, further disaggregating them to take into account certain
specific factors.
Table III-5 summarises the main factors that are accounted for in our estimates.
Table III-5 Factors in the budget calculations
Factor Availability
Factors affecting public revenues
VAT receipts In the E3ME results
Fuel excise duties In the E3ME results
ETS auction revenues In the E3ME results
Income tax receipts In the E3ME results
Employees’ social contributions In the E3ME results
Employers’ social contributions In the E3ME results
Corporation tax receipts In the E3ME results
Other tax receipts Not estimated
Factors affecting public expenditures
Public sector energy expenditure Estimated off-model
Social benefits Estimated using E3ME results
Public health expenditure Not included to avoid double counting
Public investment in energy
efficiency
Estimated off-model
Other public expenditure In the E3ME results
The net impact of energy efficiency on public budgets will depend on the sum of several
variables. First, the impacts of energy efficiency on public budgets can be either direct
or indirect27. Second, the likely duration of the effects can vary considerably: some may
be relatively short-lived, while others may be more enduring. Third, the impacts of
energy efficiency on public budgets can be either positive (increasing revenue or
reducing costs) or negative (increasing costs or reducing revenue). In some instances,
a crowding out effect cancels out any positive effects, or simultaneously occurring
positive and negative effects outweigh each other (IEA, 2014).
Results for public budgets are also influenced by how investment in energy efficiency in
the private sector is financed. In the main scenarios, it is assumed that all investment
is ‘self-financed’, meaning that it is paid for by the beneficiaries. In practice, there are
provisions in the EED to provide public support for the investment, although the scale
of financial support in absolute terms is difficult to model. Even if subsidies had been
included, however, the net impact on public budgets would have been cancelled out if
the modelling maintained the assumption that VAT rates are adjusted to cover energy
27 Direct effects include factors that relate specifically to the energy efficiency, for example financing or lower public-sector energy bills. Indirect effects include those related to rebound effects or developments in the wider economy.

June 2017 43
efficiency investment costs. The net impact on public budgets would only change if this
kind of offsetting tax rate adjustment is not made automatically.
Part IV, Section 2.8 of this report provides economic results for a case in which all the
investment is financed by national governments. As described above, this leads to
higher VAT rates to cover the costs to the public sector. Given these assumptions, the
results show that the impacts of changing the financing approach do not lead to
qualitatively different outcomes.
The final point to note is that the financing mechanism could affect VAT receipts directly
as well. If households pay for their own energy efficiency measures then they will pay
VAT on the equipment that they purchase together with any installation costs (unless
the products are exempted from VAT). When businesses or governments purchase the
equipment, they would expect to deduct the VAT costs. The source of financing therefore
influences overall taxation receipts, with higher receipts in scenarios where households
make the purchases.
6.4 Tax revenues from E3ME
In each scenario, E3ME provides projections of the following tax receipts:
▪ VAT (on all products, including energy)
▪ income taxes
▪ social contributions (both employers’ and employees’)
▪ corporation taxes
▪ excise duties on energy expenditure, energy subsidies where relevant
Direct taxes
In the E3ME modelling, it is assumed that each Member State’s tax rates remain
unchanged, so direct tax revenues will vary in line with changes in the levels of wages
or profits.
A single average tax rate is used in each country, with the rate calculated as tax
revenues divided by the tax base (i.e. wages)28. This approach means exemptions from
taxation are implicitly included in the average tax rate. It also means, however, that
movements of individuals between income tax bands are not taken into account. In
general, it can be assumed that the boundaries between the tax bands are held constant
in real terms, so overall changes in wage rates do not affect the average tax rate (i.e.
the scenarios do not present results in which many workers move into higher-rate tax
bands, increasing the overall ratio of labour taxes to wages).
The key question here is whether there is any way that the composition of jobs in energy
efficiency scenarios affect the average tax rates paid. For example, if all the additional
jobs created had high wage rates then they would fall into higher tax bands and pay a
higher average tax rate. However, the assumption of an unchanged tax rate is justified
because:
• the jobs that are created in the scenarios cover a range of different sectors with
different skills requirements, so not all additional jobs are either high or low-paid
• the changes in the levels of employment are not big enough to cause large shifts
in taxation patterns
Social contributions, both from employees and employers, are estimated in the same
way, based on fixed rates in relation to wages. It is assumed that current rates for social
28 Data on tax revenues are obtained from DG Ecfin’s AMECO database while data on labour costs are taken from Eurostat.

June 2017 44
security payments are maintained throughout the projections. The approach for
corporation tax is also similar in that a fixed rate is applied based on current data,
although in this case the tax base is company profits.
Indirect taxes
The treatment of VAT in E3ME is to assign a rate to each of 43 product groups in the
model for each Member State. The data are taken from Eurostat and the European
database maintained by DG Taxud29. Energy products are distinguished in the categories
so that, for example, the reduced rate of VAT for energy products in the UK is accounted
for. The treatment therefore captures the effects of shifts in spending across product
categories on total VAT receipts.
As described above, VAT rates are adjusted in the scenarios to compensate for both
public expenditure on energy efficiency and any loss of revenue from auctioned ETS
allowances that result from lower ETS prices.
Revenues from auctioned ETS allowances
ETS auction revenues, which are effectively treated as a tax, can also be obtained from
the model results. The revenues are estimated as power sector emissions multiplied by
the carbon price; with more energy efficiency, the power sector’s emissions could be
expected to fall due to reduced demand for electricity. There is clearly some
approximation here as allocations do not match exactly against use of allowances (either
between sectors or Member States) but this should not have a major impact on the
outcomes.
In the analysis we have assumed that auctioning of ETS allowances is only required for
the power sector, accounting for around half of the total allowances issued. In the future,
industry sectors will be expected to purchase an increasing share of allowances but it is
at present not clear the proportions that each sector would have to cover. The
assumption of free allowances does not affect the results for energy consumption and
ETS prices (which come from PRIMES) but if there were a higher share of auctioned
allowances then a fall in the ETS price would have a larger negative impact on
government budgets (and vice versa). Following the modelling assumptions in this
report, that would have been compensated for by a small increase in VAT rates so that
net public balances remain unchanged.
Other taxes
There are other taxes that contribute to public budgets, and if GDP increases then
receipts from these taxes may increase too. Possible examples include charges on assets
or other activities that lie beyond the scope of the E3ME model. Again, the impacts are
likely to be small in all Member States but, again, the E3ME assumptions are
conservative.
6.5 Public expenditure in E3ME
Public expenditure in E3ME includes final demands (e.g. health, education) and social
transfers in the form of benefits. Final demand is given as exogenous in real terms in
the model30. The only impacts on the costs of public services are therefore through
changes in prices in the economy that result from variations in inflation rates. For
example, if inflation increases then public sector wage demands are also likely to
increase, which will mean higher costs for government.
29 Taxation in Europe. See http://ec.europa.eu/taxation_customs/tedb/taxSearch.html 30 To avoid double counting, we do not account for induced changes in healthcare costs (see Section 3).

June 2017 45
There is a measure of social benefits in E3ME, but it is not very detailed, compared to
the treatment in micro-simulation models. We therefore make a separate off-model
estimate of the impacts on social expenditures. We assume that:
• pension payments (usually the largest category) are unchanged
• other payments are adjusted linearly with rates of unemployment plus labour
market inactivity (for example, if the non-working share of the working age
population falls by 1% then these benefit payments also fall by 1%)
These assumptions are based on a link between the scale of benefit payments and the
size of the non-working population. As long as most of the non-pension payments are
made to those who are not working, the representation is reasonably accurate. If a large
share of benefit payments were made to the working population (e.g. through child or
income support benefits) then the relationship could become stretched. It is clear that
this is a simplification of highly complicated systems across Europe but it is the most
suitable and transparent approach given the available data. As the results show,
however, changes to benefit payments are in fact a relatively small part of the overall
impact on public budgets.
Costs and savings related to public energy efficiency
In addition, the estimate of the effects of energy efficiency on public balances must take
into account activities within the public sector. This is derived from the inputs to E3ME
(see Section 2). The calculation must account for both the expenditure on energy
efficiency and the energy savings made by the public sector.
The analysis should also account for public financing of private energy efficiency
schemes, for example through subsidies or guaranteed loans (see discussion above).
Results are provided for the public financing variant of the scenarios in Part IV, Section
6.3.
6.6 Interaction with the economic results
It is important to be clear about the interaction between the different impact areas to
avoid double counting of the benefits. This is particularly the case for public budgets
because there is a direct interaction with GDP and employment levels.
In the analysis, tax rates are in general held constant, matching the last year for which
data are available, so that government receipts and expenditures change in line with
wider economic conditions. The exception to this rule, as described above, is that VAT
rates are adjusted to compensate for public expenditure on energy efficiency measures
and any loss of ETS auction revenues in the scenarios.
Changes in GDP growth rates will therefore affect government incomes and expenditure,
and the model has allowed these to accumulate. The economic and public budgets
results presented in Part IV are thus additional.
7 Industrial competitiveness
Industrial competitiveness is a key issue for European policy makers. In this study,
competitiveness is defined at the sectorial level for energy intensive industries (EIIs),
with a focus on international trade. Competitiveness concerns are most evident in the
sectors that are exposed to international trade, while there is a strong base in the local
market. For example, if firms in these sectors have a large home market, they have
more scope for benefitting from economies of scale, allowing them to charge a lower
price for products that are consumed both domestically and in other countries.

June 2017 46
7.1 Key issues and scope of work
The EU objectives set out to achieve higher levels of energy efficiency, both in
manufacturing and in the construction sector, may have several effects on European
competitiveness. In particular, the present report offers data on, and discusses the
following:
▪ Energy costs for energy-intensive industries: energy costs account for a substantial
share of costs in some sectors. This is especially the case for energy-intensive
industries, for which energy costs may represent more than 3% of total production
costs, and more than 10% of added value. Energy efficiency is thus one of the key
opportunities for cost reduction and competitiveness improvements.
▪ Impacts on SMEs: Energy efficiency may be more difficult to implement in small
enterprises and this report identifies the important and often overlooked role of SMEs
in EIIs. For the construction sector, where the majority of companies are SMEs, the
analysis pays extra attention to weaknesses and strengths regarding energy
efficiency improvements, while offering projection of future demand and
international competitiveness.
▪ Global market shares of European sectors related to improved energy efficiency in
construction and industry: European energy-intensive industrial sectors (such as
steel, pulp & paper, aluminium, cement, glass or chemicals), that are particularly
exposed to international competition, may benefit from new opportunities arising
from the shift in demand towards more efficient and higher quality materials and
processes. This report examines the impact of EU energy efficiency target-setting in
improving industrial competitiveness.
▪ Emergence and positioning of European firms on breakthrough technologies and
innovation in energy efficient products and solutions: New technologies and
innovation will certainly be a key pillar to achieving energy efficiency targets. For
example, innovation on energy-saving building materials, new efficient cooling and
heating technologies, or even smart-meters, will contribute to improved energy
efficiency across all sectors, and for EIIs in particular. European firms may position
themselves on disruptive innovation and improve competitiveness in these fledgling
markets.
▪ Investment attractiveness of the European construction sector: Market trends for
construction, renovation and rehabilitation in the housing and services sectors may
trigger new opportunities for value creation. Emerging business models of energy
service companies (ESCOs) have the potential to improve the value added of
European SMEs.
▪ Increase in productivity: Workers’ productivity is closely tied to their indoor working
environment; the health effects of improved energy efficiency in buildings may result
in a better productivity and, ultimately, affect competitiveness.
7.2 Competitiveness indicators for Energy Intensive Industries
Evaluating competitiveness is realised by examining comparable indicators, which in the
case of EIIs are the number of patents these industries (to evaluate innovation), the
historical prices for energy, the energy intensity and the energy cost impact.
Energy intensity and the energy cost impact
The indicators for energy intensity and the energy cost impact are estimated for
industrial sub-sectors, to provide information on how effectively energy is used in
comparison to the value added of the industry. The formula’s for estimating these two
indicators are as follows:

June 2017 47
Energy intensity = 𝑇𝑜𝑡𝑎𝑙 𝑒𝑛𝑒𝑟𝑔𝑦 𝑐𝑜𝑛𝑠𝑢𝑚𝑝𝑡𝑖𝑜𝑛 𝑜𝑓 𝑡ℎ𝑒 𝑖𝑛𝑑𝑢𝑠𝑡𝑟𝑦 (𝑘𝑡𝑜𝑒)
𝑉𝑎𝑙𝑢𝑒 𝑎𝑑𝑑𝑒𝑑 𝑜𝑓 𝑡ℎ𝑒 𝑖𝑛𝑑𝑢𝑠𝑡𝑟𝑦 (𝑚𝑖𝑙𝑙𝑖𝑜𝑛 €)
Energy cost impact = 𝑇𝑜𝑡𝑎𝑙 𝑒𝑛𝑒𝑟𝑔𝑦 𝑐𝑜𝑠𝑡 𝑜𝑓 𝑡ℎ𝑒 𝑖𝑛𝑑𝑢𝑠𝑡𝑟𝑦 (𝑚𝑖𝑙𝑙𝑖𝑜𝑛 €)
𝑉𝑎𝑙𝑢𝑒 𝑎𝑑𝑑𝑒𝑑 𝑜𝑓 𝑡ℎ𝑒 𝑖𝑛𝑑𝑢𝑠𝑡𝑟𝑦 (𝑚𝑖𝑙𝑙𝑖𝑜𝑛 €)
Energy intensity is based on data retrieved from the PRIMES 2016 results. Its evolution
represents the effect on sub-sector efficiency in each scenario. The energy cost impact
indicator evaluates the effectiveness of production, and thus competitiveness, by
comparing the profitability of the industry, to its energy cost requirements. It has been
calculated by converting the ktoe quantity into MWh-equivalent before multiplying it
with the electricity price assumptions taken from PRIMES. To allow for a more
comparable result, it uses the pre-tax energy cost.
Innovation
Innovation is evaluated by examining the number of accepted patents. Patents
specifically for energy efficient equipment, per industrial sector are not available as
aggregates, and as such this methodology makes use of the accepted number of patents
for the EIIs, in the EU and globally. It is assumed that in EIIs, since energy costs are a
significant share of the expenditure, new technologies are adopted only if they provide
better performance for the same or less cost, and a short payback period – i.e. patents
that broadly include some element of energy efficiency. Patent statistics are retrieved
from the WIPO statistics database under the categories of:
• Electrical machinery, apparatus, energy
• Basic materials chemistry
• Materials, metallurgy
• Chemical engineering
• Environmental technology
• Textile and paper machines
International competitiveness
Data on international competitiveness are drawn from the database of Oxford
Economics, as value added of EIIs by region, historically. The Oxford Global Industry
Model (GIM)31 is used to forecast over 100 sectors across 68 countries. Gross value
added and gross output forecasts are available across all countries and sectors, with
capital expenditure available for 35 countries across all sectors, and output price data
available for the US, Japan, China, Germany, France, UK and Italy. Data are classified
using the NACE revision 2 sector classification at the 2-digit level, with more detail
available in most manufacturing sectors. Forecasts are updated on a quarterly basis and
take into account the latest production data available, as well as changes to the
macroeconomic environment and corporate and regulatory developments.
Sector forecasts are driven by aggregate demand from three regional blocs – Americas;
Asia-Pacific; and Europe-Middle East-Africa – as well as by national trends. Sector
31http://www.oxfordeconomics.com/forecasts-and-models/industries/scenario-analysis-and-modelling/global-industry-model/overview

June 2017 48
demand from the three blocs is allocated to individual industries using weights based
on regional input-input relationships. These relationships – derived from input-output
tables – show the share of each industry’s output that is driven by total final expenditure
(consumer spending, investment, government spending and exports) and by
intermediate demand. The model also takes into account the impacts of changes in
competitiveness on an industry’s market share, both regionally and domestically.
Finally, energy cost shares for EIIs are retrieved from the World Input Output Database
based on information on inputs by energy product.
7.3 Literature review and data sources
The approach starts from analysis of the key energy efficiency legislation, notably the
EED, the Eco-design Directive and the Energy Labelling Directive. The team identified
provisions that are relevant to competitiveness for energy-intensive industries,
industries that deliver/produce energy efficient investment goods, SMEs or the
construction sector. The literature review from the EPBD report was then updated and
the findings that showed a link between EU legislation and industrial competitiveness
were further assessed.
The review in Appendix D discusses the EU provisions that are most relevant for
competitiveness and the related literature sources that were analysed. The review also
presents relevant sources of literature that consider the effects of smart financing on
competitiveness.

June 2017 49
Part IV. Results
1 Introduction
This chapter presents the quantitative results from the analysis. It is split into the six
impact areas, which are discussed in turn. Unless otherwise mentioned, the results are
shown as percentage or absolute difference from the EUCO27 scenario. Therefore, they
do not represent all the effects that energy efficiency could have, but just those that
are additional to the impacts of a 27% energy efficiency target.
Where relevant, the modelling results include scenario versions without crowding out
and with partial crowding out, based on assumptions about the degree of ‘crowding out’
(the rate at which increases in one form of economic activity lead to reductions in
economic activity elsewhere in the economy, see Part III, Section 2.3 for more detail).
To put the impacts into context, Figure IV.1 shows the final energy reductions that are
achieved in each scenario. As the tables show, the degree of crowding out has only a
minor impact on final energy demand.
Figure IV.1 EU28 Final energy demand, % from EUCO27 scenario (no crowding out)
Note(s): Figure shows final energy demand, excluding consumption for non-energy
purposes.
Source(s): E3ME, Cambridge Econometrics
1.1 Rebound effects
The changes in final energy demand in the scenarios are not the same as the changes
in final energy demand reported by PRIMES. The direct changes in final energy demand
that result from the investment in energy efficiency from PRIMES are entered to E3ME
as closely as possible, subject to the differences between the models’ historical data and
classifications.
However, energy consumption is not fixed as exogenous in E3ME and secondary,
endogenous effects also affect rates of energy demand. The endogenous effects can be
positive or negative but one factor typically outweighs the others: rebound effects.

June 2017 50
The importance of rebound effects is discussed in Part III, Section 2.2 of this report.
Direct rebound effects are already incorporated in the results from PRIMES but indirect
rebound effects are generated by E3ME. There are both potential short and long-run
impacts:
• In the short run energy consumption may increase in order to produce and install
energy efficient equipment.
• In the long run, savings from reduced expenditure on energy may be used to
buy other goods and services that require energy in their production processes.
The rebound effect is strongly linked to many of the other impacts described in the
sections below. For example, rebounds in energy consumption are in part driven by
higher levels of GDP and employment in the scenarios.
Table IV-1: The scale of indirect rebound effects and implications on energy savings achieved
(compared to 2007 baseline), EU28 in 2030
No Crowding out Partial crowding out
Rebound effect EE savings in 2030 Rebound effect EE savings in 2030
EUCO30 0.0% 30.0% 0.0% 30.0%
EUCO33 6.1% 32.6% 6.1% 32.6%
EUCO35 9.4% 34.2% 8.7% 34.3%
EUCO40 27.4% 36.4% 25.6% 36.7%
Source(s): E3ME, Cambridge Econometrics
Table IV-1 shows the extent of the rebound effect in the model results. The scale of the
rebound effect is calculated by dividing the outputs from E3ME (which include rebound
effects) by the inputs to E3ME (which do not). So, for example, in the EUCO40 scenario
without crowding out, E3ME predicts that energy consumption would increase due to
indirect rebound effects by enough to counteract 27.4% of the energy savings in the
model inputs for that scenario.
In the less ambitious scenarios, the scale of the rebound effect is close to zero, as other
impacts in the economy (e.g. through prices) offset the changes to energy consumption.
However, as the level of ambition increases, it is clear that the scale of the rebound
effect also increases. This means that, for example, the EUCO40 scenario achieves a
reduction in energy consumption of between 36% and 37% in 2030 (compared to the
2007 baseline), rather than savings of 40%. However, for the other scenarios, the
realised energy savings are quite close to the targets specified.
The reason for the increase is that, as the level of ambition increases, the amount of
investment per additional unit of energy saving also increases (see next section). Higher
investment levels require more energy in production and also create more jobs, leading
to increases in consumption of goods that require energy. Combined, these effects lead
to around a quarter of the initial energy savings being offset by increases in energy
consumption for other reasons.

June 2017 51
2 Economy and labour market
This section presents the economic results from the modelling exercise with E3ME. It
starts by showing the macroeconomic impacts, then goes into more detail regarding
employment impacts. The time horizon for this analysis is 2030.
2.1 Macroeconomic impacts at EU level
The economic and labour market impacts largely come from the E3ME model results.
The projected GDP impacts over time for the EU28 are shown in Figure IV.2 and Figure
IV.3 The results are close to zero up to 2025 and positive after 2025. By 2030, the GDP
effects grow in line with the increasing levels of ambition of the energy efficiency policies
(relative to the EUCO27 scenario). In the ‘no crowding out’ case, GDP impacts vary
between 0.4% in EUCO30 and 4.1% in EUCO40. In the ‘partial crowding out’ case, the
impacts are still positive but are smaller, reaching to 2.2% by 2030.
The time profile of the results shows the importance of the timing of the energy
efficiency measures. The results from E3ME reflect the results from the PRIMES model.
It is to be noted that given that the PRIMES model output follows a five-year period
routine, it is not possible to highlight results which are likely to happen also before 2025.
Between 2025 and 2030, however, investment increases rapidly according to PRIMES,
especially in the more ambitious scenarios. The economic and labour markets therefore
become much bigger. The quite sharp increase in production that takes place after 2025
is important in the context of crowding out (see Part III, Section 2.3), as firms would
have relatively little time to expand production if they were not expecting the additional
demand.
Figure IV.2 EU28 GDP, 2016-2030, % from EUCO27 scenario (no crowding out)
Source(s): E3ME, Cambridge Econometrics
0.0
1.0
2.0
3.0
4.0
5.0
6.0
2020 2021 2022 2023 2024 2025 2026 2027 2028 2029 2030
EUCO30 EUCO33 EUCO35 EUCO40

June 2017 52
Figure IV.3 EU28 GDP, 2016-2030, % from EUCO27 scenario (partial crowding out)
Source(s): E3ME, Cambridge Econometrics
Table IV-2 summarises the macroeconomic results for 2030. Overall, the magnitude of
the impacts increases as the scenarios become more ambitious, reflecting the scale of
investment needed to achieve the more ambitious energy efficiency targets.
In all five of the energy efficiency target scenarios there are reductions in fuel imports,
with the size of the reductions increasing as the level of ambition in the scenarios
increases. Reductions in fuel imports are one of the main drivers of the positive GDP
results. If households spend less on fuel then their disposable income for other
purchases increases. The model equations estimate how the additional income is spent
but it is likely to be across a range of goods and services. As many of these goods and
services are produced domestically (within the EU), there is a boost to domestic rates
of economic activity, leading to higher GDP and employment (see next section). While
imports of other goods and services will also increase, the import content on non-energy
products is usually much lower than the import content of energy products, so a shift
away from spending on energy goods is beneficial for Europe’s economies.
Trade patterns are also affected by the level of energy efficiency investment undertaken
by businesses. If European firms can cut their energy bills and overall cost base by
investing in energy efficient practices then their international competitiveness will be
boosted, potentially leading to higher market shares both in domestic markets and
abroad. However, the short-term costs of additional investment in energy efficiency may
harm competitiveness and so it is important to consider how the investment may be
financed (see Section 2.8). Section 7 discusses the overall impacts on competitiveness.
The impact on household real incomes and expenditure in 2030 is also positive in all
five scenarios. The main driver for higher household expenditure is an increase in
employment (see next section). Wage rates also increase slightly due to an increase in
average productivity per worker, boosting household incomes further.
There are also impacts on real incomes from changes in prices in the scenarios. The
inflationary effects shown in Table IV-2 result at least in part from changes in VAT rates,
reflecting the modelling assumption that higher VAT rates are used to raise revenues to
fund additional investment in energy efficiency in the public sector (see Section 6 for
0.0
0.5
1.0
1.5
2.0
2.5
2020 2021 2022 2023 2024 2025 2026 2027 2028 2029 2030
EUCO30 EUCO33 EUCO35 EUCO40

June 2017 53
discussion of the impacts on public budgets). The pricing behaviour of firms is also
important in determining the effects on inflation. In the modelling, it is assumed that
firms will in the short run increase prices to cover the costs of the investments that they
make. In the longer term, however, firms may be able to reduce costs in response to
lower energy bills; this is also reflected in the model results.
Although household incomes and expenditure are often used as a proxy for welfare, in
scenarios of energy efficiency policy the proxy is not accurate because investment made
in earlier years also affects welfare.
For example, if households can achieve the same indoor temperature while paying for
less energy, then household expenditure is reduced but welfare does not decrease. If
households divert spending from energy to other products, while still maintaining the
same indoor air temperatures, then welfare increases despite expenditure remaining
unchanged.
In summary, if household expenditure is to be used as a proxy for welfare in this study,
the limitations must be recognised. However, as the scenario results show both
increases in household expenditure and less spending on energy to achieve the same
(or better) indoor environment, one can conclude that there would be positive welfare
impacts on European households in aggregate.
Table IV-2 also shows that assumptions about the degree of crowding out can have a
considerable impact on the results. In the scenarios with partial crowding out there are
limits to how much construction can increase activity without impacting on other
economic sectors (see discussion in Part III, Section 2.3). As would be expected, the
macroeconomic impacts become less favourable if the degree of crowding out increases
because the available capacity is used up and any additional investment displaces
economic activity in other sectors. The potential effects of crowding out are particularly
noticeable in the most ambitions scenario (EUCO40), where capacity constraints impose
the strongest restrictions on output and the degree of crowding out is greatest; while in
the EUCO30 scenario there is enough spare capacity in the economy to carry out all the
additional investment, in the EUCO40 scenario 19% of the additional investment
displaces investment elsewhere in the economy (see Table III-1).
With partial crowding out, the potential GDP increase in 2030 falls from 4.1% to 2.2%
(for the EU in EUCO40, relative to the EUCO27 scenario). In comparison, in the EUCO30
scenarios, there is no difference between the no crowding and partial crowding variants.
In summary, the amount of spare capacity is important in determining the potential
scale of positive outcomes, especially as the level of ambition increases.
Table IV-2 EU28 summary of macroeconomic impacts, 2030, % from EUCO27 scenario
Degree of crowding out
EUCO27
EUCO30 EUCO33 EUCO35 EUCO40
GDP (€2013bn)
No crowding out 18,045 0.39 1.45 2.08 4.08
Partial crowding out 18,045 0.39 1.30 1.58 2.21
Employment (m)
No crowding out 234 0.17 0.68 1.04 2.08
Partial crowding out 234 0.17 0.63 0.85 1.40
Consumer expenditure (€2013bn)
No crowding out 10,255 0.09 0.93 1.33 2.81
Partial crowding out 10,255 0.09 0.72 0.63 0.33
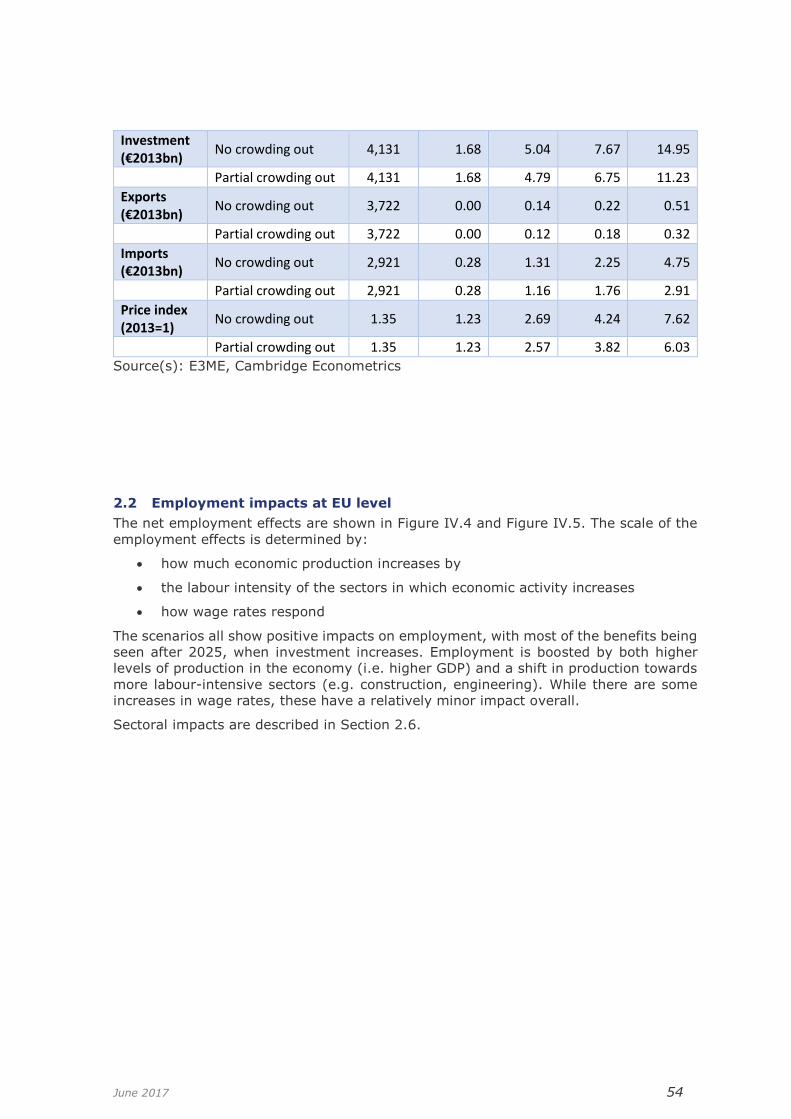
June 2017 54
Investment (€2013bn)
No crowding out 4,131 1.68 5.04 7.67 14.95
Partial crowding out 4,131 1.68 4.79 6.75 11.23
Exports (€2013bn)
No crowding out 3,722 0.00 0.14 0.22 0.51
Partial crowding out 3,722 0.00 0.12 0.18 0.32
Imports (€2013bn)
No crowding out 2,921 0.28 1.31 2.25 4.75
Partial crowding out 2,921 0.28 1.16 1.76 2.91
Price index (2013=1)
No crowding out 1.35 1.23 2.69 4.24 7.62
Partial crowding out 1.35 1.23 2.57 3.82 6.03
Source(s): E3ME, Cambridge Econometrics
2.2 Employment impacts at EU level
The net employment effects are shown in Figure IV.4 and Figure IV.5. The scale of the
employment effects is determined by:
• how much economic production increases by
• the labour intensity of the sectors in which economic activity increases
• how wage rates respond
The scenarios all show positive impacts on employment, with most of the benefits being
seen after 2025, when investment increases. Employment is boosted by both higher
levels of production in the economy (i.e. higher GDP) and a shift in production towards
more labour-intensive sectors (e.g. construction, engineering). While there are some
increases in wage rates, these have a relatively minor impact overall.
Sectoral impacts are described in Section 2.6.

June 2017 55
Source(s): E3ME, Cambridge Econometrics
Source(s): E3ME, Cambridge Econometrics
-0.5
0.0
0.5
1.0
1.5
2.0
2.5
2020 2021 2022 2023 2024 2025 2026 2027 2028 2029 2030
EUCO30 EUCO33 EUCO35 EUCO40
0.0
0.5
1.0
1.5
2020 2021 2022 2023 2024 2025 2026 2027 2028 2029 2030
EUCO30 EUCO33 EUCO35 EUCO40
Figure IV.4 EU28 employment, 2016-2030, % from EUCO27 scenario (no crowding out)
Figure IV.5 EU28 employment, 2016-2030, % from EUCO27 scenario (partial crowding out)

June 2017 56
2.3 Unemployment
Table IV-3, Figure IV.6 and Figure IV.7 show the impacts of improved energy efficiency
on unemployment in Europe. The results are generally positive and, beyond 2025, all
scenarios show a reduction in unemployment. Again, the magnitude of the impacts grow
in line with the ambition of the energy efficiency target, with the more ambitious
scenarios seeing greatest decline in unemployment by 2030.
The data are again presented for both the ‘no crowding out’ and ‘partial crowding out’
scenario variants. This is because the impact on unemployment is smaller for the more
ambitious scenarios when a certain degree of crowding out is assumed. The labour
market itself presents one possible source of crowding out as if, for example, the
EUCO40 scenario was to bring more than 3 million people out of unemployment, there
would likely need to be a substantial retraining programme across Europe so that the
available workers would have the necessary skills to engage with the construction and
engineering sectors.
As discussed in Part III, the modelling is not able to address potential skills shortages
but any bottlenecks would depend both on location (at a sub-national level) and also
other labour market developments. If there were skills shortages, the economic
outcomes would be worse and it might become impossible to meet the specified energy
efficiency targets. Ensuring an adequately skilled workforce remains a key issue for
policy makers.
In addition to the reduction in the number of unemployed workers, there is also some
increase in labour market participation in the scenarios, as higher wage rates32 and
lower unemployment rates may encourage more people to seek work. The magnitude
of this effect is smaller than the reduction in unemployment, but it explains why the
reduction in unemployment does not match in absolute terms the increase in
employment presented earlier in this chapter.
Table IV-3 EU28 unemployment in 2030, absolute difference from EUCO27 scenario (thousands of people)
2020 2025 2030
No CO Part CO No CO Part CO No CO Part CO
EUCO27 (Baseline)
22,981 22,981 19,290 19,290 17,988 17,988
EUCO30 -43.4 -43 -43.2 -43.5 -317.8 -318
EUCO33 -36.6 -36.7 -87 -86.9 -1022.5 -954.6
EUCO35 -35.2 -35.3 -54 -54 -1499.1 -1243.4
EUCO40 -27.2 -27.2 -76.3 -75.2 -3000.7 -2082.1
Source(s): E3ME, Cambridge Econometrics
32 Wage rates are determined endogenously using a set of econometric equations. The specification is based on a union bargaining methodology at sectoral level, with higher rates of productivity and wages in other sectors having a positive effect on wage rates, and higher unemployment rates having a negative effect. Higher wage rates will encourage individuals to seek work but will dampen demand from firms (both of these relationships are also estimated empirically).

June 2017 57
Figure IV.6 EU28 unemployment in 2030, absolute difference from EUCO27 scenario (thousands of people) (no crowding out)
Source(s): E3ME, Cambridge Econometrics
Figure IV.7 EU28 unemployment in 2030, absolute difference from EUCO27 scenario (thousands of people) (partial crowding out)
Source(s): E3ME, Cambridge Econometrics
-4000
-3500
-3000
-2500
-2000
-1500
-1000
-500
0
2015 2016 2017 2018 2019 2020 2021 2022 2023 2024 2025 2026 2027 2028 2029 2030
17987.5 EUCO33 EUCO35 EUCO40
-2500
-2000
-1500
-1000
-500
0
2015 2016 2017 2018 2019 2020 2021 2022 2023 2024 2025 2026 2027 2028 2029 2030
EUCO30 EUCO33 EUCO35 EUCO40

June 2017 58
2.4 Macroeconomic impacts at Member State level
The Member State level impacts of the energy efficiency policies on GDP are shown in
Table IV-4. The impacts vary considerably between the Member States.
The main reason for the differences in results between Member States is the amount of
investment in energy efficiency; in countries that invest more heavily, the impacts will
be larger. The sector that makes the investment also matters; investment by businesses
leads to higher prices which take some time to feed through to final demand, whereas
investment by households has an immediate displacement effect on other goods and
services. Trade effects can also influence outcomes and countries that export energy
efficient equipment may benefit if other European countries increase their ambition
levels.
Again, the impact of partial crowding out (versus no crowding out) is greater in the more
ambitious scenarios with higher energy efficiency targets (EUCO35 and EUCO40). The
impact of the crowding out varies between Member States, depending on the amount
of additional investment foreseen. For example, if one Member State implements a
particularly ambitious efficiency programme then the investment requirements will be
higher and the amount of investment displaced from other sectors will also be higher.
Therefore, the crowding out effects in this Member State will be greater than in other
Member States and the cost to GDP related to crowding out will be higher.
In the no crowding out variant of the most ambitious energy-efficiency scenario, the
countries that see the largest increases in GDP are the Czech Republic, Latvia, Slovakia,
Finland and Hungary. This is almost entirely driven by the amount of energy efficiency
investment required. For example, Latvia has the largest ratio of energy efficiency
investment to GDP (EUCO27) among all Member States in 2030, while the other
countries are also high up the list.
Table IV-4 GDP by Member State, 2030, % difference from EUCO27 scenario
EUCO27 EUCO30 EUCO33 EUCO35 EUCO40 Baseline
(€2013bn) No CO Part
CO No CO Part
CO No CO Part
CO No CO Part
CO
AT 426 0.4 0.4 1.5 1.4 2.3 1.9 4.5 2.6
BE 506 0.5 0.5 1.7 1.5 2.3 1.8 4.4 2.3
BG 55 0.4 0.4 1.4 1.3 1.9 1.7 3.8 3.2
CY 24 0.3 0.3 0.9 0.8 1.3 1.1 2.8 2.1
CZ 202 0.9 0.9 3.0 2.7 4.4 3.4 8.3 4.6
DE 3,404 0.4 0.4 2.0 1.6 2.8 1.6 5.9 2.2
DK 347 0.2 0.2 0.4 0.4 0.5 0.5 0.7 0.4
EE 24 0.3 0.3 1.2 1.1 1.8 1.6 4.0 3.1
EL 215 0.7 0.7 2.0 1.7 2.8 1.9 4.9 2.2
ES 1,513 0.3 0.3 1.0 1.0 1.5 1.5 3.2 3.0
FI 242 0.6 0.6 2.1 2.1 3.5 3.4 7.3 6.3
FR 2,654 0.7 0.7 1.9 1.9 2.9 2.5 5.2 3.5
HR 57 0.2 0.2 0.8 0.7 1.2 1.1 1.8 1.5
HU 179 0.9 0.9 2.5 1.8 3.7 2.0 6.4 1.8
IE 229 0.3 0.3 1.1 1.0 1.6 1.4 2.9 2.4
IT 1,971 0.5 0.5 1.6 1.5 2.2 1.7 4.3 2.1
LT 45 0.7 0.7 1.8 1.7 2.5 2.1 4.7 2.7
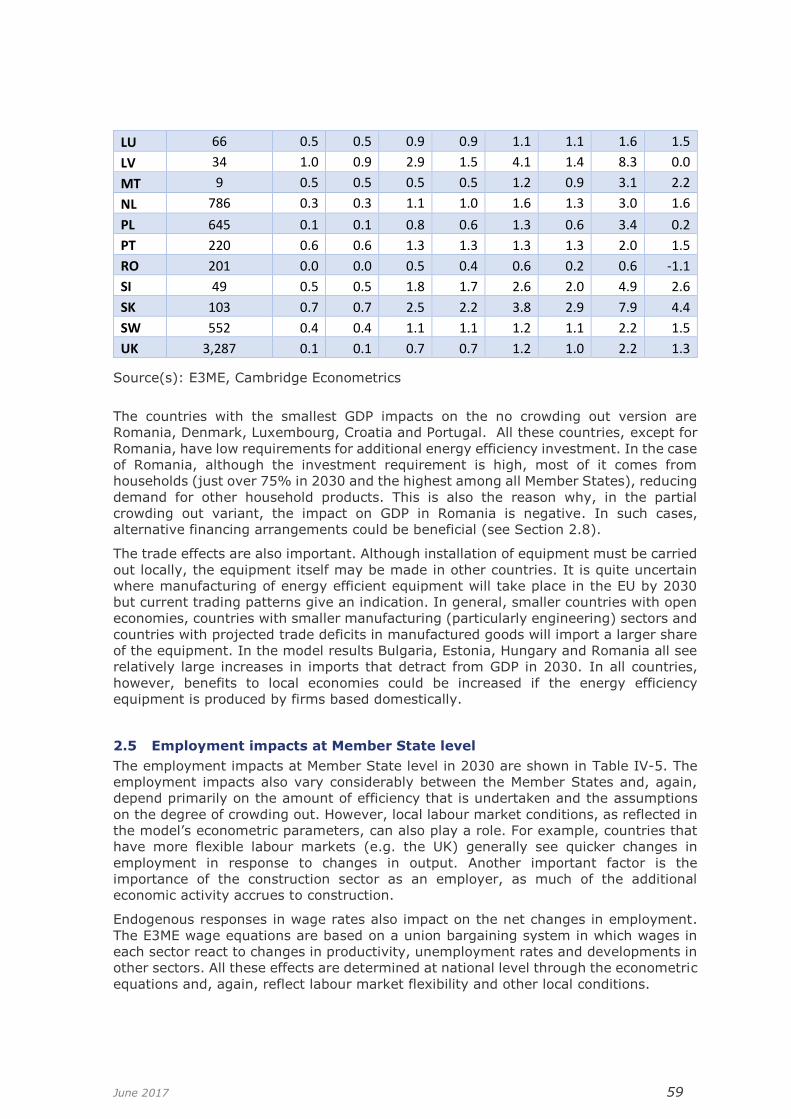
June 2017 59
LU 66 0.5 0.5 0.9 0.9 1.1 1.1 1.6 1.5
LV 34 1.0 0.9 2.9 1.5 4.1 1.4 8.3 0.0
MT 9 0.5 0.5 0.5 0.5 1.2 0.9 3.1 2.2
NL 786 0.3 0.3 1.1 1.0 1.6 1.3 3.0 1.6
PL 645 0.1 0.1 0.8 0.6 1.3 0.6 3.4 0.2
PT 220 0.6 0.6 1.3 1.3 1.3 1.3 2.0 1.5
RO 201 0.0 0.0 0.5 0.4 0.6 0.2 0.6 -1.1
SI 49 0.5 0.5 1.8 1.7 2.6 2.0 4.9 2.6
SK 103 0.7 0.7 2.5 2.2 3.8 2.9 7.9 4.4
SW 552 0.4 0.4 1.1 1.1 1.2 1.1 2.2 1.5
UK 3,287 0.1 0.1 0.7 0.7 1.2 1.0 2.2 1.3
Source(s): E3ME, Cambridge Econometrics
The countries with the smallest GDP impacts on the no crowding out version are
Romania, Denmark, Luxembourg, Croatia and Portugal. All these countries, except for
Romania, have low requirements for additional energy efficiency investment. In the case
of Romania, although the investment requirement is high, most of it comes from
households (just over 75% in 2030 and the highest among all Member States), reducing
demand for other household products. This is also the reason why, in the partial
crowding out variant, the impact on GDP in Romania is negative. In such cases,
alternative financing arrangements could be beneficial (see Section 2.8).
The trade effects are also important. Although installation of equipment must be carried
out locally, the equipment itself may be made in other countries. It is quite uncertain
where manufacturing of energy efficient equipment will take place in the EU by 2030
but current trading patterns give an indication. In general, smaller countries with open
economies, countries with smaller manufacturing (particularly engineering) sectors and
countries with projected trade deficits in manufactured goods will import a larger share
of the equipment. In the model results Bulgaria, Estonia, Hungary and Romania all see
relatively large increases in imports that detract from GDP in 2030. In all countries,
however, benefits to local economies could be increased if the energy efficiency
equipment is produced by firms based domestically.
2.5 Employment impacts at Member State level
The employment impacts at Member State level in 2030 are shown in Table IV-5. The
employment impacts also vary considerably between the Member States and, again,
depend primarily on the amount of efficiency that is undertaken and the assumptions
on the degree of crowding out. However, local labour market conditions, as reflected in
the model’s econometric parameters, can also play a role. For example, countries that
have more flexible labour markets (e.g. the UK) generally see quicker changes in
employment in response to changes in output. Another important factor is the
importance of the construction sector as an employer, as much of the additional
economic activity accrues to construction.
Endogenous responses in wage rates also impact on the net changes in employment.
The E3ME wage equations are based on a union bargaining system in which wages in
each sector react to changes in productivity, unemployment rates and developments in
other sectors. All these effects are determined at national level through the econometric
equations and, again, reflect labour market flexibility and other local conditions.

June 2017 60
The effects of the unemployment rate can be particularly important. If a country is close
to full employment then any additional demand for labour will push up wage rates rather
than lead to more jobs. The relative effects of additional investment in energy efficiency
are therefore likely to be greater in countries with high unemployment rates in the
reference case. In the short term, this could describe some of the EU’s southern Member
States but by 2030 it is assumed that unemployment in the reference case falls in line
with historical averages.
Overall, however, the employment impacts are positive across all Member States, and
increase in line with the energy efficiency target. In many countries (e.g. the Czech
Republic, Finland and Hungary), the boost comes through the construction sector; even
in countries where the energy efficiency investment is a modest share of GDP, but where
the construction sector is a major employer, the total increase in employment is pushed
up (e.g. France, Greece, Portugal and Spain). As employment in the construction sector
increases, multiplier effects as additional income is spent lead to further job creation in
the wider economy, particularly through consumer goods and services. Greece and
Spain are prominent examples where employment increases beyond construction.
Table IV-5 Employment by Member State, 2030, % difference from EUCO27 scenario
EUCO27 EUCO30 EUCO33 EUCO35 EUCO40
Baseline (000s)
No CO Part CO
No CO Part CO
No CO Part CO
No CO Part CO
AT 4,403 0.1 0.1 0.6 0.6 0.9 0.8 1.6 1.1
BE 4,974 0.2 0.2 0.8 0.7 1.2 1.0 2.2 1.4
BG 3,231 0.0 0.0 0.1 0.0 0.1 0.1 0.2 0.1
CY 424 0.1 0.1 0.3 0.3 0.4 0.4 1.1 1.0
CZ 5,374 0.3 0.3 1.2 1.1 1.9 1.5 3.8 2.5
DE 39,433 0.1 0.1 0.6 0.5 1.0 0.7 1.8 1.0
DK 3,029 0.1 0.1 0.3 0.3 0.5 0.5 1.3 0.9
EE 602 0.2 0.2 0.8 0.8 1.2 1.1 2.4 2.1
EL 4,061 0.5 0.5 1.2 1.1 1.9 1.3 3.6 1.9
ES 19,869 0.2 0.2 0.8 0.8 1.2 1.1 2.7 2.5
FI 2,625 0.3 0.3 1.2 1.2 1.8 1.8 3.5 3.1
FR 29,550 0.3 0.3 0.8 0.7 1.1 1.0 2.2 1.6
HR 1,688 0.2 0.2 0.4 0.4 0.6 0.6 1.2 1.1
HU 3,803 0.4 0.4 1.2 1.0 1.8 1.2 3.3 1.6
IE 2,234 0.2 0.2 0.5 0.5 0.9 0.8 1.8 1.6
IT 25,836 0.1 0.1 0.7 0.6 1.0 0.8 1.9 1.2
LT 1,314 0.3 0.3 1.1 1.0 1.6 1.3 3.2 2.0
LU 421 0.1 0.1 0.1 0.1 0.2 0.2 0.4 0.4
LV 942 0.3 0.3 1.1 0.7 1.6 0.8 3.0 0.9
MT 185 0.3 0.3 0.4 0.4 0.6 0.6 1.1 1.0
NL 8,867 0.1 0.1 0.4 0.4 0.6 0.6 1.3 0.9
PL 15,267 0.2 0.2 1.0 1.0 1.6 1.2 3.7 2.1
PT 4,915 0.5 0.5 1.5 1.5 2.0 1.8 3.5 2.8

June 2017 61
RO 9,219 0.0 0.0 0.3 0.2 0.4 0.3 0.8 0.4
SI 926 0.2 0.2 0.6 0.7 1.1 0.9 2.2 1.3
SK 2,311 0.1 0.1 0.3 0.2 0.5 0.2 1.7 0.4
SE 5,096 0.2 0.2 0.4 0.4 0.4 0.3 0.9 0.6
UK 32,942 0.1 0.1 0.5 0.5 0.8 0.7 1.5 1.1
Source(s): E3ME, Cambridge Econometrics
2.6 Impacts at sectoral level33
The E3ME model results for output and employment, split by different sectors of the
economy, are displayed in Figure IV.8 and Figure IV.9. The charts show the scenarios
with no crowding out, but results with partial crowding out are reported in Table IV-6
and Table IV-7.
As expected, these results show a reduction in output in the utilities and extraction
sectors due to the energy saving measures, with the utilities sector seeing the largest
decrease in output. The focus of the energy efficiency measures in buildings means that
both domestic electricity and gas suppliers face lower demand for their products and
their turnover decreases accordingly. In comparison, as Europe imports a large share
of its energy, the size of the impact on domestic extraction activities is much smaller in
relative terms.
33 The sectors defined in this section are: Agriculture (NACE rev2 A), Extraction industries (B), Basic manufacturing (C10-24), Engineering (C25-C33), Utilities (D and E), Construction (F), Distribution and retail (G), Transport (H49-H52), Communications (H63, I and J), Business services (K, L, M and N) and Public services (O to U).

June 2017 62
Source(s): E3ME, Cambridge Econometrics
Other sectors, such as construction and engineering, benefit from the investment in
energy efficiency and, to a lesser extent, higher demand from consumers in the long
run. As a result, these sectors are expected to see an increase in output in the energy
efficiency scenarios, compared to the EUCO27 scenario; and it should be noted that they
are much larger than the utilities and extraction sectors in size (the extraction sector is
smallest in the chart in terms of employment, construction is around 30 times larger in
2030). Because the positive economic impacts are driven primarily by higher levels of
investment, the impact is greatest in the EUCO40 scenario where the energy efficiency
investment is the largest.
-15
-10
-5
0
5
10
15
Agr
icu
ltu
re
Extr
acti
on
Ind
ust
rie
s
Bas
ic m
anu
fact
uri
ng
Engi
nee
rin
g an
d t
ran
spo
rteq
uip
men
t Uti
litie
s
Co
nst
ruct
ion
Dis
trib
uti
on
an
d r
etai
l
Tran
spo
rt
Co
mm
un
icat
ion
s, p
ub
lish
ing
and
tel
evi
sio
n
Bu
sin
ess
se
rvic
es
Pu
blic
ser
vice
s
EUCO30 EUCO33 EUCO35 EUCO40
Figure IV.8 EU28 Summary of output impacts by sector in 2030, % difference from EUCO27 scenario (no crowding out)

June 2017 63
Figure IV.9: EU28 Summary of employment impacts by sector in 2030, % difference from EUCO27 scenario (no crowding out)
Source(s): E3ME, Cambridge Econometrics
In general, the employment results at sectoral level follow the same pattern as output,
although the magnitude of the impacts is smaller. The notable exception is the utilities
sector, where employment increases, despite falling output. This increase in
employment is not directly related to the higher rates of energy efficiency but instead
to a higher penetration of renewables, which are typically more labour intensive. Thus,
despite reduced demand for electricity, there is a higher labour demand in the utilities
sector.
Nevertheless, the changes in employment in the utilities sector are small in absolute
terms. The largest overall increase in employment comes in the construction sector,
where employment could increase by up to 5.4% in the EUCO40 scenario with partial
crowding out, or up to 7.3% if no crowding out is assumed. As was found in earlier parts
of this section, the assumptions on the degree of crowding out do not impact the model
results in the less ambitious scenarios (e.g. EUCO30).
The sectoral impacts on employment and output with no crowding out and partial
crowding out are shown in Table IV-6 (output) and Table IV-7 (employment).
-4
-2
0
2
4
6
8
Agr
icu
ltu
re
Extr
acti
on
Ind
ust
rie
s
Bas
ic m
anu
fact
uri
ng
Engi
nee
rin
g an
d t
ran
spo
rteq
uip
men
t Uti
litie
s
Co
nst
ruct
ion
Dis
trib
uti
on
an
d r
etai
l
Tran
spo
rt
Co
mm
un
icat
ion
s, p
ub
lish
ing
and
tele
visi
on
Bu
sin
ess
se
rvic
es
Pu
blic
ser
vice
s
EUCO30 EUCO33 EUCO35 EUCO40

June 2017 64
Table IV-6: EU28 Impacts on sectoral output by 2030, % difference from EUCO27 scenario
EUCO
27 EUCO30 EUCO33 EUCO35 EUCO40
(€bn) No CO
Part CO
No CO
Part CO
No CO
Part CO
No CO
Part CO
Agriculture 462 0.1 0.1 0.6 0.5 0.9 0.5 2.3 0.9
Extraction Industries 144 -0.5 -0.5 -1.2 -1.3 -0.8 -1.0 0.4 -0.4
Basic manufacturing 4,111 0.3 0.3 1.6 1.5 2.8 2.2 5.9 3.8
Engineering and transport equipment
4,221 1.0 1.0 3.4 3.2 5.2 4.5 10.1 7.4
Utilities 1,086 -5.9 -5.9 -9.6 -9.7 -
10.9 -11.4
-13.8
-15.8
Construction 2,487 1.4 1.4 4.5 4.3 6.8 6.1 13.1 10
Distribution and retail 3,450 0.8 0.8 3.1 2.8 4.7 3.8 9.4 5.9
Transport 1,727 0.3 0.3 1.3 1.2 1.9 1.5 3.7 2.3
Communications, publishing and television
3,090 0.4 0.4 1.9 1.7 2.8 2.1 5.9 3.3
Business services 7,891 0.2 0.2 1.2 1.0 2.0 1.4 4.4 2.3
Public services 4,830 0.3 0.3 1.1 1.0 1.7 1.3 3.3 2.0
Source(s): E3ME, Cambridge Econometrics
Table IV-7: EU28 Sectoral employment impacts in 2030, % difference from EUCO27 scenario
EUCO27
EUCO30 EUCO33 EUCO35 EUCO40
Baseline
(000s)
No CO
Part CO
No CO
Part CO
No CO
Part CO
No CO
Part CO
Agriculture 9,141 0.0 0.0 0.0 0.0 0.0 0.0 0.1 0.1
Extraction Industries 525 -0.6 -0.6 -2.0 -2.1 -3.0 -3.1 -2.3 -2.8
Basic manufacturing 14,785 0.0 0.0 0.1 0.2 0.3 0.2 0.9 0.6
Engineering and transport equipment
15,291 0.3 0.3 0.9 0.9 1.4 1.3 2.4 2.0
Utilities 2,904 0.4 0.4 2.0 1.8 3.4 2.6 7.4 4.0
Construction 15,457 0.8 0.8 2.6 2.4 3.9 3.4 7.3 5.4
Distribution and retail 35,201 0.2 0.2 0.8 0.8 1.3 1.1 2.8 1.8
Transport 9,415 0.0 0.0 0.3 0.2 0.4 0.3 0.8 0.4
Communications, publishing and television
21,073 0.0 0.0 0.5 0.5 0.8 0.6 2.0 1.0

June 2017 65
Business services 40,767 0.2 0.2 0.8 0.7 1.1 0.9 2.2 1.4
Public services 68,985 0.1 0.1 0.3 0.3 0.5 0.4 0.9 0.7
Source(s): E3ME, Cambridge Econometrics
A discussion of sectoral employment impacts leads into questions about whether the
workforce is adequately skilled to make the transition to the new economic structure
suggested in the scenario results. Furthermore, there may also be movement within
sectors in addition to the movement between sectors.
As noted in Part III, Section 5.3, this is an issue that is very difficult for models to
address and a more qualitative assessment is required.
Some evidence from previous studies, nevertheless, suggests that the key role played
by new technologies in the greening of the economy will, at least initially, lead to higher
demands for the more advanced skills groups and lower demands for lower-skilled
workers. In the short term, science, technology, engineering and mathematics (STEM)
related skills are likely to be in particularly high demand. As the new technologies
mature, medium-skilled employees (e.g. maintenance workers) could be more sought
after (European Commission, 2011). In the long run, labour markets will be able to
respond to the changes in business environment but, the faster and more ambitious the
change, the greater the likelihood that existing education and training systems will need
support to adjust.
Particular effects could emerge at the local level, to meet specific demands or (in the
case of job losses) because of a concentration of energy supply or energy-related
employers. The need for skills driven by the demand for energy efficiency products can
also be expected to vary between Member States, depending on their present levels of
activity to address energy efficiency and current levels of inefficiency, and hence the
remaining scale of energy savings potential.
In practice, the shift to a greener economy may translate into an increasing demand for
generic skills (such as leadership, commercial understanding or management, and for
generic green skills) and multi-skilling, contributing to the evolution of existing
occupations (Cedefop, 2010; European Commission, 2011); it is possible that green
skills will mainly be added to the existing skill set without substantially altering the job
content (Cedefop, 2010; Eurofound, 2013).
In summary, the findings from these previous studies suggest broadly that the types of
transition envisaged in the EUCO scenarios are possible but it may be necessary to
develop complimentary policies to ensure an adequately skilled workforce, particularly
for the period 2025-2030 where there is quite a rapid take-up of energy efficiency
products. In advance of 2025, a continued investment in STEM34 subjects could ease
labour market pressures. Labour market monitoring could prevent subsequent
bottlenecks in specific subsectors arising as the pace of development increases.
2.7 Energy security
The measure of energy security used in this report is the economic value of energy
imports, expressed as a share of GDP. Results for this indicator are shown in Table IV-8;
they include endogenous changes in GDP and energy consumption (e.g. due to rebound
effects). The figures in the table are based on results from E3ME and differ from the
results from the PRIMES model that are reported in the EED Impact Assessment because
34 Science, technology, engineering and mathematics.

June 2017 66
they are based on economic sectors rather than the physical quantities modelled in
PRIMES.
The measure shows some improvements in energy security in the scenarios. However,
in all the scenarios these impacts are quite small in magnitude at EU level. The scenarios
without any crowding out have marginally better improvements in energy security
because the denominator in the calculation, GDP, is higher.
At Member State level, there are however some noticeable differences. The countries
most affected are: the Czech Republic, Latvia, Lithuania, Poland and Slovakia. While
these countries are among those that make the largest investments in energy efficiency
in the scenarios, they also are relatively exposed in terms of the size of their energy
import bills (as a share of GDP). Furthermore, according to COMEXT data for 2016
(supplemented by IEA analysis), these countries are often exposed to a single non-EEA
supplier and therefore have strong grounds for improving energy efficiency (see Table
IV-935).
In the scenarios, these countries are thus taking the opportunity offered by higher rates
of energy efficiency to reduce their dependence on imported energy.
Table IV-8: Energy imports as a share of GDP in 2030, %
EUCO27 EUCO30 EUCO33 EUCO35 EUCO40 No CO Part
CO No CO Part
CO No CO Part
CO No CO Part
CO No CO Part
CO
AT 0.07 0.07 0.07 0.07 0.06 0.06 0.06 0.06 0.06 0.06
BE 0.23 0.23 0.23 0.23 0.23 0.23 0.23 0.23 0.22 0.23
BG 0.05 0.05 0.05 0.05 0.04 0.04 0.04 0.04 0.04 0.04
CY 0.10 0.10 0.10 0.10 0.10 0.10 0.10 0.10 0.10 0.10
CZ 0.06 0.06 0.06 0.06 0.05 0.05 0.05 0.05 0.05 0.05
DE 0.05 0.05 0.04 0.04 0.04 0.04 0.04 0.04 0.04 0.04
DK 0.04 0.04 0.04 0.04 0.03 0.03 0.03 0.03 0.03 0.03
EE 0.13 0.13 0.12 0.12 0.12 0.12 0.12 0.12 0.12 0.12
EL 0.11 0.11 0.11 0.11 0.11 0.11 0.11 0.11 0.11 0.11
ES 0.07 0.07 0.07 0.07 0.07 0.07 0.07 0.07 0.06 0.06
FI 0.03 0.03 0.03 0.03 0.02 0.02 0.02 0.02 0.02 0.02
FR 0.08 0.08 0.08 0.08 0.08 0.08 0.08 0.08 0.08 0.08
HR 0.12 0.12 0.12 0.12 0.12 0.12 0.12 0.12 0.12 0.12
HU 0.08 0.08 0.08 0.08 0.08 0.08 0.08 0.08 0.08 0.08
IE 0.03 0.03 0.03 0.03 0.03 0.03 0.03 0.03 0.03 0.03
IT 0.07 0.07 0.06 0.06 0.06 0.06 0.06 0.06 0.06 0.06
LT 0.62 0.62 0.61 0.61 0.61 0.61 0.60 0.61 0.60 0.61
LU 0.10 0.10 0.10 0.10 0.10 0.10 0.09 0.09 0.10 0.10
LV 0.42 0.42 0.42 0.42 0.41 0.42 0.41 0.42 0.39 0.42
MT 0.13 0.13 0.13 0.13 0.13 0.13 0.13 0.13 0.13 0.13
35 Again, these results may differ to those from the PRIMES model reported in the EED Impact Assessment because they are based on economic sectors rather than physical energy quantities. The E3ME results also include rebound effects, as discussed in Section 1.
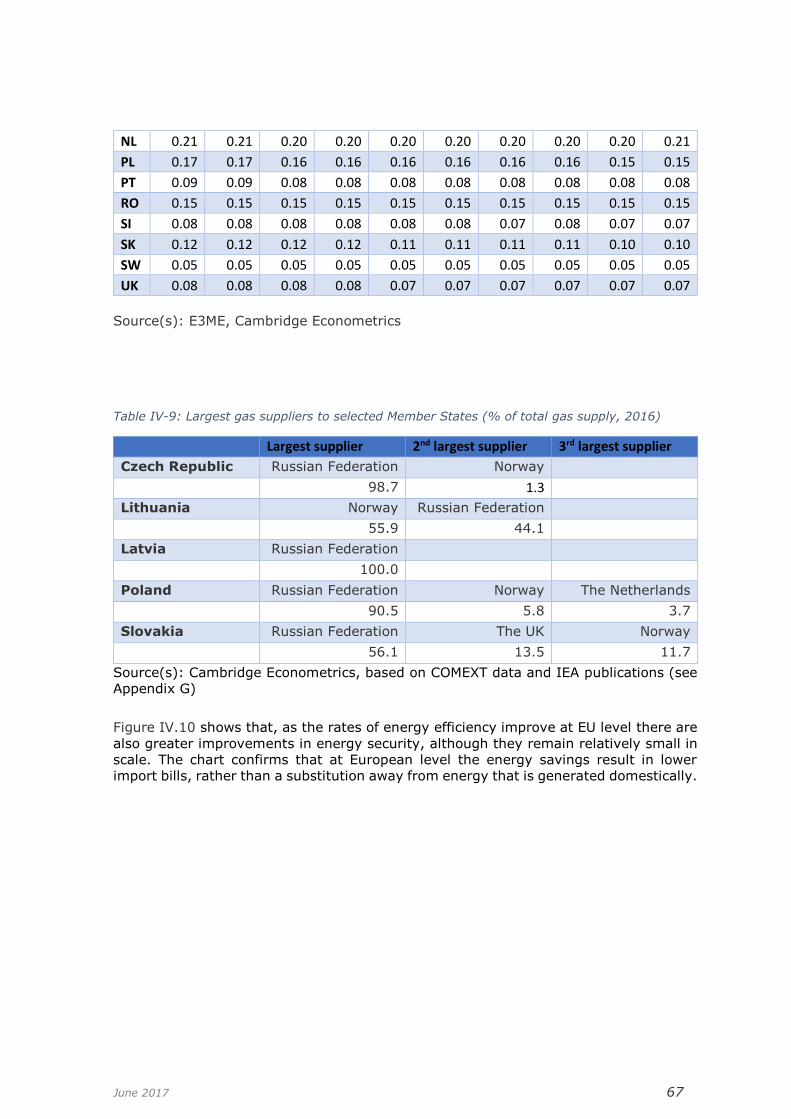
June 2017 67
NL 0.21 0.21 0.20 0.20 0.20 0.20 0.20 0.20 0.20 0.21
PL 0.17 0.17 0.16 0.16 0.16 0.16 0.16 0.16 0.15 0.15
PT 0.09 0.09 0.08 0.08 0.08 0.08 0.08 0.08 0.08 0.08
RO 0.15 0.15 0.15 0.15 0.15 0.15 0.15 0.15 0.15 0.15
SI 0.08 0.08 0.08 0.08 0.08 0.08 0.07 0.08 0.07 0.07
SK 0.12 0.12 0.12 0.12 0.11 0.11 0.11 0.11 0.10 0.10
SW 0.05 0.05 0.05 0.05 0.05 0.05 0.05 0.05 0.05 0.05
UK 0.08 0.08 0.08 0.08 0.07 0.07 0.07 0.07 0.07 0.07
Source(s): E3ME, Cambridge Econometrics
Table IV-9: Largest gas suppliers to selected Member States (% of total gas supply, 2016)
Largest supplier 2nd largest supplier 3rd largest supplier
Czech Republic Russian Federation Norway 98.7 1.3
Lithuania Norway Russian Federation 55.9 44.1
Latvia Russian Federation 100.0
Poland Russian Federation Norway The Netherlands 90.5 5.8 3.7
Slovakia Russian Federation The UK Norway 56.1 13.5 11.7
Source(s): Cambridge Econometrics, based on COMEXT data and IEA publications (see
Appendix G)
Figure IV.10 shows that, as the rates of energy efficiency improve at EU level there are
also greater improvements in energy security, although they remain relatively small in
scale. The chart confirms that at European level the energy savings result in lower
import bills, rather than a substitution away from energy that is generated domestically.

June 2017 68
Figure IV.10: EU28 energy imports as a share of GDP in 2030, % difference from EUCO27 scenario (no crowding out)
Source(s): E3ME, Cambridge Econometrics
2.8 The public finance variant
As a sensitivity, an alternative financing variant was tested in which all the additional
investment in energy efficiency is paid for by the public sector, which increases VAT
rates to cover the costs. The scenarios are otherwise identical to those assessed above,
and include the same two alternative assumptions on the degree of crowding out.
As the amount of energy efficiency in the scenarios is the same, many of the impacts
(for example on health or the environment) are the same, irrespective of the financing
mechanism. The main differences are in the economic results and public finance results
(see Section 6.3).
Table IV-10 compares the GDP impacts between the public financing and self-financing
variants, and Table IV-11 compares impacts on employment. The results show that
there is an additional stimulus effect when the investment is all publicly financed through
an increase in VAT rates.
The main reason for these results is the impact of VAT receipts. In the public financing
case, household expenditure on energy efficiency is not subject to VAT as it is purchased
by the public sector, whereas if household self-finance then they must pay VAT. While
lower VAT payments in the public finance variant mean that tax revenues are lower (see
Section 6.3), it provides an additional stimulus, as less money is taken out of the
economy. The impacts on GDP and public finances are thus reversed between the two
variants.
The employment effects are slightly better in the self-financing case, however. This is
due to endogenous, second round effects in the modelling, relating to changes in
consumption rather than the investment in energy efficiency. In the public financing
variant, VAT rates must increase by more to finance the additional public expenditure,
which reduces the level of household expenditure (both compared to reference case and
the self-financing case). As some of the most labour-intensive sectors (e.g. retail,
-8%
-7%
-6%
-5%
-4%
-3%
-2%
-1%
0%
EUCO30 EUCO33 EUCO35 EUCO40

June 2017 69
hospitality) rely on household expenditure for their demand, the increase in total labour
demand is less in the public financing variant than in the self-financing variant.
Table IV-10: GDP impacts in the public financing case (% from EUCO27)
Crowding out
Financing mechanism
EUCO30 EUCO33 EUCO35 EUCO40
None Self 0.4 1.5 2.1 4.1 Public 0.7 2.1 2.9 5.3
Partial Self 0.4 1.3 1.6 2.2 Public 0.5 1.9 2.6 4.2
Source(s): E3ME, Cambridge Econometrics
Table IV-11: Employment impacts in the public financing case (% from EUCO27)
Crowding out
Financing mechanism
EUCO30 EUCO33 EUCO35 EUCO40
None Self 0.2 0.7 1.0 2.1 Public 0.2 0.6 0.9 1.6
Partial Self 0.2 0.6 0.9 1.4 Public 0.2 0.6 0.8 1.3
Source(s): E3ME, Cambridge Econometrics
The results for the macro indicators in the public financing variant are shown in Table
IV-12. The main difference to the self-financing results described in Section 2.2 relates
to the definitions used in the scenario design. In the self-financing variant, investment
in energy efficiency by households is counted as household consumption (i.e. consumer
expenditure), whereas when paid for by government it is counted as investment. The
results in Table IV-12 thus show higher investment and lower consumer expenditure
than the results from the self-financing scenario variants. However, this does not reflect
real differences in the scenarios; households still benefit from the same equipment being
installed.
Aside from the GDP and employment differences described above, the other impacts
are broadly in line with those in the self-financing variant.
Table IV-12: EU28 summary of macroeconomic impacts in public finance variant, 2030, % from EUCO27 scenario
Degree of crowding out
EUCO30 EUCO33 EUCO35 EUCO40
GDP No crowding out 0.7 2.1 2.9 5.3 Partial crowding out 0.5 1.9 2.6 4.2
Employment No crowding out 0.2 0.6 0.9 1.6
Partial crowding out 0.2 0.6 0.8 1.3
Consumer expenditure
No crowding out -0.1 0.0 -0.2 -0.3
Partial crowding out -0.4 -0.1 -0.2 -0.3

June 2017 70
Investment No crowding out 3.7 10.0 14.7 26.8 Partial crowding out 3.6 9.6 13.3 21.2
Exports No crowding out 0.0 0.2 0.3 0.8 Partial crowding out 0.1 0.2 0.3 0.5
Imports No crowding out 0.6 1.6 2.4 4.5 Partial crowding out 0.5 1.5 2.1 3.4
Price index No crowding out 1.0 1.9 3.0 5.3 Partial crowding out 0.9 1.9 2.7 4.2
Source(s): E3ME, Cambridge Econometrics

June 2017 71
3 Health
The following section summarises the results on health. It is based on the E3ME model
results for levels of air pollutants. The first part of this section summarises the approach
adopted to estimate the impacts. The second part presents the aggregated results.
The results in this section are presented as difference to the EUCO27 scenario. Part III,
Section 3 describes the methodology that has been applied, including the key
assumptions and limitations. It should be noted that there is a high degree of
uncertainty about the results as they depend on specific contexts relating to for example
the location of the air pollution and the characteristics of different healthcare systems
across Europe.
3.1 Approach to estimate the health impacts
The E3ME model was used to estimate the reductions in emission of SO2, NOx and PM10
at Member State level for each scenario, compared to the EUCO27 scenario. Section 4.3
presents the results for emissions levels for SO2 and NOx.
Using the approach detailed below, the associated cost savings in terms of mortality
and morbidity were estimated:
• For SO2 and NOx, the third scenario of damages per tonne of emission of SO2
and NOx, calculated by the CAFE36 programme (which includes mortality,
morbidity and crop damage), was used. This marginal cost per tonne was
multiplied by the decrease in emissions in the E3ME results. Following the CAFE
instructions, it was estimated that the crop damage represented, on average,
10% of the cost. This cost was deducted so that the figures only account for the
health damage.
• According to results presented in Air quality in Europe (European Environment
Agency, 2016), particulates are responsible for the biggest share of mortality
and morbidity in the overall healthcare cost, accounting for around 84% of
mortality (out of total related healthcare costs of between €330 billion and €940
billion). The data on damages provided by the CAFE programme could therefore
not be used as they seemed largely underestimated.
A review of studies, some of which provide alternative estimates, is provided in Appendix
D. The figures that have been used were chosen because they are specific to Europe.
The E3ME results suggest that PM10 emissions could be reduced by around 13.4% across
Europe in the period up to 2030 in the EUCO40 scenario, compared to EUCO27.
Assuming that 84% of the current mortality and morbidity cost is due to emissions of
particulates, these emissions are currently responsible for losses of up to €790 billion
(mid-range estimate €533 billion). Using a linear formula to apply the decrease in
emissions to the cost, the results reveal estimated savings of up to €40 billion for
EUCO30 scenario and up to €106 billion in the EUCO40 scenario (compared to EUCO27).
However, in the analysis below we take mid-range, rather than maximum, values, so
the amounts are €27 billion and €71 billion.
3.2 Aggregated results
The results for healthcare cost savings arising from mortality and morbidity costs
savings are displayed in Table IV-13.
36 Clean Air for Europe.

June 2017 72
SO2 and NOx results
Comparison of the EUCO30 to the EUCO27 scenario reveals health care cost savings of
around €1.1bn from reduced levels of SO2 and NOx emissions in the EU28 by 2030, as
a result of improved energy efficiency. The savings increase further in the more
ambitious scenarios, with a maximum additional decrease of €5.6bn in the EUCO40
scenario.
The SO2 and NOx health costs savings were also calculated at country level. These more
detailed results show that Germany, Italy and France account for 65% of the health-
related cost savings from NOx reductions in the EUCO27 scenario and 70% in the
EUCO30 scenario.
Particulate results
Using the methodology detailed above, the results reveal that reduced emissions of
particulates could generate considerable cost savings from reduced mortality and
morbidity. Compared to the EUCO27 scenario, improved energy efficiency could achieve
savings of around €27 billion (EUCO30) to €71 billion (EUCO40). The particulate results
were also calculated at country level.
All the aggregate results for EU28 are presented in Table IV-13 (below).
Table IV-13 EU28 Annual health cost impacts, difference from EUCO27
Mortality & morbidity / cost savings, SOx in 2030
Mortality & morbidity / cost savings, NOx in 2030
Mortality & morbidity / cost savings, PM10 and PM2.5 in 2030
Mortality & morbidity / cost savings NOx, SOx, PM10 and PM2.5 in 2030
m€ / year m€ / year m€ / year m€ / year
EUCO30 -1,056 -62 -27,183 -28,301
EUCO33 -489 9 -54,366 -54,846
EUCO35 -1,365 247 -56,498 -57,616
EUCO40 -4,158 -1,467 -71,422 -77,047
The cost savings from the health benefits increase in line with the ambition in the
different energy emission target scenarios, with the savings being greater in the more
ambitious scenarios. Using this methodology, the total cost savings related to reduced
SO2, NOx and PM emissions are estimated to be between €41 billion (EUCO30) and €111
billion (EUCO40) each year by 2030 (compared to the EUCO27 scenario), depending on
the level of ambition. The savings achieved in the most ambitious scenario (EUCO40)
represent around 6% of the overall annual economic cost of health impacts and
mortality from air pollution for the EU28 in 2010, as calculated by the OECD37.
These figures include benefits relating to both reductions in indoor and outdoor air
pollution, which partly explains why they are substantially higher than those reported
in the EED Impact Assessment. However, there are several reasons to be cautious about
the results presented in this report due to the assumptions involved. The first relates to
the definition of particulates; E3ME reports only PM10 while much of the healthcare
costs result from PM2.5. An extrapolation of proportional impacts to the smaller
particular matter may lead to some bias in results. The second factor is the linear nature
37 According to the Cost of Air pollution, Health Impacts of Road Transportation published by the OECD (2014), the cost of outdoor air pollution in OECD countries, both deaths and illness, was about USD 1.7 trillion in 2010.

June 2017 73
of the approach applied, which does not reflect the non-linear ‘dose-response’ measures
used in more complex modelling approaches. This may lead to differences in the less
ambitious scenarios in particular; it is notable that the estimate in Table IV-13 is
substantially above the result from GAINS for the EUCO30 scenario (€28 billion
compared to a maximum of €8 billion), but for the EUCO40 scenario the results are
much closer in relative terms (€77 billion compared to a maximum of €56 billion).
The final point to note from Table IV-13 is that it is possible for health costs to increase
slightly due to NOx pollution in the scenarios. This relates in part to rebound effects and
changes in the choice of fuel, but particularly to indirect effects due to changes in ETS
prices. This is discussed in more detail in Section 4.
The health impacts at Member State level are shown in Table IV-14. Germany and
France account for more than half the overall benefits from all the pollutants. Differences
between Member States are mostly explained by how emissions of particulates in each
country change in the scenarios. France sees the largest reduction in healthcare costs
because it reduces emissions of particulates by around a third. Germany and Italy also
have large reductions in healthcare costs, partly because of reductions in particulates
(around 10-15% in the EUCO40 scenario) but also due to their relative sizes.
It is important to note that the Member State level impacts are quite dependent on what
happens in the wider energy mix, which in turn is also affected by energy and climate
policies, including the Emission Trading Scheme. In particular, many of the health
impacts and the corresponding benefits depend strongly from the levels of consumption
of coal in the power sector, fuel oil in industrial sectors and motor spirit in transport.
Changes in any of these can lead to higher healthcare costs in some countries. This
issue is discussed further in Section 4.3.
Table IV-14: Health impacts by Member State (m€ pa), % difference from EUCO27 in 2030
EUCO30 EUCO33 EUCO35 EUCO40
AT -1,838 -4,025 -5,097 -6,789
BE -219 -438 -554 -238
BG -1,064 -643 723 -461
CY 8 3 -15 -8
CZ -811 -2,427 -3,537 -2,271
DE -2,343 -8,077 -4,637 -10,220
DK -459 -830 -1,061 -1,285
EL -164 -255 -223 -505
EN -156 -251 -291 -664
ES 2,370 520 -1,164 -4,939
FI -581 -1,184 -1,248 -421
FR -11,688 -19,844 -21,839 -22,230
HR -185 283 -208 176
HU 691 255 439 233
IE -337 -693 -714 -790
IT -4,069 -4,444 -4,721 -6,597
LT -339 -396 -556 -839
LV -334 -554 -645 -790
LX -7 -24 -26 -22

June 2017 74
MT 0 1 1 1
NL 3 123 203 50
PL -2,834 -5,876 -5,999 -11,533
PT -850 -667 -742 -575
RO -979 -1,520 -1,342 34
SI -247 -374 -473 -744
SK -41 -424 -959 -1,796
SW -430 -845 -736 -1,027
UK -1,398 -2,241 -2,194 -2,798
EU -28,301 -54,846 -57,616 -77,047

June 2017 75
4 Environmental impacts
4.1 Introduction
This section presents the results for environmental impacts from the modelling exercise
with E3ME. It covers:
• Energy consumption
• Greenhouse gas and other air-borne emissions
• Material consumption
• Water consumption by the power sector
As in other sections, the time horizon for the analysis is 2030 and, unless otherwise
stated, the results are compared to the EUCO27 scenario.
4.2 Sectoral impacts on energy consumption
Table IV-15 show the impacts on final energy demand by sector for the EU28 as
percentage differences from the EUCO27 scenario. The figures are based on the PRIMES
results (once converted to inputs for E3ME) but they also incorporate the rebound effects
that are described in Section 1.1, plus some variations from indirect price effects that
result from E3ME’s econometric equations.
The buildings sector (a combination of households and commerce) sees the largest
relative reduction in final energy consumption and there are also substantial reductions
in some of the less energy intensive sectors. In contrast, the transport sectors show
indirect rebound effects with modest increases in energy consumption recorded. These
results follow the general pattern from PRIMES. Rebound effects can affect all sectors
as expenditure increases across the economy but are particularly prevalent in
construction and its supply chain (e.g. production of metals and minerals, plus
transport).
The reductions in final energy consumption are driven by the level of investment in
energy efficiency in the different scenarios. The impact on final energy consumption by
households in the EU28 ranges from -20.8% (in EUCO30) to -41.6% (in EUCO40), while
for the whole economy the range is from -7.1% (in EUCO30) to -17.8% (in EUCO40).
The pattern of sectoral energy consumption does not change by much if partial crowding
out is enforced, as the direct energy savings remain unchanged regardless of crowding
out assumptions.

June 2017 76
Table IV-15 EU28 Final energy demand by sector, 2030, % from EUCO27 scenario (no crowding out)
EUCO27 (Mtoe)
EUCO30 EUCO33 EUCO35 EUCO40
Iron & steel 33.0 0.6 -0.1 -3.3 -5.3
Non-ferrous metals 9.4 -1.6 -2.3 -4.2 -11.5
Chemicals 54.1 -0.9 -7.2 -12.7 -17.6
Non-metallic minerals 34.8 0.3 -0.6 -2.4 -6.0
Ore-extraction 9.8 -0.3 -0.7 -1.2 -5.3
Food, drink & tobacco 26.7 -2.1 -10.2 -18.2 -30.3
Textiles & clothing 3.3 -1.8 -2.3 -6.7 -18.9
Paper & pulp 30.2 -1.1 -3.8 -8.5 1.5
Engineering 32.3 -3.1 -5.2 -6.9 -20.8
Other industry 33.0 0.0 -1.2 -4.4 -5.6
Construction 5.9 0.0 -2.9 -7.1 -15.1
Rail transport 9.0 -0.1 -0.3 -0.7 -1.2
Road transport 267.0 0.4 1.0 1.5 2.9
Air transport 58.5 0.9 2.3 3.0 5.0
Other transp. services 6.0 0.3 1.3 1.9 3.8
Households 221.5 -20.8 -35.5 -33.1 -41.6
Agriculture, forestry 22.9 0.0 0.1 0.2 0.3
Fishing 0.8 0.0 0.0 0.0 0.1
Commerce 135.5 -17.6 -31.4 -37.9 -46.1 Source(s): E3ME, Cambridge Econometrics
The magnitude of the impacts also varies considerably between countries (see Table
IV-16), reflecting differences in the current quality of the building stock and the potential
for energy efficiency improvements. The reductions in final energy consumption, most
notably in the EUCO40 scenario, are highest in countries where the scope for further
energy efficiency improvements remains the greatest.
Again, the results in Table IV-16 differ from those from PRIMES due to rebound and
other indirect effects that are included in the modelling with E3ME.

June 2017 77
Table IV-16 Final energy demand by Member State, 2030, % from EUCO27 scenario (no crowding out)
EUCO27 (Mtoe)
EUCO30 EUCO33 EUCO35 EUCO40
AT 23.6 -7.5 -16.7 -21.3 -29.9
BE 36.6 -4.9 -10.6 -13.4 -13.7
BG 9.2 -4.4 -4.6 -7.1 -12.4
CY 1.7 -5.4 -12.4 -17.5 -14.2
CZ 22.5 -4.2 -10.8 -14.6 -8.9
DE 171.7 -6.1 -13.5 -10.5 -16.9
DK 13.5 -4.3 -8.0 -11.1 -11.9
EL 15.2 -5.6 -7.5 -7.7 -7.7
EN 3.0 -3.2 -6.2 -6.6 -11.4
ES 78.9 -3.9 -8.3 -11.1 -13.9
FI 21.2 -3.3 -6.6 -9.1 -7.3
FR 123.3 -12.5 -21.4 -23.6 -23.7
HR 5.7 -4.7 -6.8 -5.6 -9.6
HU 14.9 -5.7 -11.3 -12.7 -21.6
IE 10.3 -6.1 -12.7 -13.9 -15.9
IT 110.0 -5.7 -10.9 -14.2 -21.9
LT 4.3 -4.8 -7.7 -10.3 -14.3
LV 4.6 -2.0 -1.6 -1.5 3.1
LX 4.6 -4.4 -9.5 -10.7 -10.1
MT 0.5 -7.0 19.8 -1.4 -7.0
NL 42.6 -4.2 -8.5 -11.3 -17.9
PL 70.9 -4.0 -8.6 -10.1 -15.8
PT 15.7 -3.6 -2.9 -3.4 -1.3
RO 25.0 -2.0 -4.0 -4.8 -5.8
SI 4.8 -2.1 -4.4 -5.5 -6.9
SK 9.8 -4.5 -12.6 -14.8 -11.6
SW 31.2 -3.0 -5.5 -5.0 5.4
UK 118.4 -16.0 -22.4 -23.4 -30.8
EU 993.7 -7.1 -12.9 -14.1 -17.8
Source(s): E3ME, Cambridge Econometrics
4.3 Impacts on GHGs and other air-borne emissions
The levels of greenhouse gas emissions in each scenario are reported by the PRIMES
and GAINS models in the Impact Assessment. These results are summarised in Table
IV-17.
There is an important question as to whether the rebound effects described above could
increase emissions in the scenarios, potentially meaning that the 40% GHG emission
target for 2030 is not met. The E3ME results have been interrogated in more detail to
assess what the impact of rebound effects on GHG emissions would be. The additional
emissions attributed to the rebound effect are estimated by comparing the model inputs
from PRIMES with final results from E3ME. In the E3ME analysis the ETS price is fixed

June 2017 78
to match the values from PRIMES and so additional emissions from rebound effects are
counted both from the ETS and non-ETS sectors.
The results of this calculation are shown in Table IV-18. The figures show that rebound
effects would have a very modest impact on GHG emissions in the EU and would not
jeopardise the 40% emission reduction target for 2030.
Table IV-17: GHG emissions in the scenarios, excluding rebound effects (2030, % change from 1990 levels)
EUCO30 EUCO33 EUCO35 EUCO40
Total GHGs -40.8 -43.0 -43.9 -47.2 Source(s): PRIMES and GAINS models
Table IV-18: GHG emissions in the scenarios, including rebound and other secondary effects (2030, % change from 1990 levels)
EUCO30 EUCO33 EUCO35 EUCO40
Total GHGs -40.7 -42.7 -43.6 -46.6 Source(s): E3ME, Cambridge Econometrics
The E3ME model also provides estimates of impacts on SO2 and NOx emissions, although
the model does not go into the same level of detail as a specialised tool such as GAINS.
The main impacts of these emissions are on human health and are described in the
previous section, but there are also environmental impacts. Table IV-19 presents these
results.
At EU level, there are modest reductions in both SO2 and NOx emissions, which increase
as the level of ambition in the scenarios increases. At Member State level, however, the
results reported by the model are much more varied.
A closer inspection of the results from E3ME reveals that the impacts on both emission
types are impacted strongly by changes in the use of coal-fired power generation, which
are taken directly from PRIMES. Impacts on SO2 in particular are very closely linked to
the use of coal for energy purposes. While increased rates of energy efficiency allow for
reductions in total power generation, the fuel mix used may vary in the period up to
2030, mainly because of the lower ETS prices in the scenarios modelled by PRIMES.
Countries where coal-fired generation increases, including Austria, Spain, Hungary and
Greece, may see higher levels of SO2 and NOx emissions. Conversely, in countries where
higher rates of energy efficiency lead to a reduction in coal-fired power there are larger
reductions in these emissions.
Other factors that affect emissions of NOx and, to a lesser extent SO2, include levels of
activity in the transport sector (e.g. in response to rebound effects). Where countries
see different impacts for SO2 and NOx, transport-related emissions are often the reason.
Agricultural emissions of NOx may also increase slightly if wider economic growth
accelerates.
The pattern of results from E3ME is similar to that reported by GAINS at EU level38. The
absolute impacts for SO2 are larger in E3ME (up to 251 ktons, compared to 148 ktons
in GAINS in the EUCO40 scenario). The differences are likely to reflect the more detailed
modelling approach that is available in GAINS. The NOx impacts reported by E3ME are
38 See Impact Assessment, page 59.

June 2017 79
quite a lot smaller (up to 133 ktons reduction) than in GAINS (up to 487 ktons). Here
the differences in modelling approach are also relevant, but the inclusion of rebound
effects in the E3ME analysis also make a difference, as the E3ME results incorporate
additional emissions from agriculture and transport that are linked to higher general
rates of economic activity.
In summary, one can conclude that, whilst higher rates of energy efficiency provide the
potential for reductions in emissions, to realise the full potential savings it is necessary
to ensure that the energy mix is not changed in a way that limits emission reductions.
In particular, benefits would be higher if measures were taken to ensure that coal does
not become a bigger share of the power mix. The interaction of other policies (notably
the EU ETS) is important here.
Table IV-19: SO2 and NOx impacts in the scenarios (% change from EUCO27, no crowding out)
EUCO30 EUCO33 EUCO35 EUCO40
SO2 NOx SO2 NOx SO2 NOx SO2 NOx
AT 13.5 6.8 14.1 5.8 24.7 10.6 42.7 10.0
BE -1.0 -2.1 -3.4 -4.5 -3.6 -4.5 1.4 -2.1
BG -3.1 -1.1 -3.7 -0.6 14.9 9.4 9.0 11.5
CY 0.3 0.6 -3.0 0.0 -9.7 -1.8 -7.0 0.1
CZ -0.4 -0.1 -5.1 -2.1 -8.8 -3.6 12.1 9.2
DE 0.4 2.0 -4.1 0.2 0.1 3.1 -4.6 0.5
DK -5.9 -2.6 -15.9 -5.4 -11.4 -1.9 -15.5 -3.5
EE 1.8 1.7 -0.6 1.3 -2.2 1.1 -6.5 -1.9
EL 12.0 4.9 10.5 4.6 16.3 7.1 17.8 8.1
ES 12.0 7.7 4.2 5.4 0.6 4.7 -11.2 -1.2
FI -3.1 -1.5 -6.7 -3.4 -3.1 -2.9 -1.6 0.0
FR -4.1 -3.4 -9.5 -6.0 -11.6 -6.2 -14.5 -5.1
HR 1.3 0.1 15.7 3.0 1.0 0.6 20.5 4.9
HU 36.0 13.8 33.0 13.3 44.2 18.5 49.3 22.0
IE -4.7 -1.3 -10.6 -3.1 -11.4 -3.0 -13.3 -2.9
IT -18.7 -7.2 -19.4 -8.1 -17.2 -7.6 -22.7 -10.3
LT -1.4 0.1 -5.8 0.8 -7.9 1.0 -9.8 2.9
LU -4.1 -0.8 -10.9 -1.7 -14.1 -1.9 -13.8 -1.2
LV 0.5 0.6 -0.3 1.2 0.4 2.0 -4.1 1.9
MT -7.0 -0.2 19.2 4.0 -1.7 2.5 -6.6 4.1
NL 1.5 -1.0 0.8 -2.4 2.8 -2.2 6.0 0.5
PL 1.4 2.5 -0.6 2.3 0.3 3.3 -4.6 0.9
PT 5.0 0.8 -8.7 2.3 -11.3 3.7 -18.7 10.0
RO 0.4 0.0 -0.3 0.3 -0.5 0.7 15.4 7.2
SI -6.9 -2.2 -19.2 -6.0 -6.0 -0.1 -22.7 -4.0
SK -1.1 -1.1 -12.7 -7.4 -21.9 -11.7 -35.8 -16.9
SW 0.7 0.1 -5.2 -1.3 -8.2 -0.7 -18.6 -5.0
UK -2.6 -4.5 -8.7 -7.3 -8.8 -7.1 -12.0 -9.6
EU -0.6 0.0 -4.3 -1.6 -2.5 -0.6 -5.1 -1.5
Source(s): E3ME, Cambridge Econometrics
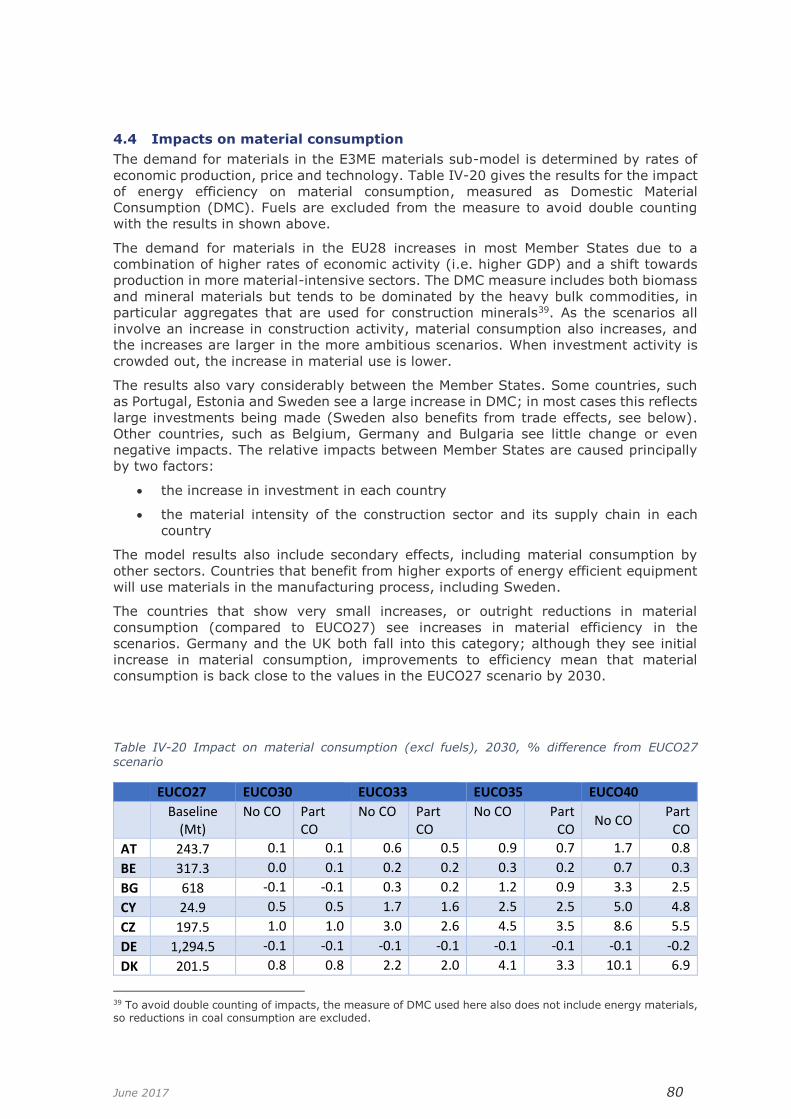
June 2017 80
4.4 Impacts on material consumption
The demand for materials in the E3ME materials sub-model is determined by rates of
economic production, price and technology. Table IV-20 gives the results for the impact
of energy efficiency on material consumption, measured as Domestic Material
Consumption (DMC). Fuels are excluded from the measure to avoid double counting
with the results in shown above.
The demand for materials in the EU28 increases in most Member States due to a
combination of higher rates of economic activity (i.e. higher GDP) and a shift towards
production in more material-intensive sectors. The DMC measure includes both biomass
and mineral materials but tends to be dominated by the heavy bulk commodities, in
particular aggregates that are used for construction minerals39. As the scenarios all
involve an increase in construction activity, material consumption also increases, and
the increases are larger in the more ambitious scenarios. When investment activity is
crowded out, the increase in material use is lower.
The results also vary considerably between the Member States. Some countries, such
as Portugal, Estonia and Sweden see a large increase in DMC; in most cases this reflects
large investments being made (Sweden also benefits from trade effects, see below).
Other countries, such as Belgium, Germany and Bulgaria see little change or even
negative impacts. The relative impacts between Member States are caused principally
by two factors:
• the increase in investment in each country
• the material intensity of the construction sector and its supply chain in each
country
The model results also include secondary effects, including material consumption by
other sectors. Countries that benefit from higher exports of energy efficient equipment
will use materials in the manufacturing process, including Sweden.
The countries that show very small increases, or outright reductions in material
consumption (compared to EUCO27) see increases in material efficiency in the
scenarios. Germany and the UK both fall into this category; although they see initial
increase in material consumption, improvements to efficiency mean that material
consumption is back close to the values in the EUCO27 scenario by 2030.
Table IV-20 Impact on material consumption (excl fuels), 2030, % difference from EUCO27
scenario
EUCO27 EUCO30 EUCO33 EUCO35 EUCO40
Baseline (Mt)
No CO Part CO
No CO Part CO
No CO Part CO
No CO Part
CO
AT 243.7 0.1 0.1 0.6 0.5 0.9 0.7 1.7 0.8
BE 317.3 0.0 0.1 0.2 0.2 0.3 0.2 0.7 0.3
BG 618 -0.1 -0.1 0.3 0.2 1.2 0.9 3.3 2.5
CY 24.9 0.5 0.5 1.7 1.6 2.5 2.5 5.0 4.8
CZ 197.5 1.0 1.0 3.0 2.6 4.5 3.5 8.6 5.5
DE 1,294.5 -0.1 -0.1 -0.1 -0.1 -0.1 -0.1 -0.1 -0.2
DK 201.5 0.8 0.8 2.2 2.0 4.1 3.3 10.1 6.9
39 To avoid double counting of impacts, the measure of DMC used here also does not include energy materials, so reductions in coal consumption are excluded.

June 2017 81
EE 54.3 1.5 1.5 5.4 5.2 8.6 8.0 17.6 14.6
EL 127.3 0.5 0.5 1.2 1.1 1.9 1.5 3.8 2.3
ES 805.1 1.5 1.5 3.4 3.4 5.1 5.0 10.0 9.6
FI 274.4 0.1 0.1 0.3 0.3 0.6 0.6 1.2 1.1
FR 969 0.5 0.5 1.1 1.0 1.6 1.4 3.0 2.3
HR 25.8 -0.1 -0.1 -0.5 -0.5 -0.6 -0.5 -0.7 -0.6
HU 112 0.4 0.3 1.6 0.9 2.3 1.1 4.1 1.1
IE 201.9 1.1 1.1 3.6 3.4 5.8 5.0 11.5 8.1
IT 966.5 1.2 1.2 4.1 4.1 6.3 5.6 12.3 9.0
LT 103.1 1.2 1.2 3.6 3.5 5.3 4.4 10.9 6.7
LU 13.2 1.6 1.6 4.7 4.5 7.3 6.6 14.8 11.4
LV 111.1 1.4 1.3 3.3 3.0 4.2 3.9 1.9 5.7
MT 6.5 0.4 0.4 1.2 1.2 1.8 1.7 3.7 2.9
NL 330 0.2 0.2 0.4 0.4 0.7 0.6 1.5 1.0
PL 946.4 1.0 1.0 3.0 2.9 5.1 4.3 10.1 7.1
PT 169.7 2.6 2.6 7.4 7.4 10.9 10.6 20.8 17.8
RO 485.2 0.0 0.0 0.0 0.0 0.0 0.0 0.0 0.0
SI 26.2 1.1 1.1 3.3 3.2 5.0 4.4 9.6 7.1
SK 78.8 0.5 0.5 1.4 1.3 2.1 1.8 4.1 2.8
SW 243.8 1.5 1.5 4.5 4.4 6.7 6.1 15.4 11.5
UK 779.8 0.0 0.0 -0.1 0.0 -0.1 -0.1 -0.3 -0.2
EU 9,727.5 0.6 0.6 1.7 1.7 2.7 2.4 5.5 4.2
Source(s): E3ME, Cambridge Econometrics
4.5 Impacts on water used by the power sector
The power sector uses water mainly for cooling purposes. The available data from
Eurostat make it difficult to assess the exact share of water consumption that the power
sector accounts for but it is likely to be sizable. As the EU moves towards a more
renewable energy mix, power sector water consumption is likely to fall, but a move
towards more energy efficiency could make it fall at a faster rate.
In Table IV-21, water use refers to power sector water withdrawals only. The approach
for deriving the figures is explained in Part III Section 4.4. It is noted that as water
intensity varies on a plant-by-plant basis (and local geography), the figures are
estimates based on available data by generation technology40.
The results of the calculation show that water withdrawals from the power sector could
be reduced by up to 13% in the scenarios that were modelled. This reflects both
reductions in electricity demand and any changes in the power mix reported by PRIMES.
The impacts are in general largest in countries where there is a shift to renewables in
addition to energy efficiency measures. In four of the countries where the largest
impacts are observed (Belgium, Croatia, Luxembourg and Latvia), there is a shift
towards renewable generation that displaces other CCGT generation. Without additional
simulations from PRIMES that isolate the direct impacts of energy efficiency on the
power sector fuel mix from other indirect changes, it is therefore difficult to estimate
the reductions in water consumption that can be attributed to energy efficiency.
40 The source for the coefficients is a report for the US National Renewable Energy Laboratory (Macknick et al, 2011). The coefficients are reproduced in Appendix D, Section 4.5.

June 2017 82
However, the large reduction in the Netherlands is more closely related to reduced
energy consumption, reducing generation from both biomass and natural gas.
In contrast, the countries that have potential increases in water consumption by the
power sector (notably Spain and Austria) see renewable generation displaced in the
PRIMES scenarios, with some increases in thermal generation in 2030 to compensate.
In summary, in line with some of the other environmental indicators, the impacts of
greater energy efficiency must be considered in the context of the wider energy system.
At EU level, there is a clear trend that more energy efficiency leads to less water
consumption but, depending on how the power mix changes, this may not be the case
in all Member States.
Table IV-21 Changes in water consumption by the power sector in 2030, % difference from EUCO27 scenario
EUCO27
(Thousand m3)
EUCO30 EUCO33 EUCO35 EUCO40
AT 6.1 13.7 12.3 21.8 -16.6
BE 10.1 -6.9 -12.3 -16.4 -28.4
BG 24.1 -5.3 -5.3 -1.7 -11.8
CY 0.7 -0.9 -1.1 -1.1 -1.1
CZ 60.5 -0.1 -1.9 -2.7 -8.3
DE 300.5 -0.2 -0.3 -2.6 -13.8
DK 8.6 -5.1 -7.9 -1.2 -4.5
EL 11.1 -8.7 -11.8 -4.6 -17.2
EN 6.8 2.1 1.4 -1.5 -12.7
ES 57.7 15.4 13.4 13.3 -5.4
FI 37.0 2.8 -2.6 -5.5 -10.9
FR 305.9 -0.4 -2.6 -5.0 -17.9
HR 1.4 -10.3 -18.5 -21.7 -46.3
HU 22.0 -7.8 -8.3 -11.9 -20.8
IE 6.8 -2.8 -4.5 -5.1 -10.9
IT 84.6 -14.1 -17.6 -16.7 -28.0
LT 6.0 1.3 0.3 -3.6 -9.7
LV 1.1 -8.4 -17.8 -21.3 -26.6
LX 0.7 -5.4 -12.0 -19.6 -30.9
MT 0.5 0.0 0.0 0.0 0.0
NL 40.1 0.7 0.1 -1.0 -2.3
PL 134.1 0.4 -0.6 -0.9 -7.1
PT 2.0 -1.0 -11.2 -17.8 -21.8
RO 25.6 1.6 -1.4 -2.7 -8.2
SI 8.9 -8.4 -14.8 -7.9 -16.6
SK 26.9 -2.6 -7.6 -10.8 -16.0
SW 58.4 2.1 0.4 -1.3 -7.0
UK 140.6 -2.5 -4.0 -4.9 -6.5
EU 1388.5 -0.8 -2.5 -3.8 -13.0 Source(s): E3ME, Cambridge Econometrics

June 2017 83
5 Social impacts
This section summarises the household income distribution results for the EUCO30
policy scenario. Results for the other scenarios are provided in Appendix C. There is
then a brief qualitative discussion on other social impacts, drawing on the results from
the EPBD study.
Labour market and unemployment results are provided in the economic analysis in
Section 2.
5.1 E3ME distributional results
The distributional impacts of energy efficiency measure vary by country (see Table
IV-22, Table IV-23 and Table IV-25). The first quintile represents the poorest household
while the fifth quintile represents the households with the highest incomes. In
interpreting these results, it is important to note that it is assumed that the energy
efficiency measures in buildings are not targeted at specific socio-economic groups but
are instead spread evenly across all groups.
In most, but not all, countries, real incomes increase across all household groups. These
results are derived from the E3ME modelling described in Section 2 and reflect a
combination of factors:
• Higher employment rates
• Increases in wage rates
• Changes to taxation rates
The negative effects in some countries reflect increases in VAT rates, which reduce
households’ incomes in real terms. The VAT rates are increased in the scenarios to pay
for public investment in energy efficiency.
Generally, in most Member States the results show that lower income groups appear to
benefit the most from increased energy efficiency (and therefore lower heating bills).
This reflects the different spending patterns across the groups, with the lower income
households typically spending more on household heating. The results also reflect the
changes in VAT rates which can impact on high-income households more, for example
if food and other basic goods are not subject to VAT.
The exception is the UK, where secondary effects (principally through rents) mean that
there is quite a different outcome. The effects in the UK reflect how prices and wage
rates evolve and would be unlikely to occur in other countries.
However, the differences between groups are quite minor and the results also include
secondary effects, including endogenous changes in wage rates, that will also impact on
income distributions.
The key message to take from these results is that the scenarios do not appear to show
negative distributional impacts and therefore distributional effects should not be seen
as an obstacle to implementation of the energy efficiency measures. However, the final
impacts on income distribution would be determined by the exact nature of the policies
that are put in place to meet the energy efficiency targets, and the effects of targeting
the measures at particular groups of households are likely to outweigh the impacts
shown here.
The effects of crowding out reduce the income benefits to all households but do not in
general change the overall pattern of income distribution.

June 2017 84
Table IV-22: Real incomes by socio-economic group, 2030, EUCO30 (% difference from EUCO27 scenario) (no crowding out)
All households
First quintile
Second quintile
Third quintile
Fourth quintile
Fifth quintile
AT 0.2 0.2 0.2 0.2 0.2 0.2
BE 0.3 0.3 0.2 0.3 0.3 0.3
BG -0.3 -0.1 -0.2 -0.1 -0.2 -0.4
CY -0.1 0.0 0.0 -0.1 -0.1 -0.1
CZ 0.3 0.4 0.4 0.4 0.2 0.0
DE 0.0 -0.1 0.0 0.0 0.0 0.0
DK 0.0 0.2 0.1 0.0 -0.1 -0.1
EE -0.4 -0.2 -0.1 -0.3 -0.6 -0.6
EL 0.2 0.2 0.2 0.2 0.2 0.2
ES 0.0 0.1 0.0 0.0 -0.1 -0.1
FI 0.3 0.3 0.3 0.3 0.3 0.3
FR 1.0 1.0 1.1 1.0 1.0 0.9
HR 0.0 0.0 0.0 0.0 0.0 0.0
HU 0.7 1.2 1.0 0.9 0.6 0.2
IE -0.1 0.1 0.1 -0.1 -0.2 -0.3
IT 0.1 0.2 0.2 0.2 0.1 -0.1
LT 0.5 0.9 0.8 0.7 0.5 0.2
LU 0.2 0.3 0.2 0.2 0.2 0.2
LV 0.9 1.5 1.6 1.4 1.0 0.6
MT 0.9 0.9 0.9 0.9 0.9 0.8
NL 0.0 0.0 0.0 0.0 0.0 0.1
PL -0.7 -0.2 -0.3 -0.5 -0.7 -1.2
PT 0.4 0.4 0.5 0.4 0.4 0.4
RO -0.8 -0.8 -0.8 -0.8 -0.8 -0.9
SI -0.1 0.0 -0.1 -0.1 -0.2 -0.3
SK -0.4 -0.5 -0.5 -0.5 -0.4 -0.4
SW 0.1 0.1 0.1 0.1 0.1 0.1
UK 0.0 -1.8 -1.3 -0.6 0.3 0.3
EU 0.1 0.2 0.2 0.2 0.1 0.0
Source(s): E3ME, Cambridge Econometrics

June 2017 85
Table IV-23: Real incomes by socio-economic group, 2030, EUCO30 (% difference from EUCO27 scenario) (partial crowding out)
All households
First quintile
Second quintile
Third quintile
Fourth quintile
Fifth quintile
AT 0.2 0.2 0.2 0.2 0.2 0.2
BE 0.3 0.3 0.2 0.3 0.3 0.3
BG -0.3 -0.1 -0.2 -0.1 -0.2 -0.4
CY -0.1 0.0 0.0 -0.1 -0.1 -0.1
CZ 0.3 0.4 0.4 0.4 0.2 0.0
DE 0.0 -0.1 0.0 0.0 0.0 0.0
DK 0.0 0.2 0.1 0.0 -0.1 -0.1
EE -0.4 -0.2 -0.1 -0.3 -0.6 -0.6
EL 0.2 0.2 0.2 0.2 0.2 0.2
ES 0.0 0.1 0.0 0.0 -0.1 -0.1
FI 0.3 0.3 0.3 0.3 0.3 0.3
FR 1.0 1.0 1.1 1.0 1.0 0.9
HR 0.0 0.0 0.0 0.0 0.0 0.0
HU 0.7 1.2 1.0 0.8 0.6 0.3
IE -0.1 0.1 0.1 -0.1 -0.2 -0.3
IT 0.1 0.2 0.2 0.2 0.1 -0.1
LT 0.5 0.9 0.8 0.7 0.5 0.2
LU 0.2 0.3 0.2 0.2 0.2 0.2
LV 0.8 1.3 1.4 1.3 0.9 0.5
MT 0.9 0.9 0.9 0.9 0.9 0.8
NL 0.0 0.0 0.0 0.0 0.0 0.1
PL -0.7 -0.2 -0.3 -0.5 -0.7 -1.2
PT 0.4 0.4 0.5 0.4 0.4 0.4
RO -0.8 -0.8 -0.8 -0.8 -0.8 -0.9
SI -0.1 0.0 -0.1 -0.1 -0.2 -0.3
SK -0.4 -0.5 -0.5 -0.5 -0.4 -0.4
SW 0.1 0.1 0.1 0.1 0.1 0.1
UK 0.0 -1.8 -1.3 -0.6 0.3 0.3
EU 0.1 0.2 0.2 0.2 0.1 0.0
Source(s): E3ME, Cambridge Econometrics
Table IV-24 shows how the differences change as the level of energy efficiency becomes
more ambitious in the EUCO33 scenario. Although real incomes for all household groups
increase as the level of ambition increases, the distributional patterns do not change.
Results for the other scenarios at Member State level are presented in Appendix E.

June 2017 86
Table IV-24: EU real incomes in EUCO30 and EUCO33 scenarios (% difference from EUCO27 scenario in 2030)
Degree of crowding out
All h’holds
First quintile
Second quintile
Third quintile
Fourth quintile
Fifth quintile
EUCO30 None 0.1 0.2 0.2 0.2 0.1 0.0
EUCO33 None 0.7 1.1 1.0 0.9 0.7 0.4
EUCO30 Partial 0.1 0.2 0.2 0.2 0.1 0.0
EUCO33 Partial 0.6 0.9 0.9 0.8 0.6 0.4
Source(s): E3ME, Cambridge Econometrics
Looking in detail at the distributional results by employment status of head of
households (Eurostat definitions, see Table IV-25), the extent of the impact varies
considerably across the Member States, in line with the economic results from the E3ME
model presented in Section 2. However, in most instances, there is no clear group that
benefits or consistently sees the worst affects. In some countries, retired households
appear to benefit the most from the energy efficiency improvements, while in some
cases it is those who are unemployed or economically inactive. The differences relate to
the different income patterns (e.g. in particular the relative balance between wages and
pensions or other benefits) in these groups across the Member States, with some
differences also due to variations in expenditure patterns (including the share of income
spent on heating costs).
One important point to note, which has not been tested in these scenarios, is that the
energy efficiency measures to some extent protect households from future increases in
energy prices. As it is at present the vulnerable groups that are most exposed, the
energy efficiency measures could alleviate future negative effects.
Table IV-25 Real incomes by socio-economic group, 2030, EUCO30 (% difference from EUCO27 scenario)
Manual workers
Non-manual workers
Self-employed
Unemployed
Retired
Inactive
AT 0.2 0.2 0.2 0.1 0.2 0.2
BE 0.3 0.3 0.3 0.2 0.3 0.3
BG -0.3 -0.3 -0.5 -0.3 -0.2 -0.2
CY 0.0 -0.1 -0.1 -0.1 0.0 0.1
CZ 0.2 0.1 0.2 0.6 0.7 0.2
DE 0.1 0.0 -0.1 -0.2 -0.1 -0.2
DK 0.0 -0.1 0.0 0.2 0.0 0.0
EE -0.5 -0.5 -0.4 -0.3 -0.3 -0.7
EL 0.2 0.2 0.2 0.2 0.2 0.2
ES 0.0 -0.1 0.0 0.0 0.0 -0.1
FI 0.3 0.3 0.3 0.3 0.4 0.3
FR 1.0 0.8 1.0 1.0 1.1 1.0
HR 0.0 0.0 0.0 0.0 0.0 0.0
HU 0.8 0.3 0.2 0.9 1.1 0.7
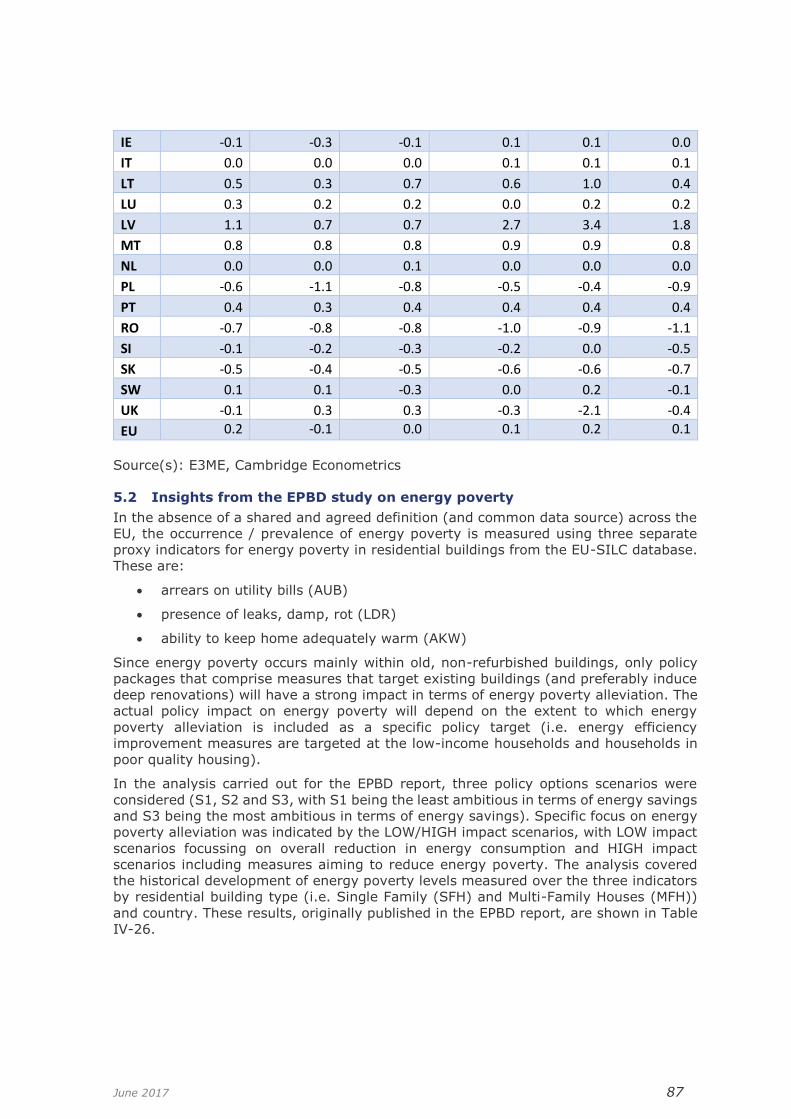
June 2017 87
IE -0.1 -0.3 -0.1 0.1 0.1 0.0
IT 0.0 0.0 0.0 0.1 0.1 0.1
LT 0.5 0.3 0.7 0.6 1.0 0.4
LU 0.3 0.2 0.2 0.0 0.2 0.2
LV 1.1 0.7 0.7 2.7 3.4 1.8
MT 0.8 0.8 0.8 0.9 0.9 0.8
NL 0.0 0.0 0.1 0.0 0.0 0.0
PL -0.6 -1.1 -0.8 -0.5 -0.4 -0.9
PT 0.4 0.3 0.4 0.4 0.4 0.4
RO -0.7 -0.8 -0.8 -1.0 -0.9 -1.1
SI -0.1 -0.2 -0.3 -0.2 0.0 -0.5
SK -0.5 -0.4 -0.5 -0.6 -0.6 -0.7
SW 0.1 0.1 -0.3 0.0 0.2 -0.1
UK -0.1 0.3 0.3 -0.3 -2.1 -0.4
EU 0.2 -0.1 0.0 0.1 0.2 0.1
Source(s): E3ME, Cambridge Econometrics
5.2 Insights from the EPBD study on energy poverty
In the absence of a shared and agreed definition (and common data source) across the
EU, the occurrence / prevalence of energy poverty is measured using three separate
proxy indicators for energy poverty in residential buildings from the EU-SILC database.
These are:
• arrears on utility bills (AUB)
• presence of leaks, damp, rot (LDR)
• ability to keep home adequately warm (AKW)
Since energy poverty occurs mainly within old, non-refurbished buildings, only policy
packages that comprise measures that target existing buildings (and preferably induce
deep renovations) will have a strong impact in terms of energy poverty alleviation. The
actual policy impact on energy poverty will depend on the extent to which energy
poverty alleviation is included as a specific policy target (i.e. energy efficiency
improvement measures are targeted at the low-income households and households in
poor quality housing).
In the analysis carried out for the EPBD report, three policy options scenarios were
considered (S1, S2 and S3, with S1 being the least ambitious in terms of energy savings
and S3 being the most ambitious in terms of energy savings). Specific focus on energy
poverty alleviation was indicated by the LOW/HIGH impact scenarios, with LOW impact
scenarios focussing on overall reduction in energy consumption and HIGH impact
scenarios including measures aiming to reduce energy poverty. The analysis covered
the historical development of energy poverty levels measured over the three indicators
by residential building type (i.e. Single Family (SFH) and Multi-Family Houses (MFH))
and country. These results, originally published in the EPBD report, are shown in Table
IV-26.

June 2017 88
Table IV-26: Total reduction in energy poverty (thousands of households)
LOW variant HIGH variant
S1 S2 S3 S1 S2 S3
AUB SFH 87.4 231.9 656.5 344.2 889.8 2,331.2
AUB MFH 106.5 282.6 799.9 419.5 1,084.3 2,840.1
AUB Total 193.9 514.5 1,456.4 763.7 1,974.1 5,171.3
LDR SFH 160.3 425.1 1203 630.9 1,630.4 4,267.2
LDR MFH 149.7 396.9 1,124.4 589.7 1,523.9 3,988.6
LDR Total 310 822 2,327.4 1,220.6 3,154.3 8,255.8
AKW SFH 105 278.5 788.1 413.3 1,068.2 2,796.1
AKW MFH 127.9 339.2 960.3 503.6 1,301.5 3,407.7
AKW Total 232.9 617.7 1,748.4 916.9 2,369.7 6,203.8
Source(s): Wuppertal Institut, EPBD report, Part IV, Section 5, pp. 54.
Note: AUB - arrears on utility bills; LDR: presence of leaks, damp, rot; AKW - ability to
keep home adequately warm; SFH - Single Family Houses; MFH- Multi-Family Houses.
The results from the EPBD report suggest that the number of households that may be
lifted from energy poverty (measured by arrears on utility bills) across the EU lies
between 194,000 (LOW impact scenario/scenario S1) and 5.17m (HIGH impact
scenario/scenario S3), depending on the degree to which policy is targeted towards fuel-
poor households.
The potential of energy efficiency improvements in the residential stock to reduce the
number of households who live in properties where leaks, damp or rot are present is
considerable (indicator LDR), ranging from 310,000 (LOW impact scenario/scenario S1)
to 8.26m (HIGH impact scenario/scenario S3) across the EU.
Ability to keep one’s home adequately warm (AKW) has important implications for health
and quality of life. According to the analysis presented in the EPBD report, improved
energy efficiency can help between 233,000 (LOW impact scenario/scenario S1) and
6.2m (HIGH impact scenario/scenario S3) households across Europe to increase their
indoor temperature to comfortable levels.
Unsurprisingly, the results are consistently higher in the more ambitious policy scenarios
(S2 and S3), and the HIGH impact scenarios (where interventions are targeted at
energy-poor households). This is clearly illustrated in Figure IV.11, which gives a
graphical illustration of the differences in the level of impacts on ability to keep warm
(AKW) between the various policy scenarios for both HIGH and LOW impact scenarios.

June 2017 89
Figure IV.11: Energy poverty alleviation impact of the different policy options in residential buildings using AKW as indicator
Source(s): Wuppertal Institut, EPBD report, Part IV, Section 5, pp. 60.
At the Member State level, the results differ by energy poverty indicator and share of
dwelling type (SFH/MFH) within the building stock. National results also depend on the
size of the building stock and the share of energy-poor households according to the
different indicators41.
In order to get a more precise picture of the extent, level and distribution of energy
poverty across the EU and to design and implement targeted action to alleviate it, a
harmonised definition is required on which base the respective data can be collected.
6 Public budgets
6.1 Impacts at European level
The estimated impacts of energy efficiency on public budgets are shown in Table IV-27
(no crowding out) and Table IV-28 (partial crowding out). The data in these tables are
based on the results from E3ME together with expansion of the model results to take
into account certain specific factors, such as corporate taxation (see description in Part
III, Section 6). The key figures in the tables are the bottom rows, which show how
budget deficits change in relation to GDP levels. This is an important metric for
governments and the EU’s Stability and Growth Pact (SGP) places a 3% limit on the size
of the deficit that any Member State government can run. The positive figures in the
tables mean that government deficits are reduced overall and it is therefore easier for
Member States to stay inside the limit set by the SGP.
The results in the tables are displayed in current prices as this is the important metric
for governments. Consequently, some of the differences in levels can be explained by
changes in price levels and inflation rates that are caused by higher VAT rates in the
scenarios (see results in Section 2.1).
41 For detailed results for the three policy scenarios at country level for each policy scenario, see the EPBD report https://ec.europa.eu/energy/sites/ener/files/documents/final_report_v4_final.pdf (Part IV, Section 5, pp. 53-60.

June 2017 90
Looking first at government revenues, there is an increase overall in the scenarios
(compared to EUCO27), although not in every category. Much of the increase in
revenues can be explained by a combination of higher rates of GDP growth, higher
employment levels and higher inflation rates. For example, if employment levels are
higher, then receipts of income taxes and social security contributions (from both
employees and employers) will also be higher. If wages increase in response to higher
rates of inflation then income tax receipts and social contributions will increase further.
Corporation taxes increase in the scenarios primarily as a result of higher rates of
economic growth, which boost company profitability and therefore the taxes levied on
profits. Again, if higher inflation and price levels boost profits this will be reflected in
taxation receipts.
There is an especially large increase in VAT receipts in the scenarios. This in part reflects
the modelling assumptions that VAT rates automatically increase to fund the public
investment in energy efficiency, as well as any loss of revenues from auctioned ETS
allowances (see below). However, rising household incomes and higher product prices
also lead to higher VAT receipts. In addition, it should be noted that spending on energy
efficient goods by households is subject to VAT.
The other two categories of revenue that are assessed show falls overall; there is a
reduction in energy excise duties in the scenarios that results from lower levels of energy
consumption. Government revenues from auctioned EU ETS allowances are also lower
because ETS prices are lower in the scenarios according to the results from the PRIMES
model.
Government expenditure increases overall in the scenarios, but by less than revenues.
One of the main increases is the public expenditure on energy efficiency measures within
the public sector. This is partially compensated by reduced public spending on energy
but the payback on these investments is not complete by 2030 and so there is an
increase in energy-related spending overall.
Other costs to government increase due to higher inflation rates. These include social
benefit payments, as the higher inflation rates offset the reduction in unemployed
workers (essentially higher rates of inflation mean paying higher pension costs). The
largest increase in expenditure, however, is on health and education. It is assumed that
the quality of services is maintained and, in real terms, expenditure remains
unchanged42. Due to higher inflation rates, nominal spending on services therefore
increases.
The overall budget change at EU level is positive for all the policy scenarios, ranging
from €19,824m in EUCO30 to €511,570m in EUCO40 (€295,029m with partial crowding
out, see below) in monetary terms. However, as many of the figures reflect price
changes, it is better to look at budget impacts as a percentage of GDP. These figures
show an estimated budget change of around 0.1% of GDP in EUCO30, ranging to up to
2.0% of GDP in EUCO40 at EU level. In the context of current European budget deficits
and SGP targets, this is potentially a substantial change.
42 The impact of energy efficiency on healthcare costs, mortality, morbidity and health-related productivity gains are covered separately in Section 3 of this chapter and are thus not included in the ‘other expenditure’ category here to avoid double counting.

June 2017 91
Table IV-27: EU28 impact on public budgets, €m difference from EUCO27 scenario, 2030 (current prices) (no crowding out)
EUCO30 EUCO33 EUCO35 EUCO40
Taxation
Income taxes 22,554 57,346 86,884 166,153
Employees' social
9,393 24,913 37,902 73,178
Employers' social
14,069 36,426 55,007 105,078
Corporation tax
-8,908 4,615 15,592 45,929
VAT 59,966 131,610 202,351 365,065
Energy excise duties
-20,431 -39,060 -38,400 -51,733
Auctioned ETS allowances
-24,232 -26,506 -36,488 -46,861
Expenditure
Energy purchases
-4,019 -9,895 -13,068 -16,460
Social benefits 515 1,920 2,529 5,099
EE investment -143 -267 -246 -323
Other expenditure
36,232 52,771 86,618 156,922
Overall budget change
19,824 144,814 247,016 511,570
Budget impacts as % of GDP
0.1% 0.6% 1.0% 2.0%
Source(s): Cambridge Econometrics
Regarding the effects of crowding out on public budgets, the pattern is similar to that
seen in the economic results. Crowding out has almost no impact in the EUCO30 case,
but the impact of crowding out becomes much bigger as the level of ambition grows in
the scenarios. In the EUCO40 scenario, partial crowding out reduces the budget surplus
from 2.0% of GDP to 1.2% of GDP.

June 2017 92
Table IV-28 Impact on public budgets, €m difference from EUCO27 scenario at EU level, 2030 (current prices) (partial crowding out)
EUCO30 EUCO33 EUCO35 EUCO40
Taxation
Income taxes 22,560 53,102 72,773 112,978
Employees' social
9,400 22,726 30,853 47,346
Employers' social
14,072 33,559 45,718 70,686
Corporation tax -8,925 2,648 9,237 22,525
VAT 59,949 123,256 173,391 253,894
Energy excise duties
-20,437 -39,380 -39,195 -54,741
Auctioned ETS allowances
-24,232 -26,512 -36,505 -46,900
Expenditure
Energy purchases
-4,019 -9,874 -13,043 -16,063
Social benefits 517 1,818 2,175 3,881
EE investment -118 -220 -206 -279
Other expenditure
36,265 50,056 77,978 123,220
Overall budget change
19,743 127,618 189,367 295,029
Budget impacts as % of GDP
0.1% 0.5% 0.8% 1.2%
Source(s): Cambridge Econometrics
6.2 Impacts at Member State level
Figure IV.12 shows the estimated public budget impacts at Member State level for the
EUCO33 scenario (compared to EUCO27). The results in this scenario are typical and
the trends are quite consistent with the other scenarios. Charts of the results in the
other scenarios are provided in Appendix E.
For most Member States, the budget position improves due to higher levels of energy
efficiency, although the extent of these impacts varies. The extent of the impact is
usually linked fairly closely to the level of investment in the different policy scenarios.
Labour market responses are also quite important in determining results on public
balances because labour taxation still makes up a large proportion of overall taxation
receipts in Europe. The responses of prices and inflation rates can additionally affect the
calculation, although this affects both taxation receipts and public expenditures.

June 2017 93
Finally, the different tax rates across the Member States affects the relative sizes of the
impacts. For example, if a country levies low rates of excise duty on energy
consumption, then reductions in energy consumption have a smaller impact on
government revenues than they might do otherwise. Similarly, variations in income tax
rates and social contribution rates mean that the link between higher employment rates
and government revenues can vary considerably between countries.
Figure IV.12: Change in public budget balance by Member State in 2030, as a % of GDP for EUCO33 compared to EUCO27 (no crowding out)
Source(s): Cambridge Econometrics
6.3 The public financing variant
Table IV-29 compares the impacts on public budgets in the public financing variant to
the main self-financing scenarios. It is clear that the impacts on public budgets, while
still positive at EU level, are much smaller overall.
The reason for the difference is the different treatment of VAT between the scenario
variants (see also discussion in Section 2.8). In the public financing variant, VAT receipts
are lower because household energy efficiency improvements are not paid by
households and therefore are not subject to VAT. The 1-2% difference in outcomes
counterbalances a change of similar magnitude, but in the opposite direction, to the
differences in economic results presented in Section 2.8.
In summary, the financing approach does not change much the potential of energy
efficiency to improve the economy but it can have important redistributional impacts
between the public and private sectors that need to be considered carefully in the
context of wider fiscal policy.
-0.4
-0.2
0.0
0.2
0.4
0.6
0.8
1.0
1.2
1.4
1.6
Au
stri
a
Bel
giu
m
Bu
lgar
ia
Cyp
rus
Cze
ch R
epu
blic
Ge
rman
y
Den
mar
k
Gre
ece
Esto
nia
Spai
n
Fin
lan
d
Fran
ce
Cro
atia
Hu
nga
ry
Irel
and
Ital
y
Lith
uan
ia
Latv
ia
Luxe
mb
ou
rg
Mal
ta
Ne
the
rlan
ds
Po
lan
d
Po
rtu
gal
Ro
man
ia
Slo
ven
ia
Slo
vaki
a
Swed
en UK

June 2017 94
Table IV-29: Impacts of the public financing variant on public budgets, % of GDP from EUCO27 in 2030
EUCO30 EUCO33 EUCO35 EUCO40
Self-financing
No crowding 0.1% 0.6% 1.0% 2.0%
Partial crowding 0.1% 0.5% 0.8% 1.2%
Public financing
No crowding 0.0% 0.1% 0.1% 0.4%
Partial crowding 0.0% 0.1% 0.1% 0.2%
Source(s): E3ME, Cambridge Econometrics
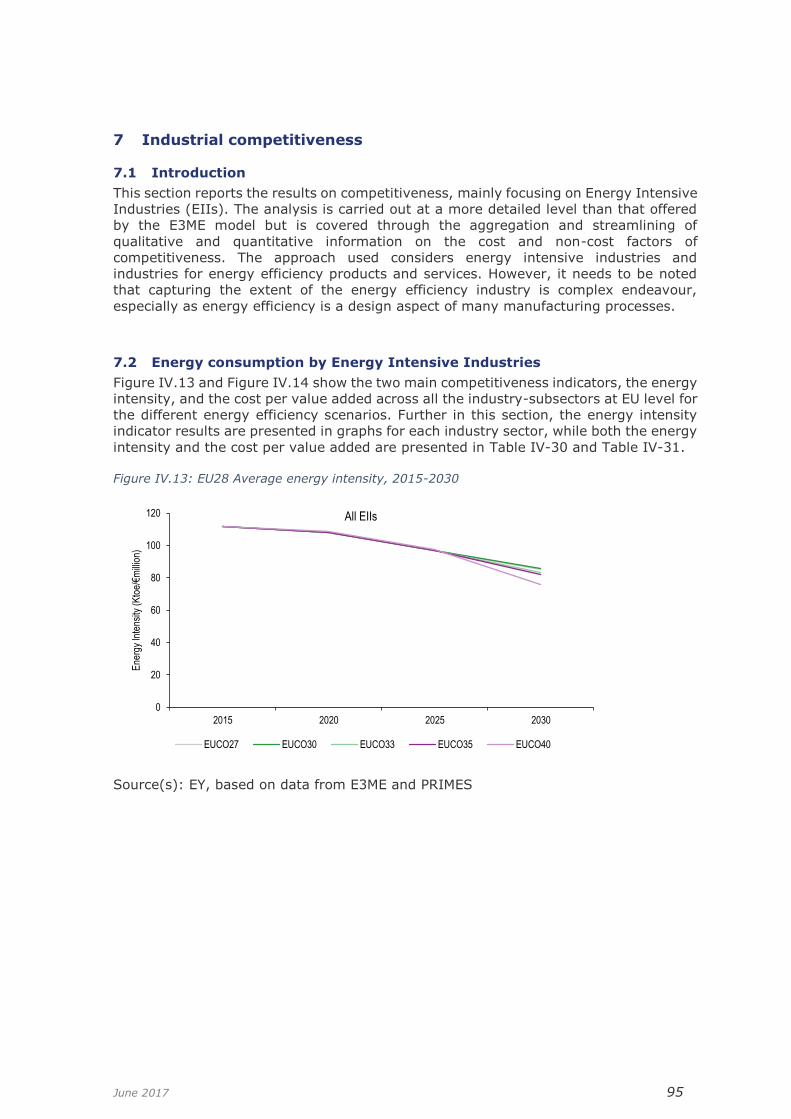
June 2017 95
7 Industrial competitiveness
7.1 Introduction
This section reports the results on competitiveness, mainly focusing on Energy Intensive
Industries (EIIs). The analysis is carried out at a more detailed level than that offered
by the E3ME model but is covered through the aggregation and streamlining of
qualitative and quantitative information on the cost and non-cost factors of
competitiveness. The approach used considers energy intensive industries and
industries for energy efficiency products and services. However, it needs to be noted
that capturing the extent of the energy efficiency industry is complex endeavour,
especially as energy efficiency is a design aspect of many manufacturing processes.
7.2 Energy consumption by Energy Intensive Industries
Figure IV.13 and Figure IV.14 show the two main competitiveness indicators, the energy
intensity, and the cost per value added across all the industry-subsectors at EU level for
the different energy efficiency scenarios. Further in this section, the energy intensity
indicator results are presented in graphs for each industry sector, while both the energy
intensity and the cost per value added are presented in Table IV-30 and Table IV-31.
Figure IV.13: EU28 Average energy intensity, 2015-2030
Source(s): EY, based on data from E3ME and PRIMES
0
20
40
60
80
100
120
2015 2020 2025 2030
Ene
rgy
Inte
nsity
(K
toe/
€mill
ion)
All EIIs
EUCO27 EUCO30 EUCO33 EUCO35 EUCO40

June 2017 96
Figure IV.14: EU28 Energy cost impact, 2015-2030
Source(s): EY, based on data from E3ME and PRIMES
In each scenario, the energy consumption (in ktoe) per unit of value added and energy
cost (in euros) per unit of value added decreases significantly from 2015 until 2030. In
this period, total energy consumption in ktoe decrease by about 10% on average in the
EUCO40 scenario compared to EUCO27. In the period 2015 to 2020, the effects on
efficiency are relatively small, due to the slow response of EIIs, and improvements are
observed after 2020 where the energy consumption per unit of value added starts to
decrease. This decrease intensifies after 2025, when more energy efficiency measures
are adopted in these industries.
In comparing the five scenarios against each other, it is noticeable that, in the short
term, the energy efficiency improvement in all scenarios is marginal. Their
differentiation is observed after 2025, with the corresponding levels of adoption of
energy efficiency measures. As expected, the EUCO40 scenario provides the highest
improvement in energy efficiency, with a total reduction in energy intensity of 10% by
2030 compared to EUCO27 projections.
Both indicators presented in Figure IV.13 and Figure IV.14 evolve in a similar manner,
which is a direct outcome of efficiency improvements and the associated benefits
provided by equipment upgrades and lower energy expenditure.
The following graphs focus on the energy intensity indicator and its variation between
the different industries.
0
20
40
60
80
100
120
140
160
180
200
2015 2020 2025 2030
Ene
rgy
cost
impa
ct
All EIIs
EUCO27 EUCO30 EUCO33 EUCO35 EUCO40

June 2017 97
Figure IV.15: EU28 Energy intensity (Iron and Steel), 2015-2030
Source(s): EY, based on data from E3ME and PRIMES
Because the iron and steel industry accounts for almost one third of the total EIIs’
energy consumption, it has a large effect on EII total energy consumption per value
added and the analysis for the iron and steel industry’s position is closely in line with
the general one made above. Over time, energy consumption per unit of value added
decreases by approximately 8% in the EUCO40 scenario compared to the EUCO27
scenario. Again, the change in energy consumption relative to EUCO27 is significantly
smaller in the short and medium term, while it is much larger in the medium term for
the EUCO40 scenario.
Figure IV.16: EU28 Energy intensity (non-ferrous metals), 2015-2030
Source(s): EY, based on data from E3ME and PRIMES
0
5
10
15
20
25
30
35
40
2015 2020 2025 2030
Ene
rgy
Inte
nsity
(K
toe/
€mill
ion)
Iron and Steel
EUCO27 EUCO30 EUCO33 EUCO35 EUCO40
0
5
10
15
20
25
2015 2020 2025 2030
Ene
rgy
Inte
nsity
(K
toe/
€mill
ion)
Non ferrous metals
EUCO27 EUCO30 EUCO33 EUCO35 EUCO40

June 2017 98
The differences between the five scenarios for the non-ferrous metals industry (Figure
IV.16) are much smaller than the differences in the iron and steel sector (Figure IV.15).
For both sectors, energy intensity decreases by 7 and 10%. This decrease for the non-
ferrous metals industry represents the lowest improvement out of all the energy
intensive industries. The three periods in which the effects differ are also more evident
for the non-ferrous metals industry. However, the EUCO40 scenario deviates in the
medium to long term by having significantly lower energy intensity from 2025 to 2030.
The chemicals industry (see Figure IV.17) displays the largest reduction in energy
consumption per unit of value added out of all the energy intensive industries. Over the
projection period, total energy consumption per unit of value added decreases by 15%.
In both the short and long terms, there are no noticeable differences between the five
scenarios. However, the percentage decline in energy consumption per unit of value
added in the EUCO27 and EUCO30 scenarios does not differ in the medium and long
terms, while the EUCO40 scenario displays larger energy efficiency improvements in
both the medium to long terms.
Figure IV.17 EU28 Energy intensity (chemicals), 2015-2030
Source(s): EY, based on data from E3ME and PRIMES
0
2
4
6
8
10
12
14
16
2015 2020 2025 2030
Ene
rgy
Inte
nsity
(K
toe/
€mill
ion)
Chemicals
EUCO27 EUCO30 EUCO33 EUCO35 EUCO40

June 2017 99
Figure IV.18 EU28 Energy intensity (non-metallic minerals), 2015-2030
Source(s): EY, based on data from E3ME and PRIMES
Similarly, the rate at which energy intensity declines in the non-metallic minerals sector
does not significantly differ in the short and medium terms. Overall, it can be observed
that energy intensity decreases by 15% in the period up to 2030 for the EUCO40
scenario compared to EUCO27.
Figure IV.19 EU28 Energy intensity (paper and pulp), 2015-2030
Source(s): EY, based on data from E3ME and PRIMES
For the paper and pulp industry there is a relatively stable rate of decline in all scenarios,
which results in a total reduction in energy consumed per unit of value added by about
15%. Consequently, the effects for the paper and pulp industry are the largest among
all the energy intensive industries. Here again, the EUCO27 and EUCO30 scenarios have
lagging efficiency improvements in the medium and long terms while the EUCO40
scenario displays larger energy efficiency improvements in the medium to long term.
0
5
10
15
20
25
2015 2020 2025 2030
Ene
rgy
Inte
nsity
(K
toe/
€mill
ion)
Non metallic minerals
EUCO27 EUCO30 EUCO33 EUCO35 EUCO40
0
5
10
15
20
25
2015 2020 2025 2030
Ene
rgy
Inte
nsity
(K
toe/
€mill
ion)
Paper and Pulp
EUCO27 EUCO30 EUCO33 EUCO35 EUCO40

June 2017 100
When comparing the effects of the scenarios at Member State level for each industry a
recurring pattern can be observed. The most energy intensive countries in 2015 are
those realising a bigger energy efficiency potential over the projection period, while the
less energy intensive countries do not experience a significant increase in
competitiveness due to the energy efficiency gains.
The tables below show total energy consumption and total energy cost per unit of value
added, for each industry subsector and in total.
Table IV-30 Total energy consumption (ktoe) / value added (millions of euros)
2015 2020 2025 2030
All EIIs EUCO27 112.05 108.23 96.86 85.13
EUCO30 0.0% 0.0% 0.0% 0.5%
EUCO33 0.0% 0.0% 0.1% -1.8%
EUCO35 0.0% 0.0% 0.2% -3.8%
EUCO40 0.0% 0.2% 0.7% -10.7%
Chemicals EUCO27 14.40 13.75 12.48 11.06
EUCO30 0.0% 0.0% 0.1% 0.3%
EUCO33 0.0% 0.1% 0.3% -2.6%
EUCO35 0.0% 0.1% 0.3% -8.2%
EUCO40 0.0% 0.1% 0.3% -15.6%
Iron and steel EUCO27 34.07 32.23 29.38 25.27
EUCO30 0.0% 0.0% 0.1% 0.9%
EUCO33 0.0% 0.1% 0.2% -0.4%
EUCO35 0.0% 0.1% 0.3% -1.1%
EUCO40 0.0% 0.6% 1.1% -7.5%
Non-ferrous metals EUCO27 21.50 22.02 19.07 16.60
EUCO30 0.0% 0.0% 0.0% 0.1%
EUCO33 0.0% -0.2% -0.3% -1.2%
EUCO35 0.0% 0.0% -0.2% -2.5%
EUCO40 0.0% -0.3% -0.1% -10.6%
Non-metallic minerals EUCO27 19.49 18.32 16.73 14.61
EUCO30 0.0% 0.0% -0.2% 1.0%
EUCO33 0.0% -0.4% -0.2% -1.8%
EUCO35 0.0% -0.3% -0.1% -2.8%
EUCO40 0.0% -0.1% 0.5% -7.0%
Paper and pulp EUCO27 22.58 21.91 19.21 17.59
EUCO30 0.0% 0.0% 0.2% -0.1%
EUCO33 0.0% 0.5% 0.5% -3.7%
EUCO35 0.0% 0.1% 0.4% -6.8%
EUCO40 0.0% 0.3% 1.5% -15.3%
Source(s): EY, based on data from E3ME and PRIMES

June 2017 101
Table IV-31 Total energy cost (millions of euros) / value added (millions of euros), Cambridge
Econometrics, PRIMES
Industry Scenario 2015 2020 2025 2030
All EIIs EUCO27 179.70 184.56 169.84 156.37
EUCO30 0% 0% -1% -1%
EUCO33 0% -2% -3% -6%
EUCO35 0% -2% -4% -7%
EUCO40 0% -3% -4% -11%
chemicals EUCO27 18.47 18.89 18.00 16.79
EUCO30 0% 0% -1% -2%
EUCO33 0% -2% -3% -8%
EUCO35 0% -3% -4% -13%
EUCO40 0% -3% -4% -16%
Iron and steel EUCO27 55.94 56.25 53.39 48.64
EUCO30 0% 0% -1% -1%
EUCO33 0% -2% -3% -5%
EUCO35 0% -2% -3% -5%
EUCO40 0% -2% -3% -7%
Non-ferrous metals EUCO27 40.52 43.13 37.47 34.19
EUCO30 0% 0% -1% -2%
EUCO33 0% -2% -4% -7%
EUCO35 0% -2% -4% -6%
EUCO40 0% -3% -4% -11%
Non-metallic minerals EUCO27 29.93 29.95 28.07 25.49
EUCO30 0% 0% -1% -1%
EUCO33 0% -2% -3% -5%
EUCO35 0% -3% -4% -6%
EUCO40 0% -3% -4% -6%
Paper and pulp EUCO27 34.83 36.34 32.92 31.27
EUCO30 0% 0% -1% -2%
EUCO33 0% -1% -3% -8%
EUCO35 0% -3% -4% -11%
EUCO40 0% -3% -3% -15%
Source(s): EY, based on data from E3ME and PRIMES

June 2017 102
7.3 The importance of SMEs in the EIIs
This section describes a less known aspect of EIIs, which is that an important share of
these industries’ turnover is from SMEs. The importance of EII SMEs for the European
economy should not be understated, since, they constitute the majority of companies
in the sectors, employ between 30% and 60% of EII employees, and return between
10% and 34% of total value added, depending on the industry sub-sector.
Table IV-32 Data on SMEs in the EIIs, 2013
Sector Pulp & Paper
Chemicals Aluminium Cement Steel Glass
Sector description Manufact. of pulp, paper and paperboard
Manufact. of basic chemicals, fertilisers and nitrogen compounds, plastics and synthetic rubber in primary forms
Manufact. of basic precious and other non-ferrous metals
Manufact. of cement, lime and plaster
Manufact. of basic iron and steel and of ferro-alloys
Manufact. of Glass and Glass products
NACE 2 Code C171 C201 C244 C235 C241 C231
% SMEs in total Value Added - 2013
24% 25% 30% 30% 10% 34%
% SMEs in total Turnover - 2013
30% 27% 38% 31% 10% 36%
% SMEs in total no. of companies - 2013
91% 96% 95% 93% 93% 99%
% SMEs in total no. of employees - 2013
45% 35% 36% 60% 31% 52%
Value added per enterprise (SME) – 2013 (k€ / enterprise)
1.0934 1.0831 1.0357 1.0899 829 308
Value added per Employee (SME) – 2013 (k€ / enterprise)
54 81 73 50 20 31
Turnover per enterprise (SME) (k€ / enterprise)
12,457 11,141 12, 648 6,378 6,166 1,048
Turnover per Employee (SME) (k€ / enterprise)
346 496 681 168 149 107
Source(s): EY, based on Eurostat data
According to Eurostat figures for 2013, SMEs43 accounted for more than 90% of
enterprises in energy intensive industrial sectors (up to 99% for the Glass industry). On
average, they represent 30% of the total value added of their respective sectors (except
43 SME = small and medium sized enterprises (SMEs) definition according to EUROSTAT: with 1-249 persons employed

June 2017 103
for the steel industry, for which SMEs only account for 10% of the total value added,
despite accounting for 93% of the total number of enterprises).
SMEs in the glass industry are particularly small, with an average value added per
enterprise of around €308,000 in 2013, and an average number of ten employees per
enterprise (compared to 20-40 employees for SMEs in other sectors).
For most energy intensive sectors, the share of SMEs in total value added has remained
relatively flat over time (at least for the 2008-2013 period). The economic crisis of 2008
that impacted industry as a whole and in 2009 there was a in a one-off increase in the
share of SMEs in the value added for aluminium, steel and glass sectors. These three
sectors have been particularly impacted by the economic crisis, and large enterprises
(>250 employees) were the first to be affected.
The share of SMEs in the cement sector has been constantly increasing since 2008, from
20% in 2008 to 30% in 2013. This tendency, driven by a decrease in large enterprises’
value added rather than an increase in SMEs’, could continue into the projection period,
making cement an important sector for SMEs.
Figure IV.20 % of SMEs in total value added, by energy-intensive sector in EU 28
Source(s): EY analysis based on Eurostat data
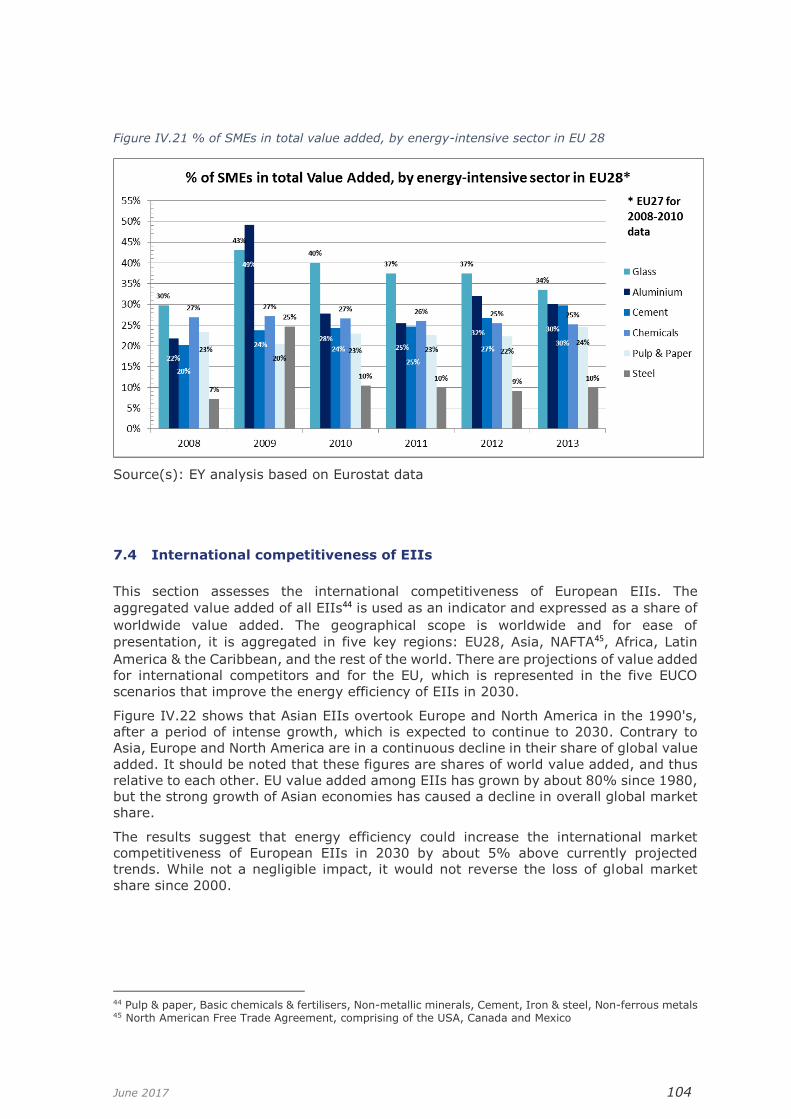
June 2017 104
Figure IV.21 % of SMEs in total value added, by energy-intensive sector in EU 28
Source(s): EY analysis based on Eurostat data
7.4 International competitiveness of EIIs
This section assesses the international competitiveness of European EIIs. The
aggregated value added of all EIIs44 is used as an indicator and expressed as a share of
worldwide value added. The geographical scope is worldwide and for ease of
presentation, it is aggregated in five key regions: EU28, Asia, NAFTA45, Africa, Latin
America & the Caribbean, and the rest of the world. There are projections of value added
for international competitors and for the EU, which is represented in the five EUCO
scenarios that improve the energy efficiency of EIIs in 2030.
Figure IV.22 shows that Asian EIIs overtook Europe and North America in the 1990's,
after a period of intense growth, which is expected to continue to 2030. Contrary to
Asia, Europe and North America are in a continuous decline in their share of global value
added. It should be noted that these figures are shares of world value added, and thus
relative to each other. EU value added among EIIs has grown by about 80% since 1980,
but the strong growth of Asian economies has caused a decline in overall global market
share.
The results suggest that energy efficiency could increase the international market
competitiveness of European EIIs in 2030 by about 5% above currently projected
trends. While not a negligible impact, it would not reverse the loss of global market
share since 2000.
44 Pulp & paper, Basic chemicals & fertilisers, Non-metallic minerals, Cement, Iron & steel, Non-ferrous metals 45 North American Free Trade Agreement, comprising of the USA, Canada and Mexico

June 2017 105
Figure IV.22: Value added shares of the EU and other world regions
Source: Oxford Economics, Using data from National Statistical Offices, 2017
7.5 Energy costs for energy intensive industries
The previous section offered insight on the competitiveness levels of European industry,
and how it has evolved since 1980. This section discusses the impact of energy prices
on competitiveness within the global market. Energy costs is a key issue for companies
in the energy-intensive sectors and the European Commission has published specific
analysis on this issue (European Commission, 2014; 2016b).
Prices for fossil fuels, mainly oil and coal, are market determined by global supply and
demand, and therefore do not vary significantly between regions. Local circumstances
and specific contracts can offer highly competitive energy prices to individual customers,
but that level of disaggregation cannot be considered here. The energy source for EIIs
that is highly region-depended, is electricity which, even within the EU, varies
significantly. Figure IV.23 shows the evolution of electricity prices for industrial
consumers in the six world regions since 1990.
0%
10%
20%
30%
40%
50%
60%
70%
Value-added output, % of world
EU -Baseline EUCO27 EUCO30
EUCO33 EUCO35 EUCO40
Africa Asia Latin America & the Caribbean
NAFTA Rest of the world

June 2017 106
Figure IV.23 Electricity costs for global EIIs since 1990
Source: BMI research, 2017
Electricity costs for industry in the EU have historically been higher than most regions,
other than Asia, but energy costs are not the only determinant of effective business,
and could in comparison be regarded as a relatively marginal aspect of competitiveness.
Our results suggest that energy costs may not be the most important determining factor
of competitiveness, as there is little correlation between electricity prices and EII value
added, as seen in Table IV-22. We therefore examine the share of energy costs to the
gross output of various EIIs in the EU and in three major competitors: the US, China
and Japan. The following table indicates that in the EU, energy costs as a share of
industry expenditure are lower than major international competitors.
Table IV-33: Energy cost shares by manufacturing industry in basic prices (in % of gross output)
EU-27 China Japan US
Pulp, paper, printing and
publishing 3.2 3.6 4.8 3.2
Chemicals and chemical
products 7.4 18.9 13.1 7.8
Other non-metallic mineral
products 7.4 15.5 16.8 5.8
Basic metals and fabricated
metal 4.1 9.8 10.2 4.2
Source(s): WIOD, 2016
Other aspects that define the competitiveness of an industry are product quality,
differentiation, innovation, and in general, aspects that relate more to the skills and
training of the workforce. Moreover, the proximity to consumers, geographical factors,
and the trade network of intermediaries are significant in determining competitiveness.
Innovation is assessed further here as a key determinant of competitiveness.
€ 0.00
€ 0.02
€ 0.04
€ 0.06
€ 0.08
€ 0.10
€ 0.121
99
0
19
91
19
92
19
93
19
94
19
95
19
96
19
97
19
98
19
99
20
00
20
01
20
02
20
03
20
04
20
05
20
06
20
07
20
08
20
09
20
10
20
11
20
12
20
13
20
14
20
15
20
16
Electricity prices for industrial consumers, in EUR/KWh
Africa Oceania Asia Europe Latin America North America

June 2017 107
Innovation can offer insights into the competitiveness of European EIIs. Figure IV.24
traces all patents submitted in the EII-relevant fields46 since 1980. It is evident that the
R&D interest of European industries has been steadily decreasing since 1980, when
Europe was submitting 50% of all patents in the EII-relevant fields. The equivalent
figure now is about 15%. In 1985, Asian economies had already overtaken Europe in
innovation by submitting more patents. Comparing to the previous figures, it becomes
evident that innovation offers some justification why, only five years later, Asia was
already starting to overtake the EU and the US in terms of value added, despite the
higher unit energy costs shown in Table IV-33. In summary, while lower unit energy
costs boost competitiveness of the EIIs, other factors like innovation are also important.
Figure IV.24 Patent applications for EIIs, by world regions
Source(s): EY
7.6 The construction sector and its potential for energy efficiency
The EU’s construction sector value added, as a world market share, has been declining
over the past 37 years, due to increases in output by other world regions, most notably
Asia. It is projected that this gap will widen in the decades to come, with the construction
sector’s value added in the EU hardly reaching above the levels of the pre-2008 crisis
levels.
Furthermore, recent innovations in construction (such as prefabrication, 3D printing and
building information modeling) seem to be taken up mostly in Asia and emerging
markets, as they exploit the best available technologies and drive innovation to meet
the demands of their growing economies.
46 Electrical machinery, apparatus, energy; Basic materials chemistry; Materials, metallurgy; Chemical engineering; Environmental technology; Textile and paper machines
0%
10%
20%
30%
40%
50%
60%
70%
80%
1980 1982 1984 1986 1988 1990 1992 1994 1996 1998 2000 2002 2004 2006 2008 2010 2012 2014
Patent publications, WIPO 2017
Africa North America
Asia Europe
Oceania Latin America and the Caribbean

June 2017 108
Figure IV.25: Construction value added, global market shares
Source(s): EY
Figure IV.25 identifies development opportunities for the construction sector, which, in
contrast to previous decades, do not need to be in the field of new construction. More
benefits are to be found now in new business models that improve buildings operation
and reap the benefits of energy efficiency. In the construction industry, there are
multiple examples why energy efficient buildings offer benefits. For example, the
literature identifies that the presence of an energy efficient label increases the value of
properties47. Other benefits such as improved cognitive functioning for office employees,
accelerated recovery of hospital patients and improved learning in schools are also
increasingly realised (Allen et al, 2017; MacNaughton et al, 2017).
7.7 The market for energy efficiency services
The market for energy efficiency services is comprised of companies (mostly SMEs) that
offer technical and financing solutions for improving the energy efficiency of their
customers’ operations with the aim of reducing energy consumption. These companies
guarantee payback period in accordance with their client’s investment hurdle rates. They
are also referred to as Energy Service Companies (ESCOs) and offer their services
through energy performance contracts (EPCs) that are usually repaid by harvesting the
47 See the EPBD report, also Brounen & Kok, 2011; Bloom, 2011; Kok & Kahn, 2012; Zheng, 2011; Fuerst, 2013.
0%
5%
10%
15%
20%
25%
30%
35%
40%
45%
0
500
1,000
1,500
2,000
2,500
3,000
1980 1985 1990 1995 2000 2005 2010 2015 2020 2025 2030
Construction, Value-added output, real US$ billion
Africa Asia
European Union Latin America & the Caribbean
NAFTA EU Construction value added, world market share

June 2017 109
reduction in energy utility bills. The targets of ESCOs are characterised by large assets
with corresponding energy consumption patterns (therefore mostly industrial clients) in
order to capitalise on the savings scale. ESCOs are also active in the residential market
through the aggregation of projects, often as a response to public procurement. The
achieved savings may link to energy efficiency obligations, or white certificates, or be
monetised in carbon markets.
The worldwide market for energy efficiency services has been valued at close to $24
billion in 2015, with China holding the world’s largest share, and achieving 7% growth
during the same year. In the EU, for 2015, the ESCO market was worth $ 2.7 billion in
gross output (IEA, 2016).
Figure IV.26: Global ESCO market, 2015
Sources: EMCA, JRC, Navigant Research in IEA, 2016
ESCO is a growing market, which is driven by energy prices and government
procurement and regulation (i.e. energy efficiency obligations schemes in Europe). In
order to ensure that the multiple benefits arising from the expansion of the market for
energy efficiency services are realised, regulatory standards and obligations could
provide effective solutions, and allow this growing sector to tap into large markets.
Considering the increasing constraint on carbon emissions, and the effective role of
energy efficiency to mitigate energy demand, business models and experience
developed in the EU could be replicated globally. The competitiveness of EU firms in
global ESCO markets depends on the quality and cost of their services, which they can
develop through responding to tight regulatory constraints.
China55%
EU11%
USA26%
Other8%
Global ESCO market, 2015

June 2017 110
Part V. Conclusions
1 Overview of the study
The IEA (2014) has identified a range of multiple benefits that may result across the all
economy and society from improved energy efficiency. There are also costs associated
with energy efficiency, notably in financing the initial investment, which may take
resources away from other parts of the economy. This report has aimed to estimate
both the benefits and the costs of enhanced energy efficiency in Europe, using a broad
assessment framework. Our approach is primarily model-based, using the E3ME macro-
econometric model, with supplementary analysis for impact areas that the model cannot
cover. Wherever possible, results are quantified.
The methodologies and results used in this report build on a recent assessment of the
EPBD, extending the analysis to cover other economic sectors. Based on different policy
options, five possible future energy efficiency target scenarios were assessed. The five
energy efficiency target scenarios were:
▪ EUCO27: 27% the minimum energy efficiency target, politically agreed in 2014
▪ EUCO30: 30% Energy efficiency target
▪ EUCO33: 33% Energy efficiency target
▪ EUCO35: 35% Energy efficiency target
▪ EUCO40: 40% Energy efficiency target
All the targets are defined against a 2007 baseline case (European Commission, 2008).
For each scenario, the inputs have been derived from PRIMES model results, providing
consistency with the full EED Impact Assessment (European Commission, 2016). The
scenarios have been compared to a reference option (derived from the 2016 PRIMES
Reference scenario) in which there is no policy change and presented, in most cases, as
a comparison to the EUCO27 scenario. Six impact areas have been covered:
▪ Economy and labour market
▪ Health
▪ The environment
▪ Social aspects
▪ Public budgets
▪ Industrial competitiveness
It should be noted that there is potentially considerable cross-over and interaction
between the different categories, some of which is captured in the assessment
framework. However, most important is to note that we avoid double counting of
impacts between the different categories48.
Table V-1 summarises the key findings in each impact area. The following sections
describe the key findings in each area.
48 An exception is the results for GDP and competitiveness; the increase in output for the insulation and glass sectors also makes a small contribution towards the GDP increases. There is also a slight increase in material consumption.

June 2017 111
Table V-1 Key results from the analysis (EU28, difference to EUCO27 in 2030)
Direction of
impact
Key results in 2030
Economy and
labour market
Positive GDP increases by 0.4 to 4.1%
Employment increases by 0.2 to 2.1%
There are modest improvements in energy
security, more significant in vulnerable
countries
Health and
well-being
Positive Annual healthcare cost savings of up to €77
billion
Environmental
impact
Mostly positive Final energy consumption reduced by 7.1% to
17.8%
GHG emissions reduced by more than 40%
compared to 1990 levels, potentially by 47%
Material consumption increased by 0.7-2.7%
Social aspects Positive Potentially up to 8.3m households removed
from fuel poverty
Slightly reduced income distribution
inequality
Unemployment reduced by between 0.3 and
3.0 million
Public
budgets49
Slightly positive Increase in annual public balances of between
0.1 and 2.0% of GDP
Industrial
competitiveness
Slightly positive Potential long-run benefits to European firms
from reduced energy costs
2 Conclusions in each impact area
2.1 Economy and labour market
The model results show that ambitious investment programmes in energy efficiency
could have benefits for Europe’s economy. GDP impacts in 2030 are positive at EU level
in all the scenarios compared to EUCO27. The positive results are obtained even if some
of the additional investment activity ‘crowds out’ investment elsewhere in the economy
(see Section 4.2 below).
Investment demand could increase substantially in the scenarios, reflecting the
investment-intensive nature of energy efficiency. The construction sector is likely to see
the largest increase in production as it plays a key role in installing new energy efficiency
equipment. However, apart from the energy supply and utilities sectors, there are
increases in output across all parts of the economy.
A large part of the overall increase in GDP is driven by reductions in fuel imports.
Spending by households and businesses in the EU is diverted from imported fuels to
other goods and services that may be produced domestically. This leads to an overall
increase in rates of activity in the EU’s economy, and higher GDP. Reduced imports of
49 From this area, the positive effects of reduced health costs on public budgets is not included.

June 2017 112
fuels would also have energy security benefits, including in several central and Eastern
European Member States that are currently exposed to a single non-EU supplier.
Household expenditure also increases in the scenarios. Combined with the non-financial
benefits of having warmer homes, it can be inferred that welfare would also increase.
Table V-2: Impacts on EU GDP and employment in 2030, % difference from EUCO27
Degree of crowding out
EUCO30 EUCO33 EUCO35 EUCO40
GDP (€2013bn)
No crowding out 0.4 1.5 2.1 4.1
Partial crowding out 0.4 1.3 1.6 2.2
Employment (m)
No crowding out 0.2 0.7 1.0 2.1
Partial crowding out 0.2 0.6 0.9 1.4
Source(s): E3ME, Cambridge Econometrics
The modelling results also show that an increase in energy efficiency would lead to
higher rates of employment and lower rates of unemployment in the EU in 2030.
Employment could increase by up to 2.1% compared to the EUCO27 scenario. Many of
the additional jobs created relate to the manufacturing and installation of energy
efficient equipment (e.g. in the construction and engineering sectors) but due to
multiplier effects there are also jobs created in the wider economy, including in service
sectors. In the EUCO35 and EUCO40 scenarios, a rapid increase in employment in key
sectors after 2025 may lead to skills shortages but these could be alleviated by further
increases in training in STEM50 subjects and active labour market monitoring.
2.2 Health
Improved energy efficiency can have health benefits for several different reasons but
the largest impacts arise from a combination of reductions in indoor and outdoor air
pollution. The scenarios that were assessed show large potential health benefits in
monetary terms, particularly due to changes in the indoor environment. The scale of
the changes (€100bn pa) is roughly equivalent to 0.5% of EU GDP in 2030.
Table V-3: Potential health benefits in 2030, EU28, difference from EUCO27 scenario
Mortality & morbidity / cost savings, SOx in 2030
Mortality & morbidity / cost savings, NOx in 2030
Mortality & morbidity / cost savings, PM10 and PM2.5 in 2030
Mortality & morbidity / cost savings NOx, SOx, PM10 and PM2.5 in 2030
m€ / year m€ / year m€ / year m€ / year
EUCO30 -1,056 -62 -27,183 -28,301
EUCO33 -489 9 -54,366 -54,846
EUCO35 -1,365 247 -56,498 -57,616
EUCO40 -4,158 -1,467 -71,422 -77,047
50 Science, technology, engineering and mathematics.

June 2017 113
Although the uncertainties and limitations of such assessment are high, clearly the
potential benefits involved are substantial. The EPBD and other legislation relating to
residential dwellings will play a key role in capturing these benefits.
2.3 Environmental impacts
Energy efficiency could impact on the environment in several different ways. Reducing
energy consumption is, in itself, an environmental benefit, as energy extraction and
electricity generation can have adverse impacts on local environments and, in particular,
on air pollution. The results presented in this report show that, despite rebound effects
(see Section 4.1 below), there are substantial falls in final energy consumption in the
EU in the scenarios.
Reductions in energy consumption are matched by falls in greenhouse gas emissions.
The results in this report, which follow those from PRIMES but include rebound and other
indirect effects, confirm that in all the scenarios the EU 40% emission reduction target
for 2030 is met. Further emission reductions in the more ambitious scenarios suggest
that the target could be exceeded by some distance.
Table V-4: Summary of environmental impacts, % difference from EUCO27 scenario
Units EUCO30 EUCO33 EUCO35 EUCO40
Final energy demand51
% from EUCO27 -7.1 -12.9 -14.1 -17.8
GHG emissions % from 1990 -40.8 -43.0 -43.9 -47.2
SO2 emissions % from EUCO27 -0.6 -4.3 -2.5 -5.1
NOx emissions % from EUCO27 0.0 -1.6 -0.6 -1.5
Material consump.52
% from EUCO27 0.6 1.7 2.7 2.5
Source(s): E3ME, Cambridge Econometrics
The impacts on local air pollutants, such as SO2 and NOx, which can cause harm to
human health are also reduced at European level in the scenarios. The E3ME model does
not go into the same level of detail as the more specialised GAINS model that was used
in the EED Impact Assessment, but does include impacts that arise from rebound and
other direct economic effects. However, a further disaggregation of results shows that
a large share of the impacts on emissions of these pollutants depends on the scale of
coal-fired electricity generation, which in turn depends on EU ETS prices (which fall in
the scenarios with more energy efficiency, as modelled by PRIMES). The conclusion is
that to realise the full benefits of reduced local air pollution, other measures are required
alongside the energy efficiency programmes.
Rates of material consumption (DMC) could increase in scenarios that have more energy
efficiency. The reason for this is that the investment sectors, in particular construction,
are intensive users of materials. In order to produce the additional energy efficient
equipment, additional resources are required. Slightly higher rates of economic growth
(Section 2.1) also lead to higher material demands.
51 Primary Energy Consumption has not been fully estimated in the current E3ME results but the trends follow those for Final Energy Demand. 52 Domestic Material Consumption, DMC

June 2017 114
2.4 Social impacts
The social impacts of energy efficiency arise mostly from energy efficiency in residential
dwellings. The analysis in this report suggests that large numbers of households across
Europe could be removed from energy poverty if ambitious energy efficiency
programmes were implemented. Because at this stage it is not possible to say what
types of households would be affected by the energy efficiency measures (e.g. whether
they could be targeted at low-income households) it is only possible to provide a range
of results. Table V-5 shows three indicators of potential energy poverty; the results
suggest that up to 8.3 million households could be removed from energy poverty if the
measures were carefully targeted.
Table V-5: Potential reductions in energy poverty by 2030 compared to reference (thousands of
households in the EU, ambitious scenario)
LOW variant HIGH variant
Arrears on utility bills 1,456.4 5,171.3
Leaks, damp, rot 2,327.4 8,255.8
Ability to keep home warm 1,748.4 6,203.8
Source(s): Wuppertal Institut, EPBD report, Part IV, Section 5, pp. 54.
There are other potential social impacts from energy efficiency. An increase in
employment in the scenario results is matched by a decrease in unemployment. The
modelling results from E3ME suggest that income distribution will not get worse under
the energy efficiency scenarios and could improve. In summary, there are potentially
quite substantial social benefits if the policies are implemented appropriately.
2.5 Public budgets
Public sector budgets can be affected by energy efficiency in several different ways. The
public sector will be impacted directly through its own investment in energy efficiency
and any savings in energy bills that arise. There may also be a loss of revenue from fuel
excise duties if energy consumption falls, and ETS auction revenues if the ETS price
falls.
However, the larger impacts are likely to arise from other activities in the economy. For
example, if employment levels increase then revenues from income taxes and social
contributions will also increase; expenditure on social benefits and welfare payments
will likely decrease.
Overall, the impacts on public budgets in all the scenarios are positive. The maximum
impact on the public sector is in the EUCO40 scenario is 2% of GDP, potentially a
substantial amount that could help Member States stay within their 3% budget deficit
ceiling under the EU’s Sustainability and Growth Pact.
One consideration that is important regarding public budgets is how the energy
efficiency measures are financed. In this report, one variant to the main scenarios is
tested, where the measures are financed through taxation rather than private
investment (see Section 4.3 below). Despite assumptions about adjusting tax rates to
compensate for the additional public expenditure in this scenario, the impacts on public
budgets are quite different, because VAT that accrues from household spending on
energy efficiency is lost if the government funds it.
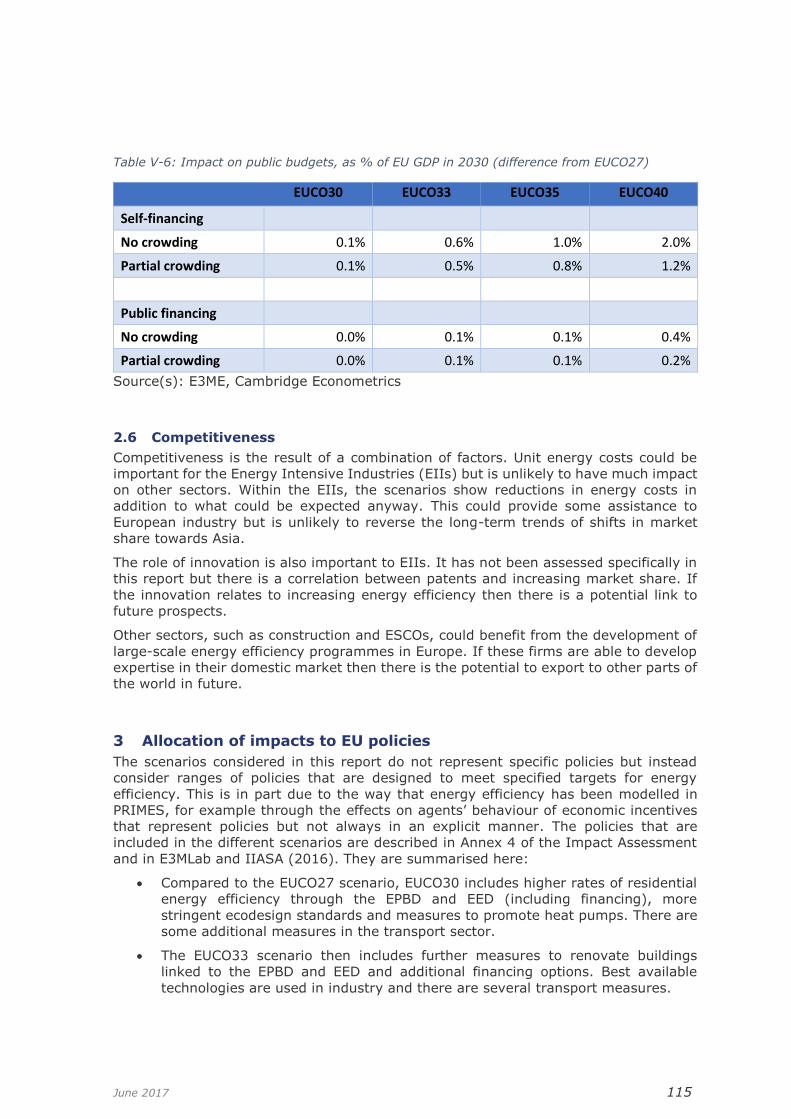
June 2017 115
Table V-6: Impact on public budgets, as % of EU GDP in 2030 (difference from EUCO27)
EUCO30 EUCO33 EUCO35 EUCO40
Self-financing
No crowding 0.1% 0.6% 1.0% 2.0%
Partial crowding 0.1% 0.5% 0.8% 1.2%
Public financing
No crowding 0.0% 0.1% 0.1% 0.4%
Partial crowding 0.0% 0.1% 0.1% 0.2%
Source(s): E3ME, Cambridge Econometrics
2.6 Competitiveness
Competitiveness is the result of a combination of factors. Unit energy costs could be
important for the Energy Intensive Industries (EIIs) but is unlikely to have much impact
on other sectors. Within the EIIs, the scenarios show reductions in energy costs in
addition to what could be expected anyway. This could provide some assistance to
European industry but is unlikely to reverse the long-term trends of shifts in market
share towards Asia.
The role of innovation is also important to EIIs. It has not been assessed specifically in
this report but there is a correlation between patents and increasing market share. If
the innovation relates to increasing energy efficiency then there is a potential link to
future prospects.
Other sectors, such as construction and ESCOs, could benefit from the development of
large-scale energy efficiency programmes in Europe. If these firms are able to develop
expertise in their domestic market then there is the potential to export to other parts of
the world in future.
3 Allocation of impacts to EU policies
The scenarios considered in this report do not represent specific policies but instead
consider ranges of policies that are designed to meet specified targets for energy
efficiency. This is in part due to the way that energy efficiency has been modelled in
PRIMES, for example through the effects on agents’ behaviour of economic incentives
that represent policies but not always in an explicit manner. The policies that are
included in the different scenarios are described in Annex 4 of the Impact Assessment
and in E3MLab and IIASA (2016). They are summarised here:
• Compared to the EUCO27 scenario, EUCO30 includes higher rates of residential
energy efficiency through the EPBD and EED (including financing), more
stringent ecodesign standards and measures to promote heat pumps. There are
some additional measures in the transport sector.
• The EUCO33 scenario then includes further measures to renovate buildings
linked to the EPBD and EED and additional financing options. Best available
technologies are used in industry and there are several transport measures.

June 2017 116
• The EUCO35 scenario includes further energy efficiency in buildings and adoption
of heat pumps. There are further standards and advanced technology uptake in
industry and tighter fuel standards in transport.
• The EUCO40 scenario includes upgraded versions of the same policies.
It is possible to draw the following tentative conclusions from the analysis:
• Almost all the social benefits that have been outlined in this report can be
attributed to the combined effect of the EPBD and EED on residential buildings53.
Based purely on a ratio of energy savings, around one quarter of the
environmental benefits that are obtained in the EUCO30 and EUCO33 scenarios
could be attributed to the EPBD. However, it should be stressed that the energy
savings in the EPBD scenarios are to some extent dependent on other regulation
(e.g. the Ecodesign Directive) so policy interaction is important.
• Labelling and Ecodesign options also feature in the EUCO30 and EUCO33
scenarios. These policies affect both households and businesses and so it is
difficult to separate their impacts from EED and financing policies, as well as the
EPBD.
• Leaving aside transport, a combination of financing measures and the EED
account for the rest of the benefits. It is not possible to separate these two policy
instruments because they are closely interlinked; without both operating in
tandem some of the efficiency gains would not be realised. These measures
together are likely to account for most of the benefits in the EUCO35 and EUCO40
scenarios as they stimulate the large amounts of investment that drives the
positive results in the modelling.
In addition, it is noted that the policies each already make contributions to the EUCO27
scenario, to which the results are compared in this report, and that other policies (e.g.
carbon pricing) can have an important impact.
Although the disaggregation described above is rather coarse in nature, it highlights the
importance of having a portfolio of policies working together to meet the requirements
of different sectors. Without any one of the policies the degree of energy efficiency
realised, and therefore level of benefits, would be diminished.
4 Key issues to consider
4.1 Rebound effects
Rebound effects are an important issue in any assessment of energy efficiency impacts.
They describe how the initial energy savings may not be fully realised because of
secondary effects. Usually they are split into:
• Direct effects – for example, if insulation makes heating cheaper, then people
have warmer homes)
• Indirect effects – for example, if lower heating bills mean more money to spend
on other things, then consumers will purchase more goods, some of which
require energy to produce.
In this report, the direct effects are included in the inputs received from the PRIMES
model. The modelling with E3ME then estimates indirect effects.
53 The impacts of the EPBD are reported separately. Scenario 3 in the EPBD report could be embedded in the EUCO33 scenario. There are positive impacts on GDP (up to 0.6% in 2030) and measures linked to the EPBD could also be expected to lead to large health benefits and a small improvement in public budgets.

June 2017 117
Table V-7 shows the scale of the indirect rebound effect. In the less ambitious scenarios
the extent of the rebound effect is quite limited and in the EUCO30 scenario is too small
to stand out amongst other indirect effects (e.g. price changes). However, as the level
of ambition increases the size of the rebound effect also increases (both in relative and
absolute terms). In the EUCO40 scenario more than a quarter of the initial energy
savings could be lost to the indirect rebound effect.
The reason that the rebound effect increases in size with the level of ambition is the
relationship between economic production and energy consumption. In the EUCO40
scenario the level of investment required is much higher than in the other cases because
the energy efficiency measures become more expensive. The more expensive measures
require more energy to produce. They also provide higher incomes to the companies
and workers that manufacture and install them, leading to induced effects. Thus, the
size of the rebound effect is very closely linked to the economic impacts described in
Section 2.1.
In this light, it should be stressed that the rebound effect is not necessarily a negative
outcome. The positive impacts on the economy and labour market, social welfare and
public budgets all depend on the same mechanism. If the primary aim is to reduce
energy consumption, however, additional policy may be required.
Table V-7: The scale of indirect rebound effects and implications on energy savings achieved
(compared to 2007 baseline), EU28 in 2030
No Crowding out Partial crowding out
Rebound effect EE savings in 2030 Rebound effect EE savings in 2030
EUCO30 0.0% 30.0% 0.0% 30.0%
EUCO33 6.1% 32.6% 6.1% 32.6%
EUCO35 9.4% 34.2% 8.7% 34.3%
EUCO40 27.4% 36.4% 25.6% 36.7%
Source(s): E3ME, Cambridge Econometrics
4.2 Crowding out
Crowding out is a term that is used in this report to refer to capacity constraints on the
levels of production that can be achieved. The issue has been recognised as a key
determinant of the differences in results between macro-econometric models such as
E3ME and the more common Computable General Equilibrium (CGE) approach (e.g. see
European Commission, 2015).
In summary, the difference arises because of the ways the models treat economic
production. In a CGE model, it is assumed that agents optimise and that resources are
never left unemployed involuntarily.; this means it is not possible to increase production
without displacing, or ‘crowding out’, production from elsewhere. E3ME does not impose
this assumption, and so higher levels of production are possible. The result is that E3ME
often suggests better results than other models for scenarios that involve large
investment stimuli.
To aid comparability, there are two sets of results produced:
• A set with no crowding out, which is a standard E3ME assessment (no crowding
out)
• A set with an additional constraint imposed to limit how much production can
increase (partial crowding out)

June 2017 118
The limit in the partial crowding out case was determined by assessing how much it was
possible for the construction sector to increase output in a short period of time, given
available Eurostat data. Any attempt to increase production above this level led to
displacement of other activity.
The impact on results of imposing partial crowding out, shown in Table V-8, is to reduce
economic, labour market benefits and public budget benefits by almost half. The
differences become larger as the scenarios become more ambitious, because more
Member States hit the constraint.
There is no consensus among economists about whether crowding out would occur in
reality. There are, however, some ways that the effects of it could be reduced. Most
importantly would be to signal to firms in advance about potential future increases in
production, so that they can invest in sufficient capacity. Labour market capacity could
also be important as skills shortages can be an important constraint on production.
Previous analysis of energy efficiency policy has highlighted the need to encourage
training of more workers with basic STEM skills who are able to adapt to the new types
of jobs that would be created.
Table V-8: Impacts on EU GDP and employment in 2030, % difference from EUCO27
Degree of crowding out
EUCO30 EUCO33 EUCO35 EUCO40
GDP (€2013bn) No crowding out 0.4 1.5 2.1 4.1
Partial crowding out 0.4 1.3 1.6 2.2
Employment (m) No crowding out 0.2 0.7 1.0 2.1
Partial crowding out 0.2 0.6 0.9 1.4
Public budgets (% of GDP)
No crowding out 0.1 0.6 1.0 2.0
Partial crowding out 0.1 0.5 0.8 1.2
Source(s): E3ME, Cambridge Econometrics
4.3 Financing the energy efficiency measures
The final key issue to consider is the way in which the energy efficiency measures are
financed. As the levels of energy efficiency in the scenarios are given by the results from
the PRIMES model, this report is not able to assess how different financial arrangements
can affect the take-up of efficiency measures. However, there is some scope for
assessing how the financing arrangements might affect the six impact areas.
In the main scenarios in this report, a ‘self-financing’ approach is assumed. Under this
approach the agents the benefit from the energy efficiency pay for it. This means that:
• Businesses pay for their own equipment and increase prices to recoup costs
• Households divert spending from other things towards energy efficient goods
• Government pays for its own equipment and increases VAT rates to cover costs
One alternative approach, where the whole investment is paid for through public
budgets, was also tested. This variant is similar to the approach used in European
Commission (2015).
Some of the impact areas are not affected by the financing method (e.g. the
environmental benefits accrue either way) but the results do impact on the economic
and public budget results. Table V-9 shows that the GDP impacts are better under the

June 2017 119
public financing scheme but the public budgets are worse under the public financing
scheme by about the same amount.
The reason for the differences is to do with VAT receipts from purchases of the energy
efficient equipment. In the self-financing case, households must pay VAT on their
purchases. This takes money out of the economy but it accrues to national governments.
The impacts on GDP and public budget results are thus close to being opposite and
equal.
The conclusion from this analysis is that investment in energy efficiency will yield
benefits that can be split between the public sector and the wider economy. The
financing method could be important in determining exactly what that split is.
Table V-9: Impacts of changing the financing method, EU28, 2030 (no crowding out)
EUCO30 EUCO33 EUCO35 EUCO40
GDP (% from EUCO27)
Self-financing 0.4 1.5 2.1 4.1
Public-financing 0.7 2.1 2.9 5.3
Public budgets (%GDP from EUCO27)
Self-financing 0.1 0.6 1.0 2.0
Public-financing 0.0 0.1 0.1 0.4
Source(s): E3ME, Cambridge Econometrics
5 Closing remarks and policy interactions
This report has shown that across six impact areas, the effects of ambitious programmes
of investment in energy efficiency could be positive, sometimes highly so.
It should be noted, however, that there are some key conditions that must be met for
the full benefits to be realised. These are summarised below:
▪ The EED and related policies must be implemented fully and properly enforced;
otherwise results will be weaker across all impact areas. The modelling results show
that the higher degree of energy efficiency that is achieved, the more positive the
results.
▪ There is an important question about how energy efficiency investment will be
financed. This report does not assess the crucial question of how to incentivise
energy efficiency but shows that how the benefits of energy efficiency are shared
will depend on the financing mechanism.
▪ Competitiveness and economic benefits will be maximised if the energy efficient
equipment and materials are manufactured domestically (within the EU). Many of
the economic benefits accrue because spending on imported fuels is diverted
towards more domestic production. Although not assessed in this report, in the more
ambitious scenarios it is possible that a larger domestic market would incentivise
more firms to locate production in the EU, enhancing these benefits. Incentives to
attract firms and provide a suitably trained labour force could encourage domestic
production.
▪ The potential ‘crowding out’ of economic activities remains a key concern in the more
ambitious scenarios. If ambitious targets were to be met, firms that manufacture
and install energy efficient equipment would need to ensure that they had adequate

June 2017 120
capacity to meet market demands. Signalling the ambition clearly to companies in
advance so that they can take a view on the prospective increases in demand, and
ensuring a suitably skilled workforce, will assist in the process.
▪ The impacts on social welfare and income distribution could be enhanced if there
were specific measures to target energy efficiency improvements in buildings that
house low income households. Such measures could also reduce fuel poverty rates
across the EU by up to 8.3 million households.
▪ The environmental impacts depend not only on the amount of energy efficiency that
is implemented but also what happens in the wider energy system, and especially in
the fuel mix of the power generation sector. Other policies and their synergies have
an impact on that, notably EU ETS and the level of the carbon price.
In conclusion, the results in this report outline many potential benefits of improving
energy efficiency in Europe over the period up to 2030. There are potential economic,
social and environmental benefits, that increase in line with the degree of energy savings
that is achieved. The targets for energy efficiency across Europe have now been set and
it is up to policy makers to ensure that these targets are met in a way that enables
society to realise these benefits.

June 2017 121
Appendices

June 2017 122
Appendix A Short Description of E3ME
1 Introduction
1.1 General overview of the model
E3ME is a computer-based model of the world’s economic and energy systems and the
environment. It was originally developed through the European Commission’s research
framework programmes and is now widely used in Europe and beyond for policy
assessment, for forecasting and for research purposes. It was applied in the recent
study for DG ENER that provided inputs to the assessment of 2030 climate and energy
framework and was also used in the previous Impact Assessment of the Energy
Efficiency Directive.
1.2 E3ME’s basic structure
The economic structure of E3ME is based on the system of national accounts, with
further linkages to energy demand and environmental emissions. The labour market is
also covered in detail, including both voluntary and involuntary unemployment. In total,
there are 33 sets of econometrically estimated equations, including the components of
GDP (consumption, investment, international trade), the labour market, prices, energy
demand and materials demand. Each equation set is disaggregated by country and by
sector. Each EU Member State is disaggregated and broken down to 69 economic
sectors, although for presentational purposes the sectors are aggregated to show key
impacts more clearly.
E3ME’s historical database covers the period 1970-2014 and the model projects forward
annually to 2050. The main data sources for European countries are Eurostat and the
IEA, supplemented by the OECD’s STAN database and other sources where appropriate.
1.3 The different modules in E3ME
Figure 0.1 shows how the three E’s or components (modules) of the model - energy,
environment and economy - fit together. Each component is shown in its own box. Each
data set has been constructed to conform with accounting conventions. Exogenous
factors coming from outside the modelling framework are shown on the outside edge of
the chart as inputs into each component. For each region’s economy, the exogenous
factors are economic policies (including tax rates, growth in government expenditures,
interest rates and exchange rates). For the energy system, the outside factors include
energy policy54 (including regulation of the energy industries and public energy
efficiency programmes). For the environment component, exogenous factors include
policies such as reduction in SO2 emissions by means of end-of-pipe filters from large
combustion plants. The linkages between the components of the model are shown
explicitly by the arrows that indicate which values are transmitted between components.
54 Existing policy will already be included implicitly in the historical data. Additional regulations limiting energy usage can be added by the model user; pricing instruments can also be added separately.

June 2017 123
Source(s): Cambridge Econometrics
1.4 Standard model outputs
As a general model of the economy, based on the full structure of the national accounts,
E3ME is capable of producing a broad range of economic indicators. In addition, there
is range of energy and environment indicators. The following list provides a summary
of the most common model outputs:
▪ GDP and the aggregate components of GDP (household expenditure, investment,
government expenditure and international trade)
▪ sectoral output and GVA, prices, trade and competitiveness effects
▪ international trade by sector, origin and destination
▪ consumer prices and expenditures
▪ sectoral employment, unemployment, sectoral wage rates and labour supply
▪ energy demand, by sector and by fuel, energy prices
▪ CO2 emissions by sector and by fuel
▪ other air-borne emissions
▪ material demands
In addition to the sectoral dimension mentioned in the list, all indicators are produced
at the national level and annually up to 2050, although the analysis in this report focuses
on the period up to 2030.
2 How energy efficiency is modelled in E3ME
The modelling approach that is applied in this study broadly matches the methodology
that was used in the 2015 assessment of the Energy Efficiency Directive. The inputs to
the model are:
▪ estimates of energy savings
▪ estimates of the cost of these savings
Figure 0.1 E3ME's modules

June 2017 124
▪ information about which energy carriers have been displaced (mainly gas or
electricity for buildings, forming part of the estimates above)
▪ an assumption about how the energy efficient investment is financed
Apart from the financing assumption, these inputs are derived from the results of the
PRIMES model. The assumption about financing is determined as part of the scenario
design. In general, it is assumed that buildings investment is made by the occupants of
buildings, reflecting the revised and better enforced regulation; private businesses
increase prices to cover costs; and government increases VAT rates. For households,
this investment may displace spending on other things in the short run, while businesses
may pass on the costs through higher product prices.
Figure 0.2 describes the main economic linkages in the model. The two main inputs,
energy savings and the investment requirements are entered on the right-hand side.
Investment affects GDP and output levels directly, whereas changes in energy demand
have an indirect effect in most European countries via changes in trade patterns (i.e.
fuel imports likely to be reduced, while domestic production of other goods may
increase).
Source(s): Cambridge Econometrics
The lower left-hand side of the diagram shows some of the multiplier effects and inter-
dependencies in the model. Higher production levels lead to increases in employment
(and also wages, not shown on the diagram), in turn boosting incomes and expenditure.
On the top-left and far left of the diagram, we can see the impacts of financing the
energy efficiency measures. The nature of the impacts depends on the financing
methods chosen.
One important aspect is the diagonal line from output and GDP to energy demand, which
represents the indirect rebound effect in the model. As production levels increase, there
will be an increase in energy consumption as well (all other things equal). Research
using a previous version of E3ME has shown that the rebound effect can be as high as
50% if measured in the long run at global level – i.e. 50% of the original energy savings
are lost through indirect increases in energy consumption.
Figure 0.2 Main Model Linkages
June 2017 125
Finally, the diagram does not show the impacts on greenhouse gas and other
environmental emissions, but these would be expected to fall in line with changes in
energy demand – with the extent that they fall depending on the fuels that are displaced.
Comparison with other exercises carried out for DG ENER
The modelling that was carried out by Cambridge Econometrics for DG ENER in 2015
used a similar approach to assess the effects of energy efficiency, taking the results
from the PRIMES model as inputs to the scenarios.
A slightly different approach was used for the EPBD report, as the focus on buildings in
that report meant that more detail could be obtained by using analysis by Ecofys as
inputs. However, the methodology beyond that stage was largely the same.
Crowding out in E3ME
An important issue that is raised in macroeconomic modelling exercises is ‘crowding
out’. The term crowding out has traditionally been used to describe higher levels of
public expenditure leading to lower levels of private expenditure due to supply
constraints. More recently in academic debates it has been applied to supply constraints
more generally, but particularly in relation to financial resources.
In the scenarios in this report, higher investment in household energy efficiency is
funded by lower rates of spending on other consumer products, so there is a direct
crowding out effect (i.e. net debt levels do not change). The process is similar for
businesses (which raise prices) and government (which raises taxes). However, the
model does not as standard impose strict crowding out in other parts of the economy;
for example, the construction sector is able to increase its output and use resources
that in the reference scenario are unemployed (e.g. unemployed workers). There are
restrictions in the labour market, as wages increase in response to tightening conditions
but the level of output is largely determined by the level of aggregate demand.
This sits E3ME apart from the more common CGE macroeconomic modelling approach,
where crowding out is strictly enforced and outcomes are determined by supply-side
factors. To test the sensitivity of the model results to assumptions about crowding out
two variants of each scenario were assessed, one with no crowding out and one with
partial crowding out.
2.1 The six impact areas in E3ME
The results from E3ME are fed into the analysis for each of the six impact areas described
throughout this report. In some cases, the E3ME results comprise the majority of the
indicators that are presented in the analysis (e.g. economy and labour market,
environment and public budgets). However, in each case additional quantitative analysis
is carried out. The methodologies applied to do this are described in the main report.
2.2 The reference scenario
In this study, the E3ME reference scenario was calibrated to match the PRIMES 2016
reference scenario. E3ME takes the following indicators from the projections directly:
▪ GDP and sectoral economic output
▪ energy and ETS prices
▪ projections of energy demand by sector and by fuel
▪ CO2 emissions by sector
▪ population
These indicators combined allow us to construct an economic reference scenario based
on the energy system results from PRIMES.

June 2017 126
E3ME is frequently calibrated to match published PRIMES projections and the software
routines to do the matching are now well established55 and have not been revised from
previous studies. Further details are provided in Appendix B.
55 ‘Studies on Sustainability Issues – Green Jobs; Trade and Labour’, Final Report for the European Commission, DG Employment, available at: ec.europa.eu/social/BlobServlet?docId=7436&langId=en ‘Employment effects of selected scenarios from the energy roadmap 2050’, Final Report for the European Commission, DG Energy, available at: http://ec.europa.eu/energy/en/content/employment-effects-selected-scenarios-energy-roadmap-2050-0 ‘A policy framework for climate and energy in the period from 2020 up to 2030. Impact Assessment’, available at: http://eur-lex.europa.eu/legal-content/EN/ALL/?uri=CELEX:52014SC0015

June 2017 127
Appendix B The Reference and Policy Scenarios
1 The reference scenario
The starting point for the E3ME analysis was the 2016 reference scenario that was
developed with the PRIMES model. Inputs to E3ME, including both assumptions used by
PRIMES (e.g. energy prices, economic growth rates) and the full energy balances from
the PRIMES results were made consistent.
The same information was taken for each of the scenarios and thus the design of the
scenarios in E3ME matches that from the PRIMES model as closely as possible:
▪ EUCO27
▪ EUCO30
▪ EUCO33
▪ EUCO35
▪ EUCO40
The E3ME reference scenario was calibrated to match the latest version of the reference
scenario derived from the PRIMES model. E3ME takes the following indicators from the
projections directly:
▪ GDP, consumer expenditure sectoral economic output
▪ energy and ETS prices
▪ projections of energy demand by sector and by fuel
▪ total CO2 emissions
E3ME’s FTT:Power submodel (Mercure, 2012), which looks in detail at the power
generation sector, has been updated so that its outputs are fully consistent with the
PRIMES results (given differences in model classifications, etc.). The main outputs from
the FTT submodel that have been calibrated to match PRIMES are:
▪ fuel inputs into thermal power plants
▪ electricity capacity
▪ investment by the electricity supply sector
▪ electricity prices
The FTT:Power submodel is used in E3ME to estimate power sector capacity and
electricity generation. However, in the scenarios presented in this report we do not apply
FTT:Power as this would create inconsistencies with the PRIMES model results. Instead,
results are fixed to match the figures from PRIMES.
1.1 Economic indicators
The E3ME reference scenario was updated to be consistent with the economic indicators
that were fed into the PRIMES model. These include projections of Gross Domestic
Product (GDP), sectoral Gross Value Added (GVA) and consumer expenditure. The
calibration was made in terms of growth rates and not actual levels, as the two models
have slightly different vintages of historical data. The last year of historical data in E3ME
is currently 2014.
The PRIMES reference scenario GDP figures were provided in 2010 prices, but inputs to
the scenarios were made using 2013 prices. Changing the price base to be consistent
to the scenario information may have resulted in slightly different levels compared to
the input file but growth rates are unchanged.
The calibration was made at Member State level.

June 2017 128
Further processing
While the PRIMES datasets provide figures for sectoral GVA and household consumption
on a constant price basis, the classifications used are at a higher level of aggregation
than those in the E3ME model and further processing is therefore required to calibrate
the more detailed E3ME outputs.
PRIMES sectoral GVA growth rates were mapped to the E3ME sectors, while all the
categories of household expenditure were set to grow using historical trends and then
constrained to the published total for household expenditure. Disposable income was
set to grow at the same rate as household expenditure.
Gross economic output in each sector was set to grow at the same rate as GVA (and
hence at the same rate as the PRIMES assumptions), while the other components (apart
from household expenditure) of final demand at sectoral level (e.g. investment and
trade) were set to grow at rates based on historical rolling averages and then
constrained to be consistent with the total output projections.
Prices for industries other than the energy-related ones reported in the PRIMES figures
were projected using historical trends.
1.2 Energy demand
The PRIMES projections include a comprehensive set of projections of energy demands
and the resulting emissions. E3ME’s projections for the reference scenario were set to
match the growth rates from PRIMES. The high level of detail of the PRIMES outputs
makes it possible to map them straightforwardly to the E3ME classification.
1.3 Energy and CO2 prices
Fuel prices in E3ME were set to match the baseline fossil fuel price assumptions shown
in the table below. Prices of the economic outputs of the energy-related industries in
E3ME were also made consistent with these assumptions, as shown in Table 0-1.
Table 0-1 PRIMES reference scenario energy prices, euro 2013/boe
2010 2020 2030
Oil 62.6 75.0 93.8
Gas 39.5 48.3 56.8
Coal 16.7 14.3 20.5
Source(s): PRIMES results
CO2 prices in E3ME’s reference scenario were also updated to be consistent with the
prices in the PRIMES projections (see Table 0-2). The revenues from the ETS allowances
that are auctioned to the power generation sector are recycled into reducing VAT rates,
so as to ensure fiscal neutrality.
Table 0-2 PRIMES reference scenario CO2 price, euro 2013/tCO2
2010 2020 2030
EU ETS sectors 11.2 15.0 33.5
Source(s): PRIMES results
A key driver in the scenarios is electricity prices. Electricity prices could be calculated
within E3ME but, because it is an energy systems model, the PRIMES model conducts
this calculation at a much higher level of detail. Electricity prices from 2010-30 in the
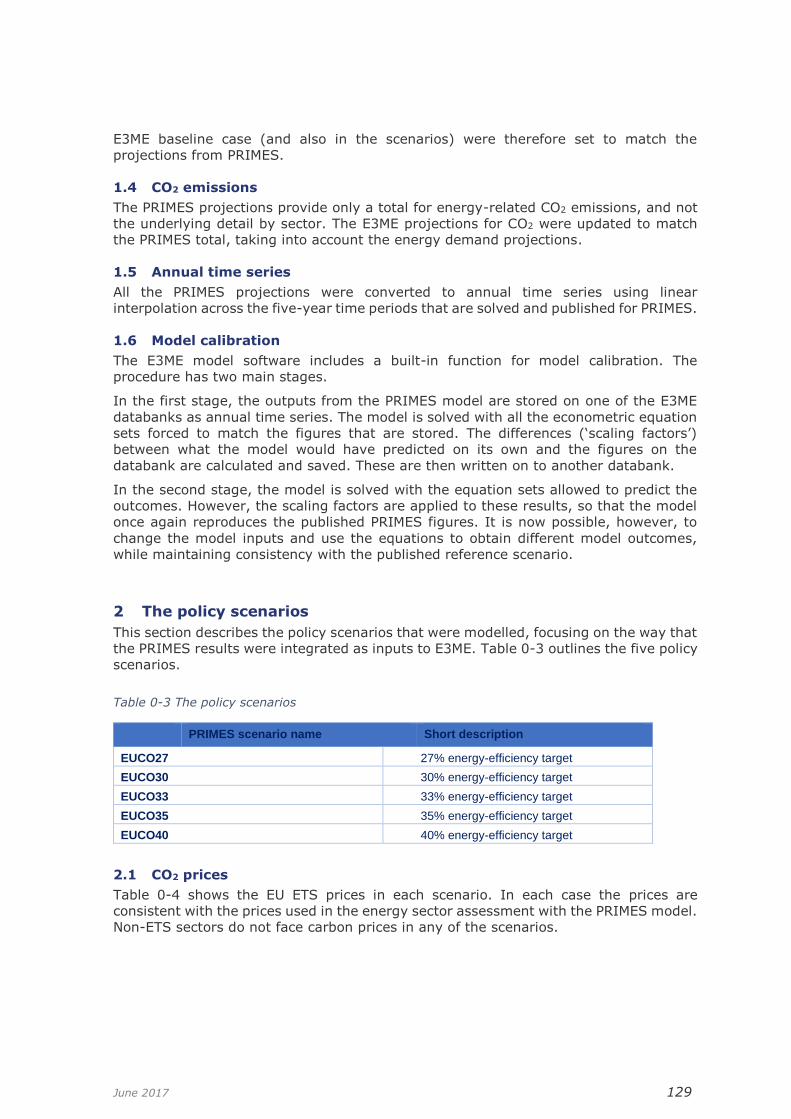
June 2017 129
E3ME baseline case (and also in the scenarios) were therefore set to match the
projections from PRIMES.
1.4 CO2 emissions
The PRIMES projections provide only a total for energy-related CO2 emissions, and not
the underlying detail by sector. The E3ME projections for CO2 were updated to match
the PRIMES total, taking into account the energy demand projections.
1.5 Annual time series
All the PRIMES projections were converted to annual time series using linear
interpolation across the five-year time periods that are solved and published for PRIMES.
1.6 Model calibration
The E3ME model software includes a built-in function for model calibration. The
procedure has two main stages.
In the first stage, the outputs from the PRIMES model are stored on one of the E3ME
databanks as annual time series. The model is solved with all the econometric equation
sets forced to match the figures that are stored. The differences (‘scaling factors’)
between what the model would have predicted on its own and the figures on the
databank are calculated and saved. These are then written on to another databank.
In the second stage, the model is solved with the equation sets allowed to predict the
outcomes. However, the scaling factors are applied to these results, so that the model
once again reproduces the published PRIMES figures. It is now possible, however, to
change the model inputs and use the equations to obtain different model outcomes,
while maintaining consistency with the published reference scenario.
2 The policy scenarios
This section describes the policy scenarios that were modelled, focusing on the way that
the PRIMES results were integrated as inputs to E3ME. Table 0-3 outlines the five policy
scenarios.
Table 0-3 The policy scenarios
PRIMES scenario name Short description
EUCO27 27% energy-efficiency target
EUCO30 30% energy-efficiency target
EUCO33 33% energy-efficiency target
EUCO35 35% energy-efficiency target
EUCO40 40% energy-efficiency target
2.1 CO2 prices
Table 0-4 shows the EU ETS prices in each scenario. In each case the prices are
consistent with the prices used in the energy sector assessment with the PRIMES model.
Non-ETS sectors do not face carbon prices in any of the scenarios.

June 2017 130
Table 0-4 Policy scenario EU-ETS prices, 2013euro/tCO2
2030
EUCO27 42.0
EUCO30 27.0
EUCO33 26.5
EUCO35 20.0
EUCO40 14.0
Source: PRIMES results
2.2 Power generation and electricity prices
An important input to the scenarios is the amount of investment required to bring about
the changes in the power generation mix. Additional investment by the electricity supply
sector was added exogenously into E3ME. It is assumed to be financed by higher
electricity prices, which are also taken from PRIMES.
2.3 Energy efficiency and investment
In E3ME, the energy efficiency savings were entered exogenously in the model and were
set to match the PRIMES results as closely as possible. The change in final energy
demand from PRIMES was used as a guide for the level of energy efficiency savings.
These savings were then distributed among sectors and energy carriers, using as a
guide the level of investment made by each sector and the shares between energy
carriers in proportion to energy consumption.
The investment costs are also taken from the PRIMES results. In the case of the scenario
results presented in Part IV of this report, it is assumed that the energy efficiency
investment is self-financed by firms and households. This has an impact on firms’ costs
and profits and households’ ability to purchase other goods. Investment made by the
public sector is financed by changes in taxation (adjustments to the standard rate of
income tax).
In the alternative financing scenario presented in Part IV, Section 2.8, it is assumed
that all of the investment is funded by public budgets, leading to increases in the
standard rate of income tax.
2.4 Revenue recycling
The general approach in this report is that the scenarios are directly revenue neutral
with regards to costs to the public sector of energy efficiency investment and changes
to the revenues from auctioned ETS allowances. We have not made the scenarios fully
budget neutral, however, for example do not make any corrections to changes in income
tax receipts. Instead these impacts are reported in the public budget impact area.
In each Member State, standard VAT rates are adjusted to cover the balance from
changes in government sector investment costs and ETS revenues.

June 2017 131
Appendix C Further policy details
This appendix includes details on the assumptions made in the modelling (mainly in
PRIMES) to reflect the proposed updates to the EED that are included in the policy
scenarios. As the results from PRIMES are fed into E3ME, the same policies are included
in the analysis in this report.
Standards
Standards (eco-design, building codes and CO2 standards for vehicles) are intensified
for all sectors in the different policy scenarios. Standards are an essential feature of a
cost-effective approach. Both modelling experience and current practice show that the
benefits in terms of economies of scale and overcoming market failures by using internal
market rules are very important. For the most ambitious scenarios, the application of
BAT (best available technology) in industry is assumed.
Energy Efficiency Values
Shadow Energy Efficiency Values (EEVs) were applied and scaled up representing yet to
be identified policy measures aiming at achieving energy savings (notably reflecting
implementation of Article 7, other national incentives and saving schemes). As EEVs
apply to the entire residential, tertiary and industrial sectors, they trigger the most cost-
effective options in these sectors.
Behavioural discount rates
The use of behavioural discount rates was adjusted with increasing energy efficiency
levels in 2030. The European Commission is working on an improvement of financial
instruments and other financing measures on the European level to facilitate access to
capital for investment in thermal renovation of buildings. Together with further labelling
policies for heating equipment and for other product groups, increased investment in
thermal renovation of buildings can lead to a reduction of behavioural discount rates for
households and the service sector.
The transport system
Some specific measures that are aimed at improving the efficiency of the transport
system and managing transport demand are included in the more ambitious scenarios.
This is done in line with measures assumed in the scenarios presented in the Staff
Working Document on Low Emission Mobility56 (e.g. full internalisation of local
externalities on the interurban network, ambitious deployment of Collaborative
Intelligent Transport Systems, promotion of efficiency improvements and multimodality,
taxation).
Heat pumps
Scenarios that are more ambitious than EUCO27 assumed policies that facilitate the
uptake of heat pumps. This assumption reflects option 3.b of the Article 7 analysis,
which would allow counting savings stemming from on-site renewable energy (e.g. heat
pumps) within the 25% exemptions, more ambitious eco-design/labelling policies and
the change of the primary energy factor.
56 SWD(2016) 244 final.
June 2017 132
Appendix D Review of Previous Studies
1 Introduction
This chapter presents the findings from the review of recent literature and data sources
that was carried out early in the study. Some of the findings from the review were
carried forward into the later modelling tasks, but the review also holds information that
is useful in its own right.
2 Economy and labour market
2.1 Introduction
Some of the relevant literature comes from previous studies that have been carried out
using the E3ME model. Most recently, the EPBD report assesses the effects of energy
efficiency improvements in buildings, finding that GDP could increase by 0.6% in 2030
and employment by 0.3%.
Unlike the EPBD report, however, the interest in the present study is on energy savings
across the whole economy and not just the buildings sector. This means that some of
the expected impacts could be different to those outlined in the EPBD report. Notably,
competitiveness effects could be much more substantial.
Possibly more relevant to the present report are the results of the previous 2015 study
that was carried out for DG ENER by a team led by Cambridge Econometrics. These
results are summarised in the box below.
A wider literature review of economic impacts can be found in the IEA’s Multiple Benefits
report (2014). The IEA’s report identified a range of impacts but found that the likely
scale of the impacts is highly dependent on the size of energy efficiency programme
implemented.
Box 0-1 Assessing the Employment and Social Impact of Energy Efficiency
Some of the main findings of this study in terms of economy and labour market outcomes are summarised as follows:
• This study emphasises that energy efficiency can have a range of benefits to households, businesses and wider society.
• Some of the benefits that result from investment in energy efficiency (e.g. GDP) increases can be readily quantified, while others such as health improvements are more difficult to estimate.
• Estimated GDP increases in previous studies typically lie in the range of 0.3% to 1.3% depending on time periods, geography and the scale of the programme under consideration.
• The study estimates that gross EU28 employment in the provision of energy efficiency goods and services sold in 2010 amounted to approximately 0.9m jobs. This figure increases to 2.4m jobs if other activities that could potentially generate energy savings are included in the analysis.
• The modelling in the study found that the implementation of more ambitious energy efficiency programmes to reduce energy consumption by 30% compared to the PRIMES 2007 baseline. This could produce an increase in employment at EU level of 0.7-4.2m by 2030.
Source(s): Cambridge Econometrics et al. (2015).

June 2017 133
The scenarios that are described in Chapter 3 of Cambridge Econometrics et al. (2015)
cover a wider range of sectors and show potentially a much higher level of ambition in
terms of energy savings than the EPBD report. This makes two aspects of the analysis
much more important:
▪ rebound effects
▪ crowding out effects
These issues are discussed further below.
2.2 Rebound effects
Rebound effects have often been put forward as a negative aspect of energy efficiency
programmes. These effects refer to the increased consumption of energy and/or non-
energy services induced by the implementation of energy efficiency measures (de la
Rue du Can et al., 2015). On one hand, improved energy efficiency has the effect of
reducing the price of energy goods, causing higher energy consumption (direct rebound
effect). On the other hand, the lower spending on energy goods implies an increase in
available income, leading to higher consumption of other goods and services (indirect
rebound effect). Higher levels of energy efficiency can also produce economy-wide
impacts when affecting the price of intermediate and final goods (AEA, 2017).
More recently, the literature, led by the IEA’s 2014 Multiple Benefits report, has
suggested that the rebound could be viewed either positively or negatively when
macroeconomic benefits such as higher GDP are taken into account, but is something
that policy makers must be aware of. Gillingham et al. (2015) similarly criticised the
unwarranted focus on potentially detrimental rebound effects and argued in favour of a
more precise assessment of the welfare implications of energy efficiency policies. Model-
based estimates of the scale of rebound effects vary from close to zero to up to 50% at
global level (Barker et al, 2009). Important variations exist across sectors, having for
example an estimated 18% average rebound effect in the road transport sector (Llorca
and Jamasb, 2016; Stapleton et al., 2016) and a 60% rebound for the construction
sector (Du et al., 2017). Some studies have estimated specific rebound effects of more
than 100% (Freire-González, 2017).
It is clear from the literature that rebound effects must be accounted for in analysis of
ambitious energy efficiency programmes. Rebound effects are driven by economic ties
and are discussed further in Section 2.5 below, which also includes a list of previous
estimates of the size of the rebound effect.
2.3 Crowding out
Successive studies have shown assumptions about crowding out to be critical to
determining the estimated impacts of energy efficiency scenarios. Macroeconomic
models typically either assume full crowding out or no crowding out and the choice of
model determines the choice of assumption that is made.
Crowding out occurs due to supply constraints on the economy. If the economy is
operating at maximum capacity, then any additional activity will have to substitute for
activity elsewhere rather than be additional. Under models that assume diminishing
marginal returns57 (which includes most CGE models) this means that a negative impact
is guaranteed. Indeed, the CGE modelling approach assumes full capacity in capital
markets, meaning that higher investment in energy efficiency must be at the expense
57 According to the law of diminishing marginal returns, the marginal output of a production process decreases as the amount of a certain production factor is incrementally increased, ceteris paribus.

June 2017 134
of investment elsewhere in the economy. Under CGE conditions therefore, investment
and GDP would not be expected to increase.
Crowding out could occur in any economic market. Three important examples are:
▪ Labour markets – if full employment is reached, it is not possible to increase
employment further. Instead, any additional demand for labour will push up wage
rates, displacing workers from other sectors rather than increasing the total level of
employment.
▪ Capital markets – if all available finance is used, it is not possible for banks to issue
new loans for investment. Higher demand for capital instead leads to higher interest
rates which will either encourage higher savings rates (displacing consumption) or
reduce capital investment elsewhere.
▪ Product markets – if companies are producing at full capacity they cannot produce
more. They will instead meet higher demand by pushing up the prices for their
goods.
Optimisation models, including CGE models, assume by default that all available
resources are used, meaning that crowding out will occur in all economic markets.
However, simulation models allow for the possibility of spare capacity so that additional
production may take place.
This issue has been debated by economists since at least the mid 20th century. Different
schools of economic thought have developed based on different theories about market
capacity and potential crowding effects. The treatment by different economists of the
different markets varies across all the three examples above, but differences are
particularly stark in financial markets, where mainstream economics assumes a fixed
money supply, which does not appear consistent with the activities of modern central
banks (Pollitt and Mercure, 2017; McLeay et al, 2014; Keen, 2011). In the context of
energy policy (albeit in the US), Pollin et al (2014) notes that crowding out is unlikely
to occur in a decarbonisation scenario, in part because investment by the energy sector
is reduced compared to baseline.
It is very hard to find clear evidence of whether crowding out occurs in reality or not
because of the absence of a counterfactual case. Most of the studies that are available
are based on modelling exercises and therefore embody assumptions about crowding
out without testing. There is slightly more consensus (and therefore less debate) about
labour markets as it is accepted that employment cannot exceed the number of people
available (and unemployment exists). For product markets, Eurostat publishes data on
capacity utilisation for key sectors of the economy (see Part III, Section 2.3). However,
even this is not sufficient to determine whether higher rates of capacity utilisation at
sectoral level lead to higher prices and displacement of other activity.
Previous studies that are not fixed to a single modelling approach therefore apply
sensitivities to test crowding out assumptions (as well as previous studies published by
DG ENER, see IEA/IRENA, 2017). A similar modelling approach is adopted in the present
study. It is described in detail in Part III, in terms of how crowding out might occur in
all three markets outlined above. The modelling results presented in Part IV include
scenario versions without crowding out and with partial crowding out due to capacity
constraints in the construction sector. There is therefore a range of impacts produced
by E3ME.
2.4 GDP
The standard metric that is used to assess the macro level impact of energy efficiency
programmes is GDP. The majority of studies have reported a positive impact of energy
efficiency policies on GDP, regardless of the methodological approach that was employed

June 2017 135
to conduct the study. Table 0-5 provides some references, along with a description of
their main findings.
Table 0-5 GDP impacts of investing in energy efficiency
Reference Scope Main findings
1 Cambridge Econometrics and Verco, 2012, Jobs, Growth and Warmer Homes. Evaluating the Economic Stimulus of Investing in Energy Efficiency Measures in Fuel Poor Homes
UK
This study estimates that investing in energy efficiency measures in energy poor
households could increase GDP by 0.2%.
2 Lutz et al.,2012, Economic Impacts of Energy Efficiency and Renewable Energy in Germany
Germany
By 2030 German GDP could
increase by €22.8 bn due to the implementation of energy efficiency measures.
3 ENE et al.,2012, Energy Efficiency: Engine of Economic Growth in Eastern Canada
Canada
Between $4 and $8 of additional GDP could be generated by every $1 spent on energy efficiency
improvements.
4 Joyce et al., 2013, Monetising the multiple benefits of energy efficient
renovations of the buildings of the EU
EU
Energy efficiency programmes to renovate buildings could lead to GDP increases in the range of 1.2-2.3%.
5 Prognos, 2013, Ermittlung der
Wachstumswirkungen der KfW-
Programme zum Energieeffizienten Bauen und Sanieren
Germany GDP could rise by 0.25%
compared to baseline values.
6
Acadia Center, 2014, Energy Efficiency: Engine of Economic Growth in Canada
Canada
Energy efficiency programmes could potentially increase GDP by $5-8 per $1 spent. A total net GDP increase of $230 bn to $580 bn over the period 2012-2040 is
expected.
7 Navius Research, 2014, Macro-economic Effects of Energy Efficiency
Improvements
Canada
This research finds that energy efficiency measures increased GDP by about 1% over the period 2002-2012.
8
Energy2030, 2015, Accelerate Energy Productivity 2030
US
This report assesses the economic
impact of doubling energy productivity in the US by 2030. It is estimated that achieving such a target would result in a net GDP increase of $922bn by 2030. In the particular case of buildings, $331bn cumulative investment
costs and $409bn cumulative cost savings would be required in order to contribute to meet the target.
9 Cantore et al., 2016, Does energy efficiency improve technological
change and economic growth in developing countries?
29 developing
countries
The authors conclude that lower levels of energy intensity are associated with higher total factor
productivity in the manufacturing sector. They also provide evidence of a robust negative

June 2017 136
relationship between energy intensity and GDP.
10 Rajbhandari and Zhang, 2017, Does energy efficiency promote economic growth?
56 high and middle income
countries
This World Bank working paper concludes that promoting energy efficiency has the potential to support higher economic growth in the long term.
Source(s): Cambridge Econometrics’ elaboration based on the referenced reports.
2.5 Other macroeconomic indicators
A comprehensive assessment of the impact of energy efficiency measures at the
macroeconomic level requires analysis of other indicators such as:
▪ sectoral output
▪ household income and consumption
▪ investment & interest rates
▪ international trade
▪ prices and inflation
Sectoral output
Energy efficiency programmes can improve competitiveness, by lowering production
costs. Eventually, this decline in production costs will be translated into lower prices of
products that affect domestic and external demand positively. ECEEE (2013) suggests
that energy efficiency programmes have a higher potential than energy price cuts to
improve EU competitiveness in the global market58. Similarly, Astrov et al. (2015)
pointed out that energy efficiency improvements limited the competitive loss for
European manufacturing industries in international markets that was caused by higher
gas and electricity prices in Europe.
Firms can effectively improve their resilience to energy price shocks by adopting more
energy efficient technologies, therefore avoiding sudden spikes in their energy costs.
While energy generally accounts for a minor share of production costs, it represents a
key cost component for energy-intensive industries such as aluminium, chemicals, glass
and cement sectors. Flues et al. (2013) provided evidence of energy-intensive industries
(in this case the steel sector) reacting to higher energy prices by improving their energy
efficiency. The existence of a rebound-effect however counteracted the idea of a
negative relationship between steel production and energy input prices.
Household income, consumption and rebound effects
The impact of energy efficiency on household income and consumption has been
extensively discussed in the existing body of knowledge. Specifically, there is a vast
literature with a focus on how savings in energy bills are subsequently spent, potentially
leading to rebound effects. As described in the existing literature (Greening et al., 2000;
Maxwell et al., 2011) three types of ‘rebound’ effects59 can be identified:
▪ Direct rebound effect – refers to the increase in consumption of a product / service
that results from a reduction in its costs, e.g. longer heating hours due to more
efficient heating systems.
▪ Indirect rebound effect – refers to the additional spending on consumption that takes
place when energy efficiency savings free some income to be spent on other
58 See, also, IEEP (2013) for further discussion on how energy efficiency could improve EU presence in international markets. 59 See, also, Maxwell et al. (2011) for further explanations on the ‘rebound’ effect and various case studies.

June 2017 137
products and services, e.g. households’ energy savings from more energy efficient
heating may be spent on transport services. More specifically, we can distinguish:
Income effect – energy efficiency savings are instead spent on other goods and
services that may be energy-intensive.
Energy price effect – if demand for energy falls, so do energy (or, in the EU,
ETS) prices, which favours consumption elsewhere.
▪ Economy wide rebound effect60 – In addition to the previous two effects which are
observed at microeconomic level, there is also an effect at macroeconomic level.
This refers to the increase in consumption that is caused by an increase in
productivity and economic growth that emanates from higher efficiency. Table 0-6
provides an overview of the different methodological approaches that could be
employed to assess the rebound effect.
Table 0-6 Overview of available methodologies for assessment of the rebound effect
The table below summarises the main methodologies that are available for the
assessment of the rebound effect:
Source(s): Reproduced from Maxwell et al. (2011).
Using the E3MG model, Barker et al. (2009) propose the following equations to
measure the rebound effect:
1. ‘macroeconomic rebound effect’ = ‘indirect rebound effect’ + ‘economy-wide
rebound effect’
2. ‘total rebound effect’ = ‘macroeconomic rebound effect’ + ‘direct rebound
effect’
3. ‘gross energy savings from IEA energy-efficiency policies’ = ‘net energy
savings (taken as exogenous in E3MG)’ + ‘direct rebound energy use’
4. ‘change in macroeconomic energy use from energy-efficiency policies from
E3MG’ = ‘energy use simulated from E3MG after the imposed exogenous net
energy savings’ − ‘energy use simulated from E3MG before the imposed
exogenous net energy savings’
60 In the main report, this is grouped as a type of indirect rebound effect.
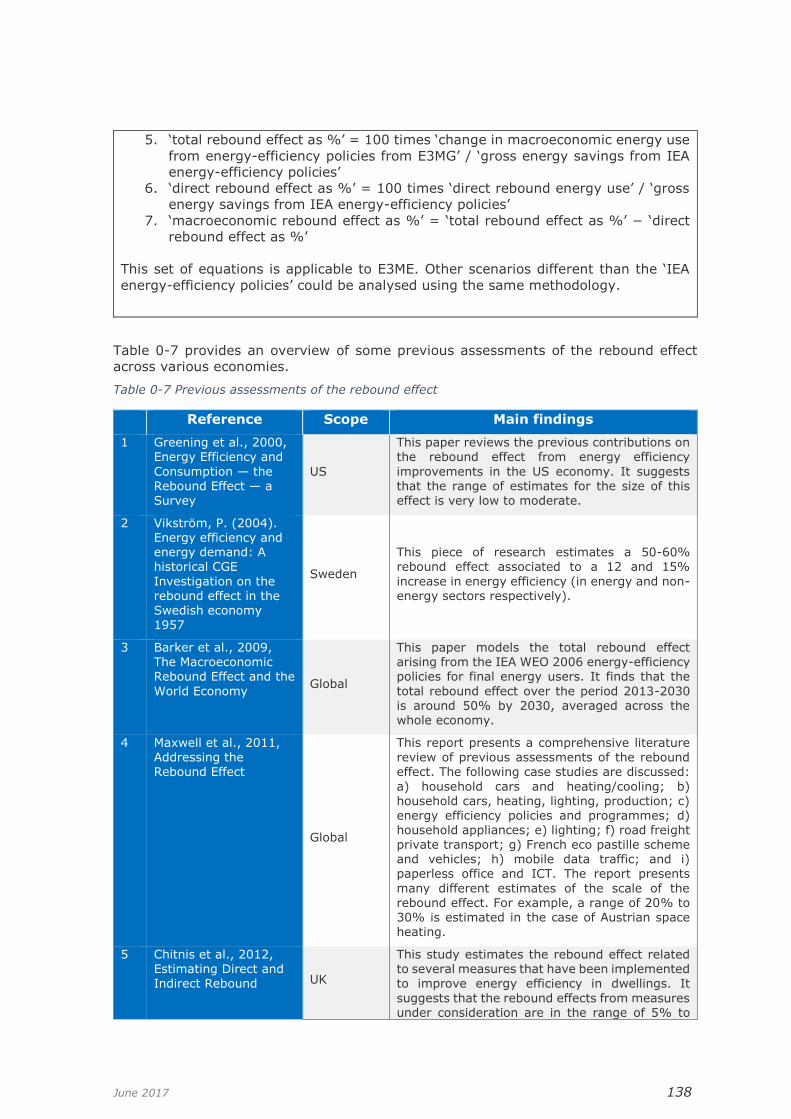
June 2017 138
5. ‘total rebound effect as %’ = 100 times ‘change in macroeconomic energy use
from energy-efficiency policies from E3MG’ / ‘gross energy savings from IEA
energy-efficiency policies’
6. ‘direct rebound effect as %’ = 100 times ‘direct rebound energy use’ / ‘gross
energy savings from IEA energy-efficiency policies’
7. ‘macroeconomic rebound effect as %’ = ‘total rebound effect as %’ − ‘direct
rebound effect as %’
This set of equations is applicable to E3ME. Other scenarios different than the ‘IEA
energy-efficiency policies’ could be analysed using the same methodology.
Table 0-7 provides an overview of some previous assessments of the rebound effect
across various economies.
Table 0-7 Previous assessments of the rebound effect
Reference Scope Main findings
1 Greening et al., 2000, Energy Efficiency and
Consumption — the Rebound Effect — a Survey
US
This paper reviews the previous contributions on the rebound effect from energy efficiency
improvements in the US economy. It suggests that the range of estimates for the size of this effect is very low to moderate.
2 Vikström, P. (2004).
Energy efficiency and energy demand: A historical CGE
Investigation on the rebound effect in the Swedish economy 1957
Sweden
This piece of research estimates a 50-60% rebound effect associated to a 12 and 15%
increase in energy efficiency (in energy and non-energy sectors respectively).
3 Barker et al., 2009, The Macroeconomic Rebound Effect and the
World Economy Global
This paper models the total rebound effect arising from the IEA WEO 2006 energy-efficiency policies for final energy users. It finds that the
total rebound effect over the period 2013-2030 is around 50% by 2030, averaged across the whole economy.
4 Maxwell et al., 2011,
Addressing the Rebound Effect
Global
This report presents a comprehensive literature
review of previous assessments of the rebound effect. The following case studies are discussed:
a) household cars and heating/cooling; b) household cars, heating, lighting, production; c) energy efficiency policies and programmes; d) household appliances; e) lighting; f) road freight private transport; g) French eco pastille scheme and vehicles; h) mobile data traffic; and i) paperless office and ICT. The report presents
many different estimates of the scale of the rebound effect. For example, a range of 20% to 30% is estimated in the case of Austrian space heating.
5 Chitnis et al., 2012, Estimating Direct and
Indirect Rebound UK
This study estimates the rebound effect related to several measures that have been implemented
to improve energy efficiency in dwellings. It
suggests that the rebound effects from measures under consideration are in the range of 5% to

June 2017 139
Effects for UK Households
15% and that they are dominated by the indirect effects. The methodology that this study employs
is based on estimates of income elasticity and greenhouse gas intensity.
6 Nadel, 2012, The Rebound Effect US
This research suggests that direct rebound effects are around 10% or less; while indirect rebound effects seem to be around 11%.
7 Guerra Santin, 2012, Occupant Behaviour in
Energy Efficient Dwellings: Evidence of a Rebound Effect
Netherlands
This paper confirms the existence of a rebound effect that relates to energy consumption for
heating. The finding is supported by an analysis of different behavioural patterns among the occupants of dwellings that present various
degrees of efficiency.
8 Aydin et al., 2014, Energy Efficiency and Household Behaviour:
The Rebound Effect in the Residential Sector
Netherlands
Based on a sample of 560,000 households, this paper reports the existence of a rebound effect in the case of the 26.7% of homeowners and the
41.3% of tenants that were considered for the survey.
9 Gillingham et al., 2014, The Rebound Effect and Energy Efficiency Policy
US The literature review conducted for this paper suggests that the total microeconomic rebound effect is in the range of 20% to 40%.
10 Wang et al., 2016, Measurement of energy rebound effect
in households: evidence from residential electricity consumption in Beijing,
China
China
The authors estimate long and short-run direct and indirect energy rebound effects for the household sector in Beijing. Their findings
support the hypothesis of a higher direct rebound effect in the long-run (40%) compared to an indirect one (15%). As there is no backfire effect, energy efficiency policies prove to be effective in
reducing energy demand in Beijing.
11 Stapleton et al., 2016, Estimating direct rebound effects for personal automotive travel in Great Britain
UK
The study considers the period from 1970 to 2011 and corroborates previous US based studies estimating an average 19% direct rebound effect for use of private cars. As such, approximately a fifth of potential fuel savings from improved car efficiency is lost through
increased travelling.
12 Llorca and Jamasb, 2016, Energy efficiency
and rebound effect in European road freight transport
EU
The authors rely on data over 20 years for 15 European Member States to study the rebound
effect in the road freight transport sector. Results show the existence of a tiny 18% rebound effect on average. This effect however is higher in
countries where energy efficiency improvements and quality of logistics are more pronounced.
13 Freire-González, 2017, Evidence of direct and indirect rebound effect in households in EU-27 countries
EU
The study uses price elasticities and input-output
tables to estimate household rebound effects in each EU Member State. It finds high rebound effects for some countries, greater than 100%.
14 Du et al., 2017, The energy rebound effect for the construction industry: empirical
evidence from China
China
This paper estimates a 59.5% rebound effect for the Chinese construction industry between 1990 and 2014. The effect is declining over time, and the authors conclude that approximately half of
the potential energy saving by technical change is achieved.

June 2017 140
15 Zhang and Peng, 2017, Exploring the direct
rebound effect of residential electricity consumption: an empirical study in China
China
This study estimates a 72% direct rebound effect for the Chinese residential electricity
consumption sector. Additionally, differences arise when considering different income groups (68% for low income and 55% for high income groups) and climate regimes (68% for light rainfall and 86% for heavy rainfall regimes).
Source(s): Cambridge Econometrics’ elaboration based on the referenced reports.
Investment
In the short run, energy efficiency programmes could boost investment since new
equipment is needed for most energy saving measures. In the long run, energy
efficiency improvements could create further investment stimulus since lower energy
bills could free additional financial resources for investment purposes. These effects will
be reinforced by additional investments that business will need in order to meet the
higher demand that results from lower energy bills, and also from the additional income
that is spent by those who are employed in energy-efficiency related activities for
buildings and other sectors.
There may also be negative investment effects in the energy sector itself. For example,
if the demand for electricity falls by enough, eventually plans to invest in new power
generation or replacement capacity will be delayed or cancelled. Energy efficiency has
the potential to reduce peak demand and the required level of investment in electricity
generation, transmission and distribution systems to satisfy it. However, over the longer
term we can expect the overall impact of energy efficiency on the level of investments
in the energy sector to be neutral (Couder, 2015).
The recent study for DG ENER (Cambridge Econometrics et al., 2015) modelled the
impact of energy efficiency measures in the EU. The results from the E3ME model
reached the following conclusions regarding investment:
▪ In the period 2020-2025 the measures would lead to a small increase in investment,
following a small increase in GDP.
▪ From 2026 onwards investment and output would both grow substantially due to
more ambitious energy efficiency measures.
▪ The increases in GDP from energy efficiency are mainly driven by the additional
investment in energy efficiency.
Figure 0.3 provides an example of some estimates of the direct investment costs
required to achieve a given level of energy savings (taken from a CO2 cost curve). The
focus is on buildings and the figures shows the key importance of residential dwellings
in energy efficiency and reducing greenhouse gas emissions more generally.

June 2017 141
International trade
There are two dimensions in which energy efficiency programmes hold the potential to
affect current account imbalances: (a) equipment trade; and (b) fuels / energy trade.
Specifically, countries that produce and export the equipment which is needed for the
transformation of current infrastructure and buildings into more efficient ones will see
an improvement in their trade balances. Moreover, energy efficiency improvements will
produce a decline in the amount of fuel / energy which is required and imported.
The issue of energy security is clearly linked to international trade. Energy efficiency
has the effect of lowering energy demand, energy prices and investments in new or
replacement capacity (Couder, 2015). A reduced level of energy demand has the
consequence of reducing foreign energy dependency thanks to the declined amount of
fuel / energy which is required and imported, therefore hampering the exacerbation of
trade deficits. Fossil fuel imports particularly affect trade balances to the point that, in
2013, trade deficits in European Member States like Austria, Finland and Spain were
entirely due to energy (JRC, 2015).
Another element that will reinforce this ‘circuit’ is the subsequent effect of changes in
energy demand on prices (see below).
Prices and inflation
Energy efficiency improvements will affect energy demand and may induce a transition
to other fuels. This could eventually alter fuel and energy prices, and feed the energy
demand-price loop61. If these effects are strong enough to have a reflection in the global
picture, lower energy demand will lead to a decline in energy prices. As a ballpark
estimate of the magnitude of these effects, the increase in oil prices that lasted for about
three years and peaked in 2012 could have cost €300 bn to the EU (IEA, 2014).
61 See, also, IMF (2014) for further discussion and examples of the effects of a decline in oil prices. However, when considering energy efficiency outside the transport sector it is gas prices that are more likely to be affected.
Figure 0.3: Potential increases in investments related to energy efficiency

June 2017 142
Energy efficiency policies also have the potential to affect highly energy prices at the
regional and country level. Wiser et al. (2005) reviewed the bulk of literature focusing
on energy efficiency improvements in the US and their impact on natural gas prices.
While variations in the magnitude of gas price reductions are significant, all previous
studies concluded that energy efficiency measures, together with renewables
deployment, put downward pressure on natural gas demand and prices. On average, a
1% reduction in national gas demand corresponded to a 0.8% to 2% decrease in
wellhead gas prices (Wiser et al., 2005). More recently, Carnall et al (2011) estimated
a total amount of almost $50 billion benefits over 20 years in terms of lower energy bills
to electricity and gas consumers after the introduction of a water heater standard. These
savings primarily affect consumers who purchase the more efficient appliance, but all
natural gas consumers benefit from reduced gas prices.
Additionally, low domestic energy prices could contribute to improved competitiveness
by reducing production costs62 if they are not matched in other countries. Such a result
is perhaps most likely for electricity.
2.6 Employment
A key indicator with which to evaluate the impact of energy efficiency measures on wider
society is employment. As acknowledged in the existing literature, energy efficiency
improvements hold the potential to create more jobs than new energy generation
investments (see, also, Friends of the Earth Cymru, 1996). Previous research suggests
that the vast majority of job creation that results from energy efficiency takes place in
labour-intensive industries such as construction (see, also, Deutsche Bank Group, 2011;
The Energy Efficiency Industrial Forum, 2012).
Some empirical evidence
Table 0-8 summarises some of the findings of previous research on the impact of energy
efficiency improvements on employment.
Table 0-8 Previous research on the impact of energy efficiency on employment
Reference Scope Main findings
1 Association for the Conservation of Energy, 2000, Energy Efficiency and Jobs: UK Issues and Case Studies
UK This study assesses the effects related to seven energy efficiency investment programmes that were
implemented in the UK. In terms of job creation, the study suggests that the direct employment created per £1m invested is in the range of 10-58 (person-years during
programme). Indirect employment created over 15 years per £1m invested is found to be above 60 person-years.
2 Scott et al., 2008, The impact of DOE building technology energy efficiency programs on U.S.
US The fiscal Year 2005 Building Technologies programme could create 446,000 jobs by 2030
62 See, also, European Commission (2014b) for a comparison of energy costs across Europe and a discussion of its implications in terms of competitiveness and international trade.

June 2017 143
employment, income, and investment
and increase wage income by $7.8 bn.
3 Ürge-Vorsatz et al., 2010, Employment Impacts of a Large-Scale Deep Building Energy Retrofit Programme in Hungary
Hungary 17 jobs (person-years) are expected to be created per million euro invested in energy efficiency.
4 Wei et al., 2010, Putting Renewables and Energy Efficiency To Work: How Many Jobs Can
The Clean Energy Industry Generate in the U.S.?
US Ambitious energy efficiency programmes combined with a 30% renewable portfolio
standards target in 2030 could generate over 4m full-time-equivalent job-years by 2030.
5 Power and Zalauf, 2011, Cutting Carbon Costs: Learning from Germany’s Energy Saving Program
Germany 900,000 jobs have been created in retrofitting dwellings and public buildings since 2006.
6 Lutz et al., 2012, Economic Impacts of Energy Efficiency and Renewable Energy in Germany
Germany 127,000 additional jobs could be created in 2030 by implementing further energy efficiency measures, i.e. €301bn of additional investment by 2030.
7 Cambridge Econometrics and Verco, 2012, Jobs, Growth and Warmer Homes. Evaluating the
Economic Stimulus of Investing in Energy Efficiency Measures in Fuel Poor Homes
UK This study reports that investing £2.6 bn in energy efficiency could create 71,000
jobs by 2015 in the UK.
8 Acadia Center, 2014, Energy
Efficiency: Engine of Economic Growth in Canada
Canada This study estimates a total net
increase in employment of 1.5 to 4.0 million job-years. In other words, $1m invested in energy efficiency measures generates 30 to 52 job-years.
9 Navius Research, 2014, Macro-economic Effects of Energy
Efficiency Improvements
Canada The study reports that energy efficiency improvements
increased employment by 2.5% from 2002 to 2012.
10 Oliveira et al., 2014, A prospective analysis of the employment impacts of energy efficiency retrofit in the
Portuguese building stock by 2020
Portugal The authors focus on direct, indirect and induced jobs created until 2020 due to the introduction of four retrofit
measures in the Portuguese building sector. Results show that the number of jobs created is greater than the number of jobs lost due to the reduction in energy demand.
11 UK Energy Research Centre,
2014, Low carbon jobs: the evidence for net job creation from policy support for energy efficiency and renewable energy
Numerous
countries
The study reviews existing
literature on green jobs creation. Energy efficiency is found to be more labour-intensive (in terms of electricity
produced) than fossil fuel power plants, but the number of jobs created highly depends

June 2017 144
on the macroeconomic conditions of the considered
country. 0.3-1 jobs/annual GWh saved are created in the energy efficiency sector.
12 Cantore et al., 2017, Promoting renewable energy and energy efficiency in Africa: a framework to evaluate employment
generation and cost effectiveness
Africa The analysis shows that fostering low carbon generation and energy efficiency will lead to additional jobs. In addition,
increasing the uptake of energy efficiency measures tend to reduce the costs associated to
every additional job created.
13 Garrett-Peltier, 2017, Green versus brown: comparing the employment impacts of energy
efficiency, renewable energy, and fossil fuels using an input-output model
US $1 million spending in industrial energy efficiency creates 7.41 full-time equivalent jobs (3.98
direct and 3.43 indirect), which is higher than the 2.65 jobs created with the same investment in the fossil fuel sector.
Source(s): Cambridge Econometrics’ elaboration based on the referenced reports.
Unemployment and employment
As acknowledged in the existing literature, it is important to evaluate the existence of
idle capacity in the labour market, i.e. the population who potentially could be activated
and participate in the economy if needed. An assessment of the employment created at
sectoral level could also improve our understanding of a possible crowding-out effect
which happens in the labour market. In this context, an important issue to bear in mind
is the existence of skills shortages which might prevent energy efficiency programmes
from achieving their full potential. A way forward to account for this issue would be to
undertake an additional analysis of skills forecasts in sectors such as construction,
electricity or engineering (see, Cambridge Econometrics, GHK and Warwick Institute for
Employment Research (2011) and IEA (2014) for further discussion).
Wage rates
The evolution of wage rates could give us a first indication of the quality of the jobs
which are created. A preliminary expectation is that investing in energy efficiency will
create both low- and high-paid jobs depending on the qualifications and availability of
skilled workers required. Changes in wages will also allow us to see whether an income
redistribution process is taking place in the economy as result of the energy efficiency
programmes implemented.
2.7 Comparison with previous results from E3ME
Table 0-9 presents results for GDP and Employment for 2030 from the 2015 Assessing
the Employment and Social Effects of Energy Efficiency report63 alongside the results
from earlier sections of this report. The table shows results for the 30% efficiency target
(EUCO30 scenario here, EE30 in the 2015 report) compared to the reference case
(rather than to the EUCO27 scenario as elsewhere in this report). In both cases the
variant with no crowding out is shown.
63 See http://ec.europa.eu/energy/sites/ener/files/documents/CE_EE_Jobs_main%2018Nov2015.pdf
June 2017 145
The E3ME model was used in both projects, but produces slightly different results. This
section explains the reasons for the differences.
At EU level, there is very little difference between the findings of the two studies but
there are some larger differences at Member State level. Since the 2015 report there
have been some updates to both E3ME and the reference scenario. E3ME has
incorporated more recent data, which have provided longer time series with which to
re-estimate the model’s equations. This means that some of the model’s parameters
have changed, although in most cases the differences are not very big. The largest
difference in the model’s data and parameters relate to Croatia, reflecting revisions and
improvements to the data published by Eurostat.
One important change to model specification is how trade is modelled in E3ME. The
current version of E3ME includes a more advanced representation of bilateral trade (i.e.
point-to-point between two countries) that is more sensitive to changes in prices and
technology than the previous specification. This revision explains some of the
differences in results, particularly in Member States with high trade ratios.
The other important difference to the 2015 study is the assumption about how the
investment was financed. The 2015 study was based on public financing, similar to the
sensitivity discussed in the previous section, but with changes to income tax rates rather
than VAT rates. As noted in Section 2.4, the self-financing approach can lead to slightly
worse results when households must fund the efficiency measures (as purchases of
other products are immediately displaced). This explains the lower GDP results for
Romania and other countries with a strong focus on buildings in the scenario.
The pattern of variation in the employment results is quite similar to that for GDP, with
little change at EU level, but some differences at Member State level. There is a strong
correlation between the changes in GDP results and the changes in employment results
between the two studies.
The most noticeable difference is that in the 2015 study there were some countries that
had negative impacts on employment but this is not the case in the 2016 results. The
largest difference is in Lithuania, where a better result for GDP (driven by trade), is
matched by an improvement in the demand for labour. The employment results for
Finland become positive, despite no change to GDP, because of changes in the patterns
of sectoral employment which relate to the differences in the financing mechanism for
the energy efficiency.
Some of the other more minor changes to employment results relate to updated
projections of employment and unemployment that have been integrated to E3ME,
reflecting more recent data in Europe. As discussed in Section 2.3, the rate of
unemployment in the reference case can have an impact on employment results as it
determines the number of people that are available to fill new jobs and the responses
in wage rates through the econometric equations.

June 2017 146
Table 0-9: Comparison of results with 2015 study (30% efficiency scenario compared to reference case, no crowding out)
GDP 2015
GDP 2016
Employment 2015
Employment 2016
Austria 0.9 1.0 0.0 0.3
Belgium 2.2 1.2 0.5 0.4
Bulgaria 3.0 1.2 0.4 0.0
The Czech Republic 2.8 2.3 0.6 0.8
Cyprus 0.3 0.8 0.4 0.3
Germany 1.1 1.3 0.1 0.3
Denmark 2.0 0.4 0.7 0.3
Estonia 2.4 1.3 0.5 0.5
Spain 0.4 0.8 0.3 0.5
Finland 1.1 1.1 -0.2 0.6
France 1.0 1.4 0.2 0.5
Greece 1.5 1.2 0.9 0.8
Croatia 4.6 0.4 0.9 0.3
Hungary 1.5 1.7 0.3 0.6
Ireland 0.9 0.8 0.4 0.3
Italy 2.2 1.0 1.1 0.2
Lithuania 0.5 1.2 -0.5 0.6
Latvia 2.5 1.9 0.4 0.5
Luxembourg 0.7 1.0 0.4 0.1
Malta 0.2 1.9 0.1 0.6
The Netherlands 2.0 0.8 0.4 0.2
Poland 2.0 0.5 0.3 0.3
Portugal 1.0 1.3 0.3 0.8
Romania 2.2 0.9 0.6 0.1
Sweden 1.1 0.8 0.1 0.3
Slovenia 1.6 0.9 0.4 0.4
Slovakia 1.0 1.3 0.2 0.3
The UK 0.7 0.8 0.0 0.4
EU28 1.1 1.1 0.3 0.4

June 2017 147
3 Health
3.1 Literature review and data sources
The literature review focuses on existing literature on the health impact of air pollution,
monitored through physical and monetary indicators. The main sources that were
reviewed in detail are synthesised in Table 0-10. The table also gives a brief summary
of the type of information provided by each source and its key findings.
Table 0-10 Data sources for health impacts of air quality
Source Geography Main findings
1 Grey et al., 2017, The short-
term health and psychosocial
impacts of domestic energy
efficiency investments in low-
income areas: a controlled
before and after study
UK The study focuses on the associations between
housing warmth improvements, health and
psychosocial factors. Energy efficiency improvements
are found to increasing subjective wellbeing, financial
conditions, thermal satisfaction and reducing social
isolation. However, energy efficiency measures do not
lead to better physical or mental conditions in the short
term. According to the authors, improved health
outcomes may materialise in the longer term.
2 Ahrentzen et al., 2016,
Thermal and health
outcomes of energy
efficiency retrofits of homes
of older adults
US This study provides evidence on energy retrofits
improving reported health conditions (in terms of
emotional distress and sleep) of old low-income
populations living in affordable housing, especially due
to a more stabilised thermal environment.
3 Hamilton et al., 2015, Health
effects of home energy
efficiency interventions in
England: a modelling study
UK Through a scenario analysis, the authors show how
properly implemented energy efficiency measures have
the potential to improve health by reducing exposure to
cold and outdoor air pollutants as well as stabilising
indoor thermal conditions. It is, however, crucial to
have some ventilation to guarantee a minimum level of
indoor air quality.
4 Shrubsole et al., 2015, A tale
of two cities: comparison of
impacts on CO2 emissions,
the indoor environment and
health of home energy
efficiency strategies in
London and Milton Keynes
UK Depending on the uptake level of energy efficiency
measures, households living in the cities of London and
Milton Keynes could benefit from important health
improvements over the period 2011-2050. Specifically,
the authors estimate a 3 and 4 months increase in life
expectancy at birth in Milton Keynes and London,
respectively. However, health improvements highly
depend on the inclusion of purpose-provided ventilation
(PPV) among implemented efficiency measures.

June 2017 148
5 WHO (2016), Health risk
assessment of air pollution -
general principles
Global An air pollution health risk assessment (AP-HRA)
estimates the health impact to be expected from
measures that affect air quality, in different
socioeconomic, environmental, and policy
circumstances.
This document introduces the concept of AP-HRA,
describes in broad terms how the health risks of
outdoor air pollution and its sources are estimated, and
gives an overview of the general principles for the
proper conduct of an AP-HRA for various scenarios.
6 French Senate (2015),
French Senate Committee
Report on the economic and
financial cost of air pollution,
Paris
Europe,
France
This report evaluates the effects of air pollution in
France. It estimates that it costs France some €100 bn
each year, citing impact to health as the major expense
(between €68 bn and €97 bn euros).
7 WHO Regional Office for
Europe (2015), Economic
cost of the health impact of
air pollution in Europe, WHO
Regional Office for Europe
Publications, 2015
Europe Current estimates of the joint effects of ambient and
household air pollution include an estimated 7 million
premature deaths globally each year, representing one
in eight of the total deaths worldwide.
In the WHO European Region as a whole, the
estimated mortality in 2010 was approximately 600,000
premature deaths, which represents a marked
decrease from 2005 for the region overall.
The annual economic cost of premature deaths from air
pollution across the countries of the WHO European
Region stood at US$1.431 trillion.
The overall annual economic cost of health impacts
and mortality from air pollution, including estimates for
morbidity costs, stood at US$1.575 trillion.
Information for model: Number of premature deaths /
8 Walton H., et al. (2015),
Understanding the Health
Impacts of Air Pollution in
London. A report for
Transport for London and the
Greater London Authority
Europe, UK The report estimates that in London in 2010 the
number of deaths attributable to long-term exposure to
NO2 is 5,879.
This is in comparison to the estimate that, in 2010, the
number of deaths attributable to long-term exposure to
man-made particulate matter (PM2.5) was 3,500.
The total cost in London of these health impacts
ranged from £1.4 billion to £3.7 billion.
Short-term exposure to NO2 was associated with about
420 hospital admissions for respiratory disorders in
2010 in London.
The equivalent figure for PM2.5 is estimated to be 1990
admissions.

June 2017 149
9 WHO (2014), Ambient
(outdoor) air pollution and
health factsheet, WHO
Media Centre, Factsheet
N°313, March 2014
Global This factsheet on outdoor air quality and health
summarises the main findings of the WHO relative to
outdoor air quality and health effects. It presents some
key facts and background elements and then focuses
on key air pollutants (PM, O3, NO2, SO2) and the
existing detailed health assessments of these
pollutants.
"WHO Air Quality Guidelines" estimate that reducing
annual average particulate matter (PM10)
concentrations from levels of 70 μg/m3, common in
many developing cities, to the WHO guideline level of
20 μg/m3, could reduce air pollution-related deaths by
around 15%.
Several European studies have reported that the daily
mortality rises by 0.3% and for heart diseases by 0.4%,
per 10 µg/m3 increase in ozone exposure.
10 European Environment
Agency (2014), Air quality in
Europe
Europe 28 This report provides a mortality estimation per
exposure and per region in the EU.
11 OECD. (2014), The Cost of
Air Pollution: Health Impacts
of Road Transport, OECD
Publishing, Paris
OECD
countries
This study reports on the economic cost of the health
impacts of air pollution from road transport – on a
global scale but with special reference to China, India
and the OECD countries.
The cost of outdoor air pollution in OECD countries,
both deaths and illness, was about USD 1.7 trillion in
2010. Available evidence suggests that road transport
accounts for about 50% of this cost, or close to USD 1
trillion.
Methodology used: standard method for calculating the
cost of mortality - the Value of Statistical Life (VSL) as
derived from individuals' valuation of their willingness to
pay to reduce the risk of dying (VSL EU = 3.6 million
dollars (USD in 2005))
Indicative estimates suggest that morbidity would add
10% to the mortality cost figures
12 WHO (2012), Burden of
disease from Ambient Air
Pollution for 2012, World
Health Organization
Global In new estimates released, WHO reports that in 2012
around 7 million people died - one in eight of total
global deaths – because of air pollution exposure.
Globally, 3.7 million deaths were attributable to ambient
air pollution (AAP) in 2012. Europe accounts for
280,000 of these deaths.
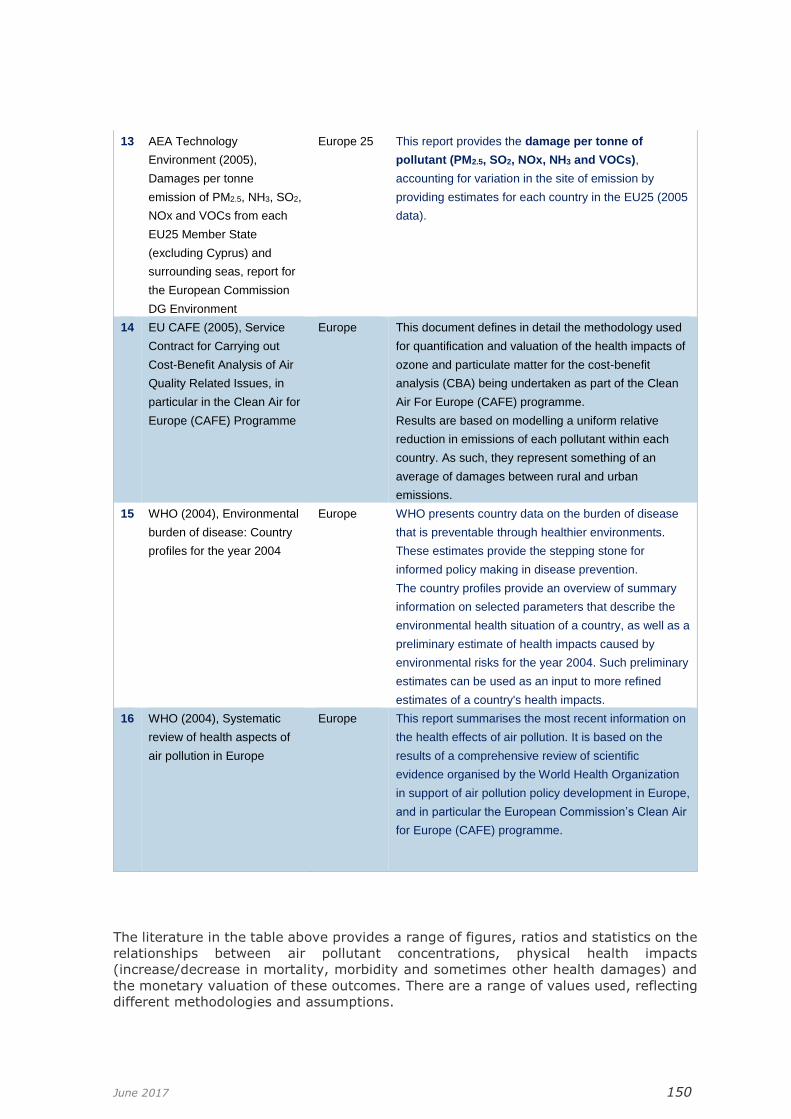
June 2017 150
13 AEA Technology
Environment (2005),
Damages per tonne
emission of PM2.5, NH3, SO2,
NOx and VOCs from each
EU25 Member State
(excluding Cyprus) and
surrounding seas, report for
the European Commission
DG Environment
Europe 25 This report provides the damage per tonne of
pollutant (PM2.5, SO2, NOx, NH3 and VOCs),
accounting for variation in the site of emission by
providing estimates for each country in the EU25 (2005
data).
14 EU CAFE (2005), Service
Contract for Carrying out
Cost-Benefit Analysis of Air
Quality Related Issues, in
particular in the Clean Air for
Europe (CAFE) Programme
Europe This document defines in detail the methodology used
for quantification and valuation of the health impacts of
ozone and particulate matter for the cost-benefit
analysis (CBA) being undertaken as part of the Clean
Air For Europe (CAFE) programme.
Results are based on modelling a uniform relative
reduction in emissions of each pollutant within each
country. As such, they represent something of an
average of damages between rural and urban
emissions.
15 WHO (2004), Environmental
burden of disease: Country
profiles for the year 2004
Europe WHO presents country data on the burden of disease
that is preventable through healthier environments.
These estimates provide the stepping stone for
informed policy making in disease prevention.
The country profiles provide an overview of summary
information on selected parameters that describe the
environmental health situation of a country, as well as a
preliminary estimate of health impacts caused by
environmental risks for the year 2004. Such preliminary
estimates can be used as an input to more refined
estimates of a country's health impacts.
16 WHO (2004), Systematic
review of health aspects of
air pollution in Europe
Europe This report summarises the most recent information on
the health effects of air pollution. It is based on the
results of a comprehensive review of scientific
evidence organised by the World Health Organization
in support of air pollution policy development in Europe,
and in particular the European Commission’s Clean Air
for Europe (CAFE) programme.
The literature in the table above provides a range of figures, ratios and statistics on the
relationships between air pollutant concentrations, physical health impacts
(increase/decrease in mortality, morbidity and sometimes other health damages) and
the monetary valuation of these outcomes. There are a range of values used, reflecting
different methodologies and assumptions.

June 2017 151
One important difference between the studies is that, while some studies have a global
approach on air pollution (both indoor and outdoor air pollution), others solely focus on
outdoor air pollution.
3.2 Output indicators
The main output indicators for health relative to indoor and outdoor pollution are the
mortality and morbidity costs due to indoor and outdoor pollution in the European Union.
Some studies have monetised the annual economic cost of health impacts and mortality
from air pollution in France (source 6 for indoor and outdoor air pollution), the European
Union (source 7 for indoor and outdoor air pollution) or the OECD countries (source 11,
outdoor air pollution only). Methods employed to measure this output indicator are
generally based on the mean value of life, obtained through contingent valuation studies
or willingness to pay surveys. Data from these studies could allow defining a baseline
for current costs of mortality and morbidity due to indoor and outdoor air pollution.
The main output indicators for health relative to outdoor pollution are:
• Opportunity cost of mortality and morbidity. This measures the opportunity cost
of mortality and morbidity due to outdoor air pollution. There are different ways
how to estimate it. One study (source 13) measures the marginal cost of damage
caused per tonne of pollutant (PM2.5, SO2, NOx, NH3 and VOCs) for human health
and for crops for each EU country in 2005. By plugging in the estimated decrease
in tons of pollutants for each EU country in the different energy efficiency
scenarios, one can estimate the savings in health costs for each scenario (by
isolating the crop aspect, which is out of the scope of this study). Another study
(source 10) calculates the number of mortality and morbidity cases due to ozone
and particulate matter in each EU28 country in 2010. This could serve as an
illustration to show the specific impact of these air pollutants on mortality and
morbidity.
• Healthcare cost. This describes the variation in public finance due to outdoor air
pollution. One study calculated the impact on social security spending in France
(source 6). From this figure, we can consider extrapolating the results to
calculate the cost at the level of the European Union.
4 Environmental impacts
4.1 Key issues and scope of the work
The environmental impacts of energy efficiency can be grouped into several categories:
▪ reductions in greenhouse gas emissions
▪ reductions in emissions of local air pollutants (e.g. SO2, NOx)
▪ other benefits of reduced energy consumption (mainly impacts on land and water)
▪ impacts on material consumption
4.2 Links to the EPBD report
It should be noted that the environmental impacts from improvements in energy
efficiency depend quite strongly on which energy carrier sees reduced consumption. For
example, if the energy savings are taken from coal consumption then there could be a
substantial reduction in greenhouse gas emissions; however, if the savings come from
electricity generated from renewables then there would be no overall impact on
emissions.

June 2017 152
It should also be noted that, aside from the choice of energy carrier, it does not matter
which sector makes the energy savings. For example, the effects of reducing electricity
consumption by 1% are the same, whether the savings are made by industry or in
buildings. This means that many of the findings from the literature review from the
EPBD report are also relevant here.
Each of the four categories listed above is discussed in the sections below.
4.3 Energy consumption and greenhouse gas emissions
The available literature very much focuses on the relationship between energy efficiency
and greenhouse gas emissions (see previous section for impacts on local air pollutants).
The US EPA (2009) report categorises the set of studies on energy efficiency which are
reviewed according to the following typology:
▪ Potential studies – these provide estimates of the overall cost-effective energy
saving potential.
▪ Energy resource plans – these assess the resource contribution from energy
efficiency for a specific geographic area or energy system.
▪ Programme portfolio evaluations and programme filings – these consist of detailed
plans of energy that can be saved through improvements to energy efficiency and
the associated costs and benefits.
▪ CO2 reduction potential studies – these focus on the potential impacts that energy
efficiency could have on reducing CO2 emissions.
Besides calculating the avoided tons of CO2 emitted into the atmosphere, some studies
have tried to produce a monetary value representing the avoided future costs of climate
change. However, there is still no agreement on how to properly estimate the social
cost of carbon (SCC), which highly varies according to modelling assumptions64. Table
0-11 provides an overview over some of the most relevant studies on the topic published
from the early 2000s.
Table 0-11 Overview of studies on the impact of energy efficiency on the environment
Reference Scope Main findings
1 Aunan et al., 2000, Reduced Damage to Health and
Environment from Energy Saving in Hungary
Hungary CO2 emissions savings are estimated to be in the range of $86-$222 million per year.
2 Interlaboratory Working Group, 2000, Scenarios for a Clean Energy Future
US This report estimates carbon emissions levels up to 2020. When a maximum reduction of 565m tCO2 in 2020 is considered, energy efficiency accounts for 65% of total emissions
reductions.
3 EPRI, 2007, The Power to Reduce CO2 Emissions: The Full Portfolio
US This report suggests that energy efficiency measures, combined with low-carbon supply technologies, could contribute substantially to a 45% reduction in power-sector CO2 emissions from 2007 levels in the US.
64 For further information on the current debate, see: https://www.carbonbrief.org/qa-social-cost-carbon.
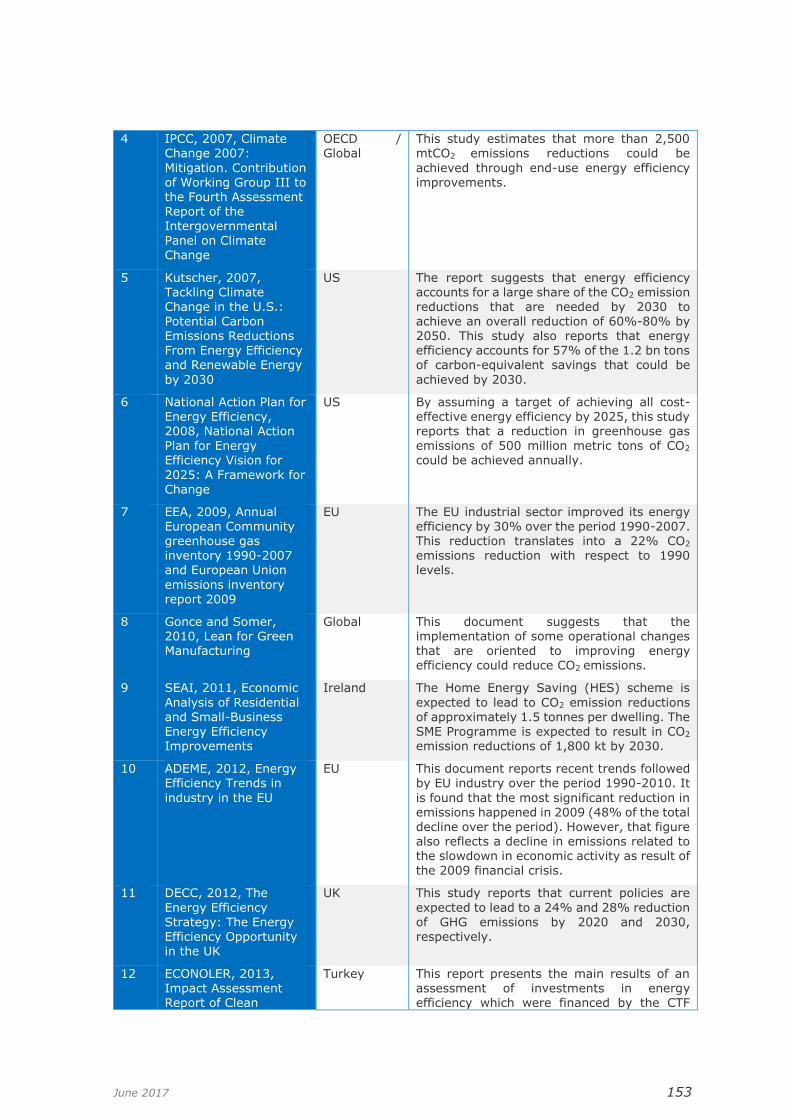
June 2017 153
4 IPCC, 2007, Climate Change 2007:
Mitigation. Contribution of Working Group III to the Fourth Assessment Report of the Intergovernmental Panel on Climate Change
OECD / Global
This study estimates that more than 2,500 mtCO2 emissions reductions could be
achieved through end-use energy efficiency improvements.
5 Kutscher, 2007, Tackling Climate Change in the U.S.:
Potential Carbon Emissions Reductions From Energy Efficiency and Renewable Energy
by 2030
US The report suggests that energy efficiency accounts for a large share of the CO2 emission reductions that are needed by 2030 to
achieve an overall reduction of 60%-80% by 2050. This study also reports that energy efficiency accounts for 57% of the 1.2 bn tons of carbon-equivalent savings that could be
achieved by 2030.
6 National Action Plan for Energy Efficiency, 2008, National Action Plan for Energy Efficiency Vision for
2025: A Framework for Change
US By assuming a target of achieving all cost-effective energy efficiency by 2025, this study reports that a reduction in greenhouse gas emissions of 500 million metric tons of CO2 could be achieved annually.
7 EEA, 2009, Annual European Community
greenhouse gas inventory 1990-2007 and European Union
emissions inventory report 2009
EU The EU industrial sector improved its energy efficiency by 30% over the period 1990-2007.
This reduction translates into a 22% CO2 emissions reduction with respect to 1990 levels.
8 Gonce and Somer, 2010, Lean for Green Manufacturing
Global This document suggests that the implementation of some operational changes that are oriented to improving energy efficiency could reduce CO2 emissions.
9 SEAI, 2011, Economic
Analysis of Residential and Small-Business Energy Efficiency Improvements
Ireland The Home Energy Saving (HES) scheme is
expected to lead to CO2 emission reductions of approximately 1.5 tonnes per dwelling. The SME Programme is expected to result in CO2
emission reductions of 1,800 kt by 2030.
10 ADEME, 2012, Energy Efficiency Trends in
industry in the EU
EU This document reports recent trends followed by EU industry over the period 1990-2010. It
is found that the most significant reduction in emissions happened in 2009 (48% of the total decline over the period). However, that figure also reflects a decline in emissions related to the slowdown in economic activity as result of the 2009 financial crisis.
11 DECC, 2012, The
Energy Efficiency Strategy: The Energy Efficiency Opportunity in the UK
UK This study reports that current policies are
expected to lead to a 24% and 28% reduction of GHG emissions by 2020 and 2030, respectively.
12 ECONOLER, 2013, Impact Assessment Report of Clean
Turkey This report presents the main results of an assessment of investments in energy efficiency which were financed by the CTF

June 2017 154
Technology Fund in Renewable Energy and
Energy Efficiency Market in Turkey
funds. In particular, it is estimated that more than 43 million tCO2eq will be saved by the
end of the lifespan of the projects which have been funded by the scheme.
13 Green Building Council of Australia, 2013, The Value of Green Star - A Decade of Environmental Benefits
Australia This report suggests that the construction of ‘Green Star’ certified buildings could lead to a 45% emission reduction in comparison to the BAU case.
14 Asian Development Bank, 2015, Improving Energy Efficiency and
Reducing Emissions through Intelligent Railway Station Buildings.
China Although this report does not provide any quantification of the emission savings, it presents a detailed description of the
potential of improving energy efficiency and reducing emissions by developing ‘intelligent railway station buildings’.
Source(s): Cambridge Econometrics’ elaboration based on EPA (2009) and other
reports.
Besides the listed studies, in the last few years there has been a noticeable growing
interest in examining the impact of energy efficiency policies in China and other major
carbon emitters, both at the sectoral and country level. Zhang et al. (2014) compared
the benefits of implementing an energy efficiency strategy in the Chinese iron and steel
sector to the application of command and control regulations. Besides achieving a
relevant reduction in pollution control costs, the authors concluded that energy
efficiency can potentially avoid the emission of 463 MtCO2eq in 2030. Similarly, the
cement sector can achieve savings of approximately 252 MtCO2eq in 2030 if energy
efficiency measures are introduced (Zhang et al., 2015). Although complementary to
other low-carbon policies, energy efficiency measures represent the most cost-effective
solution to achieve carbon emission targets in countries with a high potential for
efficiency improvements. Vera and Sauma (2015) compared the effects of introducing
a $5/TonCO2 carbon tax with the introduction of some insulation measures in the Chilean
power sector to achieve a 2% reduction in residential electricity demand. Their analysis
provided evidence in favour of a greater reduction in emissions due to energy efficiency
compared to the carbon tax. Improving insulation in the power sector had also the
benefit of reducing energy prices.
The uptake of energy efficiency measures can help to achieve relevant emission cuts
also in the residential sector. Park et al. (2017) studied the impact of introducing more
efficient technologies (heating and cooling devices) in the Republic of Korea and 31
Chinese provinces. Through a scenario analysis, the authors estimated the avoided
carbon emissions by region assuming different penetration rates of more efficient
technologies. Savings estimates highly varied from region to region, but the highest
reductions were achieved in the provinces of Northern China where coal is the main fuel
used for heating and electricity generation. Contrary to Park et al. (2017), Levy et al.
(2015) considered the implementation of insulation measures in the residential and
power sector in the US. Results show that full compliance with the International Energy
Conservation Code 2012 would bring annual reductions of 80 million tons of carbon from
electricity generation units and an average $49 per ton of avoided CO2 of monetised
climate and health benefits.
June 2017 155
4.4 Impact on local air pollutants
The impact on SO2, NOx and particulates can also be determined by macroeconomic
models such as E3ME. These pollutants are released into the atmosphere as a result of
combustion processes (coal and petrol in particular) and non-combustion processes such
as agriculture fertiliser application.
While these pollutants can have impacts on crops and buildings (as discussed in the
series of ExternE studies65), by far the largest impacts are on human health and the
environment. The effects on human health are discussed in more detail in the previous
section.
Given their persistence in the atmosphere and possibility to travel long distances,
polluters like sulphur dioxide and nitrogen oxide have the potential to cause serious
damages to natural ecosystems such as freshwaters, forests and grasslands as well as
buildings of cultural heritage (EEA, 2014). Their deposition is the root cause of acid rain,
which led to loss of fisheries and degradation of forests from the 1970s in countries like
Sweden, Poland and Germany. Besides acidification, nitrogen compounds can alter the
soil nutrient balance and cause increased plant growth and species competition (the so-
called “eutrophication”). Over time, this phenomenon poses a serious threat to
biodiversity conservation (Emmett et al., 2007).
Once the urgency to address these air pollutants was recognised, a set of international
control measures and national emission limits were imposed within the UNECE
Convention on Long-Range Transboundary Air Pollution (CLRTAP) in 1979. As a result,
countries like the UK experienced large decreases in SO2 (-94% from 1970 to 2010)
and NOx (-58% from 1970 to 2010) emissions (CEH, 2012), but the risk of acidification
and eutrophication in certain European areas still persists (EEA, 2017)66.
4.5 The energy sector’s land and water requirements
Even energy savings from electricity that is produced from renewables may produce
environmental benefits. For example, if fewer wind turbines are installed, there could
be benefits for natural landscapes that are left unspoiled.
It is difficult to measure, let alone estimate, impacts on natural landscapes, but it is
possible to use land requirements, in terms of number of square kilometres required
per GW of capacity, or GWh of generation, as a proxy measure. It is important to be
careful in interpreting the results, however, as the land requirements for biomass
consumption are far higher than requirements for any other generation technology –
but there is less impact on local landscapes from biomass.
The method for estimating land requirements is relatively basic. By applying a unit value
of area per GW of capacity (or GWh of generation) it is possible to derive total land
required by the power sector. Several studies have produced estimates of the
coefficients required, including Fthenakis and Kim (2009).
A similar approach can be applied to estimate water requirements. It is noted that there
is quite a lot of uncertainty in the estimates, as there is a large degree of heterogeneity
within each plant type (e.g. some CCGT plants use a lot more water than others).
However, given this uncertainty, it is possible to derive estimates for water
consumption, defined as cubic metres per GWh and summed across all generation.
Macknick et al (2011) provides a set of coefficients that can be used for this purpose,
which are presented in Table 0-12. It should be noted that the figures in the tables are
withdrawals that preclude other use of the water, and hydro generation is assigned a
65 See http://www.externe.info/externe_d7/ 66 For more information, see: https://www.eea.europa.eu/data-and-maps/indicators/exposure-of-ecosystems-to-
acidification-3/assessment-2.

June 2017 156
value of zero; however, as energy efficiency is unlikely to displace hydro power in
Europe this is not important.
Table 0-12: Water withdrawals by generation technology
Water withdrawals m3/MWh
Natural gas 1.16
Hydro 0.00
Nuclear 5.01
Wind 0.00
Biomass 3.99
Geothermal 0.00
Coal 4.57
Solar PV 0.00
Solar CSP 0.00
Source: Macknick et al (2011)
4.6 Impacts on material consumption
The links between energy consumption and material consumption are highly complex
and relatively unexplored. It is not always clear from the literature whether the
relationship should be positive or negative; on the one hand there are clear linkages
between some material extraction/production and energy consumption (e.g. steel and
cement are energy intensive) but capital-intensive energy efficient goods are often quite
material-intensive in nature.
Material Flow Analysis (MFA67) has typically used input-output analysis to understand
existing material demands, but the fixed nature of input-output analysis has prevented
sophisticated scenario analysis. Fischer-Kowalski et al (2011) provides a detailed
overview and history of the approach, plus suggestions for future development. Overall,
the authors concluded that material flow analysis can now be used to deliver meaningful
results thanks to the improved quality level in key input data. MFA data reporting has
now become mandatory in many industrialised countries and, while certain issues
remain unsolved (e.g. limited disaggregation by economic sector), MFA is gaining the
potential to answer a wide variety of research questions.
A relatively small number of macroeconomic models (E3ME, EXIOMOD, GINFORS)
incorporate MFA into their core structure, but including as endogenous many of the
relationships that are fixed in input-output analysis. The level of detail in terms of
material types is typically low in the models as they are limited by the economic sectors
published by Eurostat and other statistical offices, but they are able to provide estimates
of Domestic Material Consumption (DMC), as well as sometimes other indicators such
as TMR and RMC. This aspect of the E3ME and GINFORS models is described in Barker
et al (2007) and an example of the results from E3ME is provided in Ekins et al (2011).
The models have not, however, been used previously to assess the impacts of energy
efficiency on material consumption.
67 Material flow analysis refers to the systematic appraisal of the physical flows and stocks of materials and natural resources within a given system (the economy, different industrial sectors or ecosystems). For more detailed information, see for example: https://www.oecd.org/environment/indicators-modelling-outlooks/MFA-Guide.pdf.

June 2017 157
Our approach in this study is to use the existing structure in E3ME to estimate the
impacts of European energy efficiency programmes on DMC.
5 Social aspects
5.1 Introduction to the literature review
The most important social impacts result from energy efficiency that is implemented in
buildings. The literature review in the EPBD report covers social impacts in quite some
detail. Although the scenarios presented in this report are less focused on buildings than
those in the EPBD report, it is noted that there are still substantial energy savings from
buildings, and therefore the social impacts in terms of fuel poverty are relevant. For this
reason, a brief summary of the relevant literature is reproduced below68. The focus is
on residential buildings, as energy efficiency in non-residential buildings is likely to have
limited direct impact on social welfare69.
5.2 Energy poverty
Energy efficiency improvements in homes can have certain micro-level benefits, most
notably a reduction in the number of households who live in energy poverty. Energy
poverty describes a condition wherein a household is unable to ensure an adequate
thermal regime in its living space (Boardman 1991, 2010). Energy poverty can thus be
understood as a state of deprivation of basic energy services, which is an energy-related
manifestation of general poverty and which has been shown to hold the risk of increased
morbidity (Rudge/Gilchrist 2005; Marmot Review Team 2011) or even mortality (Healy
2003). Accordingly, when examining the benefits of energy efficiency programmes in
regard to energy poverty alleviation, impact assessments should focus on achieved or
projected energy cost savings for vulnerable households or increased indoor comfort
levels within their dwellings.
Rebound effects associated with energy cost reductions at the household level can be
considerable. Any reduction in energy costs, whether as a result of fuel subsidies or
improved energy efficiency, enables households to decide whether to reap energy cost
savings or to “reinvest” them into higher living comfort through increases in
temperature levels (see e.g. Milne/Boardman 2000). Many low-income households that
are lifted out of energy poverty by energy efficiency improvements may choose to
increase their indoor temperature, foregoing any potential reduction in their energy bills.
Ability to increase indoor temperature to more comfortable levels has multiple health
benefits, as living in cold and poorly ventilated homes is linked to a range of health
problems. Retrofits and other energy efficiency improvements that enable energy poor
households to improve indoor temperatures may have positive impacts on mental health
and incidences of cardiorespiratory diseases, and can thus help reduce health
inequalities (UCL Institute of Health Equity 2010 and 2014; International Energy Agency
2014).70
If poverty alleviation and health improvements are the overarching policy targets,
positive measurements/estimates on either of these indicators (reduction in energy
68 For more detailed review of existing literature, see the EPBD report https://ec.europa.eu/energy/sites/ener/files/documents/final_report_v4_final.pdf 69 Indirect impact arising from possible employment effects and productivity gains are discussed in the EPBD report (see link above), Appendix B Section 2 (pp. 73-88) and Section 3 (pp. 88-91) 70 The health benefits of improved indoor temperature and ability to keep adequately warm at home are discussed in detail in the EPBD report (see link above), Appendix B, Section 3 (pp. 88-91).

June 2017 158
costs or increase in living comfort) provide evidence for successful energy poverty
alleviation.
5.3 Direct impacts of improved energy efficiency
The published literature uses a range of different methodologies and indicators to assess
the social impacts of energy efficiency improvements in residential buildings. There is
no strong consensus on the best approach to use, and it may be that the most suitable
assessment approach depends on factors specific to the programmes being evaluated.
Nevertheless, the evidence suggests that there is the potential to substantially alleviate
energy poverty in the EU through improving the energy efficiency in residential
buildings. To be effective, the programmes must target households who live in energy
poverty or low-income households in low-quality housing.
The UK Department of Energy & Climate Change (DECC) estimates of the savings
associated with the different energy efficiency measures vary by year and by household
characteristics, and are adjusted for comfort taking71 (i.e. direct rebound effects).
Results from the latest assessment (DECC, 2014) indicate that low-income households,
which typically spend a greater share of their expenditure on energy, tend to see the
largest reductions in bills as a proportion of total expenditure: the poorest 30% are
expected to benefit from a reduction of between 0.6% and 1.6% of total expenditure,
compared to a reduction of between 0.2% and 0.5% for other deciles.
In an analysis of a clustered, randomised community trial on the effects of building
insulation in New Zealand, Howden-Chapman et al. (2007) found that insulating existing
houses led to a significantly warmer, drier indoor environment and resulted in improved
self-rated health. Insulation was associated with a small increase in bedroom
temperatures during the winter (0.5°C) and decreased relative humidity (-2.3%),
despite energy consumption in insulated houses being 81% of that in uninsulated
houses’ (i.e. a 19% reduction).
Likewise, using data on self-reported thermal comfort as well as indoor temperature
from an extensive survey of some 2,500 dwellings participating in England’s Warm Front
energy efficient refurbishment scheme, Hong et al. (2009) found that Warm Front was
effective in increasing the mean indoor temperature from 17.1°C to 19.0°C, leading to
an increase in the proportion of households feeling thermally ‘comfortable’ or warmer
from 36.4% to 78.7%.
An evaluation of the ARBED programme in Wales, which aimed to reduce energy
consumption among low-income households by improved energy efficiency, provided
similar results (Patterson, 2012). Using engineering estimates for the performance of
implemented measures, Patterson (2012) estimated that the average cost saving for
households was £216/year, reducing energy expenditures by about a quarter.
Furthermore, responding to a household questionnaire, 35% of respondents asserted a
significant increase in the comfort level.
In a different context, results of the SOLANOVA Project, a pilot house-like passive
retrofit of a low-quality prefabricated block in Hungary, provided evidence that the
promotion of very high-efficiency new construction and retrofitting standards has the
potential to eliminate energy poverty. By comparing occupants’ pre- and post-retrofit
energy billing data, Hermelink (2007) finds that the implemented measures reduced the
monthly heating expenses from €96 to €16 per dwelling, demonstrating that heating
can be affordable even for the lowest-income Hungarian households.
71 For any heat consumption reduction measure or renewable heat pump or insulation measure the savings are adjusted by 15% to allow for comfort taking.

June 2017 159
In Ireland, SEAI/Combat Poverty (2009) compared households who participated in the
Irish Warmer Homes Scheme with those who did not participate in the scheme. Although
no statistically significant differences between the groups were found in terms of
achieved fuel cost savings (approximately £85/household), the proportion of
participating households with children who were able to keep a comfortable temperature
at home rose from 27% to 71%. Households in the participating group also showed a
significant decrease of respondents finding it difficult to pay their energy bills on time,
with the share declining from 48% to 28%.
5.4 Indirect impacts of improved energy efficiency
Energy expenditure savings and ability to maintain more comfortable indoor
temperature can have other benefits, which may reinforce the positive effect on
household budgets. For example, the greatest health benefits of energy efficiency
retrofits have been found to accrue among households that, prior to the implementation
of energy efficiency measures, underutilised heating energy services due to budgetary
constraints (cf. Grimes et al., 2011). Improved physical and mental well-being due to
better indoor climate levels may also positively affect educational achievement or work
performance (Thomson et al. 2009), increasing labour market participation and
productivity and enabling the uptake of financially more attractive career paths. In
countries where healthcare costs are high, health improvements due to improved
housing conditions can also increase disposable incomes of vulnerable households due
to decreased medical spending.
In addition to the financial impact contributing to poverty alleviation, energy efficiency
retrofits or moving into new, energy-efficient buildings may hold another potential social
benefit related to improved social integration of underprivileged households by reducing
social isolation caused by feelings of embarrassment regarding one’s living conditions
(Barton et al. 2004; Bashir et al. 2014).
However, when inadequately designed or implemented, improvements in the energy
efficiency of the existing building stock can also have negative effects, in particular if
the costs of energy efficiency improvements are passed on to the tenants who cannot
afford higher housing costs. For example, a recent study issued by the UK Department
of Energy & Climate Change (Fuerst et al. 2013) found that higher ratings on EPCs were
associated with higher property values, indicating the potential for tension between
ecological and social targets in the housing sector.
6 Public budgets
6.1 Background
The approach used to assess impacts on public budgets has not been further developed
from the EPBD study. For reference, the figure that summarises the approach is
reproduced below. The IEA Multiple Benefits report (2014) provides a comprehensive
overview of the potential public budget impacts of energy efficiency. The evidence
review presented in the IEA report informs the discussion of public budget impacts
presented in the EBPD report and in this report.
The discussion on the impacts of energy efficiency on public budgets in the EPBD study
focused on the public budget impacts of energy efficiency in buildings. The approach
used in the EPBD study categorised the sources of the impacts of energy efficiency in
buildings into three groups:
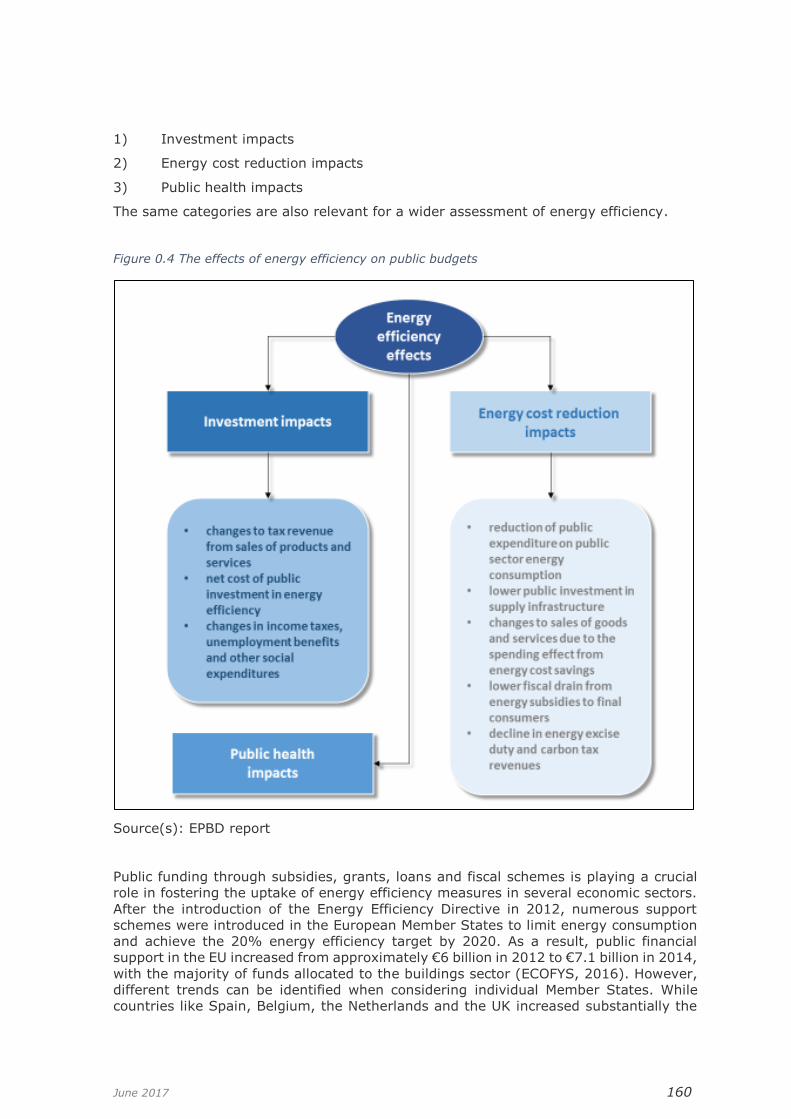
June 2017 160
1) Investment impacts
2) Energy cost reduction impacts
3) Public health impacts
The same categories are also relevant for a wider assessment of energy efficiency.
Figure 0.4 The effects of energy efficiency on public budgets
Source(s): EPBD report
Public funding through subsidies, grants, loans and fiscal schemes is playing a crucial
role in fostering the uptake of energy efficiency measures in several economic sectors.
After the introduction of the Energy Efficiency Directive in 2012, numerous support
schemes were introduced in the European Member States to limit energy consumption
and achieve the 20% energy efficiency target by 2020. As a result, public financial
support in the EU increased from approximately €6 billion in 2012 to €7.1 billion in 2014,
with the majority of funds allocated to the buildings sector (ECOFYS, 2016). However,
different trends can be identified when considering individual Member States. While
countries like Spain, Belgium, the Netherlands and the UK increased substantially the
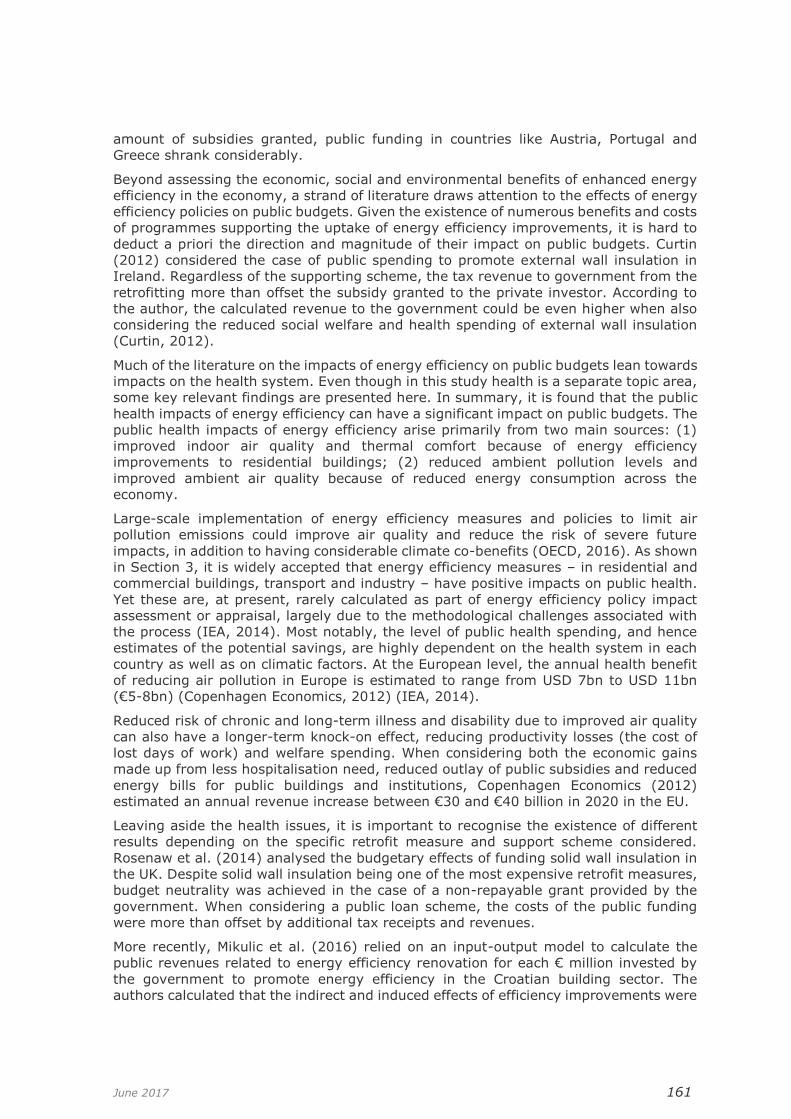
June 2017 161
amount of subsidies granted, public funding in countries like Austria, Portugal and
Greece shrank considerably.
Beyond assessing the economic, social and environmental benefits of enhanced energy
efficiency in the economy, a strand of literature draws attention to the effects of energy
efficiency policies on public budgets. Given the existence of numerous benefits and costs
of programmes supporting the uptake of energy efficiency improvements, it is hard to
deduct a priori the direction and magnitude of their impact on public budgets. Curtin
(2012) considered the case of public spending to promote external wall insulation in
Ireland. Regardless of the supporting scheme, the tax revenue to government from the
retrofitting more than offset the subsidy granted to the private investor. According to
the author, the calculated revenue to the government could be even higher when also
considering the reduced social welfare and health spending of external wall insulation
(Curtin, 2012).
Much of the literature on the impacts of energy efficiency on public budgets lean towards
impacts on the health system. Even though in this study health is a separate topic area,
some key relevant findings are presented here. In summary, it is found that the public
health impacts of energy efficiency can have a significant impact on public budgets. The
public health impacts of energy efficiency arise primarily from two main sources: (1)
improved indoor air quality and thermal comfort because of energy efficiency
improvements to residential buildings; (2) reduced ambient pollution levels and
improved ambient air quality because of reduced energy consumption across the
economy.
Large-scale implementation of energy efficiency measures and policies to limit air
pollution emissions could improve air quality and reduce the risk of severe future
impacts, in addition to having considerable climate co-benefits (OECD, 2016). As shown
in Section 3, it is widely accepted that energy efficiency measures – in residential and
commercial buildings, transport and industry – have positive impacts on public health.
Yet these are, at present, rarely calculated as part of energy efficiency policy impact
assessment or appraisal, largely due to the methodological challenges associated with
the process (IEA, 2014). Most notably, the level of public health spending, and hence
estimates of the potential savings, are highly dependent on the health system in each
country as well as on climatic factors. At the European level, the annual health benefit
of reducing air pollution in Europe is estimated to range from USD 7bn to USD 11bn
(€5-8bn) (Copenhagen Economics, 2012) (IEA, 2014).
Reduced risk of chronic and long-term illness and disability due to improved air quality
can also have a longer-term knock-on effect, reducing productivity losses (the cost of
lost days of work) and welfare spending. When considering both the economic gains
made up from less hospitalisation need, reduced outlay of public subsidies and reduced
energy bills for public buildings and institutions, Copenhagen Economics (2012)
estimated an annual revenue increase between €30 and €40 billion in 2020 in the EU.
Leaving aside the health issues, it is important to recognise the existence of different
results depending on the specific retrofit measure and support scheme considered.
Rosenaw et al. (2014) analysed the budgetary effects of funding solid wall insulation in
the UK. Despite solid wall insulation being one of the most expensive retrofit measures,
budget neutrality was achieved in the case of a non-repayable grant provided by the
government. When considering a public loan scheme, the costs of the public funding
were more than offset by additional tax receipts and revenues.
More recently, Mikulic et al. (2016) relied on an input-output model to calculate the
public revenues related to energy efficiency renovation for each € million invested by
the government to promote energy efficiency in the Croatian building sector. The
authors calculated that the indirect and induced effects of efficiency improvements were

June 2017 162
higher than 40% of the investment value, meaning that energy efficiency supporting
policies can be implemented without deterioration of the public deficit.
Additional studies that look at the potential impacts of energy efficiency on public
budgets are listed in Table 0-13. This table also provides a summary of the key findings
of each study.
Table 0-13 An overview of relevant studies on the impact of energy efficiency on public budgets
Reference Scope Main findings
1 Ministry of Industry, Tourism and Trade and IDEA, 2007, Saving and
Energy Efficiency Strategy in Spain 2004-2012
Spain This report presents the main results of several scenarios that were modelled to assess the impact of the 2008-2010 Action Plan. It provides
estimates on public services consumption, direct and indirect savings, associated investments and public support among others.
2 Meyer and Johnson, 2008, Energy Efficiency in the Public Sector – A Summary
of International Experience with Public Buildings and Its Relevance for Brazil
Brazil, US, UK, Germany
and others
This paper provides empirical evidence for several countries and makes policy recommendations for the Brazilian economy. For
example, the paper reports that the Berlin Energy Saving Partnership (ESP) has increased public sector energy savings by 26% and relates this to the Brazilian context.
3 Energy Efficient Cities
Initiative, 2011, Good Practices in City Energy
Efficiency: Vienna, Austria (European Union) – Municipal Eco-Purchasing
Austria This document provides an assessment of the
ÖkoKauf Program which has been running since 1999. Specifically, investments to improve
energy efficiency in the case of administrative buildings, day care centres and public schools have led to €1.5m in cost savings and 1,723 tonnes of CO2 emission reduction per year.
4 DECC, 2012, The Energy Efficiency Strategy: The Energy Efficiency
Opportunity in the UK
UK This document finds that 14% of total energy use in business and the public sector is consumed in organisations that are not implementing any type
of energy efficiency measures.
5 Zámečník and Lhoták, 2012, Should the Government Invest in Energy Efficiency of
Buildings? Macroeconomic
Impact Assessment
Czech Republic
This study that finds that every CZK 1m that is invested in enhanced energy efficiency in buildings (dwellings and the public sector) provokes a direct fiscal effect of CZK 0.967m.
This results mainly from increased employment
and overall tax income.
Rosenow et al., 2014, Fiscal impacts of energy efficiency programmes - the example of solid wall insulation investment in the UK
UK The paper finds that a considerable proportion of the investment needed to finance a scheme funding solid wall insulation would be offset by increased revenues and savings. It also emphasises the positive effects of implementing a loan scheme, which holds the potential of
generating further revenue for the Exchequer.
7 SEAI, 2014, Annual Report 2014 on Public Sector Energy Efficiency Performance
Ireland In 2013, energy savings for the Irish public sector were equivalent to 14% of the consumption that was expected for a BAU scenario where no energy efficiency investments were implemented.

June 2017 163
8 Frontier Economics, 2015, Energy Efficiency: An
Infrastructure Priority
UK This assessment finds that a programme to make British buildings more energy efficient would
result in £8.7bn of net benefits. This report also suggests that investment in energy efficiency should be considered as another form of infrastructure.
Source(s): Cambridge Econometrics’ elaboration based on several reports.
7 Industrial competitiveness
7.1 Key issues and scope of work
The EU objectives set out to achieve higher levels of energy efficiency, both in industry
and in the construction sector, may have several effects on European competitiveness.
In particular, increased levels of energy efficiency could have the following effects:
▪ Reduction in energy costs for energy intensive industries: Energy costs can comprise
a significant part energy intensive industries’ cost structure. At a detailed sectoral
level, energy costs may represent more than 3% of total production costs, and more
than 10% of added value. Energy efficiency is thus a key opportunity for cost
reduction and competitiveness improvement in industry.
▪ Impacts on SMEs: Energy Efficiency may be more difficult to implement in small
enterprises. For the construction sector, given that the majority of companies are
SMEs, it is necessary to pay attention to weaknesses and strengths regarding energy
efficiency improvements.
▪ Global market shares of European Industries related to improved energy efficiency
in construction and industry: The macroeconomic effects of energy efficiency
improvements go beyond GDP and employment growth. In particular, European
energy intensive industrial sectors (such as steel, pulp & paper, aluminium, cement,
glass or chemistry), which are particularly exposed to international competition, may
benefit from new opportunities arising from the shift in demand towards more
efficient and higher quality materials and processes.
▪ Emergence and positioning of European firms on breakthrough technologies and
innovation in energy efficiency products and solutions: new technologies and
innovation will certainly be a key pillar to achieving energy efficiency targets. For
instance, innovation on energy-saving building materials, new efficient cooling and
heating technologies, or even smart-meters for energy-consumption regulation, will
contribute to improved energy efficiency across all sectors. European industries may
position themselves on disruptive innovation and gain competitiveness on these
fledgling markets.
▪ Investment attractiveness of the European construction sector: Market trends for
construction, renovation and rehabilitation in the housing and services sectors may
trigger new opportunities for value creation. These trends throw into question the
European industry’s capacity to adapt its means and rhythm of production to meet
the increased domestic demand, and stay competitive compared to external players.
▪ Increase in productivity: Workers’ productivity is closely tied to their indoor working
environment; health effects of improved energy efficiency in buildings may result in
better productivity and ultimately affect competitiveness.
Therefore, the key factors to take into account are:
▪ Energy-intensive industries
▪ Industries that deliver/produce energy efficiency investment goods
▪ SMEs
▪ Construction sector

June 2017 164
7.2 Building on previous work
The EPBD report included only a limited consideration of industrial competitiveness,
based on the results of E3ME model simulations. In part, this was because many of the
factors that affect competitiveness are less relevant to energy efficiency in buildings.
There were also two important limitations to this approach – first, that E3ME cannot go
into a very high level of sectoral detail and second that many non-economic factors (e.g.
labour productivity) were not covered by the analysis. The approach in this report is
therefore to supplement the E3ME results with a more detailed analysis of the key
energy intensive sectors.
7.3 Literature review and data sources
The table below shows the EU provisions that are relevant for competitiveness and the
related literature sources that were analysed. It also presents the relevant sources on
the effects of smart financing on competitiveness.

June 2017 165
Table 0-14 Energy Efficiency and its effects on competitiveness
EE legislation Scope Measures Relevance for competitiveness Literature Review
EED
Art. 5 and 6 Purchasing by public bodies
* 3% of the buildings owned by governments renovated/yr (central governments of MS renovate each year 3% of the total floor area of the buildings they own and occupy that do not meet the minimum efficiency requirements set under the EPBD). * public sector should purchase energy efficient buildings, products and services defined through EU legislative acts (EPBD, Eco-Design, etc.).
* Construction industry: innovation opportunities and market growth. * Building renovation industry and providers' competitiveness (namely flat glass, insulation): innovation opportunities and market growth.
1 - Eurochambers 2016, Eurochambres response to the public consultation on the review of directive 2012/27/EU on energy efficiency 2 - Eurima 2016, Consultation on the review of directive 2012/27/EU on energy efficiency Interviews with construction industries, flat glass and insulation industries.
Art. 7 EE obligation schemes * Article 7 is responsible for half the energy savings the EED should achieve72. * Objective: 1.5% energy savings / yr thanks to Energy Obligation Schemes put in place by energy distributors & retail energy sales companies through EE measures.
* Energy Intensive Industries and SMEs' competitiveness: energy consumption reductions can be achieved through energy obligation schemes. * Commercial opportunities for utilities: energy utilities and other energy providers can use energy
3 - IEA, 2015, "Accelerating Energy Efficiency in small and Medium-sized Enterprises" 4 - ICF International, 2015, "study on energy efficiency and energy
72 European Commission, Communication from the Commission to the European Parliament and the Council – Implementing the Energy Efficiency Directive – Commission
Guidance, 6.11.2013. Available at: http://eur-lex.europa.eu/legal-content/EN/TXT/PDF/?uri=CELEX:52013DC0762&from=en.

June 2017 166
efficient programmes to build customer relationships, establish value-added services, address energy supply constraints such as peak demand. * Low costs, industries' competitiveness: cost reductions are more relevant for industries in which product differentiating is difficult. * Producers of energy efficient solutions: high demand for energy efficient solutions to achieve the targets set out in the Energy Obligation Schemes.
saving potential in industry and on possible policy mechanisms" 5 - ECF, 2014, "Macro-economic impacts of the low carbon transition"
Art. 8 Energy audits and management systems
* Article 8 states that MS shall promote the availability to all final customers of high quality energy audits which are cost-effective and : - carried out in an independent manner by qualified and/or accredited experts. - implemented and supervised by independent authorities under national legislation. * For large enterprises, mandatory energy audits are required.
* Energy intensive industries competitiveness: obligated energy audits and enhanced energy management systems can lead to a better understanding of energy consumption. With this enhanced understanding, energy efficient measures can be implemented more easily. * SMEs’ competitiveness: because SME enterprises account for over 60% of the EU's energy demand, the directive explicitly focuses on SMEs and imposes regular energy audits.
8 - ECEEE 2016, Enhancing the impact of energy audits and energy management in the EU
Art. 9-11 Smart metering and billing
* Empowering energy consumers to better manage consumption: easy and free access to data on consumption through individual metering. * National incentives for SMEs to undergo energy audits. * Large companies will make audits of
* SMEs’ competitiveness: access to data and information is key for SMEs to implement EE projects. This can be largely improved through smart metering and energy audits. * Energy Intensive Industries' competitiveness: energy audits are an
3 - IEA, 2015, "Accelerating Energy Efficiency in small and Medium-sized Enterprises" 4 - ICF International, 2015, "study on energy

June 2017 167
their energy consumption to help them identify ways to reduce it. * Monitoring efficiency levels in new energy generation capacities.
efficient tool for identifying energy saving potentials that are adapted to each industrial site.
efficiency and energy saving potential in industry and on possible policy mechanisms"
Art. 15 Operation infrastructure * Energy efficiency for energy transformation, transmission and distribution sector. * MS must ensure that national energy regulatory authorities, TSOs and DSOs maximise the energy efficiency potential of smart grids, assess and improve energy efficiency in the design and operation of the gas and electricity infrastructure and ensure that tariffs and regulations fulfil specific energy efficiency criteria.
* Energy intensive industries' competitiveness: will be able to compete on a lower cost base. * Producers of energy efficient solutions competitiveness: increased market opportunities.
4- ICF International, 2015, "study on energy efficiency and energy saving potential in industry and on possible policy mechanisms"
Art. 20 EE fund, financing and support
* MS shall facilitate the establishment of financing facilities, or use of existing ones for energy efficiency improvement measures to maximise the benefits of multiple streams of financing.
* All industries: increased financing for the investments in energy efficient improvement measures. * Energy intensive industries' competitiveness: will be able to compete with lower cost bases. * SMEs’ competitiveness: in general have more difficulties in raising financing.
3 - IEA, 2015, "Accelerating Energy Efficiency in small and Medium-sized Enterprises" 4 - ICF International, 2016, "study on energy efficiency and energy saving potential in industry and on possible policy mechanisms" 1 - Eurochambers 2015, Eurochambers response to the public consultation on the review of directive 2012/27/EU on energy efficiency
ECO-DESIGN AND ENERGY LABELLING

June 2017 168
Eco-design A framework for the setting of eco-design requirements for energy-related products
* Ensure that products covered by implementing measures may be placed on the market and/or put into service only if they comply with those measures and bear the CE marking. * Designate the authorities responsible for market surveillance. They shall arrange for such authorities to have and use the necessary powers to take the appropriate measures incumbent upon them under this directive. * Ensure that consumers and other interested parties are given the opportunity to submit observations on product compliance to the competent authorities.
* Energy producers' competitiveness: consumers respond positively to better information to advise with their purchases and behaviour. Additionally, increased regulation can reduce the import of foreign products in the European Union.
4 - ICF International, 2015, "study on energy efficiency and energy saving potential in industry and on possible policy mechanisms"
Energy labelling Induction of labelling and standard product information on the consumption of energy and other resources by energy-related products
* Ensure that all suppliers and dealers established in their territory fulfil the obligations and that misleading displays of other labels, marks, symbols or inscriptions are prohibited. * Oblige the supplier to make the product compliant with the relevant requirements.
* Energy producers' competitiveness: consumers respond positively to better information to advise with their purchases and behaviour. Additionally, increased regulation can reduce the imports of foreign energy in the European Union.
4 - ICF International, 2015, "study on energy efficiency and energy saving potential in industry and on possible policy mechanisms"
SMART FINANCING Smart Financing for Smart Buildings
Mobilising investments into energy efficiency in buildings
* Improvement of public procurement rules, standardisation of investment procedures or better monitoring of energy performance.
* SME's competitiveness: access to finance is key for SMEs to implement EE projects. This can be improved through smart financing. * General industry competitiveness: EE Investments have well-known positive cash-flow and competitive impacts resulting from delivered energy cost savings.
3 - IEA, 2015, "Accelerating Energy Efficiency in small and Medium-sized Enterprises" 2 - Energy efficiency - the first fuel for the EU Economy 6 - Review of the Energy

June 2017 169
* Construction industry competitiveness: boosting innovation in building materials, including in the area of renewables in buildings, potentially increasing trade on building-related materials as well as in the area of building information technologies. * Energy services industry competitiveness: boosting innovation in technologies, potentially increasing trade on energy performance software and data collection and monitoring.
Performance of Buildings Directive, including the 'Smart Financing for Smart Buildings' initiative 7- Eurochambres 2016, Eurochambers response to the public consultation on the review of directive 1012/27/EU on energy efficiency
Table 0-15 Main findings of the literature review
Source Scope Main findings
1 Eurochambres 2016,
Eurochambres response to the
public consultation on the
review of directive 2012/27/EU
on energy efficiency
This publication is the position
paper of the business community
at EU level in which it responds to
the public consultation on the
review of directive 2012/27/EU on
energy efficiency.
Mandatory procurement rules for integrated general sustainability policy targets lead to
more complex and costly bidding processes, particularly for SMEs.

June 2017 170
2 Eurima 2016, Consultation on
the review of directive
2012/27/EU on energy
efficiency
This response to the public
consultation presents the opinion
of the European insulation
Manufacturers Association on the
EED.
The public sector, if all parts are included, has a huge buying power and could be a very
important player in transforming the market towards highly efficient buildings and
products.
3 International Energy Agency,
2015, Accelerating Energy
Efficiency in small and Medium-
sized Enterprises
This publication describes the
importance of SMEs to the
economy, SME energy demand
and energy efficiency potential,
benefits beyond energy savings,
barriers to the uptake of energy
efficiency measures, and some of
the challenges facing programme
designers and managers. It
provides guidance on how the
barriers and challenges can be
addressed.
Importance of SMEs to the economy and energy consumption
SMEs are important drivers of economies around the world. In the European Union,
SMEs employ almost 90 million people, generate about 1.1 million new jobs per year and
contribute almost 30% of GDP, worth USD 5.5 trillion.
Their share of energy demand differs country by country, but the IEA estimates that
SMEs account for at least 13% of global final energy consumption annually. In the UK,
SMEs account for around 45% of total business energy use.
Benefits of EE for SMEs
Improving SMEs’ energy efficiency is a key way to increase their profitability and
competitiveness. As well as reducing SMEs’ energy costs, greater energy efficiency can
improve SMEs’ product quality and output, reduce risks and liabilities, enhance resilience
and enable new business opportunities. Studies indicate that the value of the productivity
and operational benefits derived can be up to 2.5 times the value of the energy savings
(IEA).
Numerous studies have indicated that the cost-effective savings potential of SMEs is in
the range of 10% to 30% of their energy demand. Eurochambres (the Association of
European Chambers of Commerce and Industry) estimates that the short-term energy
reduction potential among its 20 million EU members is 10% to 20% (Eurochambres,
2014). Another estimate puts the energy efficiency potential of industrial SMEs in the
European Union at more than 25% of consumption (Thollander and Palm, 2013).
Energy efficiency programmes also stimulate the growth of national and global markets
for energy-efficient goods and services, providing significant business opportunities for
SMEs themselves as suppliers
Barriers and key issues
SMEs usually do not have internal capacity to develop and implement energy efficiency
projects, and lack information about where and how energy is used in their companies.

June 2017 171
They also scope financial barriers: more severe credit conditions, higher price per unit of
energy then larger companies.
Key issues for enabling SMEs to implement energy efficiency projects are access to
information, capacity building and access to finance.
4 ICF International, 2015, study
on energy efficiency and
energy saving potential in
industry and on possible policy
mechanisms
This study assesses the energy
saving potential of industrial and
selected tertiary sectors that make
a key GDP contribution to the EU.
The main emphasis of the study is
energy intensive industries; for
which the study presents a
bottom-up analysis of eight
industrial sectors, which contribute
to more than 80% of industrial
final energy consumption in the
EU28 Member States
Pulp and paper: Incremental process efficiency improvements reflecting recently
developed technologies is anticipated to occur as the sector meets existing legislative
requirements (e.g. EED, EU-ETS, IED), and further innovates to develop new products to
improve margins and market lead. The past trends in reduction of energy intensity are
anticipated to continue in a BAU scenario (energy intensity in TOE/dried tonne: 0.389 in
2015; 0.373 in 2020; 0.344 in 2030). Technically feasible savings identified would
represent energy consumption savings of 19% in 2030.
Iron and steel: The EU iron and steel industry has been continuously improving its
energy intensity over time, primarily driven by commercial factors of increasing energy
prices. Based on the limitations of emerging energy efficient technologies in steelmaking,
energy intensity is expected to reduce gradually from 2011-2030 in a BAU scenario
(energy intensity in TOE/dried tonne: 0.341 in 2015; 0.338 in 2020; 0.331 in 2030).
Technically feasible savings identified would represent energy consumption savings of
24% in 2030.
Non-metallic minerals: Overall, production in the non-metallic minerals sector is
assumed to remain relatively flat through 2050 (BAU scenario), since many of the sectors
are dependent of technological breakthroughs that are not available today. Technically
feasible savings identified would represent energy consumption savings of 19% in 2030
(only 3.3% saving under economic scenario 1 – considering only <2 years payback
energy saving opportunities).
Chemicals and pharmaceuticals: It is assumed that sector intensity will decrease by
0.5% per year through 2020, as plant-level efficiency is maximised, making it more
difficult to make further improvements, and then by 0.25% through 2050. Technically
feasible savings identified would represent energy consumption savings of 25% in 2030
(only 4% saving under economic scenario 1 – considering only <2 years payback energy
saving opportunities).

June 2017 172
Non-ferrous metald: Over this 22 year period, the energy consumption trend has been
gradually reducing by an approximate rate of 0.5% p/a while production of aluminium and
copper has been relatively constant over the same period. This gradual reduction trend is
expected to continue as the EU continues its strong growth in production of secondary
metal through improved waste management schemes in recycling and recovering useful
scrap metal. Technically feasible savings identified would represent energy consumption
savings of 22% in 2030 (only 5.5% saving under economic scenario 1 – considering only
<2 years payback energy saving opportunities).
Potential measures for improving energy efficiency in industries are proposed:
Mandatory implementation of EnMS for large enterprises
Mandatory sub-metering requirements
Mandatory requirement of energy managers for large energy intensive enterprises
Development of insurance for energy performance
Increased promotion and facilitation of energy use within industrial clusters
For each measure, the potential energy savings are identified by sector.
5 European Climate Foundation,
2014, Macro-economic impacts
of the low carbon
transition
The purpose of the analysis is to
explore the macroeconomic
impacts of decarbonisation on the
basis of an extensive literature
review, by comparing a BAU
scenario to decarbonisation
scenarios on a number of key
parameters.
Future competitiveness of European industry will mostly rely on drivers which are
unaffected by whether Europe engages in decarbonisation. Energy costs would remain a
key competitiveness driver for a number of energy intensive industries which represent
the bulk of industrial carbon emissions (steel, cement, aluminium, chemicals, pulp &
paper).
There are encouraging signs that important energy efficiency opportunities and
breakthrough technologies could be commercially viable and usable by these industries
by 2030.
The study confirms the high trade intensity of EIIs, except for the cement industry which
remains protected by high transport costs.
6 Energy Efficiency Financial
Institutions Group, 2015,
Energy Efficiency - the first fuel
for the EU Economy
This reports, which covers
buildings, industry and SMEs,
examines the strategic importance
of investments in energy efficiency
for the European Union. It
concludes by stating several key
While European industry is world leading in energy efficiency, continued and increasing
energy efficiency investment flows will enhance its global competitiveness, protect
against energy price volatility and deliver further cost savings in all segments.

June 2017 173
market and policy
recommendations.
7 Review of the Energy
Performance of Buildings
Directive, including the
'Smart Financing for Smart
Buildings' initiative
This impact assessment evaluates the Energy Performance of Buildings Directive in light of the experience gained over the
period of its application according to five criteria: Relevance, Effectiveness, Efficiency, EU-added value and Coherence. It also
analyses the impact of the ‘Smart Financing for Smart Buildings’ initiative. It must be stated that this source does not prejudge
the final decision of the Commission.
8 European Council for an
Energy Efficient Economy,
2016, Enhancing the impact of
energy audits and energy
management in the EU
This report reviews Article 8 of the
EED with regards to its contents,
effects on competitiveness,
current implementation and
improvement potential.
1 - Within industry, energy demand is dominated by the energy intensive industries,
which are responsible for nearly 80% of industry's final energy demand:
* primary metals
* chemical industry
* non metallic minerals
* paper, pulp and printing industry
* food industry
2 - The update of energy saving measures, although reasonable from a strictly micro-
economic perspective, is often delayed or prevented by fear for fallback in
competitiveness due to initial investments and production breaks due to the
implementation of the efficiency measures.
3 - The positive effects of energy efficiency go far beyond energy savings: increased
productivity, reduced maintenance and operational costs, improved product quality, less
resource consumption, etc. The IEA states that the due to these multiple benefits the
monetary value can exceed the direct cost savings by 250%.

June 2017 174
Appendix E Additional Results at Member State level
This appendix includes additional detailed results that were excluded from the main
report for reasons of space.
Table 0-16: Degree of crowding out in each scenario at Member State level (%)
EUCO27 EUCO30 EUCO33 EUCO35 EUCO40
EU28 0.0 0.0 3.1 8.1 19.0
AT 0.0 0.0 0.0 3.4 13.3
BE 0.0 0.0 3.4 9.3 21.3
BG 0.0 0.0 0.0 0.0 0.0
CY 0.0 0.0 0.0 0.0 0.0
CZ 0.0 0.0 4.2 10.6 23.6
DE 0.0 0.0 8.5 15.3 28.4
DK 0.0 0.0 0.0 0.0 8.4
EE 0.0 0.0 0.0 0.0 0.0
EL 0.0 0.0 5.8 12.7 25.2
ES 0.0 0.0 0.0 0.0 0.0
FI 0.0 0.0 0.0 0.0 5.2
FR 0.0 0.0 0.0 4.1 15.0
HR 0.0 0.0 0.0 0.0 0.0
HU 0.0 1.2 16.1 25.6 42.1
IE 0.0 0.0 0.0 0.0 0.0
IT 0.0 0.0 2.9 8.7 20.3
LT 0.0 0.0 0.0 4.2 15.3
LU 0.0 0.0 0.0 0.0 2.8
LV 0.0 3.2 18.4 27.6 44.2
MT 0.0 0.0 0.0 0.0 0.0
NL 0.0 0.0 1.2 6.6 17.8
PL 0.0 0.0 3.1 10.0 23.6
PT 0.0 0.0 0.0 1.8 10.7
RO 0.0 0.0 3.0 9.0 21.4
SI 0.0 0.0 2.2 7.8 19.1
SK 0.0 0.0 4.3 10.7 24.4
SW 0.0 0.0 0.0 3.6 13.7
UK 0.0 0.0 0.1 5.1 15.8
Source(s): Cambridge Econometrics
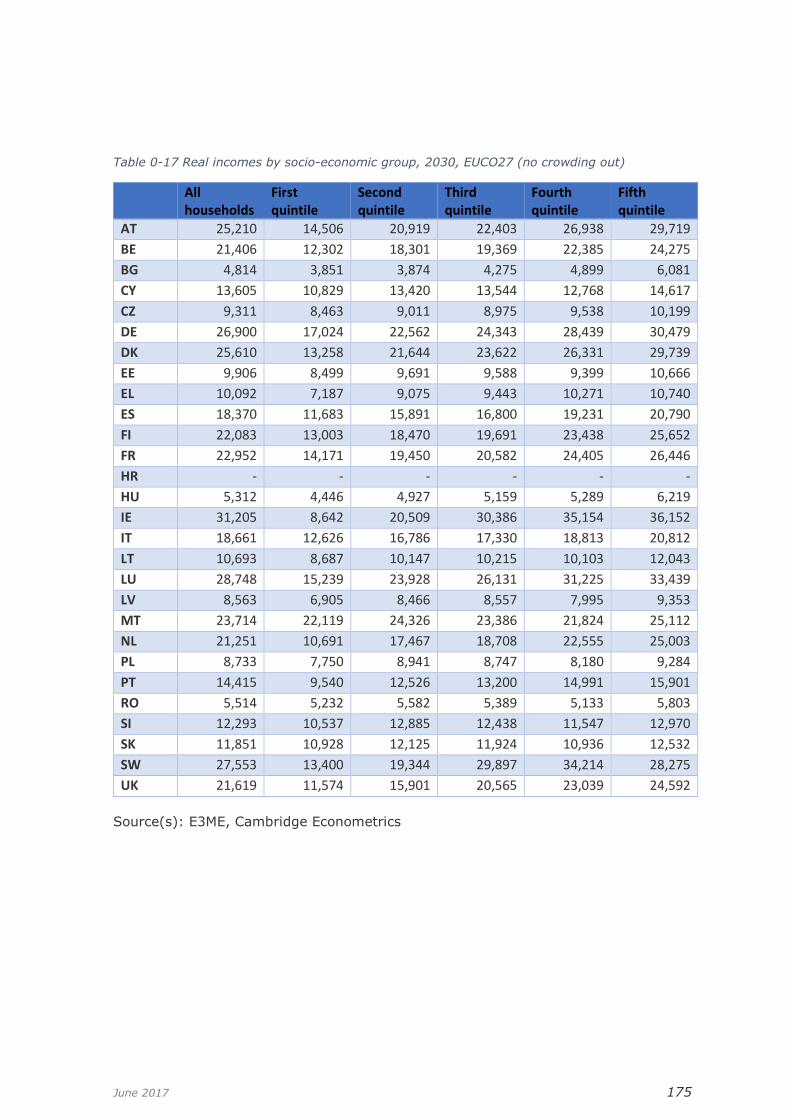
June 2017 175
Table 0-17 Real incomes by socio-economic group, 2030, EUCO27 (no crowding out)
All households
First quintile
Second quintile
Third quintile
Fourth quintile
Fifth quintile
AT 25,210 14,506 20,919 22,403 26,938 29,719
BE 21,406 12,302 18,301 19,369 22,385 24,275
BG 4,814 3,851 3,874 4,275 4,899 6,081
CY 13,605 10,829 13,420 13,544 12,768 14,617
CZ 9,311 8,463 9,011 8,975 9,538 10,199
DE 26,900 17,024 22,562 24,343 28,439 30,479
DK 25,610 13,258 21,644 23,622 26,331 29,739
EE 9,906 8,499 9,691 9,588 9,399 10,666
EL 10,092 7,187 9,075 9,443 10,271 10,740
ES 18,370 11,683 15,891 16,800 19,231 20,790
FI 22,083 13,003 18,470 19,691 23,438 25,652
FR 22,952 14,171 19,450 20,582 24,405 26,446
HR - - - - - -
HU 5,312 4,446 4,927 5,159 5,289 6,219
IE 31,205 8,642 20,509 30,386 35,154 36,152
IT 18,661 12,626 16,786 17,330 18,813 20,812
LT 10,693 8,687 10,147 10,215 10,103 12,043
LU 28,748 15,239 23,928 26,131 31,225 33,439
LV 8,563 6,905 8,466 8,557 7,995 9,353
MT 23,714 22,119 24,326 23,386 21,824 25,112
NL 21,251 10,691 17,467 18,708 22,555 25,003
PL 8,733 7,750 8,941 8,747 8,180 9,284
PT 14,415 9,540 12,526 13,200 14,991 15,901
RO 5,514 5,232 5,582 5,389 5,133 5,803
SI 12,293 10,537 12,885 12,438 11,547 12,970
SK 11,851 10,928 12,125 11,924 10,936 12,532
SW 27,553 13,400 19,344 29,897 34,214 28,275
UK 21,619 11,574 15,901 20,565 23,039 24,592
Source(s): E3ME, Cambridge Econometrics

June 2017 176
Table 0-18 Real incomes by socio-economic group, 2030, EUCO30 (% difference from EUCO27
scenario) (no crowding out)
All households
First quintile
Second quintile
Third quintile
Fourth quintile
Fifth quintile
AT 0.2 0.2 0.2 0.2 0.2 0.2
BE 0.3 0.3 0.2 0.3 0.3 0.3
BG -0.3 -0.1 -0.2 -0.1 -0.2 -0.4
CY -0.1 0.0 0.0 -0.1 -0.1 -0.1
CZ 0.3 0.4 0.4 0.4 0.2 0.0
DE 0.0 -0.1 0.0 0.0 0.0 0.0
DK 0.0 0.2 0.1 0.0 -0.1 -0.1
EE -0.4 -0.2 -0.1 -0.3 -0.6 -0.6
EL 0.2 0.2 0.2 0.2 0.2 0.2
ES 0.0 0.1 0.0 0.0 -0.1 -0.1
FI 0.3 0.3 0.3 0.3 0.3 0.3
FR 1.0 1.0 1.1 1.0 1.0 0.9
HR 0.0 0.0 0.0 0.0 0.0 0.0
HU 0.7 1.2 1.0 0.9 0.6 0.2
IE -0.1 0.1 0.1 -0.1 -0.2 -0.3
IT 0.1 0.2 0.2 0.2 0.1 -0.1
LT 0.5 0.9 0.8 0.7 0.5 0.2
LU 0.2 0.3 0.2 0.2 0.2 0.2
LV 0.9 1.5 1.6 1.4 1.0 0.6
MT 0.9 0.9 0.9 0.9 0.9 0.8
NL 0.0 0.0 0.0 0.0 0.0 0.1
PL -0.7 -0.2 -0.3 -0.5 -0.7 -1.2
PT 0.4 0.4 0.5 0.4 0.4 0.4
RO -0.8 -0.8 -0.8 -0.8 -0.8 -0.9
SI -0.1 0.0 -0.1 -0.1 -0.2 -0.3
SK -0.4 -0.5 -0.5 -0.5 -0.4 -0.4
SW 0.1 0.1 0.1 0.1 0.1 0.1
UK 0.0 -1.8 -1.3 -0.6 0.3 0.3
Source(s): E3ME, Cambridge Econometrics

June 2017 177
Table 0-19 Real incomes by socio-economic group, 2030, EUCO33 (% difference from EUCO27 scenario) (no crowding out)
All households
First quintile
Second quintile
Third quintile
Fourth quintile
Fifth quintile
AT 1.4 1.4 1.4 1.4 1.4 1.5
BE 1.3 1.4 1.3 1.3 1.4 1.4
BG 0.2 0.7 0.4 0.4 0.2 -0.1
CY 0.0 0.2 0.1 0.0 0.0 -0.1
CZ 2.0 2.3 2.3 2.4 1.9 1.5
DE 1.3 1.2 1.4 1.4 1.3 1.1
DK 0.2 0.6 0.5 0.2 0.0 0.0
EE 0.3 1.8 1.8 0.9 -0.2 -0.1
EL 0.8 0.9 0.9 0.9 0.9 0.9
ES 0.2 0.5 0.4 0.3 0.2 0.1
FI 1.8 1.9 1.9 1.8 1.7 1.6
FR 2.2 2.2 2.3 2.2 2.2 1.8
HR 1.3 1.4 1.3 1.3 1.4 1.4
HU 1.8 3.3 2.6 2.2 1.5 0.6
IE 0.0 0.7 0.7 0.3 -0.1 -0.4
IT 1.0 1.2 1.3 1.2 1.1 0.6
LT 1.4 2.8 2.5 2.0 1.3 0.5
LU 0.4 1.3 0.8 0.5 0.4 0.3
LV 2.8 4.5 4.1 3.3 2.7 2.0
MT 0.0 0.0 0.0 0.0 0.0 -0.1
NL 0.6 0.6 0.6 0.6 0.6 0.6
PL -0.5 0.7 0.5 0.1 -0.5 -1.6
PT 0.9 1.0 1.1 1.0 0.9 0.8
RO -0.9 -0.8 -0.7 -0.8 -0.9 -1.1
SI 0.1 0.4 0.3 0.3 0.1 -0.2
SK -0.9 -1.1 -1.0 -1.1 -0.7 -1.0
SW 0.3 0.4 0.3 0.3 0.4 0.3
UK 0.7 -0.9 -0.4 0.1 1.0 0.9
Source(s): E3ME, Cambridge Econometrics

June 2017 178
Table 0-20 Real incomes by socio-economic group, 2030, EUCO35 (% difference from EUCO27 scenario) (no crowding out)
All households
First quintile
Second quintile
Third quintile
Fourth quintile
Fifth quintile
AT 2.3 2.3 2.3 2.3 2.3 2.4
BE 1.6 1.8 1.5 1.6 1.7 1.8
BG 0.4 1.1 0.7 0.6 0.5 0.0
CY -0.2 0.3 0.1 -0.1 -0.2 -0.4
CZ 3.0 3.5 3.4 3.5 2.8 2.3
DE 1.8 1.7 2.0 1.9 1.8 1.5
DK 0.1 0.6 0.4 0.0 -0.2 -0.2
EE 0.4 2.0 2.1 1.1 -0.4 -0.2
EL 1.3 1.3 1.3 1.3 1.4 1.3
ES 0.3 0.7 0.5 0.4 0.3 0.1
FI 2.9 3.0 3.0 3.0 2.8 2.7
FR 3.0 3.1 3.2 3.1 3.0 2.7
HR 0.0 0.0 0.0 0.0 0.0 0.0
HU 2.6 4.7 3.8 3.1 2.2 0.8
IE 0.2 1.1 1.1 0.5 0.0 -0.5
IT 1.4 1.7 1.8 1.7 1.5 0.9
LT 2.1 4.1 3.6 2.9 1.9 0.9
LU 0.4 1.5 0.8 0.5 0.3 0.3
LV 3.9 6.3 5.5 4.4 3.7 2.8
MT 0.1 0.2 0.1 0.1 0.1 -0.1
NL 1.1 1.0 1.0 1.0 1.1 1.1
PL -0.4 1.8 1.5 0.7 -0.4 -2.1
PT 0.8 0.9 1.0 0.9 0.8 0.6
RO -1.2 -1.2 -1.0 -1.1 -1.2 -1.5
SI 0.7 1.1 0.8 0.9 0.6 0.1
SK -1.5 -1.9 -1.6 -1.8 -1.3 -1.6
SW -0.2 -0.1 -0.3 -0.2 -0.2 -0.3
UK 1.1 -0.4 0.1 0.6 1.4 1.2
Source(s): E3ME, Cambridge Econometrics

June 2017 179
Table 0-21 Real incomes by socio-economic group, 2030, EUCO40 (% difference from EUCO27 scenario) (no crowding out)
All households
First quintile
Second quintile
Third quintile
Fourth quintile
Fifth quintile
AT 4.6 4.7 4.7 4.6 4.6 4.8
BE 3.0 3.3 2.8 2.9 3.2 3.2
BG 1.0 2.1 1.4 1.4 1.1 0.3
CY -0.7 0.1 -0.3 -0.6 -0.7 -1.0
CZ 6.4 7.1 7.0 7.2 6.0 5.2
DE 4.0 4.1 4.3 4.2 4.0 3.6
DK -0.3 0.5 0.2 -0.4 -0.6 -0.6
EE 1.1 2.8 3.3 2.1 0.1 0.4
EL 1.8 1.9 1.9 1.9 2.0 2.0
ES 0.8 1.4 1.1 0.9 0.8 0.5
FI 6.1 6.6 6.4 6.3 6.0 5.7
FR 5.1 5.2 5.4 5.2 5.1 4.8
HR 0.0 0.0 0.0 0.0 0.0 0.0
HU 4.1 7.7 6.2 5.0 3.5 1.4
IE 0.5 2.1 2.1 1.1 0.1 -0.7
IT 2.8 3.3 3.5 3.3 3.0 2.0
LT 4.1 7.3 6.4 5.3 3.8 2.0
LU 0.5 1.7 0.8 0.3 0.1 0.2
LV 7.4 11.1 9.8 7.9 7.0 5.6
MT 0.4 0.6 0.5 0.5 0.5 0.2
NL 2.2 2.2 2.1 2.1 2.2 2.3
PL 1.0 3.9 3.6 2.5 1.0 -1.4
PT 1.2 1.4 1.6 1.4 1.3 0.9
RO -2.9 -2.9 -2.5 -2.7 -2.9 -3.3
SI 1.6 2.4 1.9 2.0 1.5 0.8
SK -1.4 -2.1 -1.6 -1.8 -1.0 -1.7
SW -0.4 -0.2 -0.5 -0.4 -0.3 -0.5
UK 2.3 1.1 1.5 1.9 2.6 2.3
Source(s): E3ME, Cambridge Econometrics

June 2017 180
Table 0-22 Real incomes by socio-economic group, 2030, EUCO27 (partial crowding out)
All households
First quintile
Second quintile
Third quintile
Fourth quintile
Fifth quintile
AT 25,210 14,506 20,919 22,403 26,938 29,719
BE 21,406 12,302 18,301 19,369 22,385 24,275
BG 4,814 3,851 3,874 4,275 4,899 6,081
CY 13,605 10,829 13,420 13,544 12,768 14,617
CZ 9,311 8,463 9,011 8,975 9,538 10,199
DE 26,900 17,024 22,562 24,343 28,439 30,479
DK 25,610 13,258 21,644 23,622 26,331 29,739
EE 9,906 8,499 9,691 9,588 9,399 10,666
EL 10,092 7,187 9,075 9,443 10,271 10,740
ES 18,370 11,683 15,891 16,800 19,231 20,790
FI 22,083 13,003 18,470 19,691 23,438 25,652
FR 22,952 14,171 19,450 20,582 24,405 26,447
HR - - - - - -
HU 5,312 4,446 4,927 5,159 5,289 6,219
IE 31,205 8,642 20,509 30,386 35,154 36,152
IT 18,661 12,626 16,786 17,330 18,813 20,812
LT 10,693 8,687 10,147 10,215 10,103 12,043
LU 28,748 15,239 23,928 26,131 31,225 33,439
LV 8,563 6,905 8,466 8,557 7,995 9,353
MT 23,714 22,119 24,326 23,386 21,824 25,112
NL 21,251 10,691 17,467 18,708 22,555 25,003
PL 8,733 7,750 8,941 8,747 8,180 9,284
PT 14,415 9,540 12,526 13,199 14,991 15,901
RO 5,514 5,232 5,582 5,389 5,133 5,803
SI 12,293 10,537 12,885 12,438 11,547 12,970
SK 11,851 10,928 12,125 11,924 10,936 12,532
SW 27,553 13,400 19,344 29,897 34,214 28,275
UK 21,619 11,574 15,901 20,565 23,039 24,592
Source(s): E3ME, Cambridge Econometrics

June 2017 181
Table 0-23 Real incomes by socio-economic group, 2030, EUCO30 (% difference from EUCO27 scenario) (partial crowding out)
All households
First quintile
Second quintile
Third quintile
Fourth quintile
Fifth quintile
AT 0.2 0.2 0.2 0.2 0.2 0.2
BE 0.3 0.3 0.2 0.3 0.3 0.3
BG -0.3 -0.1 -0.2 -0.1 -0.2 -0.4
CY -0.1 0.0 0.0 -0.1 -0.1 -0.1
CZ 0.3 0.4 0.4 0.4 0.2 0.0
DE 0.0 -0.1 0.0 0.0 0.0 0.0
DK 0.0 0.2 0.1 0.0 -0.1 -0.1
EE -0.4 -0.2 -0.1 -0.3 -0.6 -0.6
EL 0.2 0.2 0.2 0.2 0.2 0.2
ES 0.0 0.1 0.0 0.0 -0.1 -0.1
FI 0.3 0.3 0.3 0.3 0.3 0.3
FR 1.0 1.0 1.1 1.0 1.0 0.9
HR 0.0 0.0 0.0 0.0 0.0 0.0
HU 0.7 1.2 1.0 0.8 0.6 0.3
IE -0.1 0.1 0.1 -0.1 -0.2 -0.3
IT 0.1 0.2 0.2 0.2 0.1 -0.1
LT 0.5 0.9 0.8 0.7 0.5 0.2
LU 0.2 0.3 0.2 0.2 0.2 0.2
LV 0.8 1.3 1.4 1.3 0.9 0.5
MT 0.9 0.9 0.9 0.9 0.9 0.8
NL 0.0 0.0 0.0 0.0 0.0 0.1
PL -0.7 -0.2 -0.3 -0.5 -0.7 -1.2
PT 0.4 0.4 0.5 0.4 0.4 0.4
RO -0.8 -0.8 -0.8 -0.8 -0.8 -0.9
SI -0.1 0.0 -0.1 -0.1 -0.2 -0.3
SK -0.4 -0.5 -0.5 -0.5 -0.4 -0.4
SW 0.1 0.1 0.1 0.1 0.1 0.1
UK 0.0 -1.8 -1.3 -0.6 0.3 0.3
Source(s): E3ME, Cambridge Econometrics

June 2017 182
Table 0-24 Real incomes by socio-economic group, 2030, EUCO33 (% difference from EUCO27 scenario) (partial crowding out)
All households
First quintile
Second quintile
Third quintile
Fourth quintile
Fifth quintile
AT 1.3 1.3 1.3 1.3 1.3 1.4
BE 1.2 1.3 1.2 1.2 1.3 1.3
BG 0.2 0.7 0.4 0.3 0.2 -0.1
CY -0.1 0.2 0.1 0.0 -0.1 -0.2
CZ 1.8 2.1 2.1 2.1 1.7 1.3
DE 1.0 0.9 1.1 1.1 1.0 0.8
DK 0.2 0.6 0.5 0.2 0.0 0.0
EE 0.3 1.8 1.8 0.9 -0.2 -0.1
EL 0.8 0.8 0.8 0.8 0.8 0.8
ES 0.2 0.5 0.4 0.3 0.2 0.1
FI 1.8 1.9 1.9 1.9 1.7 1.6
FR 2.1 2.1 2.2 2.1 2.1 1.8
HR 0.0 0.0 0.0 0.0 0.0 0.0
HU 1.5 2.6 2.1 1.8 1.3 0.6
IE 0.0 0.7 0.6 0.2 -0.1 -0.5
IT 0.9 1.1 1.2 1.1 1.0 0.5
LT 1.4 2.8 2.4 1.9 1.3 0.5
LU 0.4 1.3 0.8 0.5 0.4 0.3
LV 1.7 3.0 2.8 2.3 1.7 1.1
MT 0.0 0.1 0.0 0.0 0.0 -0.1
NL 0.5 0.5 0.5 0.5 0.5 0.6
PL -0.6 0.5 0.4 -0.1 -0.6 -1.6
PT 0.9 1.0 1.1 1.0 1.0 0.8
RO 1.2 1.3 1.2 1.2 1.3 1.3
SI 0.2 0.3 0.3 0.3 0.1 -0.1
SK -0.9 -1.1 -1.0 -1.1 -0.8 -1.0
SW 0.3 0.4 0.3 0.4 0.4 0.3
UK 0.7 -1.0 -0.4 0.1 1.0 0.9
Source(s): E3ME, Cambridge Econometrics

June 2017 183
Table 0-25 Real incomes by socio-economic group, 2030, EUCO35 (% difference from EUCO27 scenario) (partial crowding out)
All households
First quintile
Second quintile
Third quintile
Fourth quintile
Fifth quintile
AT 1.9 1.9 1.9 1.8 1.9 2.0
BE 1.3 1.5 1.2 1.3 1.4 1.5
BG 0.4 1.1 0.7 0.6 0.5 0.0
CY -0.2 0.2 0.0 -0.2 -0.2 -0.4
CZ 2.4 2.7 2.7 2.8 2.2 1.7
DE 1.0 0.9 1.1 1.1 1.0 0.8
DK 0.1 0.6 0.5 0.1 -0.1 -0.1
EE 0.4 2.0 2.1 1.1 -0.4 -0.1
EL 0.9 1.0 1.0 1.0 1.0 0.9
ES 0.3 0.7 0.5 0.4 0.3 0.1
FI 2.9 3.1 3.0 3.0 2.9 2.7
FR 2.7 2.8 2.9 2.8 2.7 2.4
HR 1.3 1.5 1.2 1.3 1.4 1.5
HU 1.9 3.4 2.8 2.3 1.7 0.7
IE 0.2 1.1 1.0 0.5 -0.1 -0.5
IT 1.0 1.3 1.4 1.3 1.2 0.6
LT 1.9 3.8 3.3 2.6 1.7 0.8
LU 0.4 1.5 0.8 0.5 0.4 0.3
LV 1.8 3.4 3.0 2.3 1.8 1.1
MT 0.1 0.2 0.1 0.1 0.1 0.0
NL 0.8 0.8 0.8 0.8 0.8 0.9
PL -0.7 1.3 1.0 0.2 -0.7 -2.3
PT 0.8 0.9 1.0 0.9 0.8 0.7
RO -1.1 -1.1 -1.0 -1.0 -1.1 -1.3
SI 0.4 0.8 0.5 0.6 0.3 -0.1
SK -1.7 -2.0 -1.8 -1.9 -1.5 -1.7
SW -0.2 -0.1 -0.2 -0.2 -0.1 -0.3
UK 0.9 -0.6 -0.1 0.4 1.2 1.1
Source(s): E3ME, Cambridge Econometrics

June 2017 184
Table 0-26 Real incomes by socio-economic group, 2030, EUCO40 (% difference from EUCO27 scenario) (partial crowding out)
All households
First quintile
Second quintile
Third quintile
Fourth quintile
Fifth quintile
AT 2.7 2.8 2.8 2.7 2.7 2.8
BE 1.9 2.1 1.8 1.9 2.0 2.1
BG 0.9 1.9 1.3 1.2 1.0 0.2
CY -0.8 0.0 -0.4 -0.8 -0.8 -1.1
CZ 3.9 4.4 4.4 4.5 3.6 2.9
DE 1.5 1.4 1.7 1.7 1.6 1.3
DK -0.1 0.6 0.4 -0.2 -0.4 -0.4
EE 1.2 2.9 3.3 2.1 0.1 0.5
EL 0.9 0.9 0.9 1.0 1.0 1.0
ES 0.8 1.4 1.1 0.9 0.7 0.4
FI 5.5 6.0 5.9 5.7 5.5 5.2
FR 3.8 3.9 4.1 3.9 3.8 3.5
HR 0.0 0.0 0.0 0.0 0.0 0.0
HU 2.7 4.8 3.8 3.2 2.3 0.9
IE 0.4 2.0 2.0 1.0 0.1 -0.7
IT 1.6 1.9 2.1 1.9 1.7 1.0
LT 2.8 5.6 4.8 3.9 2.6 1.1
LU 0.4 1.5 0.7 0.2 0.0 0.1
LV 1.6 3.7 3.0 2.0 1.4 0.6
MT 0.4 0.6 0.5 0.5 0.5 0.2
NL 1.3 1.2 1.2 1.2 1.3 1.3
PL -1.0 1.6 1.2 0.2 -1.0 -3.0
PT 1.0 1.2 1.4 1.2 1.1 0.8
RO -2.2 -2.2 -2.0 -2.1 -2.2 -2.5
SI 0.5 1.2 0.8 0.8 0.4 -0.1
SK -2.1 -2.6 -2.3 -2.4 -1.8 -2.2
SW -0.3 -0.2 -0.4 -0.3 -0.2 -0.4
UK 1.6 0.2 0.7 1.1 1.8 1.6
Source(s): E3ME, Cambridge Econometrics

June 2017 185
Figure 0.5 Public budget impacts by Member State in 2030, EUCO30, as a % of GDP compared to
EUCO27) (no crowding out)
Source(s): Cambridge Econometrics
Figure 0.6 Public budget impacts by Member State in 2030, EUCO33, as a % of GDP compared to EUCO27) (no crowding out)
Source(s): Cambridge Econometrics
-0.4
-0.3
-0.2
-0.1
0
0.1
0.2
0.3
0.4
0.5
0.6
Au
stri
a
Bel
giu
m
Bu
lgar
ia
Cyp
rus
Cze
ch R
epu
blic
Ge
rman
y
Den
mar
k
Gre
ece
Esto
nia
Spai
n
Fin
lan
d
Fran
ce
Cro
atia
Hu
nga
ry
Irel
and
Ital
y
Lith
uan
ia
Latv
ia
Luxe
mb
ou
rg
Mal
ta
Ne
the
rlan
ds
Po
lan
d
Po
rtu
gal
Ro
man
ia
Slo
ven
ia
Slo
vaki
a
Swed
en UK
-0.4
-0.2
0.0
0.2
0.4
0.6
0.8
1.0
1.2
1.4
1.6
Au
stri
a
Bel
giu
m
Bu
lgar
ia
Cyp
rus
Cze
ch R
epu
blic
Ge
rman
y
Den
mar
k
Gre
ece
Esto
nia
Spai
n
Fin
lan
d
Fran
ce
Cro
atia
Hu
nga
ry
Irel
and
Ital
y
Lith
uan
ia
Latv
ia
Luxe
mb
ou
rg
Mal
ta
Ne
the
rlan
ds
Po
lan
d
Po
rtu
gal
Ro
man
ia
Slo
ven
ia
Slo
vaki
a
Swed
en UK

June 2017 186
Figure 0.7 Public budget impacts by Member State in 2030, EUCO35, as a % of GDP compared to EUCO27) (no crowding out)
Source(s): Cambridge Econometrics
Figure 0.8 Public budget impacts by Member State in 2030, EUCO40, as a % of GDP compared to EUCO27) (no crowding out)
Source(s): Cambridge Econometrics
-0.5
0.0
0.5
1.0
1.5
2.0
2.5
Au
stri
a
Bel
giu
m
Bu
lgar
ia
Cyp
rus
Cze
ch R
epu
blic
Ge
rman
y
Den
mar
k
Gre
ece
Esto
nia
Spai
n
Fin
lan
d
Fran
ce
Cro
atia
Hu
nga
ry
Irel
and
Ital
y
Lith
uan
ia
Latv
ia
Luxe
mb
ou
rg
Mal
ta
Ne
the
rlan
ds
Po
lan
d
Po
rtu
gal
Ro
man
ia
Slo
ven
ia
Slo
vaki
a
Swed
en UK
-2.0
-1.0
0.0
1.0
2.0
3.0
4.0
5.0
Au
stri
a
Bel
giu
m
Bu
lgar
ia
Cyp
rus
Cze
ch R
epu
blic
Ge
rman
y
Den
mar
k
Gre
ece
Esto
nia
Spai
n
Fin
lan
d
Fran
ce
Cro
atia
Hu
nga
ry
Irel
and
Ital
y
Lith
uan
ia
Latv
ia
Luxe
mb
ou
rg
Mal
ta
Ne
the
rlan
ds
Po
lan
d
Po
rtu
gal
Ro
man
ia
Slo
ven
ia
Slo
vaki
a
Swed
en UK

June 2017 187
Figure 0.9 Public budget impacts by Member State in 2030, EUCO30, as a % of GDP compared to EUCO27) (partial crowding out)
Source(s): Cambridge Econometrics
Figure 0.10 Public budget impacts by Member State in 2030, EUCO33, as a % of GDP compared
to EUCO27) (partial crowding out)
Source(s): Cambridge Econometrics
-0.4
-0.3
-0.2
-0.1
0
0.1
0.2
0.3
0.4
0.5
0.6
Au
stri
a
Bel
giu
m
Bu
lgar
ia
Cyp
rus
Cze
ch R
epu
blic
Ge
rman
y
Den
mar
k
Gre
ece
Esto
nia
Spai
n
Fin
lan
d
Fran
ce
Cro
atia
Hu
nga
ry
Irel
and
Ital
y
Lith
uan
ia
Latv
ia
Luxe
mb
ou
rg
Mal
ta
Ne
the
rlan
ds
Po
lan
d
Po
rtu
gal
Ro
man
ia
Slo
ven
ia
Slo
vaki
a
Swed
en UK
-0.4
-0.2
0.0
0.2
0.4
0.6
0.8
1.0
1.2
1.4
Au
stri
a
Bel
giu
m
Bu
lgar
ia
Cyp
rus
Cze
ch R
epu
blic
Ge
rman
y
Den
mar
k
Gre
ece
Esto
nia
Spai
n
Fin
lan
d
Fran
ce
Cro
atia
Hu
nga
ry
Irel
and
Ital
y
Lith
uan
ia
Latv
ia
Luxe
mb
ou
rg
Mal
ta
Ne
the
rlan
ds
Po
lan
d
Po
rtu
gal
Ro
man
ia
Slo
ven
ia
Slo
vaki
a
Swed
en UK
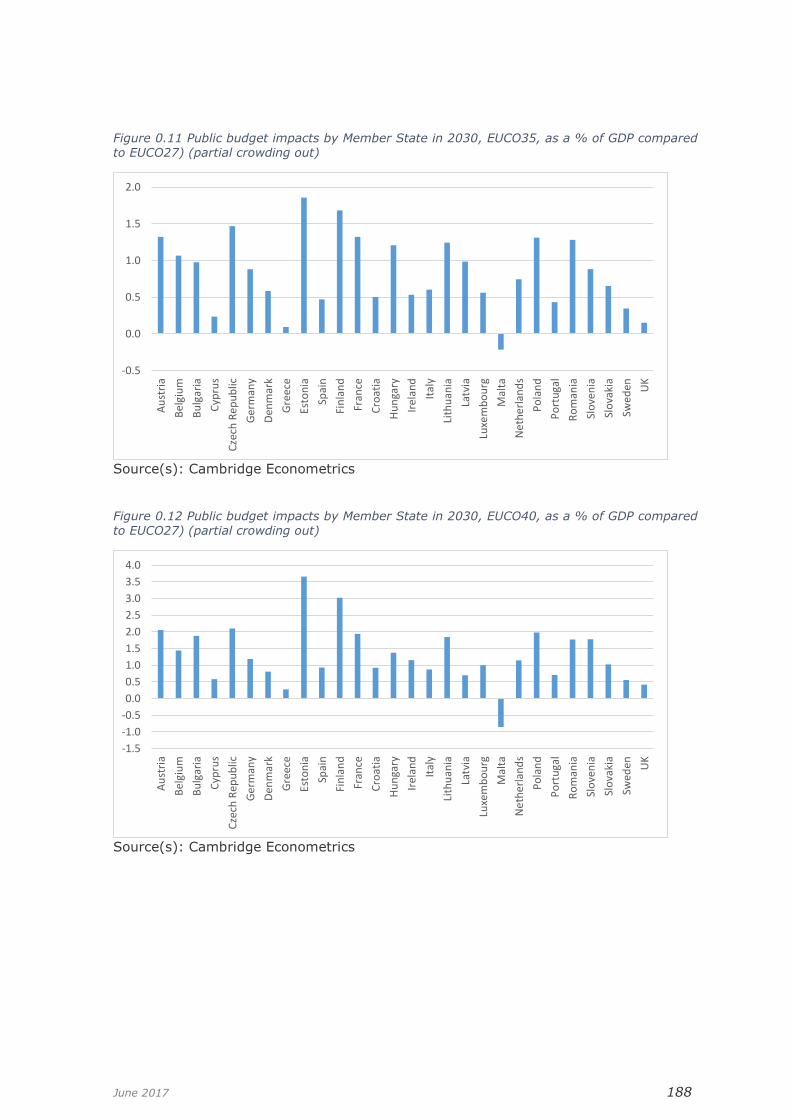
June 2017 188
Figure 0.11 Public budget impacts by Member State in 2030, EUCO35, as a % of GDP compared to EUCO27) (partial crowding out)
Source(s): Cambridge Econometrics
Figure 0.12 Public budget impacts by Member State in 2030, EUCO40, as a % of GDP compared to EUCO27) (partial crowding out)
Source(s): Cambridge Econometrics
-0.5
0.0
0.5
1.0
1.5
2.0
Au
stri
a
Bel
giu
m
Bu
lgar
ia
Cyp
rus
Cze
ch R
epu
blic
Ge
rman
y
Den
mar
k
Gre
ece
Esto
nia
Spai
n
Fin
lan
d
Fran
ce
Cro
atia
Hu
nga
ry
Irel
and
Ital
y
Lith
uan
ia
Latv
ia
Luxe
mb
ou
rg
Mal
ta
Ne
the
rlan
ds
Po
lan
d
Po
rtu
gal
Ro
man
ia
Slo
ven
ia
Slo
vaki
a
Swed
en UK
-1.5
-1.0
-0.5
0.0
0.5
1.0
1.5
2.0
2.5
3.0
3.5
4.0
Au
stri
a
Bel
giu
m
Bu
lgar
ia
Cyp
rus
Cze
ch R
epu
blic
Ge
rman
y
Den
mar
k
Gre
ece
Esto
nia
Spai
n
Fin
lan
d
Fran
ce
Cro
atia
Hu
nga
ry
Irel
and
Ital
y
Lith
uan
ia
Latv
ia
Luxe
mb
ou
rg
Mal
ta
Ne
the
rlan
ds
Po
lan
d
Po
rtu
gal
Ro
man
ia
Slo
ven
ia
Slo
vaki
a
Swed
en UK

June 2017 189
Table 0-27 Environmental Indicators, SO2 & NOx, EUCO27, 2030
No CO Part CO
SO2 NOx SO2 NOx
AT 51 142 51 142
BE 69 196 69 196
BG 281 164 281 164
CY 7 8 7 8
CZ 175 227 175 227
DE 752 1338 752 1338
DK 32 119 32 119
EE 39 37 39 37
EL 261 189 261 189
ES 457 887 457 887
FI 163 169 163 169
FR 310 842 310 842
HR 54 74 54 74
HU 37 114 37 114
IE 81 111 81 111
IT 622 988 622 988
LT 34 61 34 61
LU 1 39 1 39
LV 7 50 7 50
MT 0 2 0 2
NL 62 306 62 306
PL 719 789 719 789
PT 149 124 149 124
RO 169 242 169 242
SI 27 48 27 48
SK 58 77 58 77
SW 63 133 63 133
UK 249 821 249 821
Source(s): E3ME, Cambridge Econometrics
June 2017 190
Table 0-28 Environmental Indicators, SO2 & NOx, EUCO30, 2030, (% difference from EUCO27
scenario)
No CO Part CO
SO2 NOx SO2 NOx
AT 13.5 6.8 13.5 6.8
BE -1.0 -2.1 -1.0 -2.1
BG -3.1 -1.1 -3.1 -1.1
CY 0.3 0.6 0.3 0.6
CZ -0.4 -0.1 -0.4 -0.1
DE 0.4 2.0 0.4 2.0
DK -5.9 -2.6 -5.9 -2.6
EE 1.8 1.7 1.8 1.7
EL 12.0 4.9 12.0 4.9
ES 12.0 7.7 12.0 7.7
FI -3.1 -1.5 -3.1 -1.5
FR -4.1 -3.4 -4.1 -3.4
HR 1.3 0.1 1.3 0.1
HU 36.0 13.8 36.0 13.8
IE -4.7 -1.3 -4.7 -1.3
IT -18.7 -7.2 -18.7 -7.2
LT -1.4 0.1 -1.4 0.1
LU -4.1 -0.8 -4.1 -0.8
LV 0.5 0.6 0.4 0.5
MT -7.0 -0.2 -7.0 -0.2
NL 1.5 -1.0 1.5 -1.0
PL 1.4 2.5 1.4 2.5
PT 5.0 0.8 5.0 0.8
RO 0.4 0.0 0.4 0.0
SI -6.9 -2.2 -6.9 -2.2
SK -1.1 -1.1 -1.1 -1.1
SW 0.7 0.1 0.7 0.1
UK -2.6 -4.5 -2.6 -4.5 Source(s): E3ME, Cambridge Econometrics

June 2017 191
Table 0-29 Environmental Indicators, SO2 & NOx, EUCO33, 2030, (% difference from reference
scenario)
No CO Part CO
SO2 NOx SO2 NOx
AT 14.1 5.8 14.0 5.8
BE -3.4 -4.5 -3.4 -4.5
BG -3.7 -0.6 -3.7 -0.6
CY -3.0 0.0 -2.9 0.0
CZ -5.1 -2.1 -5.0 -2.1
DE -4.1 0.2 -4.2 0.1
DK -15.9 -5.4 -15.9 -5.4
EE -0.6 1.3 -0.6 1.3
EL 10.5 4.6 10.6 4.6
ES 4.2 5.4 4.2 5.4
FI -6.7 -3.4 -6.7 -3.4
FR -9.5 -6.0 -9.5 -6.0
HR 15.7 3.0 15.7 3.0
HU 33.0 13.3 32.7 12.8
IE -10.6 -3.1 -10.6 -3.1
IT -19.4 -8.1 -19.4 -8.2
LT -5.8 0.8 -5.8 0.7
LU -10.9 -1.7 -10.9 -1.7
LV -0.3 1.2 -1.2 0.5
MT 19.2 4.0 19.2 4.0
NL 0.8 -2.4 0.8 -2.4
PL -0.6 2.3 -0.9 2.3
PT -8.7 2.3 -8.7 2.3
RO -0.3 0.3 -0.3 0.1
SI -19.2 -6.0 -20.1 -6.3
SK -12.7 -7.4 -12.7 -7.4
SW -5.2 -1.3 -5.2 -1.3
UK -8.7 -7.3 -8.7 -7.3 Source(s): E3ME, Cambridge Econometrics

June 2017 192
Table 0-30 Environmental Indicators, SO2 & NOx, EUCO35, 2030, (% difference from reference
scenario)
No CO Part CO
SO2 NOx SO2 NOx
AT 24.7 10.6 24.8 10.7
BE -3.6 -4.5 -3.7 -4.5
BG 14.9 9.4 14.9 9.4
CY -9.7 -1.8 -9.5 -1.8
CZ -8.8 -3.6 -8.6 -3.7
DE 0.1 3.1 0.0 2.8
DK -11.4 -1.9 -11.4 -2.0
EE -2.2 1.1 -2.2 1.0
EL 16.3 7.1 16.5 7.0
ES 0.6 4.7 0.6 4.6
FI -3.1 -2.9 -3.2 -3.0
FR -11.6 -6.2 -11.5 -6.2
HR 1.0 0.6 1.0 0.6
HU 44.2 18.5 43.4 17.4
IE -11.4 -3.0 -11.4 -3.1
IT -17.2 -7.6 -17.4 -7.8
LT -7.9 1.0 -7.8 0.7
LU -14.1 -1.9 -14.1 -1.9
LV 0.4 2.0 -1.5 0.6
MT -1.7 2.5 -1.7 2.4
NL 2.8 -2.2 2.8 -2.2
PL 0.3 3.3 -0.6 3.0
PT -11.3 3.7 -11.2 3.3
RO -0.5 0.7 -0.6 0.3
SI -6.0 -0.1 -5.7 -0.4
SK -21.9 -11.7 -21.9 -11.7
SW -8.2 -0.7 -8.3 -0.8
UK -8.8 -7.1 -8.7 -7.0 Source(s): E3ME, Cambridge Econometrics

June 2017 193
Table 0-31 Environmental Indicators, SO2 & NOx, EUCO40, 2030, (% difference from reference
scenario)
No CO Part CO
SO2 NOx SO2 NOx
AT 42.7 10.0 59.7 16.4
BE 1.4 -2.1 0.9 -2.3
BG 9.0 11.5 8.9 11.3
CY -7.0 0.1 -6.5 0.1
CZ 12.1 9.2 12.1 8.4
DE -4.6 0.5 -5.2 -0.6
DK -15.5 -3.5 -14.9 -2.4
EE -6.5 -1.9 -6.7 -2.1
EL 17.8 8.1 16.7 7.1
ES -11.2 -1.2 -11.2 -1.1
FI -1.6 0.0 -2.0 -0.5
FR -14.5 -5.1 -15.2 -6.2
HR 20.5 4.9 20.5 4.7
HU 49.3 22.0 57.6 20.8
IE -13.3 -2.9 -13.3 -3.1
IT -22.7 -10.3 -23.7 -11.0
LT -9.8 2.9 -8.2 1.8
LU -13.8 -1.2 -13.8 -1.3
LV -4.1 1.9 -9.5 -2.3
MT -6.6 4.1 -6.8 3.7
NL 6.0 0.5 5.7 0.5
PL -4.6 0.9 -7.7 -0.1
PT -18.7 10.0 -18.9 7.8
RO 15.4 7.2 14.8 5.5
SI -22.7 -4.0 -20.4 -4.2
SK -35.8 -16.9 -36.6 -17.5
SW -18.6 -5.0 -20.0 -5.5
UK -12.0 -9.6 -11.6 -9.4 Source(s): E3ME, Cambridge Econometrics

June 2017 194
Appendix F Country classification
Table 0-32 Mapping of country abbreviations
Abbreviation Full Member State name
AT Austria
BE Belgium
BG Bulgaria
CY Cyprus
CZ Czech Republic
DE Germany
DK Denmark
EE Estonia
EL Greece
ES Spain
FI Finland
FR France
HR Croatia
HU Hungary
IE Ireland
IT Italy
LT Lithuania
LU Luxembourg
LV Latvia
MT Malta
NL Netherlands
PL Poland
PT Portugal
RO Romania
SI Slovenia
SK Slovakia
SE Sweden
UK United Kingdom
EU EU28

June 2017 195
Appendix G References
1 References in the main report
AEA Technology Environment (2005) ‘Damages per tonne emission of PM2.5, NH3,
SO2, NOx and VOCs from each EU25 Member State (excluding Cyprus) and
surrounding seas’, final report for the European Commission DG Environment.
Environ Health Perspect; DOI:10.1289/ehp.1510037
Part I. Associations of Cognitive Function Scores with Carbon Dioxide, Ventilation, and
Volatile Organic Compound Exposures in Office Workers: A Controlled Exposure Study
of Green and Conventional Office Environments
Allen, JG, P MacNaughton, U Satish, S Santanam, J Vallarino and JD Spengler (2017)
‘Part I. Associations of Cognitive Function Scores with Carbon Dioxide, Ventilation, and
Volatile Organic Compound Exposures in Office Workers: A Controlled Exposure Study
of Green and Conventional Office Environments’, Environ Health Perspectives;
DOI:10.1289/ehp.1510037.
Barker, T, A Dagoumas and J Rubin (2009) ‘The macroeconomic rebound effect and
the world economy’. Energy Efficiency doi: 10.1007/s12053-009-9053-y.
Bloom, B, Nobe, MC, Nobe, MD (2011) ’ Valuing Green Home Designs: A Study of
ENERGY STAR Homes’, The Journal of Sustainable Real Estate, Volume 3 (1), pp109-
126.
Boermans, T, Grözinger, J, von Manteuffel, B, Surmeli-Anac, N, John, A (Ecofys)
Leutgöb, K and Bachner, D (e7) (2015) ‘Assessment of cost optimal calculations in the
context of the EPBD’ (ENER/C3/2013-414) Final report. 19 November 2015, Project
number: BUIDE13705.
Braungardt, S, Eichhammer, W (Project Coordinator), Elsland, R, Fleiter, T, Klobasa,
M, Krail, M, Pfluger, B, Reuter, M, Schlomann, B, Sensfuss, F and Tariq, S (2014)
Fraunhofer Institute for Systems and Innovation Research ISI Lukas.
Brookings Institute (2011) ‘Sizing the Clean Economy: A National and Regional Green
Jobs Assessment’, see http://www.brookings.edu/research/reports/2011/07/13-clean-
economy (accessed December 2016)
Brounen, D, Kok, N, Quigley, JM (2012) ‘Residential energy use and conservation:
Economics and demographics’. European Economic Review Volume 56 (5), pp931-945.
Cedefop (2010), Skills for green jobs: European synthesis report, Publications Office of
the European Union, Luxembourg.
E3MLab and IIASA (2016) ‘Technical report on Member State results of the EUCO
policy scenarios’, see
https://ec.europa.eu/energy/sites/ener/files/documents/20170125_-
_technical_report_on_euco_scenarios_primes_corrected.pdf
Eichholtz, P M A, N Kok and J M Quigley (2010) ‘Doing Well by Doing Good: Green
Office Buildings’, American Economic Review, 2010a, 100(5), pp. 2494–511.
Ekins, P, H Pollitt, P Summerton and U Chewpreecha (2012) ‘Increasing Carbon and
Material Productivity through Environmental Tax Reform’, Energy Policy, Volume 42,
pp 365–376.
EPEE project (2009) ‘European Fuel Poverty and Energy Efficiency’,
https://ec.europa.eu/energy/intelligent/projects/sites/iee-
projects/files/projects/documents/epee_european_fuel_poverty_and_energy_efficienc
y_en.pdf (accessed December 2016)

June 2017 196
Eurofound (2013), ‘Greening of industries in the EU: Anticipating and managing the
effects on quantity and quality of jobs’.
European Commission (2008) ‘European energy and transport: TRENDS TO 2030 —
UPDATE 2007’, see:
https://ec.europa.eu/energy/sites/ener/files/documents/trends_to_2030_update_200
7.pdf
European Commission (2011) ‘Studies on Sustainability Issues – Green Jobs; Trade
and Labour’, final report for DG Employment produced by Cambridge Econometrics,
GHK and the Warwick Institute for Employment Research, see
http://ec.europa.eu/social/BlobServlet?docId=7436&langId=en
European Commission (2013) ‘Energy performance certificates in buildings and their
impact on transaction prices and rents in selected EU countries’, final report by Bio IS
and IEEP, see https://ec.europa.eu/energy/sites/ener/files/documents/20130619-
energy_performance_certificates_in_buildings.pdf (accessed December 2016)
European Commission (2013b) ‘Employment Effects of selected scenarios from the
Energy roadmap 2050’, final report for DG ENER produced by Cambridge
Econometrics, E3MLab, Ernst & Young, Exergia and the Warwick Institute for
Employment Research, see:
https://ec.europa.eu/energy/sites/ener/files/documents/2013_report_employment_eff
ects_roadmap_2050.pdf
European Commission (2014) ‘Energy prices and costs in Europe’, see
https://ec.europa.eu/energy/sites/ener/files/publication/Energy%20Prices%20and%2
0costs%20in%20Europe%20_en.pdf
European Commission (2015a) ‘Energy Performance of Buildings Directive (EPBD)
Compliance Study’, see https://ec.europa.eu/energy/sites/ener/files/documents/MJ-
04-15-968-EN-N.pdf (accessed December 2016)
European Commission (2015b) ‘Assessing the Employment and Social Impact of
Energy Efficiency’, final report for DG ENER produced by Cambridge Econometrics,
E3MLab, ICF International and the Warwick Institute for Employment Research, see:
http://ec.europa.eu/energy/sites/ener/files/documents/CE_EE_Jobs_main%2018Nov2
015.pdf
European Commission (2016a) ‘Commission Staff working document Impact
Assessment’, Accompanying the document Proposal for a Directive of the European
Parliament and of the Council amending Directive 2012/27/EU on Energy Efficiency,
SWD(2016) 405 final, Brussels, 30.11.2016.
European Commission (2016b) ‘Energy prices and costs in Europe’, SWD(2016) 420
final, see
http://ec.europa.eu/energy/sites/ener/files/documents/com_2016_769.en_.pdf
European Environment Agency (2016) ‘Air quality in Europe’, 2016 version, see
https://www.eea.europa.eu/publications/air-quality-in-europe-2016
Fischer-Kowalski, M, F Krausmann, S Giljum, S Lutter, A Mayer, S Bringezu, Y
Moriguchi, H Schutz, H Schandl and H Weisz (2009) ‘Methodology and Indicators of
Economy-wide Material Flow Accounting: State of the Art and Reliability Across
Sources’, Journal of Industrial Ecology, Volume 15, Issue 6, pp 855–876.
French Senate (2015) ‘French Senate Committee Report on the economic and financial
cost of air pollution’, Paris.

June 2017 197
Fthenakis, V and Kim, H C (2009) ‘Land use and electricity generation: A life-cycle
analysis’, Renewable and Sustainable Energy Reviews, Vol 13, Issues 6–7, pp. 1465–
1474.
Fuerst, F, and P McAllister (2011) ‘The Impact of Energy Performance Certificates on
the Rental and Capital Values of Commercial Property Assets’, Energy Policy, volume
39, issue 10, pp 6608-6614.
Fuerst, F (2013) ‘The link between energy efficiency and property values’, retrieved
from https://www.enterprise.cam.ac.uk/news/the-link-between-energy-efficiency-
and-property-values on June 23th 2017.
Healy, J D (2003) ‘Excess winter mortality in Europe: a cross country analysis
identifying key risk factors’, Journal of Epidemiological Community Health, Vol. 57: pp.
784–789.
Healy, J D and J P Clinch (2002) ‘Fuel poverty in Europe: A cross-country analysis
using a new composite measurement’, Environmental Studies Research Series
Working Paper.
Hills, J (2012) ‘Getting the measure of fuel poverty’, final report of the fuel poverty
review, see http://sticerd.lse.ac.uk/dps/case/cr/CASEreport72.pdf (accessed
December 2016)
IEA (2014) ‘Capturing the Multiple Benefits of Energy Efficiency’, OECD/IEA, Paris.
IEA (2016) ‘Energy Efficiency market report 2016’, OECD/IEA, Paris.
Keen, S (2011) ‘Debunking Economics - Revised and Expanded Edition: The Naked
Emperor Dethroned?’, second revised & enlarged edition, Zed books ltd.
Kok, N, and M Jennen (2012) ‘The Impact of Energy Labels and Accessibility on Office
Rents’, Energy Policy, volume 46, issue C, pages 489-497.
Kok, N and Kahn, ME (201) ‘The Value of Green Labelsin the California Housing
Market’ USGBC Diskussion Paper.
Macknick, J, R Newmark, G Heath and K C Hallett (2011) ‘Operational water
consumption and withdrawal factors for electricity generating technologies: a review of
existing literature’, Environmental Research Letters 7 (2012) 045802 (10pp).
McLeay, M, Radia, A and Thomas, R (2014) ‘Money creation in the modern economy’,
Bank of England quarterly bulletin, 2014Q1.
MacNaughton, P, E Eitland, I Kloog, J Schwartz, J Allen J5 (2017) ‘Part I. Impact of
Particulate Matter Exposure and Surrounding "Greenness" on Chronic Absenteeism in
Massachusetts Public Schools’, Int J Environ Res Public Health. 2017 Feb 20;14(2). pii:
E207. doi: 10.3390/ijerph14020207.
MacNaughton, P, U Satish, J Guillermo Cedeno Laurent, S Flanigan, J Vallarino, B
Coull, JD Spengler and JG Allen (2017) ‘Part II. The impact of working in a green
certified building on cognitive function and health’, Int J Environ Res Public Health.
2017 Feb 20;14(2). pii: E207. doi: 10.3390/ijerph14020207.
Mercure, J-F (2012) ‘FTT:Power A global model of the power sector with induced
technological change and natural resource depletion’, Energy Policy, 48, 799–811.
OECD (2014) ‘The Cost of Air Pollution: Health Impacts of Road Transport’, OECD
Publishing, Paris, see http://www.oecd.org/env/the-cost-of-air-pollution-
9789264210448-en.htm
OECD (2016) ‘The Economic Consequences of Outdoor Air pollution’, OECD Publishing,
Paris, see http://www.keepeek.com/Digital-Asset-

June 2017 198
Management/oecd/environment/the-economic-consequences-of-outdoor-air-
pollution_9789264257474-en#page1
Pollin, R, H Garrett-Peltier, J Heintz and B Hendricks (2014) ‘Green Growth: A U.S.
Program for Controlling Climate Change and Expanding Job Opportunities’, Center for
American Progress, see https://cdn.americanprogress.org/wp-
content/uploads/2014/09/PERI.pdf
Pollitt, H and J-F Mercure (2017) ‘The role of money and the financial sector in
energy-economy models used for assessing climate and energy policy’, Climate Policy,
in publication.
RICS (2010) ‘Is sustainability reflected in commercial property prices: An analysis of
the evidence base’, report by Kingston University, London, see:
http://eprints.kingston.ac.uk/15747/1/Sayce-S-15747.pdf (accessed December 2016)
Thomson, H and C Snell (2013) ‘Quantifying the prevalence of fuel poverty across the
European Union’, Energy Policy, Vol. 52: pp. 563-572.
Timmer, M. P., Dietzenbacher, E., Los, B., Stehrer, R. and de Vries, G. J. (2015) ‘An
Illustrated User Guide to the World Input–Output Database: the Case of Global
Automotive Production’, Review of International Economics, Volume 23, pp 575–605.
Ürge-Vorsatz, D, A Novikova, S Köppel and B Boza-Kiss (2009) ‘Bottom–up
assessment of potentials and costs of CO2 emission mitigation in the buildings sector:
insights into the missing elements’, Energy Efficiency, Volume 2, Issue 4, pp 293–316.
WHO (2004) ‘Systematic review of health aspects of air pollution in Europe’, see
http://www.euro.who.int/en/health-topics/environment-and-health/air-
quality/publications/pre2009/health-aspects-of-air-pollution-results-from-the-who-
project-systematic-review-of-health-aspects-of-air-pollution-in-europe
WHO (2014) ‘Ambient (outdoor) air pollution and health factsheet’, WHO Media
Centre, Factsheet N°313, March 2014.
WHO (2016) ‘Health risk assessment of air pollution - general principles’, see
http://www.euro.who.int/__data/assets/pdf_file/0006/298482/Health-risk-
assessment-air-pollution-General-principles-en.pdf?ua=1
Zheng, S, Wu, J, Kahn, ME and Deng, Y (2011) ‘The Nascent Market for “Green” Real
Estate in Beijing’. IRES Working Paper Series. IRES2011-013.
References for the energy security calculation
Germany
https://www.iea.org/publications/freepublications/publication/GermanyOSS.pdf
See page 19
Austria
https://www.iea.org/media/freepublications/security/EnergySupplySecurity2014_Austr
ia.pdf
See page 94
Poland
https://www.iea.org/media/freepublications/security/EnergySupplySecurity2014_Pola
nd.pdf
See page 371

June 2017 199
Czech Republic
https://www.iea.org/publications/freepublications/publication/Energy_Policies_of_IEA_
Countries_Czech_Republic_2016_Review.pdf
See page 123
https://www.iea.org/media/freepublications/security/EnergySupplySecurity2014_TheC
zechRepublic.pdf
See page 137
The UK
https://www.gov.uk/government/uploads/system/uploads/attachment_data/file/5409
23/Chapter_4_web.pdf
See page 97. Point 4.6
2 References in the appendices
2.1 Impacts on the economy and labour market
Acadia Center. (2014). Energy Efficiency: Engine of Economic Growth in Canada.
Available at: http://acadiacenter.org/wp-
content/uploads/2014/11/AcadiaCenter_EnergyEfficiencyEngineofEconomicGrowthin-
Canada_SUMMARY_FINAL_2014_1114.pdf
Association for the Conservation of Energy. (2000). Energy Efficiency and Jobs: UK
Issues and Case Studies. Available at: http://www.ukace.org/wp-
content/uploads/2012/11/ACE-Research-2000-09-Energy-Efficiency-and-Jobs-UK-
Issues-and-Case-Studies-Case-Studies.pdf
Astrov, V., Hanzl-Weiss, D., Leitner, S.M., Pindyuk, O., Pöschl, J. and Stehrer, R.
(2015). Energy Efficiency and EU Industrial Competitiveness: Energy Costs and their
Impact on Manufacturing Activity. Available at: https://wiiw.ac.at/energy-efficiency-
and-eu-industrial-competitiveness-energy-costs-and-their-impact-on-manufacturing-
activity-dlp-3642.pdf
Austrian Energy Agency. (2017). Energy Efficiency Policies and the Rebound Effect.
Available at:
https://www.energyagency.at/fileadmin/dam/pdf/projekte/klimapolitik/CATCH_Review
_Paper_final.pdf
Aydin, E., Kok, N. and Brounen, D. (2014). Energy Efficiency and Household
Behaviour: The Rebound Effect in the Residential Sector. Available at:
http://corporate-
engagement.com/files/publication/ABK%20Rebound%20NK010314.pdf
Barker, T., Dagoumas, A. and Rubin, J. (2009). The Macroeconomic Rebound Effect
and the World Economy. Energy Efficiency.
Bosetti, V., Carraro, C., Massetti, E. and Tavoni, M. (2007). International Energy R&D
Spillovers and the Economics of Greenhouse Gas Atmospheric Stabilization. Available
at: http://scuoledidottorato.unicatt.it/politica-economica-tavoni.pdf
Cambridge Econometrics, GHK and Warwick Institute for Employment Research.
(2011). Studies on Sustainability Issues – Green Jobs; Trade and Labour. Available at:
http://ec.europa.eu/social/BlobServlet?docId=7436&langId=en

June 2017 200
Cambridge Econometrics and Verco. (2012). Jobs, Growth and Warmer Homes.
Evaluating the Economic Stimulus of Investing in Energy Efficiency Measures in Fuel
Poor Homes. Available at:
http://eng.janrosenow.com/uploads/4/7/1/2/4712328/fiscal_impacts_of_energy_effici
ency_programmes.pdf
Cambridge Econometrics, E3MLab/ICCS, IER and ICF. (2015). Assessing the
Employment and Social Impact of Energy Efficiency.
Cantore, N., Cali’, M. and Velde, D.W. (2016). Does Energy Efficiency Improve
Technological Change and Economic Growth in Developing Countries?
Cantore, N., Nussbaumer, P., Wei, M. and Kammen, D.M. (2017). Promoting
Renewable Energy and Energy Efficiency in Africa: a Framework to Evaluate
Employment Generation and Cost Effectiveness. Available at:
http://iopscience.iop.org/article/10.1088/1748-9326/aa51da/pdf
Carnall, M., Dale, L. and Lekov, A. (2011). Effect of Energy Efficiency Standards on
Natural Gas Prices. Available at:
https://digital.library.unt.edu/ark:/67531/metadc831207/m1/1/
Chitnis, M., Sorrell, S., Druckman, A., Firth, S., Jackson, T. (2012). Estimating Direct
and Indirect Rebound Effects for UK Households. Available at:
http://www.sustainablelifestyles.ac.uk/sites/default/files/publicationsdocs/slrg_workin
g_paper_01-12.pdf
De la Rue du Can, S., McNeil, M. and Leventis, G. (2015). Rebound Effects in the
Context of Developing Country Efficiency Programs. Available at:
http://superefficient.org/~/media/Files/Rebound%20effects%20and%20Developing%
20Countries_DRAFT%20FINAL.ashx
Deutsche Bank Group. (2011). Repowering America: Creating Jobs. Available at:
https://www.db.com/cr/de/docs/DB_Repowering_America_Creating_Jobs.pdf
Du, Q. and Bai, L. (2017). The Energy Rebound Effect for the Construction Industry:
Empirical Evidence from China. Available at: http://www.mdpi.com/2071-
1050/9/5/803/pdf
Energy2030. (2015). Accelerate Energy Productivity 2030. Available at:
http://www.energy2030.org/wp-content/uploads/Accelerate-Energy-Productivity-
2030-Report-Part-III.pdf
Environment Northeast, EDR Group and Dunsky Energy Consulting. (2012). Energy
Efficiency: Engine of Economic Growth in Eastern Canada. Available at:
http://www.edrgroup.com/library/energy-environment/energy-efficiency-engine-of-
economic-growth-in-eastern-canda.html
EPA. (2008). Understanding Cost-Effectiveness of Energy Efficiency Programs: Best
Practices, Technical Methods, and Emerging Issues for Policy-Makers. Available at:
http://www.epa.gov/cleanenergy/documents/suca/cost-effectiveness.pdf
European Commission. (2000). Towards a European Strategy for the Security of
Energy Supply. Green Paper.
European Commission. (2013). Member States’ Energy Dependence: Ana indicator-
Based Assessment. Available at:
http://ec.europa.eu/economy_finance/publications/occasional_paper/2013/pdf/ocp145
_en.pdf
European Commission (2014a). A Cold Winter to Come? The EU Seeks Alternatives to
Russian Gas. Available at:
http://eng.janrosenow.com/uploads/4/7/1/2/4712328/fiscal_impacts_of_energy_efficiency_programmes.pdf
http://eng.janrosenow.com/uploads/4/7/1/2/4712328/fiscal_impacts_of_energy_efficiency_programmes.pdf
http://www.energy2030.org/wp-content/uploads/Accelerate-Energy-Productivity-2030-Report-Part-III.pdf

June 2017 201
http://www.europarl.europa.eu/RegData/etudes/STUD/2014/536413/EXPO_STU(2014
)536413_EN.pdf
European Commission (2014b). Energy Economic Developments in Europe. Available
at:
http://ec.europa.eu/economy_finance/publications/european_economy/2014/pdf/ee1_
en.pdf
European Council for an Energy Efficient Economy. (2013). European Competitiveness
and Energy Efficiency: Focusing on the Real Issue. Available at:
file:///C:/Users/agm/Desktop/EEand%20Competitiveness-
focusing%20on%20the%20real%20issue.pdf
Flues, F., Rübbelke, D. and Vögele, S. (2013). Energy Efficiency and Industrial Output:
The Case of the Iron and Steel Industry. Available at:
https://ideas.repec.org/p/fem/femwpa/2013.96.html
Freire-González, J. (2017). Evidence of direct and indirect rebound effect in
households in EU-27 countries, Energy Policy, Volume 102, March 2017, Pages 270–
276.
Friends of the Earth Cymru. (1996). Invest in Energy Efficiency - For Jobs and the
Environment in Pembrokeshire. Available at:
http://www.foe.co.uk/sites/default/files/downloads/pembrokeshire_energy.pdf
Garrett-Peltier, H. (2017). Green versus Brown: Comparing the Employment Impacts
of Energy Efficiency, Renewable Energy, and Fossil Fuels using an Input-Output Model.
Guerra Santin, O. (2013). Occupant Behaviour in Energy Efficient Dwellings: Evidence
of a Rebound Effect. Journal of Housing and Built Environment.
Gillingham, K, Rapson, D. and Wagner, G. (2014), The Rebound Effect and Energy
Efficiency Policy. Available at:
http://www.econ.ucdavis.edu/faculty/dsrapson/Rebound_Effect_GRW.pdf
Greening, L.A., Greene, D.L. and Difiglio, C. (2000). Energy Efficiency and
Consumption – the Rebound Effect – a Survey. Energy Policy.
IEA. (2014). Capturing the Multiple Benefits of Energy Efficiency. Available at:
http://www.iea.org/bookshop/475-
Capturing_the_Multiple_Benefits_of_Energy_Efficiency
IEA/IRENA. (2017). Perspectives for the Energy Transition. Available at:
http://www.irena.org/DocumentDownloads/Publications/Perspectives_for_the_Energy
_Transition_2017.pdf
IEEP. (2013). Review of Costs and Benefits of Energy Savings. Available at:
http://energycoalition.eu/sites/default/files/Energy%20Savings%202030%20IEEP%20
Review%20of%20Cost%20and%20Benefits%20of%20Energy%20Savings%202013.p
df
IMF. (2014). Seven Questions about the Recent Oil Price Slump. Available at:
http://blog-imfdirect.imf.org/2014/12/22/seven-questions-about-the-recent-oil-price-
slump/
Joint Research Centre (2015). Securing Energy Efficiency to Secure the Energy Union
– How Energy Efficiency meets the EU Climate and Energy Goals. Available at:
http://publications.jrc.ec.europa.eu/repository/bitstream/JRC97451/2015-12-
09%20securing%20energy%20efficient%20to%20secure%20the%20energy%20%20
union%20online.pdf

June 2017 202
Joyce, A., Hansen, M.B. and Næss-Schmidt, S. (2013). Monetising the Multiple
Benefits of Energy Efficient Renovations of the Buildings of the EU.
Llorca, M., and Jamasb, T. (2016). Energy Efficiency and Rebound Effect in European
Road Freight Transport. Available at:
https://www.repository.cam.ac.uk/bitstream/handle/1810/262554/cwpe1654.pdf?seq
uence=1&isAllowed=y
Lutz, C., Lehr, U., and Pehnt, M. (2012). Economic Impacts of Energy Efficiency and
Renewable Energy in Germany, 20th International Input-Output Conference.
Meijer, F., Visscher, H., Nieboer, N., Kroese, R. (2012), Jobs Creation through Energy
Renovation of the Housing Stock. Available at:
http://www.neujobs.eu/sites/default/files/publication/2013/01/Energy%20renovation-
D14-2%2019th%20December%202012_.pdf
Maxwell, D., Owen, P., McAndrew. L, Muehmel, K. and Neubauer, A. (2011).
Addressing the Rebound Effect. Available at:
http://ec.europa.eu/environment/eussd/pdf/rebound_effect_report.pdf
McKinsey Global Institute. (2012). Investing in Growth: Europe’s Next Challenge.
Available at: http://www.mckinsey.com/insights/europe/investing_in_growth
Mercure, J-F (2012) ‘FTT:Power A global model of the power sector with induced
technological change and natural resource depletion’, Energy Policy, 48, 799–811.
Nadel, S. (2012). The Rebound Effect. Available at: http://aceee.org/files/pdf/white-
paper/rebound-large-and-small.pdf
Natural Resources Canada. (2012). EcoENERGY Efficiency and Alternative
Transportation Fuels.
http://www.nrcan.gc.ca/sites/www.nrcan.gc.ca/files/oee/files/pdf/corporate/12-0397-
ecoENERGY-Efficiency-and-Alternative-Transportation-Fuels_E.pdf
Navius Research. (2014). Macro-economic Effects of Energy Efficiency Improvements.
March 31.
OECD. (2014). Towards Green Growth in Southeast Asia.
Oliveira, C., Coelho, D. and Pereira da Silva, P. (2014). A Prospective Analysis of the
Employment Impacts of Energy Efficiency Retrofit Investment in the Portuguese
Building Stock by 2020. Available at:
https://journals.aau.dk/index.php/sepm/article/view/261
Pollitt, H. and Mercure, J.-F. (2017). The role of money and the financial sector in
energy-economy models used for assessing climate and energy policy. Climate Policy,
in publication.
Power, A. and Zalauf, M. (2011). Cutting Carbon Costs: Learning from Germany’s
Energy Saving Programme. Available at:
http://sticerd.lse.ac.uk/dps/case/cp/CCCsummary.pdf
Prognos. (2013). Ermittlung der Wachstumswirkungen der KfW-Programme zum
Energieeffizienten Bauen und Sanieren. Available at: https://www.kfw.de/Download-
Center/Konzernthemen/Research/PDF-Dokumente-alle-
Evaluationen/Wachstumseffekte-EBS-Endbericht.pdf
Rajbhandari, A. and Zhang, F. (2017). Does Energy Efficiency Promote Economic
Growth? Evidence from a Multi-Country and Multi-Sector Panel Data Set. Available at:
http://documents.worldbank.org/curated/en/957991496167336779/pdf/WPS8077.pdf

June 2017 203
Scott, M.J., Roop, J.M., Schultz, R.W., Anderson, D.M. and Cort, K. (2008). The impact
of DOE building technology energy efficiency programs on U.S. employment, income,
and investment. Energy Economics.
Stapleton, L., Sorrell, S. and Schwanen, T. (2016). Estimating Direct Rebound Effects
for Personal Automotive Travel in Great Britain. Available at:
http://www.sciencedirect.com/science/article/pii/S0140988316000025
The Energy Efficiency Industrial Forum. (2012). How Many Jobs? A Survey of the
Employment Effects of Investment in Energy Efficiency of Buildings.
Thøgerson, J. and Crompton, Y. (2009). Simple and Painless? The Limitations of Spill-
over in Environmental Campaigning. Journal of Consumer Policy.
UK Energy Research Centre (2014). Low Carbon Jobs: the Evidence for Net Job
Creation from Policy Support for Energy Efficiency and Renewable Energy. Available
at: http://www.ukerc.ac.uk/publications/low-carbon-jobs-the-evidence-for-net-job-
creation-from-policy-support-for-energy-efficiency-and-renewable-energy.html
Ürge-Vorsatz, D., Arena, D., Tirado-Herrero, S., Butcher, A., Telegdy, A.,
Fegyverneky, S., Csoknyai, T., Jankó, A. (2010). Employment Impacts of a Large-
Scale Deep Building Energy Retrofit Programme in Hungary. Available at:
http://3csep.ceu.hu/sites/default/files/field_attachment/project/node-
6234/employment-impactsofenergyefficiencyretrofits.pdf
Vikström, P. (2004). Energy efficiency and energy demand: A historical CGE
Investigation on the rebound effect in the Swedish economy 1957. Umeå: Umeå
University.
Wang, Z., Han, B. and Lu, M. (2016). Measurement of Energy Rebound Effect in
Households: Evidence from Residential Electricity Consumption in Beijing, China.
Wei, M., Patadia, S. and Kammen, D.M. (2010), Putting Renewables and Energy
Efficiency To Work: How Many Jobs Can The Clean Energy Industry Generate in the
U.S.?. Energy Policy.
Wiser, R., Bolinger, M. and Clair, M.S. (2005). Easing the Natural Gas Crisis: Reducing
Natural Gas Prices through Increased Deployment of Renewable Energy and Energy
Efficiency. Available at: https://emp.lbl.gov/sites/default/files/report-lbnl-56756.pdf
Zhang, Y-J. and Peng, H-R. (2017). Exploring the Direct Rebound Effect of Residential
Electricity Consumption: an Empirical Study in China.
2.2 Impacts on health
Ahrentzen, S., Erickson, J. and Fonseca, E. (2015). Thermal and Health Outcomes of
Energy Efficiency Retrofits of Homes of Older Adults.
Bone, A., Murray V., Myers, I., Dengel, A. and Crump, D. (2010). Will Drivers for
Home Energy-efficiency Harm Occupant Health?. Perspect Public Health.
Cambridge Econometrics, E3MLab/ICCS, IER and ICF (2015). Assessing the
Employment and Social Impact of Energy Efficiency.
CSTB, Anses, (2014). Étude Exploratoire du Coût Socio-économique des Polluants de
l’air Intérieur.
Fisk, W.J. (2000). Health and Productivity Gains from Better Indoor Environments and
Their Relationship with Building Energy Efficiency. Available at:
http://www.annualreviews.org/doi/abs/10.1146/annurev.energy.25.1.537?journalCod
e=energy.2

June 2017 204
Gonand, (2015). La Bataille de l’air pur, Nouvel Enjeu écologique et économique du
siècle.
Grey, C.N.B., Jiang, S., Nascimento, C., Rodgers, S.E., Johnson, R., Lyons, R.A. and
Poortinga, W. (2017). The Short-Term Health and Psychosocial Impacts of Domestic
Energy Efficiency Investments of Domestic Energy Efficiency Investments in Low-
Income Areas: a Controlled before and after Study. Available at:
https://orca.cf.ac.uk/98664/1/Grey%20et%20al%202017%20Health%20and%20psyc
hosocial%20benefits%20of%20energy%20efficiency%20investments.pdf
Hamilton, I., Milner, J., Chalabi, Z., Das, P., Jones, B., Shrubsole, C., Davies, M. and
Wilkinson, P. (2015). Health Effects of Home Energy Efficiency Interventions in
England: a Modelling Study. Available at:
http://discovery.ucl.ac.uk/1464071/1/BMJ_Open-2015-Hamilton-.pdf
International Energy Agency. (2014). Capturing the Multiple Benefits of Energy
Efficiency. Available at: https://www.iea.org/bookshop/475-
Capturing_the_Multiple_Benefits_of_Energy_Efficiency
NHBC foundation. (2009). Indoor Air Quality in Highly Energy Efficient Homes – A
Review. Available at:
http://www.zerocarbonhub.org/sites/default/files/resources/reports/Indoor_Air_Qualit
y_in_Highly_Energy_Efficient_Homes_A_Review_NF18.pdf
Oreszczyn, T., Ridley, I., Hong, S.H. and Wilkinson, P. (2006). Mould and Winter
Indoor Relative Humidity in Low Income Households in England.
Pan, W. (2010). Relationships between Air-tightness and its Influencing Factors of
Post-2006 New-build Dwellings in the UK. Building and Environment.
Šadauskienė, J., Paukštys , V. and Banionis, K. (2014). Impact of Air Tightness on the
Evaluation of Building Energy Performance in Lithuania. Energies.
Shrubsole, C., Das, P., Milner, J., Hamilton, I.G., Spadaro, J.V., Oikonomou, E.,
Davies, M. and Wilkinson, P. (2015). A Tale of Two Cities: Comparison of Impacts on
CO2 Emissions, the Indoor Environment and Health of Home Energy Efficiency
Strategies in London and Milton Keynes.
UCL institute of Health Equity. (2011). The health impacts of cold homes and fuel
poverty. Available at: http://www.instituteofhealthequity.org/projects/the-health-
impacts-of-cold-homes-and-fuel-poverty
UCL institute of Health Equity. (2014). How to Improve Health and well-being through
action on affordable warmth. Available at:
https://www.gov.uk/government/uploads/system/uploads/attachment_data/file/3574
09/Review7_Fuel_poverty_health_inequalities.pdf
University of Florida. (2015). Energy Efficient Homes: Indoor Air Quality and Energy.
Available at: https://edis.ifas.ufl.edu/fy1044
Ürge-Vorsatz, D., Novikova, A. and Sharmina, M. (2009). Counting good: quantifying
the co-benefits of improved efficiency in buildings. Available at:
http://www.eceee.org/library/conference_proceedings/eceee_Summer_Studies/2009/
Panel_1/1.316
WHO. (2010). WHO Guidelines for Indoor Air Quality: Selected Pollutants. Available
at: http://www.euro.who.int/__data/assets/pdf_file/0009/128169/e94535.pdf
WHO. (2011). Environmental Burden of Disease Associated with Inadequate Housing.
Available at:
http://www.euro.who.int/__data/assets/pdf_file/0003/142077/e95004.pdf

June 2017 205
2.3 Environmental impacts
ADEME. (2012). Energy Efficiency Trends in industry in the EU. Available at:
http://www.odyssee-mure.eu/publications/br/Industry-indicators-brochure.pdf
Asian Development Bank. (2015). improving energy efficiency and reducing emissions
through intelligent railway station buildings. Available at:
http://www.adb.org/sites/default/files/publication/173696/energy-intelligent-railway-
station.pdf
Aunan, K., Aaheim, H.A. and SEIP, H.M. (2000). Reduced Damage to Health and
Environment from Energy Saving in Hungary. Available at:
http://www.oecd.org/environment/cc/2053956.pdf
Centre for Ecology & Hydrology. (2012). Review of Transboundary Air Pollution
(RoTAP): Acidification, Eutrophication, Ground Level Ozone and Heavy Metals in the
UK.
DECC, 2012, The Energy Efficiency Strategy: The Energy Efficiency Opportunity in the
UK. Available at:
https://www.gov.uk/government/uploads/system/uploads/attachment_data/file/6560
2/6927-energy-efficiency-strategy--the-energy-efficiency.pdf
DEFRA. (2014). Energy from Waste. A Guide to the Debate. Available at:
https://www.gov.uk/government/uploads/system/uploads/attachment_data/file/2846
12/pb14130-energy-waste-201402.pdf
ECONOLER, 2013, Impact Assessment Report of Clean Technology Fund in Renewable
Energy and Energy Efficiency Market in Turkey. Available at:
https://www.climateinvestmentfunds.org/cif/sites/climateinvestmentfunds.org/files/CT
F_Impact_Assessment_Report_Final_130528.pdf
European Environmental Agency. (2009). Annual European Community greenhouse
gas inventory 1990-2007 and European Union emissions inventory report 2009.
European Environment Agency. (2014). Effects of Air Pollution on European
Ecosystems – Past and Future Exposure of European Freshwater and Terrestrial
Habitats to Acidifying and Eutrophying Air Pollutants. Available at:
https://www.eea.europa.eu/publications/effects-of-air-pollution-on
Electric Power Research Institute. (2007). The Power to Reduce CO2 Emissions: The
Full Portfolio. EPRI Technology Assessment Centre.
Emmett, B., Ashmore, M., Britton, A., Broadmeadow, M., Bullock, J., Cape, N.,
Caporn, S.J.M., Carroll, J.A., Cooper, J.R., Cresser, M.S., Crossley, A., D’Hooghe, P.,
De Lange, I., Edmondson, J., Evans, C.D., Field, C., Fowler, D., Grant, H., Green, E.,
Griffiths, B., Haworth, B. et al. (2007). Terrestrial Umbrella: Effects of Eutrophication
and Acidification on Terrestrial Ecosystems.
European Commission. (2010). Report from the Commission on Indirect Land-Use
Change Related to Biofuels and Bioliquids. Available at: http://eur-
lex.europa.eu/LexUriServ/LexUriServ.do?uri=COM:2010:0811:FIN:EN:PDF
Government Accountability Office. (1981). Greater Energy Efficiency Can Be Achieved
Through Land Use Management. Available at: http://www.gao.gov/products/EMD-82-1
Gonce, A. and Somer, K. (2010). Lean for Green Manufacturing. Climate Change
Special Initiative Energy Efficiency.
Green Building Council of Australia. (2013). The Value of Green Star - A Decade of
Environmental Benefits. Available at:
June 2017 206
https://www.gbca.org.au/uploads/194/34754/The_Value_of_Green_Star_A_Decade_o
f_Environmental_Benefits.pdf
Intergovernmental Panel on Climate Change. (2007). Summary for Policymakers. In
B. Metz, O.R. Davidson, P.R. Bosch, R. Dave, and L.A. Meyer, eds. Climate Change
2007: Mitigation. Contribution of Working Group III to the Fourth Assessment Report
of the Intergovernmental Panel on Climate Change. Available at:
http://www.ipcc.ch/pdf/assessment-report/ar4/wg3/ar4-wg3-spm.pdf
Interlaboratory Working Group. (2000). Scenarios for a Clean Energy Future.
Available at: http://www.nrel.gov/docs/fy01osti/29379.pdf
Kutscher, C.F., ed. (2007). Tackling Climate Change in the U.S.: Potential Carbon
Emissions Reductions from Energy Efficiency and Renewable Energy by 2030.
American Solar Energy Society. Available at:
http://ases.org/images/stories/file/ASES/climate_change.pdf
Levy, J.I., Woo, M.K., Penn, S.L., Omary, M., Tambouret, Y., Kim, C.S. and
Arunachalam, S. (2015). Carbon Reductions and Health Co-benefits from US
Residential Energy Efficiency Measures. Available at:
http://iopscience.iop.org/article/10.1088/1748-9326/11/3/034017/pdf
Malekizadeh, M., Zain, M., Ismail, A. and Hami, A. (2013). To Improve Energy
Efficiency via Car Driving Deduction by Land Use Planning. Open Journal of Energy
Efficiency.
National Action Plan for Energy Efficiency. (2008). National Action Plan for Energy
Efficiency Vision for 2025: A Framework for Change. Available at:
http://www.epa.gov/eeactionplan
Park, C., Xing, R., Hanaoka, T., Kanamori, Y. and Masui, T. (2017). Impact of Energy
Efficiency Technologies on Residential CO2 Emissions: a Comparison of Korea and
China. Available at:
http://www.sciencedirect.com/science/article/pii/S1876610217302618
Rio Carrillo, A.M. and Frei, C. (2009). Water: A Key Resource in Energy Production.
Energy Policy.
SEAI. (2011). Economic Analysis of Residential and Small-Business Energy Efficiency
Improvements. Available at:
http://www.seai.ie/Publications/Statistics_Publications/Energy_Forecasts_for_Ireland/
Economic_Analysis_of_Residential_and_Small-
Business_Energy_Efficiency_Improvements.pdf
Sharpe, R. (1980). Improving Energy Efficiency in Community Land-Use-
Transportation systems. Environment and Planning A. Available at:
http://www.envplan.com/abstract.cgi?id=a120203
Shenot, J. (2013). Quantifying the Air Quality Impacts of Energy Efficiency Policies and
Programs. RAP. Available at: http://www.raponline.org/document/download/id/6680
Shirgaokar, M., Deakin, E. and Duduta, N. (2013). Integrating Building Energy
Efficiency with Land Use and Transportation Planning in Jinan, China. Energies.
US Environmental Protection Agency. (2007). Guide to Resource Planning with Energy
Efficiency. Available at:
http://www.epa.gov/cleanenergy/documents/suca/resource_planning.pdf
US Environmental Protection Agency. (2009). Energy Efficiency as a Low-Cost
Resource for Achieving Carbon Emissions Reductions. Available at:
http://www.epa.gov/cleanenergy/documents/suca/ee_and_carbon.pdf

June 2017 207
Vera, S. and Sauma, E. (2015). Does a Carbon Tax Make Sense in Countries with still
High Potential for Energy Efficiency? Comparison between the Reducing-Emissions
Effects of Carbon Tax and Energy Efficiency Measures in the Chilean Case.
World Bank. (2010). ECO2 Cities: Ecological Cities as Economic Cities. Available at:
http://siteresources.worldbank.org/INTURBANDEVELOPMENT/Resources/336387-
1270074782769/Eco2_Cities_Book.pdf
WWF. (2006). Sustainability Standards for Bioenergy. Available at:
http://www.biofuelstp.eu/downloads/WWF_Sustainable_Bioenergy_final_version.pdf
Zhang, S., Worrell, E., Crijns-Graus, W., Wagner, F. and Cofala, J. (2014). Co-benefits
of Energy Efficiency Improvement and Air Pollution Abatement in the Chinese Iron and
Steel Industry. Available at:
http://s3.amazonaws.com/academia.edu.documents/35462764/1-s2.0-
S0360544214011670-
main.pdf?AWSAccessKeyId=AKIAIWOWYYGZ2Y53UL3A&Expires=1498216923&Signat
ure=EhrQSfF67wztnE0VpI3Og7fHA1Y%3D&response-content-
disposition=inline%3B%20filename%3DCo-benefits_of_energy_efficiency_improve.pdf
Zhang, S., Worrell, E. and Crijns-Graus, W. (2015). Evaluating Co-benefits of Energy
Efficiency and Air Pollution Abatement in China’s Cement Industry. Available at:
https://www.researchgate.net/profile/Shaohui_Zhang/publication/273460967_Evaluati
ng_co-
benefits_of_energy_efficiency_and_air_pollution_abatement_in_China's_cement_indus
try/links/550745240cf27e990e056bec.pdf
2.4 Social impacts
Barton, A./Basham, M./Shaw, S. (2004): Central Heating: Uncovering the Impact on
Social Relationships in Household Management. Final report to the EAGA Partnership
Charitable Trust, Peninsula Medical School, Plymouth.
http://www.energybc.ca/cache/globalconsumereconomy/www.carillionenergy.com/do
wnloads/pdf/central_heating.pdf (accessed August 2015).
Bashir, N./Cronin de Chavez, A./Gilbertson, J./Tod, A./Sanderson, E./ Wilson, I.
(2014): An Evaluation of the FILT Warm Homes Service CRESR, Sheffield Hallam
University, Sheffield, www.shu.ac.uk/research/cresr/sites/shu.ac.uk/files/eval-filt-
warm-homes.pdf (accessed August 2015).
Boardman, B. (1991): Fuel Poverty: From Cold Homes to Affordable Warmth.
Belhaven Press: London.
Boardman, B. (2010): Fixing Fuel Poverty. Challenges and Solutions. Earthscan:
London.
Buzar, S. (2007): Energy poverty in Eastern Europe. Ashgate: Aldershot.
Clinch, J.P./Healy, J.D./King, C. (2001): Modelling improvements in domestic energy
efficiency. In: Environmental Modelling & Software, Vol. 16: pp. 87–106.
DECC (2014): Estimated impacts of energy and climate change policies on energy
prices and bills. Annual report.
https://www.gov.uk/government/uploads/system/uploads/attachment_data/file/3844
04/Prices__Bills_report_2014.pdf (Accessed August 2015)
EPC ratings on house prices. Final Project Report to the UK Department for Energy &
Climate Change (DECC).
https://www.gov.uk/government/uploads/system/uploads/attachment_data/file/2071

June 2017 208
96/20130613_-_Hedonic_Pricing_study_-_DECC_template__2_.pdf (Accessed August
2015)
EPEE project (2009) European Fuel Poverty and Energy Efficiency.
https://ec.europa.eu/energy/intelligent/projects/sites/iee-
projects/files/projects/documents/epee_european_fuel_poverty_and_energy_efficienc
y_en.pdf (Accessed August 2015)
Fuerst, F./McAllister, P./Nanda, A./ Wyatt, P. (2013): An investigation of the effect of
EPC ratings on house prices. Final Project Report to the UK Department for Energy &
Climate Change (DECC).
https://www.gov.uk/government/uploads/system/uploads/attachment_data/file/2071
96/20130613_-_Hedonic_Pricing_study_-_DECC_template__2_.pdf (Accessed August
2015)
Grimes, A./Denne, T./Howden-Chapman, P./Arnold, R./Telfar-Barnard, L./Preval,
N./Young, C. (2011): Cost Benefit Analysis of the Warm Up New Zealand: Heat Smart
Program. Report for the Ministry of Economic Development, Motu Economic and Public
Policy Research, Wellington. http://www.healthyhousing.org.nz/wp-
content/uploads/2012/05/NZIF_CBA_report-Final-Revised-0612.pdf (accessed August
2015).
Healy, J. D. (2003): Excess winter mortality in Europe: a cross country analysis
identifying key risk factors. In: Journal of Epidemiological Community Health, Vol. 57:
pp. 784–789.
Healy, J.D. (2004): Housing, Fuel Poverty, and Health: A Pan-European Analysis.
Ashgate Publishing: Aldershot.
Healy, J.D./Clinch, J.P. (2002): Fuel poverty in Europe: A cross-country analysis using
a new composite measurement. Environmental Studies Research Series Working
Paper. http://www.ucd.ie/gpep/research/archivedworkingpapers/2002/02-04.pdf
(Accessed August 2015)
Hermelink, A., 2007. SOLANOVA. The Real Social Housing. Presented at the EU
Sustainable Energy Week. February 1, Brussels, Belgium.
Hong, S.H./Gilbertson, J./Oreszczyn, T./Green, G./Ridley, I./the Warm Front Study
Group (2009): A field study of thermal comfort in low-income dwellings in England
before and after energy efficient refurbishment. In: Building and Environment, Vol.
44: pp. 1228–1236.
Howden-Chapman, P./Matheson, A./Crane, J./Viggers, H./Cunningham, M./Blakely,
T./Cunningham, C./Woodward, A./Saville-Smith, K./O’Dea, D./Kennedy, M./Baker,
M./Waipara, N./Chapman, R./Davie, G. (2007): Effect of insulating existing houses on
health inequality: cluster randomised study in the community. In: British Medical
Journal, Vol. 334: pp. 460-464.
Marmot Review Team (2011): The health impacts of cold homes and fuel poverty.
Report written for Friends of the Earth.
Milne, G./Boardman, B. (2000): Making cold homes warmer: the effect of energy
efficiency improvements in low-income houses. In: Energy Policy, Vol. 28: pp. 411–
424.
Patterson, J. (2012): Arbed 1.0Scheme. Evaluation of the Warm Wales Programme.
http://orca.cf.ac.uk/41181/1/FINAL%20WW%20Arbed%20Report%2008%202012.pdf
(Accessed August 2015)

June 2017 209
Rudge J and Gilchrist R (2005): Excess winter morbidity among older people at risk of
cold homes: a population-based study in a London borough. In: Journal of Public
Health, Vol. 27(4): pp.353–358.
SEAI/Combat Poverty (2009): Effectiveness of Domestic Energy-Efficiency
Programmes. Fuel Poverty Action Research. Report 5: Household Expenditure on Fuel
and Electricity.
http://www.seai.ie/Grants/Warmer_Homes_Scheme/Energy_Poverty_Policy_and_Stud
ies/Fuel_Poverty_Action_Research_Reports/Household_Expenditure_on_Fuel_and_Ele
ctricity.pdf (Accessed August 2015)
Thomson, H./Snell, C. (2013): Quantifying the prevalence of fuel poverty across the
European Union. In: Energy Policy, Vol. 52: pp. 563-572.
Thomson, H./Thomas, S./Sellstrom, E./Petticrew, M. (2009): The Health Impacts of
Housing Improvement: A Systematic Review of Intervention Studies From 1887 to
2007. In: American Journal of Public Health, Vol. 99: pp. 681–692.
UCL institute of Health Equity. (2011). The health impacts of cold homes and fuel
poverty. Available at: http://www.instituteofhealthequity.org/projects/the-health-
impacts-of-cold-homes-and-fuel-poverty
UCL institute of Health Equity. (2014). How to Improve Health and well-being through
action on affordable warmth. Available at:
https://www.gov.uk/government/uploads/system/uploads/attachment_data/file/3574
09/Review7_Fuel_poverty_health_inequalities.pdf
Ürge-Vorsatz, D./Tirado-Herrero, S. (2012): Building synergies between climate
change mitigation and energy poverty alleviation. In: Energy Policy, Vol. 49: pp. 83-
90.
2.5 Impacts on public budgets
ACEA. (2013). ACEA Tax Guide 2013. Available at:
www.acea.be/uploads/publications/ACEA_Tax_Guide_Highlight-
EU_Summary_2014.pdf
ADEME. (2014). ADEME Energy Transition Scenarios 2030-2050. Available at:
http://www.ademe.fr/sites/default/files/assets/documents/ademe-energy-transition-
scenarios-2030-2050-english-french-7942.pdf
Cambridge Econometrics and Verco. (2012). Jobs, Growth and Warmer Homes.
Evaluating the Economic Stimulus of Investing in Energy Efficiency Measures in Fuel
Poor Homes. Available at:
http://eng.janrosenow.com/uploads/4/7/1/2/4712328/fiscal_impacts_of_energy_effici
ency_programmes.pdf
Copenhagen Economics (2012), Multiple Benefits of Investing in Energy-efficient
Renovation of Buildings – Impact on Finances, report commissioned by Renovate
Europe, Renovate Europe, Brussels, www.renovate-
europe.eu/uploads/Multiple%20benefits%20of%20EE%20renovations%20in%20
buildings%20-%20Full%20report%20and%20appendix.pdf (accessed 23 June 2014).
Curtin, J. (2012). From Grants to Finance: How to Unlock Home Retrofit Investment.
Available at: http://www.publicpolicy.ie/wp-content/uploads/From-Grants-to-
Finance1.pdf
ECOFYS. (2016). Public Funding for Energy Efficiency in the EU.
http://www.ecofys.com/en/publications/public-funding-for-energy-efficiency-in-the-
eu/
http://eng.janrosenow.com/uploads/4/7/1/2/4712328/fiscal_impacts_of_energy_efficiency_programmes.pdf

June 2017 210
Grimes A. et al. (2011), Cost Benefit Analysis of the Warm Up New Zealand: Heat
Smart Program, report for the Ministry of Economic Development, Motu Economic and
Public Policy Research, Wellington,
www.motu.org.nz/files/docs/NZIF_CBA_report_Final_Revised_0612.pdf (revised June
2012, accessed 28 June 2014).
Kronenberg, T., W. Kuckshinrichs and P. Hansen (2012), Macroeconomic Effects of the
German Government’s Building Rehabilitation Program, MPRA (Munich Personal RePEc
Archive) Paper 38815, University Library of Munich, Munich, http://mpra.ub.uni-
muenchen.de/38815/1/MPRA_paper_38815.pdf (accessed 23 June 2014).
Kuckshinrichs, W., T. Kronenberg and P. Hansen (2013), “Impact on public budgets of
the KfW promotional programmes “Energy-efficient construction”, “Energy-efficient
refurbishment” and “Energyefficient infrastructure” in 2011”, STE Research Report,
Forschungszentrum Juelich, commissioned by KfW Bankengruppe, Frankfurt,
https://www.kfw.de/Download-Center/Konzernthemen/Research/ Research-
englisch/PDF-Dateien-STE-Reports/STE-Research-Report-April-2013-EN.pdf (accessed
22 June 2014).
Mikulić, D., Rašić Bakarić, I. and Slijepčević, S. (2016). The Socioeconomic Impact of
Energy Saving Renovation Measures in Urban Buildings. Available at:
http://www.tandfonline.com/doi/pdf/10.1080/1331677X.2016.1211952?needAccess=t
rue
OECD (Organisation for Economic Co-operation and Development) (2014),
OECD/European Environment Agency (EEA) database on instruments used for
environmental policy and natural resources management, OECD Publishing, Paris,
www2.oecd.org/ecoinst/queries (accessed 10 February 2014).
OECD (2013), An OECD-Wide Inventory of Support to Fossil Fuel Use and Production,
OECD/Publishing, Paris,
www.oecd.org/site/tadffss/Fossil%20Fuels%20Inventory_Policy_Brief.pdf (accessed
28 June 2014).
OECD (2016) The Economic Consequences of Outdoor Air pollution,
http://www.keepeek.com/Digital-Asset-Management/oecd/environment/the-
economic-consequences-of-outdoor-air-pollution_9789264257474-en#page1
(accessed 13/06/2016).
Rosenaw, J., Platt, R. and Demurtas, A. (2014). Fiscal Impacts of Energy Efficiency
Programmes – the Example of Solid Wall Insulation Investment in the UK. Available
at:
http://eng.janrosenow.com/uploads/4/7/1/2/4712328/fiscal_impacts_of_energy_effici
ency_programmes.pdf
Wünsch, M. et al. (2014), Benefits of Energy Efficiency on the German Power Sector,
Agora Energiewende, Berlin, www.agora-
energiewende.org/fileadmin/downloads/publikationen/Studien/Energieeffizienz/
Agora_ECF_RAP_System_Benefit_Study_short_version_web.pdf (accessed 23 June
2014).
2.6 Impacts on industrial competitiveness
Energy Efficiency Financial institutions Group (2014), “Energy Efficiency – the first fuel
for the EU economy” Available at:
https://www.iea.org/media/workshops/2014/eeu/smenovworkshop/2.4BettinaDorend
orf.pdf
http://eng.janrosenow.com/uploads/4/7/1/2/4712328/fiscal_impacts_of_energy_efficiency_programmes.pdf

June 2017 211
Eurima (2016), European Insulation Manufacturers Association Consultation on the
Review of Directive 2012/27/EU on Energy Efficiency. Available at:
http://www.eurima.org/uploads/ModuleXtender/Publications/141/Eurima_Consultation
_Review_of_Directive_2012-27-EU_on_Energy_Efficiency_Submitted_29012016.pdf
Eurochambers (2016), EUROCHAMBRES response to the public consultation on the
Review of Directive 2012/27/EU on Energy Efficiency, Brussels. Available at:
http://www.eurochambres.eu/custom/ConsEED_ECHfinal_websiteversion-2016-
00010-01.pdf.
European Climate Foundation (2014), "Macro-economic impacts of the low carbon
transition.” Available at:
https://europeanclimate.org/wp-content/uploads/2014/06/EY_ECF_Macro-economic-
impacts-of-the-low-carbon-transition_Report_2014-06-05.pdf
European Commission (2016), Inception Impact Assessment: Review of the Energy
Performance of Buildings Directive, including the 'Smart Financing for Smart Buildings'
initiative. Available at: http://ec.europa.eu/smart-
regulation/roadmaps/docs/2016_ener_001_epbd_smart_buildings_en.pdf
European Council for an Energy Efficient Economy (2016), Enhancing the impact of
energy audits and energy management in the EU. Available at:
http://www.eceee.org/policy-areas/Industry/eceee-report-article-8-review-corrected
ICF International (2015), "Study on energy efficiency and energy saving potential in
industry and on possible policy mechanisms" Available At:
https://ec.europa.eu/energy/sites/ener/files/documents/151201%20DG%20ENER%20
Industrial%20EE%20study%20-%20final%20report_clean_stc.pdf
IEA (2015), "Accelerating Energy Efficiency in small and Medium-sized Enterprises",
Available At:
https://www.iea.org/publications/freepublications/publication/SME_2015.pdf