
Dutch Sectoral Energy Intensity Developments in International
30
TI 2012-049/3 Tinbergen Institute Discussion Paper Dutch Sectoral Energy Intensity Developments in International Perspective, 1987-2005 Peter Mulder 1 Henri L.F. de Groot 1,2,3 1 Faculty of Economics and Business Administration, VU University Amsterdam; 2 Tinbergen Institute; 3 Ecorys NEI.
Transcript of Dutch Sectoral Energy Intensity Developments in International
TI 2012-049/3 Tinbergen Institute Discussion Paper
Dutch Sectoral Energy Intensity Developments in International Perspective, 1987-2005 Peter Mulder1
Henri L.F. de Groot1,2,3
1 Faculty of Economics and Business Administration, VU University Amsterdam; 2 Tinbergen Institute; 3 Ecorys NEI.

Tinbergen Institute is the graduate school and research institute in economics of Erasmus University Rotterdam, the University of Amsterdam and VU University Amsterdam. More TI discussion papers can be downloaded at http://www.tinbergen.nl Tinbergen Institute has two locations: Tinbergen Institute Amsterdam Gustav Mahlerplein 117 1082 MS Amsterdam The Netherlands Tel.: +31(0)20 525 1600 Tinbergen Institute Rotterdam Burg. Oudlaan 50 3062 PA Rotterdam The Netherlands Tel.: +31(0)10 408 8900 Fax: +31(0)10 408 9031
Duisenberg school of finance is a collaboration of the Dutch financial sector and universities, with the ambition to support innovative research and offer top quality academic education in core areas of finance.
DSF research papers can be downloaded at: http://www.dsf.nl/ Duisenberg school of finance Gustav Mahlerplein 117 1082 MS Amsterdam The Netherlands Tel.: +31(0)20 525 8579

Dutch Sectoral Energy Intensity Developments
in International Perspective, 1987–2005
Peter Mulder and Henri L.F. de Groot*
Dept. of Spatial Economics, VU University Amsterdam
De Boelelaan 1105, 1081 HV Amsterdam, The Netherlands
Abstract
This paper makes use of a new dataset to investigate energy intensity developments in the Netherlands over the period 1987–2005. The dataset allows for a comparison with 18 other OECD countries. A key feature of our analysis is that we combine a cross-country perspective with a high level of sectoral detail, covering 49 sectors. Particularly innovative is our evaluation of energy intensity developments in a wide range of Service sectors. We find that across sectors energy intensity levels in the Netherlands on average decreased only marginally, and increased in Services. This performance is in general worse than the OECD average, especially between 1987 and 1995. Changes in the sectoral composition of the economy play an important role in explaining aggregate trends. In the Manufacturing sector about half of the efficiency improvements were undone by a shift towards a more energy-intensive industry structure, while in the Service sector about one-third of the decrease in efficiency was undone by a shift towards a less energy-intensive sector structure.
Keywords: Energy Intensity, Decomposition, Sectoral Analysis
JEL codes: O13, O47, O5, Q43
* Corresponding author: Henri de Groot, E-mail: [email protected]. Henri de Groot is also affiliated to Tinbergen
Institute (Amsterdam-Rotterdam) and Ecorys NEI (Rotterdam). This paper resulted from the research project
‘Environmental Policy and Economics’ initiated by the Dutch Ministry of Economic Affairs. Excellent research
assistance was provided by Adriaan van Hien. The authors gratefully acknowledge useful comments on earlier versions
and the data by Rob Aalbers, Casper van Ewijk, Paul Koutstaal, Rutger Hoekstra, Hans Kolfoort and Reinoud Segers.
The authors alone are responsible for the views expressed in this paper and for any errors or omissions that remain.

1
1. Introduction
In the Netherlands, like in most other developed countries, enhancing the efficient use of energy has been the
goal of many policy initiatives over the past decades. Also in the next decades improving energy efficiency
continues to be an important strategy to help meeting future energy needs in the context of concerns about
greenhouse gas emissions and energy security. A prerequisite for appropriate future projections and policy
design in this area is a careful evaluation of historic and internationally comparative trends as regards the
efficient use of energy. A natural starting point for such an evaluation is an analysis of trends in energy
intensity, i.e. the ratio of energy use per unit of economic activity.
In general, the aggregate energy intensity level of a country can be explained from, respectively,
characteristics in the underlying sector structure and energy productivity performance within individual
sectors. The latter, in turn, is typically thought to be driven by the interplay of energy prices and technological
change (see, for example, Berndt and Wood 1975, Jorgenson 1984, Magnus 1979, Popp 2002, Popp et al.
2010). In addition, various authors have recently argued that environmental regulation and energy abundance
impact industry location via relative prices, thus affecting the sectoral structure and trade activity in a country
or region (Gerlagh and Mathys 2011, Mulatu et al. 2010, Michielsen 2011).
Against this background, the Netherlands is an interesting country to study. Notwithstanding the fact
that reducing energy consumption has been an ambition of the Dutch government for many years – the first
campaign to increase public awareness of energy use dates from the 1970s – the country is, in comparison
with the OECD average, characterized by a high and even increasing energy intensity level (see Table 1).
Table 1 shows that this development combines with a relatively low energy price, high energy abundance and
a high share of energy-intensive sectors in the Dutch economy.
Table 1. The Netherlands in comparison to the OECD average: key indicators, normalized (OECD =1).
Energy
intensity1
Share of energy intensive
sectors2 Energy price3 Energy
abundance4
Share in total final energy consumption:5
Natural gas
Coal & coal products
Petroleum products
1987 0.85 0.97 0.57 1.30 2.46 0.34 0.73
2005 1.14 1.15 0.65 1.28 1.78 0.49 0.84
1 Measured at the aggregate economy level, which is defined as Agriculture + Manufacturing + Services 2 In value added terms. Energy-intensive sectors: Chemicals, Non-Metallic Minerals, Basic Metals, Pulp & Paper, Rubber & Plastics. 3 Sector-specific constant (1997) energy prices, derived from EU KLEMS data on expenditures on intermediate energy inputs that
encompass all energy mining products, oil refining products and electricity and gas products (see section 2 for more detail). 4 Total energy production (ktoe) per capita. Sources: IEA Energy Balances (energy production) and Worldbank (population). 5 Source: IEA Energy Balances.
Energy abundance in the Netherlands mainly derives from its natural gas endowment, which not only
translates into a high share of natural gas in final energy consumption (Table 1) but also into a relative energy
intensive sector structure. The latter is illustrated by Figure 1, which shows the exceptional position of the
Agro-Food Industry and the Chemical sector in the Netherlands.

2
Agriculture
1.8
2.0
2.2
2.4
2.6
2.8
3.0
3.2
3.4
3.6
3.8
0.4 0.6 0.8 1.0 1.2 1.4 1.6
energy share
value added share
1987
2005
Non-commercial Services
Food, Beveragesand Tobacco
Non-MetallicMinerals
Pulp and Paper
OtherManufacturing
Commercial Services
Rubber andPlastics
Chemicals
Basic Metals
0.2
0.4
0.6
0.8
1.0
1.2
1.4
1.6
1.8
2.0
2.2
0.4 0.6 0.8 1.0 1.2 1.4 1.6
energy share
value added share450
Figure 1. Sector structure and energy consumption in the Netherlands, relative to the OECD (normalized, OECD=1)
In short, the position of the Agro-Food Industry is related to a large energy-intensive advanced Horticulture
sector for which natural gas traditionally has been an indispensable input because of the need to have large
scale greenhouses given the Dutch climate. The rise of the energy-intensive Chemical sector coincided with
the development of the Groningen natural gas fields in the Netherlands at the beginning of the 1960s.1
Abundance of natural gas clearly provided a comparative advantage for both sectors by lowering the domestic
price for a key input in the production process. At the same time, there is also evidence that in the 1970s
natural gas export contributed to de-industrialization in the small open economy of the Netherlands via a real
exchange rate appreciation that negatively affected competiveness – a phenomenon that has become known as
the Dutch Disease (Ellman 1981, Kremers 1986, Cordon and Neary 1982).
It is the objective of this paper to further analyze long-term energy intensity trends in the Netherlands
in relation to structural transformations of the economy. An underlying reason, of course, is that energy
policies aim to influence the efficient use of energy within sectors while changes in the economic structure of
a country are in general much less dependent on energy policy mandates. To this aim we will calculate to
what extent aggregate energy intensity trends are to be explained from, respectively, shifts in the underlying
1 This is best illustrated by the history of the company DSM, established in 1902 as a state-owned coal mining company. On behalf of the Dutch Government, DSM was responsible for the exploitation of the Groningen gas fields between 1959 and 2006. After 1965, when the decision was taken to phase out the mining operations, it accelerated its diversification into fertilizers and other chemicals. Currently, the company is also active in the field of food and nutritional products.

3
sector structure (structure effect) and efficiency improvements within individual sectors (efficiency effect). As
such our analysis is related to numerous empirical studies exploring the development and determinants of
energy intensity, energy productivity, or energy efficiency (see, for example, Berndt 1978, Fisher-Vanden et
al. 2004, IEA 2004, Mairet and Decellas 2009, Miketa 2001, Mulder and De Groot 2007, Nilsson 1993, Park
et al. 1993, Schipper and Meyers 1992, Sue Wing 2008, Taylor et al. 2010, Unander 2007, Worell 2004).
Evidently, our focus on the Netherlands implies a particular resemblance to those studies in this area that have
investigated energy efficiency developments in various sectors of the Dutch economy (see, for example,
Boonekamp 1998, Boonekamp et al. 2002;2004, Farla and Blok 2002, Gerdes and Boonekamp 2009, Neelis et
al. 2007, Ramírez et al. 2005).
In an age of globalization, evaluation of trends and determinants of energy intensity in a small open
economy such as the Netherlands clearly gain value when they can be consistently compared to international
developments. Because of limited data availability, existing cross-country energy studies typically come at the
price of limited sectoral detail. This is a serious drawback, because aggregate trends of energy intensity mask
considerable differences across industries and a limited degree of sectoral disaggregation may lead to biased
results as it may obscure shifts from energy intensive to energy extensive subsectors (see, for example, Florax
et al. 2011, Huntington 2010, Mulder 2005). Moreover, although service sectors and energy-extensive
industries are responsible for a considerable and increasing share of energy use in developed countries, most
energy studies continue to focus on the Manufacturing sector with an emphasis on heavy industries (see, for
example, Eichhammer and Mansbart 1997, Fisher-Vanden et al. 2004, Howarth et al. 1991, Lescaroux 2008,
Unander et al. 1999, Unander 2007). In contrast, we make use of a new and unique dataset that allows us to
combine an international perspective with a high level of sector detail, including a wide range of service
sectors. More specifically, we explore energy intensity developments in the Netherlands across 25
Manufacturing sectors (10 main sectors, 15 subsectors), 23 Service sectors (9 main sectors, 14 subsectors) and
the Agricultural sector. We compare those developments with trends in 18 other OECD countries during the
period 1987–2005.
The structure of the paper is as follows. In Section 2 we describe in more detail our data. Section 3
briefly introduces our empirical methodology. In Section 4 we present trends and determinants of energy
intensity in the Netherlands at the aggregate economy level. In Section 5 we take a closer look at the
Manufacturing sector, identifying the role of 25 Manufacturing subsectors. In Section 6 we repeat this
analysis for the Services sector, including an assessment of 23 Service subsectors. Section 7 concludes.

4
2. Data
We make use of the recently developed ‘EU KLEMS Growth and Productivity Accounts’ database
(O’Mahony and Timmer 2009). The EU KLEMS database includes information on both output and energy
input derived from a consistent framework of national accounts and supply-and-use tables and processed
according to agreed procedures. Consequently, and in contrast to related cross-country energy studies, we do
not rely on study-specific ad hoc combinations of energy input and economic output measures from different
sources to analyze trends in energy intensity. Another major advantage of the EU KLEMS database is that it
moves beneath the aggregate economy level by providing a breakdown of industries to a common detailed
level across countries.2
We measure energy intensity by the ratio of intermediate energy input to gross value added. Value
added data have been converted to constant 1997 US$, using a new and comprehensive dataset of industry-
specific Purchasing Power Parities (PPPs) for 1997. These PPP series were constructed in the EU KLEMS
project by double deflation of gross output and intermediate inputs within a consistent input-output
framework. The price concepts for gross output (basic prices) and intermediate inputs (purchasers’ prices)
have been harmonized across countries. Energy use consist of expenditure based intermediate inputs that
encompass all energy mining products, oil refining products and electricity and gas products. Using detailed
supply-and-use tables, energy expenditures at the industry-level have been deflated by the relative price index
of each fuel (energy carrier). We thus take an economic perspective on energy intensity, implicating
differences with related studies for the Netherlands that rely on physical indicators of output and energy
consumption (see for example, Boonekamp 1998, Boonekamp et al. 2004, Farla and Blok 2000, Gerdes and
Boonekamp 2009, Neelis et al. 2007, Ramírez et al. 2005).3
The energy data series in EU KLEMS are provided in terms of volume indices only. Consequently,
the original EU KLEMS database enables direct calculation of energy growth rates – as presented in this study
– but does not allow for direct comparison of energy input levels across countries and across sectors. For this
reason we enriched the EU KLEMS database by establishing a link with physical energy data from the IEA,
according to the following simple two-step procedure. First, for the year 2005 we matched the EU KLEMS
energy volume index number with IEA final energy consumption data in kilo tonnes of oil equivalent (ktoe).
Second, we used the EU KLEMS energy input volume indices to (re)calculate energy consumption in ktoe
back in time. Guided by the sectoral classification that the IEA uses in its Energy Balances, the first step could
2 Additional methodological background papers are available at the EU KLEMS website (www.euklems.net). The EU KLEMS data series are also publicly available at this website. We use the EU KLEMS March 2008 release. 3 The main advantage of using a physical indicator is that it usually establishes a straightforward relationship between output and energy inputs, irrespective of changes in the mix and characteristics of products and feedstock and changes in market-based product prices. However, its application is hindered by difficulties of aggregation across sectors and limited data availability, especially in a cross-country setting. See also Phylippsen et al. (1997) and Worell et al. (1997). To avoid confusion, we consequently speak of energy intensity or energy productivity and do not interpret our results in terms of energy-saving.

5
be done straightforwardly for 10 Manufacturing sectors as well as the aggregate Services and Agricultural
sectors. For the remaining sub-sectors, we applied proportions of sub-sectoral intermediate energy input
expenditures (at purchasers’ prices), as given in EU KLEMS, to IEA final energy consumption data at the
aggregate sector level, again for the year 2005. This procedure rests on the assumption that in 2005 only
within a specific industry average energy prices are identical across sub-sectors.4 It is to be noted that, except
for 2005, physical energy consumption series in our dataset – which are ultimately based on EU KLEMS
energy input volume indices – may deviate from final energy consumption series reported by the IEA.
Differences between the two sources arise from two methodological issues. First, for the most part IEA data
are based on ‘mini questionnaires’ whereas EU KLEMS data are derived from national accounts and supply-
and-use tables. Second, in contrast to IEA, EU KLEMS does not separate out non-energy use (feedstock) and
sales from cogeneration of heat and power (CHP) outside the own sector and/or to the general grid.
Finally, our dataset includes the following countries: twelve EU-15 countries (Austria, Belgium,
Denmark, Finland, France, Germany, Italy, the Netherlands, Portugal, Spain, Sweden and the United
Kingdom), four new EU member states (Czech Republic, Hungary, Poland, Slovakia), the USA, Japan and
South Korea. Because of data consistency reasons throughout this paper OECD is defined by the following
group of countries: Austria, Belgium, Denmark, Finland, France, Germany, Italy, Japan, South Korea, the
Netherlands, Spain, United Kingdom, United States. Because for the Netherlands consistent and reliable data
are available as from 1987, this study covers the period 1987–2005.
3. Methodology
Throughout the paper we use index number decomposition (or shift-share) analysis to decompose changes in
aggregate energy intensity into a structure effect and an efficiency effect. To describe the essence of index
number decomposition methodology algebraically, let i denote the sectors of the economy and let Y and E
represent output (value added) and energy consumption. Aggregate energy intensity I, defined as the ratio of
energy to output, can then be calculated as:
i
iii
i
i
i SIY
Y
Y
E
Y
EI (1)
In this equation, Ii represents the within-sector intensity; Si is the share of the sector in total value added. The
efficiency effect is then calculated as the weighted sum of energy intensity changes of individual sectors (∆Ii)
while keeping the sector composition of the economy constant. Conversely, the structure effect is calculated
as the weighted sum of changes in the value added share of individual sectors (∆Si) while keeping the within-
sector energy intensity constant. Since both the structure effect and the efficiency effect change over time, it is 4 This assumption requires the fuel price level and fuel mix to be the same across subsectors within an industry. This requirement is likely to be met in all Service sectors (that almost exclusively consume electricity) as well as in most Manufacturing sectors, except for the aggregate sector Non-Specified Industry.

6
necessary to establish appropriate weights in order to measure the contribution of each effect. Decomposition
analysis in the field of energy studies have used a variety of weights, which translates into a range of applied
decomposition approaches (see Ang et al. 2003, Ang 2004, Ang et al. 2004, Boyd and Roop 2004, and Zhang
and Ang 2001, for reviews and details). In this study we use the so-called log mean Divisia index method
(LMDI I) as introduced by Ang and Liu (2001).5 The choice for this approach is primarily motivated by its
ability to satisfy the factor-reversal test, i.e. it provides perfect decomposition results without a residual.
Moreover, this approach can handle zero values effectively, the results are invariant to scaling and it satisfies
the time-reversal test, i.e. estimated values between period 0 and T and period T and 0 are equal (in absolute
terms). For these reasons this approach has emerged as a preferred method in energy decomposition analysis
(Ang 2004). 6
In addition it is to be noted that, apart from method and type of indicators, an important factor that
influences decomposition results is the level of sectoral detail that is used. With a limited degree of sector
detail, the calculated efficiency effect becomes less precise because it increasingly includes changes in the
activity- or product mix within the sector, thus including what essentially are disaggregated sector effects.
Because the level of sector detail in this study is relatively high in comparison to existing cross-country
energy decomposition analyses (Liu and Ang 2007), the reported efficiency effects are relatively accurate.
4. Aggregate trends
In this section we analyze the development of energy intensity in the Netherlands at the aggregate economy
level, defined as the sum of the main sectors Manufacturing, Services, and Agriculture. To put these trends in
an international perspective, we provide in Table 2 the annualized growth rates of energy intensity in the
Netherlands as compared to the OECD average, both at the aggregate economy and the sector level. The
Table shows that the annualized energy intensity growth rates in the Netherlands between 1987 and 2005 are
substantially below the OECD average in all periods, but especially in between 1987 and 1995. Remarkably,
our data reveal that in the Netherlands between 1987 and 1995 the aggregate energy intensity level increased,
caused by increasing energy intensity in Manufacturing and Services. For the period 1995–2005 aggregate
energy intensity reduction in the Netherlands equals the EU-12 average, but is considerably lower than the
EU-4 average.
5 In its additive form this method derives, respectively, the efficiency effect (EFF) and structure effect (STR) between period 0 and t according to EFF = ΣwiΔIi and STR = ΣwiΔSi where wi is the weighting function defined as wi = L(Vi,t,Vi,0), with Vi = Σ Ii
Si and L the logarithmic average of two positive numbers a and b which is given by L(a, b) = (a – b) / ln(a / b). A simple relationship exists between the additive and multiplicative form, which thus can be easily related to each other. 6 In the two-factor case, this approach is equivalent to the Fisher ideal index method that is defined as the square root of the product (i.e. geometric average) of the Laspeyres and Paasche indices (Ang 2004, Boyd and Roop 2004). The generalized Fisher approach has its roots in studies by Siegel (1945) and Shapley (1953); see also De Boer (2009).

7
At the sector level, the Netherlands performs below the OECD and EU averages across sectors and
across time, except in Agriculture during the period 1987–1995. As mentioned before, the Dutch agricultural
sector is characterized by a large horticultural subsector – about 80% of energy use in the Agricultural sector
in the Netherlands is caused by greenhouses for vegetables and flowers (NEEDIS 1995) – that in terms of
energy intensity is comparable to basic metals and basic chemicals (Boonekamp et al. 2002). Since the 1990s
capacity for CHP in the Dutch Agricultural sector has become substantial (~ 500MW), inducing annual
savings of around 2 PJ (cf. Boonekamp 1998:81).
Table 2. Average annual growth rates energy intensity by sector.
Average annual growth rates 1987−2005 1987−1995 1995−2005
NACE rev1 code NLD OECD NLD OECD NLD OECD EU-12 EU-4
Macro –0.4 –2.0 1.4 –0.9 –1.7 –2.9 –1.7 –2.8
Manufacturing 15t22, 24t37 –0.2 –2.1 1.1 –0.3 –1.3 –3.7 –1.4 –5.2
Services GtH, J, LtO, 64, 71t74 0.4 –1.3 2.7 –1.2 –1.4 –1.5 –0.8 –2.4
Agriculture AtB –1.1 –1.8 –2.4 –0.6 –0.1 –2.6 –2.3 –4.4
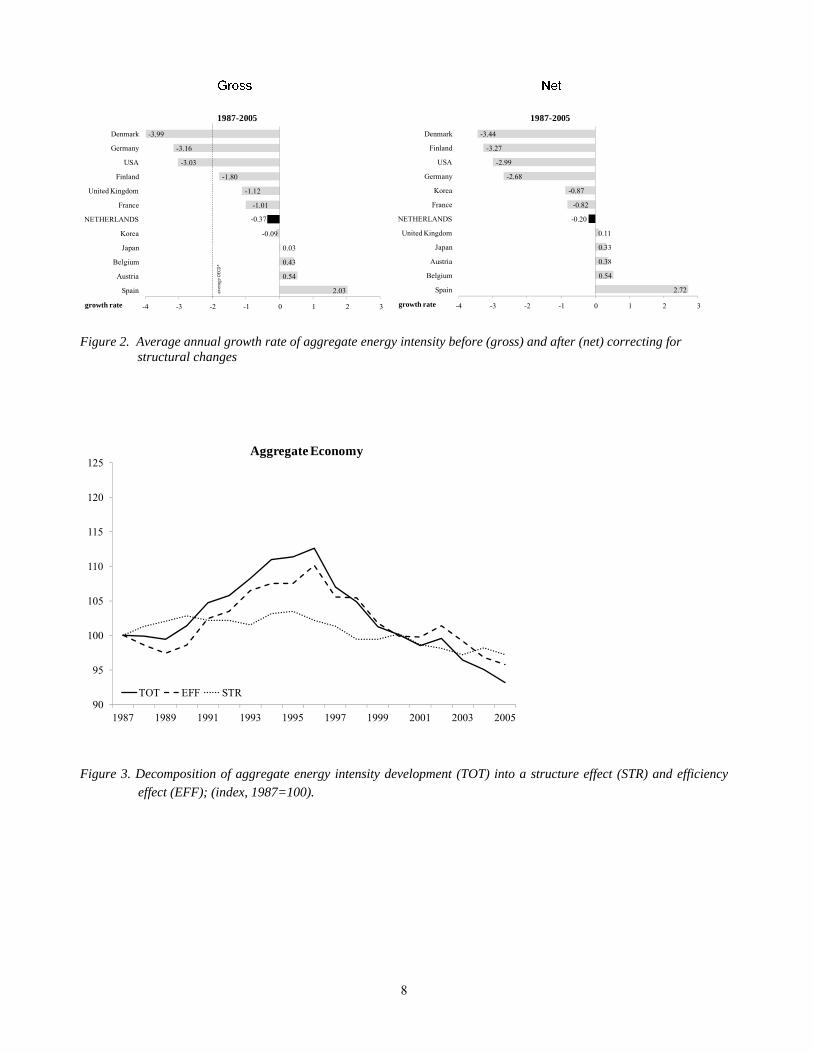
Next we use index number decomposition (or shift-share) analysis to calculate the contribution of,
respectively, energy productivity improvements in individual sectors (efficiency effect) and changes in the
sector composition of the economy (structure effect) to changes in energy intensity at the aggregate economy
level. To put the results of this exercise for the Netherlands in an international perspective, we present in
Figure 2 for 13 OECD countries the average annual growth rates of aggregate energy intensity, before
decomposition (‘Gross’) and after decomposition (‘Net’), i.e. before and after correcting for shifts in the
sectoral composition of the economy (the structure effect).7 The figure shows that measured over the period
1987–2005 at the aggregate economy level energy intensity in the Netherlands decreased on average per year
with 0.37% (cf. Table 2), which reduces to a decrease of 0.2% after correcting for the (positive) impact of
shifts in the sector structure. From the figure it can be seen that with this performance the Netherlands ranks
below average within the OECD.
In Figure 3 we take a closer look at the role of the structure and efficiency effects in driving aggregate
energy intensity in the Netherlands over time. The figure leads to a couple of observations. First, changes in
aggregate energy intensity are predominantly influenced by efficiency changes at the sector level. Second,
before 2000 structural changes have contributed to a higher aggregate energy intensity level, after 2000 the
opposite is true. Third, between 1989 and 1996, both structural changes and negative within-sector energy
productivity growth have contributed to increasing aggregate energy intensity levels.
7 The sample of 13 countries is based on availability of consistent data.
8
Figure 2. Average annual growth rate of aggregate energy intensity before (gross) and after (net) correcting for structural changes
Figure 3. Decomposition of aggregate energy intensity development (TOT) into a structure effect (STR) and efficiency effect (EFF); (index, 1987=100).
2.03
0.54
0.43
0.03
-0.09
-0.37
-1.01
-1.12
-1.80
-3.03
-3.16
-3.99
-4 -3 -2 -1 0 1 2 3
Spain
Austria
Belgium
Japan
Korea
NETHERLANDS
France
United Kingdom
Finland
USA
Germany
Denmark
growth rate
1987-2005
aver
ageOECD*
2.72
0.54
0.38
0.33
0.11
-0.20
-0.82
-0.87
-2.68
-2.99
-3.27
-3.44
-4 -3 -2 -1 0 1 2 3
Spain
Belgium
Austria
Japan
United Kingdom
NETHERLANDS
France
Korea
Germany
USA
Finland
Denmark
growth rate
1987-2005
90
95
100
105
110
115
120
125
1987 1989 1991 1993 1995 1997 1999 2001 2003 2005
Aggregate Economy
TOT EFF STR
9
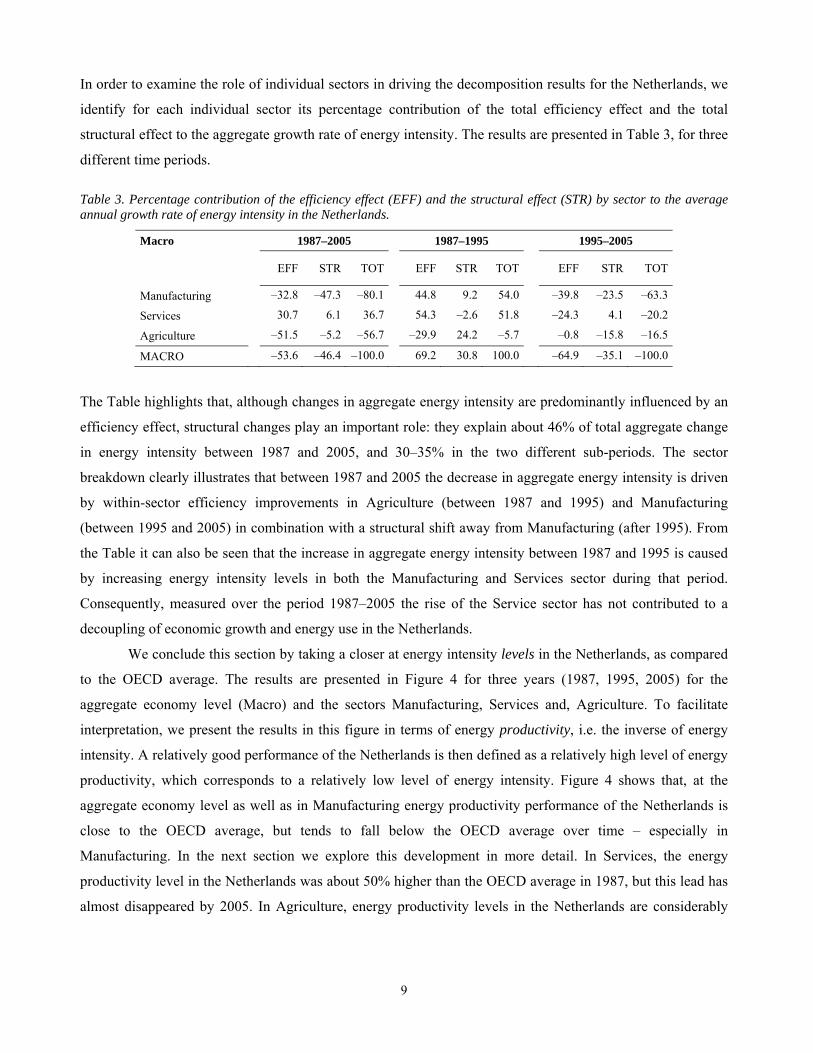
In order to examine the role of individual sectors in driving the decomposition results for the Netherlands, we
identify for each individual sector its percentage contribution of the total efficiency effect and the total
structural effect to the aggregate growth rate of energy intensity. The results are presented in Table 3, for three
different time periods.
Table 3. Percentage contribution of the efficiency effect (EFF) and the structural effect (STR) by sector to the average annual growth rate of energy intensity in the Netherlands.
Macro 1987–2005 1987–1995 1995–2005
EFF STR TOT EFF STR TOT
EFF STR TOT
Manufacturing –32.8 –47.3 –80.1 44.8 9.2 54.0 –39.8 –23.5 –63.3
Services 30.7 6.1 36.7 54.3 –2.6 51.8 –24.3 4.1 –20.2
Agriculture –51.5 –5.2 –56.7 –29.9 24.2 –5.7 –0.8 –15.8 –16.5
MACRO –53.6 –46.4 –100.0 69.2 30.8 100.0 –64.9 –35.1 –100.0
The Table highlights that, although changes in aggregate energy intensity are predominantly influenced by an
efficiency effect, structural changes play an important role: they explain about 46% of total aggregate change
in energy intensity between 1987 and 2005, and 30–35% in the two different sub-periods. The sector
breakdown clearly illustrates that between 1987 and 2005 the decrease in aggregate energy intensity is driven
by within-sector efficiency improvements in Agriculture (between 1987 and 1995) and Manufacturing
(between 1995 and 2005) in combination with a structural shift away from Manufacturing (after 1995). From
the Table it can also be seen that the increase in aggregate energy intensity between 1987 and 1995 is caused
by increasing energy intensity levels in both the Manufacturing and Services sector during that period.
Consequently, measured over the period 1987–2005 the rise of the Service sector has not contributed to a
decoupling of economic growth and energy use in the Netherlands.
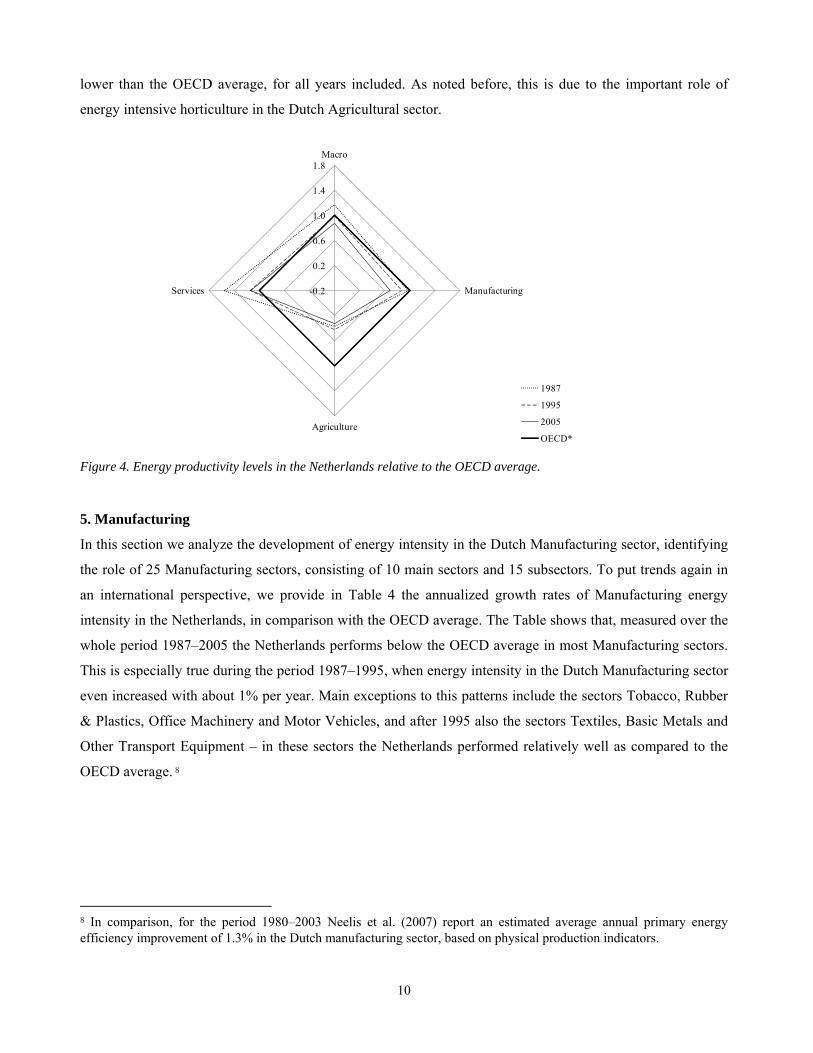
We conclude this section by taking a closer at energy intensity levels in the Netherlands, as compared
to the OECD average. The results are presented in Figure 4 for three years (1987, 1995, 2005) for the
aggregate economy level (Macro) and the sectors Manufacturing, Services and, Agriculture. To facilitate
interpretation, we present the results in this figure in terms of energy productivity, i.e. the inverse of energy
intensity. A relatively good performance of the Netherlands is then defined as a relatively high level of energy
productivity, which corresponds to a relatively low level of energy intensity. Figure 4 shows that, at the
aggregate economy level as well as in Manufacturing energy productivity performance of the Netherlands is
close to the OECD average, but tends to fall below the OECD average over time – especially in
Manufacturing. In the next section we explore this development in more detail. In Services, the energy
productivity level in the Netherlands was about 50% higher than the OECD average in 1987, but this lead has
almost disappeared by 2005. In Agriculture, energy productivity levels in the Netherlands are considerably
10
lower than the OECD average, for all years included. As noted before, this is due to the important role of
energy intensive horticulture in the Dutch Agricultural sector.
Figure 4. Energy productivity levels in the Netherlands relative to the OECD average.
5. Manufacturing
In this section we analyze the development of energy intensity in the Dutch Manufacturing sector, identifying
the role of 25 Manufacturing sectors, consisting of 10 main sectors and 15 subsectors. To put trends again in
an international perspective, we provide in Table 4 the annualized growth rates of Manufacturing energy
intensity in the Netherlands, in comparison with the OECD average. The Table shows that, measured over the
whole period 1987–2005 the Netherlands performs below the OECD average in most Manufacturing sectors.
This is especially true during the period 1987–1995, when energy intensity in the Dutch Manufacturing sector
even increased with about 1% per year. Main exceptions to this patterns include the sectors Tobacco, Rubber
& Plastics, Office Machinery and Motor Vehicles, and after 1995 also the sectors Textiles, Basic Metals and
Other Transport Equipment – in these sectors the Netherlands performed relatively well as compared to the
OECD average. 8
8 In comparison, for the period 1980–2003 Neelis et al. (2007) report an estimated average annual primary energy efficiency improvement of 1.3% in the Dutch manufacturing sector, based on physical production indicators.
-0.2
0.2
0.6
1.0
1.4
1.8Macro
Manufacturing
Agriculture
Services
1987
1995
2005
OECD*

11
Table 4 Average annual growth rates manufacturing energy intensity by subsector.
Average annual growth rates NACE rev1 code
1987−2005 1987−1995 1995−2005
NLD OECD NLD OECD NLD OECD EU-12 EU-4
MANUFACTURING 15t22, 24t37 –0.2 –2.1 1.1 –0.3 –1.3 –3.7 –1.4 –5.1
MANUFACTURING without CHEMICALS 15t22, 26t37 –0.1 –2.0 1.1 –0.2 –1.0 –3.5 –1.1 –6.8
FOOD , BEVERAGES AND TOBACCO 15t16 –0.4 –0.6 0.3 –0.7 –1.0 –0.6 0.7 –2.7
Food and beverages 15 –0.3 –1.7 0.5 –2.0 –1.0 –1.4 0.1 –2.9
Tobacco 16 –1.5 3.0 –2.3 1.1 –0.9 3.8 1.1 0.9
TEXTILES, LEATHER AND FOOTWEAR 17t19 –0.1 –0.6 2.6 –0.5 –2.2 –0.7 0.3 –3.0
Textiles 17t18 –0.3 –0.9 2.1 –0.9 –2.2 –0.9 0.1 –2.3
Leather and footwear 19 1.3 0.5 6.6 0.5 –2.9 0.3 1.1 –8.1
WOOD AND CORK 20 2.5 0.5 6.0 1.8 –0.4 –0.4 1.7 –0.1
PULP, PAPER , PRINTING AND PUBLISHING 21t22 0.3 –1.4 1.2 0.8 –0.5 –3.1 –0.4 0.3
Pulp and paper 21 –0.4 –2.0 2.1 1.5 –2.4 –4.7 –1.8 –0.2
Printing, publishing and reproduction 22 0.9 –1.1 1.7 –1.0 0.2 –0.9 –0.5 –0.5
CHEMICALS 24 –1.3 –2.6 0.6 –0.9 –2.8 –4.1 –2.9 5.2
NON-METALLIC MINERALS 26 1.0 –1.4 2.0 –2.1 0.2 –0.9 –0.2 –11.4
BASIC METALS 27 –0.6 –0.9 2.4 0.0 –3.0 –1.5 0.2 0.2
MACHINERY 28t32 0.7 –4.3 1.6 –2.5 0.0 –5.3 –2.5 –9.8
Fabricated metal 28 0.9 –1.2 0.8 –1.2 1.0 –1.1 –1.1 –8.4
Machinery n.e.c. 29 –0.7 –1.7 0.6 –1.3 –1.8 –2.0 –1.2 –8.2
Office, accounting and computing machinery 30 –10.3 –10.0 –20.0 –8.1 –2.6 –11.0 –8.5 –17.6
Electrical engineering 31t32 3.4 –7.6 4.8 –4.5 2.3 –10.1 –5.5 –10.1
TRANSPORT EQUIPMENT 34t35 –2.0 –1.8 1.0 –0.8 –4.4 –2.6 –1.3 –10.5
Motor vehicles, trailers and semi-trailers 34 –3.8 –2.5 –5.0 –1.3 –2.9 –3.4 –1.2 –14.4
Other transport equipment 35 –0.2 –0.9 5.7 –0.5 –4.9 –1.2 –2.5 –1.1
NON-SPECIFIED INDUSTRY 25,33,36t37 0.4 –0.2 0.9 1.4 –0.1 –1.2 –0.3 –6.7
Rubber and plastics 25 –1.5 –0.8 –2.1 –0.1 –0.9 –1.4 –0.6 –6.2
Medical, precision and optical instruments 33 –0.9 –0.6 –0.7 1.5 –1.1 –2.1 –3.5 –0.5
Manufacturing n.e.c.; recycling 36t37 4.4 0.2 6.6 1.6 2.6 –0.8 1.6 –7.6

12
In Table 4 we also present energy intensity trends for the Manufacturing sector excluding Chemicals. We
do so for two reasons. First, the Chemical sector plays a major and still increasing role in Dutch
Manufacturing, in 2005 accounting for 43% of Manufacturing energy use and 28% of Manufacturing
value added. Second, in the Chemical industry a substantial part of total energy consumption consists of
non-energy use, which we cannot separate out because of the EU KLEMS framework definition of
intermediate energy inputs. Table 4 shows that once we exclude Chemicals, the average reduction in
energy intensity in the aggregate Manufacturing sector reduces from 0.2% to only 0.1% per year between
1987 and 2005.
Of course, the observed energy intensity changes at the aggregate Manufacturing level can again
result from efficiency changes at the level of individual Manufacturing sectors and from changes in the
composition of the Manufacturing sector. Again, we use index number decomposition analysis to identify
the role of these two effects in driving the observed trends in aggregate Manufacturing energy intensity.
To put these results in an international perspective, we provide in Figure 5 again for 13 OECD countries
the annualized growth rates of Manufacturing energy intensity in the Netherlands, before (‘Gross’) and
after (‘Net’) correcting for the impact of shifts in the Manufacturing sectoral structure.
Figure 5. Average annual growth rate Manufacturing energy intensity before (gross) and after (net) correcting for structural changes
The figure shows that measured over the period 1987–2005 in this period gross Manufacturing energy
intensity in the Netherlands decreased on average per year with 0.23% (cf. Table 4), which after
correcting for the (negative) impact of shifts in the Manufacturing sector structure improves to a decrease
of 0.54%. From the figure it can be seen that with this performance the Netherlands ranks below average
within the OECD in terms of decreasing Manufacturing energy intensity.
Gross Net
2.58
0.88
0.75
0.56
0.41
-0.54
-0.82
-1.52
-2.03
-2.45
-3.01
-3.29
-4.08
-5 -4 -3 -2 -1 0 1 2 3
Spain
Korea
Japan
Belgium
United Kingdom
NETHERLANDS
Austria
Denmark
France
Germany
USA
Finland
Portugal
growth rate
1987-2005
2.38
0.57
0.13
-0.23
-0.54
-0.99
-1.48
-1.81
-2.19
-2.46
-4.00
-4.10
-5.07
-5 -4 -3 -2 -1 0 1 2 3
Spain
Belgium
United Kingdom
NETHERLANDS
Austria
Japan
France
Korea
Denmark
Germany
Portugal
USA
Finland
growth rate
1987-2005
aver
ageOECD

13
In Figure 6 we take a closer look at the role of the structure and efficiency effects in driving
aggregate Manufacturing energy intensity in the Netherlands over time. The upper part of Figure 6 clearly
shows that until 2000 changes in aggregate Manufacturing energy intensity are predominantly influenced
by efficiency changes at the individual sector level, while structural changes only play a minor role. More
specifically, during the first half of the 1990s energy efficiency levels in Dutch Manufacturing decreased
(causing an increase in the energy intensity level), followed by substantial energy efficiency
improvements in the post-1995 period.
Figure 6. Decomposition of manufacturing energy intensity development (TOT) into a structure effect (STR) and efficiency effect (EFF); (index, 1987=100).
90
95
100
105
110
115
120
125
1987 1989 1991 1993 1995 1997 1999 2001 2003 2005
Manufacturing
TOT EFF STR
90
95
100
105
110
115
120
125
1987 1989 1991 1993 1995 1997 1999 2001 2003 2005
Manufacturing without Chemicals
TOT EFF STR

14
However, the figure also shows that since 2000 these efficiency improvements are partly undone by a
shift towards a more energy-intensive Manufacturing structure. Measured over the whole period 1987–
2005, these trends add up to a relatively small decrease in Manufacturing energy intensity as compared to
other OECD countries (cf. Figure 5). The lower part of Figure 6 shows that if we exclude Chemicals,
throughout the period 1987–2005 changes in the composition of the Manufacturing sector have lowered
aggregate Manufacturing energy intensity in the Netherlands. However, also in this case it can be seen
that since 2000 this positive impact of structural changes gradually disappears. In sum, Figure 6 suggests
that the recent move towards a more energy-intensive Manufacturing structure is largely but not
exclusively driven by the Chemical sector.
In order to further examine the role of individual sectors in driving these results, we identify for
each individual Manufacturing sector its percentage contribution of the total efficiency effect and the total
structural effect to the growth rate of energy intensity at the aggregate Manufacturing level. The results
are presented in Table 5, again for three different time periods. The Table highlights that, although
changes in Manufacturing energy intensity are predominantly influenced by an efficiency effect,
structural changes play an important and negative role: between 1987 and 2005 about half of the
efficiency improvements were undone by shift towards a more energy-intensive industry structure
(133.6% versus –233.6%); between 1995 and 2005 this percentage is about one-third (146.2% versus
46.2%). In contrast, between 1987 and 1995 structural changes contributed only marginally (with 5.4%)
to a decrease in aggregate energy intensity. Once we exclude Chemicals, structural changes even explain
virtually all decrease in aggregate Manufacturing energy intensity (108.6% of 100%) between 1987 and
2005.
The sectoral breakdown in Table 5 shows that the overall decrease in Manufacturing energy
intensity between 1987 and 2005 is mainly driven by developments in Food and Beverages, Textiles, Pulp
and Paper, Chemicals and Basic Metals. The contribution of Textiles is mainly caused by a structural
effect, while in Food and Beverages, Pulp and Paper and Basic Metals structural changes and
considerable energy efficiency improvements reinforce each other in their contribution to a decreasing
aggregate manufacturing energy intensity level. In contrast the Chemical sector is characterized by a
considerable improvement in energy efficiency and a substantial increase of its share in total
Manufacturing value added – the former being insufficient to compensate for the latter, as a result of
which its net contribution is an increase in aggregate Manufacturing energy intensity. Underlying data
indicate that growth in the Dutch Chemical sector has largely been realized by the energy-intensive sub-

15
sector Basic Industrial Chemicals. Consequently, once we exclude Chemicals from our sample the sign of
the structure effect reverses, measured over the period 1987–2005.9
Table 5. Average percentage contribution of the efficiency effect and the structural effect by Manufacturing subsector to the average annual growth rate of energy intensity in the Dutch manufacturing sector.
1987–2005 1987–1995 1995–2005
EFF STR TOT EFF STR TOT
EFF STR TOT
Food and beverages –24.0 –38.0 –62.0 8.5 5.1 13.6
–13.2 –15.6 –28.8
Tobacco –2.0 0.5 –1.5 –0.7 0.8 0.1 –0.2 –0.3 –0.5
Textiles –1.5 –17.3 –18.8 3.0 –4.2 –1.2
–1.9 –3.1 –5.1
Leather and footwear 0.3 –1.3 –1.0 0.5 –0.4 0.1
–0.1 –0.2 –0.4
Wood and Cork 4.9 –0.3 4.6 2.7 0.7 3.4
–0.2 –0.7 –0.9
Pulp and paper –8.2 –14.9 –23.1 10.8 –9.7 1.0
–9.3 1.4 –8.0
Printing, publishing, etc. 8.8 –11.4 –2.6 3.8 –0.3 3.5
0.4 –3.6 –3.2
Chemicals –235.2 290.7 55.5 20.3 31.5 51.8
–92.3 74.1 –18.2
Non-Metallic Minerals 24.6 –36.4 –11.8 10.1 –10.5 –0.4
1.0 –4.4 –3.4
Basic Metals –37.0 –13.2 –50.2 32.1 –19.9 12.2
–32.5 8.4 –24.1
Fabricated metal 13.3 0.1 13.3 2.4 3.5 5.9
2.7 –2.6 0.1
Machinery n.e.c. –6.9 4.1 –2.8 1.2 –1.4 –0.2
–3.0 2.2 –0.8
Office machinery, etc. –7.5 7.7 0.2 –3.7 4.9 1.1
–0.4 –0.3 –0.7
Electrical engineering 41.1 –45.1 –4.1 13.0 –8.0 5.0
5.2 –10.0 –4.7
Motor vehicles, trailers, etc. –8.1 5.3 –2.9 –2.1 0.8 –1.3
–1.0 1.0 0.0
Other transport equipment –0.4 –1.1 –1.5 3.0 –0.2 2.8
–2.1 –0.3 –2.4
Rubber and plastics –13.8 5.2 –8.6 –4.3 2.9 –1.4 –1.5 –0.2 –1.7
Medical instruments etc. –1.0 2.6 1.6 –0.1 0.4 0.2 –0.2 0.6 0.3
Manufacturing n.e.c.; recycling 19.1 –3.6 15.4 5.1 –1.4 3.7 2.4 –0.1 2.3
MANUFACTURING –233.6 133.6 –100.0 105.4 –5.4 100.0 –146.2 46.2 –100.0
MANUFACTURING without Chemicals 8.1 –108.1 –100.0 138.9 –38.9 100.0
–113.7 13.7 –100.0
In addition, Table 5 shows that the remarkable increase in the aggregate Manufacturing energy intensity
level between 1987 and 1995 was driven by increasing energy intensity levels in most Manufacturing
sectors – main exceptions include Tobacco and Office Machinery (cf. Table 4). Similarly, the reverse of
this aggregate trend after 1995 was driven by decreasing energy intensity levels in most Manufacturing
9 Exact figures for individual sectors in this case only differ from those in Table 3 in terms of magnitude and not in sign; hence, we not present them separately, also given considerations regarding the size of the paper. Details are available upon request.

16
sectors, including the large energy intensive ones. The latter confirms results presented by other sources,
including Boonekamp et al. (2002) and Neelis et al. (2007).10
We conclude this section by taking a closer at energy intensity levels across Manufacturing
sectors, as compared to the OECD average in these sectors. The results are presented in Figure 7 for three
years (1987, 1995, 2005). Again, to facilitate interpretation, we present the results in terms of energy
productivity, i.e. the inverse of energy intensity. A relative good performance of the Netherlands is then
defined as a relatively high level of energy productivity, which corresponds to a relatively low level of
energy intensity.
Figure 7. Energy productivity levels of manufacturing sectors in the Netherlands compared to OECD average.
The figure leads to a couple of observations. First, in the energy-intensive sectors Chemicals and Basic
Metals as well as in the sector Motor vehicles etc. energy productivity performance of the Netherlands is
close to the OECD average. Second, energy productivity levels in the Netherlands are (considerably)
above the OECD average in the sectors Printing etc., Leather and Footwear, Tobacco, Medical and other
Instruments, and Rubber and Plastics, and Non-Metallic Minerals. Third, over time the relative
performance of the energy-intensive sectors Chemicals and especially Non-Metallic Minerals tends to
10 Our results compare relatively well the findings of SenterNovem (2006:16), who reports a total energy-efficiency improvement of 19.1% between 1998 and 2005, equivalent to about 2.4% per year. According to their findings, 66% of the energy-efficiency improvements is caused by process efficiency, 13% is due to renewable energy use and 21% results from energy saving product development.
0.0
0.5
1.0
1.5
2.0
2.5Food and beverages
Tobacco
Textiles
Leather and footwear
Wood and cork
Pulp and paper
Printing, publishing and reproduction
Chemicals
Non-metallic minerals
Basic metals
Rubber and plastics
Fabricated metal
Office, accounting and computing machinery
Electrical engineering
Medical, precision and optical instruments
Machinery nec
Motor vehicles, trailers and semi-trailers
Other transport equipment
1987
1995
2005
OECD*
17
decline. Finally, in Food and Beverages, Machinery not elsewhere classified, Electrical Engineering and
Fabricated Metal energy productivity levels in the Netherlands are much below the OECD average, for all
years included.
6. Services
In this section we analyze the development of energy intensity in the Dutch Service sector, identifying the
role of 23 Service sectors, consisting of 9 main sectors and 14 subsectors. To put trends again in an
international perspective, we provide in Table 6 the annualized growth rates of Services energy intensity
in the Netherlands, in comparison with the OECD average. The Table shows that at the aggregate Service
sector level performance is substantially below the OECD average, except for the period 1995–2005
when the rate of decrease in energy intensity very much resembles the OECD average and is above the
EU-12 average. If we compare energy productivity growth in individual Dutch service sectors with the
OECD average, we can see that in the Netherlands the decrease in energy intensity was particularly above
average in the sectors Post and Telecommunications, Renting of machinery and equipment, Computer and
related activities and Sewage and refuse disposal, sanitation and similar activities. After 1995 this also
holds for Activities related to financial intermediation, Research and Development, and Recreational,
cultural and sporting activities. In contrast, energy intensity performance in the Dutch Service sector was
especially lower than the OECD average in the sectors Hotels and Restaurants, Activities related to
financial intermediation (1987–1995), Public Administration and Other service activities. The same holds
for performance after 1995 as compared with the EU-12 average, except for Public Administration –
where performance in the Netherlands is very close to the EU-12 average.
Of course, the energy intensity changes at the aggregate Service level can again result from
efficiency changes at the level of individual sectors and from changes in the composition of the Services
sector. Again, we use index number decomposition analysis to identify the role of these two effects in
driving the observed trends in aggregate Services energy intensity. To put these results in an international
perspective, we provide in Figure 8 again for 13 OECD countries the annualized growth rates of Services
energy intensity in the Netherlands, before (‘Gross’) and after (‘Net’) correcting for the impact of shifts in
the Services sectoral structure. The figure shows that measured over the period 1987–2005 in this period
gross Services energy intensity in the Netherlands increased on average per year with 0.42% (cf. Table 6),
which after correcting for the (positive) impact of shifts in the Services sector structure deteriorates to an
increase of 0.62%. From the figure it can be seen that the former result is close to the OECD average,
while the latter results (i.e. the net energy efficiency improvement at constant sector structure) is
substantially below the OECD average.

18
Table 6. Average annual growth rates energy intensity by Services subsector.
Average annual growth rates NACE rev1 code
1987−2005 1987−1995 1995−2005
NLD OECD NLD OECD NLD OECD EU-12 EU-4
SERVICES GtH, J, LtO, 64,71t74 0.4 –1.3 2.7 –1.2 –1.4 –1.5 –0.8 –2.4
WHOLESALE AND RETAIL TRADE G –0.6 –1.7 1.6 –1.6 –2.3 –1.7 –1.0 –5.3
Sale etc. of motor vehicles and motorcycles; retail sale of fuel 50 1.2 –1.8 3.8 –1.2 –0.9 –2.2 0.3 1.0
Wholesale trade and commission trade, except motor vehicles etc. 51 –0.5 –1.8 1.7 –2.1 –2.3 –1.6 –2.6 –8.2
Retail trade, except motor vehicles etc.; repair of household goods 52 0.1 –1.4 2.3 –0.7 –1.6 –2.0 0.6 –4.6
HOTELS AND RESTAURANTS H 2.1 0.6 4.1 0.7 0.5 0.5 0.1 –2.1
POST AND TELECOMMUNICATIONS 64 –6.3 –1.4 –6.2 –2.2 –6.3 –0.9 –3.3 –9.7
FINANCIAL INTERMEDIATION J 1.3 –0.9 4.7 0.1 –1.4 –1.6 –0.6 0.4
Financial intermediation, except insurance and pension funding 65 1.2 –1.7 5.0 –0.9 –1.9 –1.9 –2.3 –3.5
Insurance and pension funding, except compulsory social security 66 1.0 3.0 1.6 4.3 0.5 2.4 5.3 10.1
Activities related to financial intermediation 67 2.5 –2.0 9.8 –2.7 –3.3 1.2 0.2 –11.7
RENTING, COMPUTER, R&D and OTHER BUSINESS 71t74 0.5 –0.4 2.8 –0.7 –1.4 –0.2 –1.1 –6.8
Renting of machinery and equipment 71 0.4 3.4 1.6 7.4 –0.5 0.0 –0.8 –1.5
Computer and related activities 72 –2.0 –1.7 –1.1 –0.9 –2.8 –2.4 –3.0 –2.8
Research and development 73 2.5 1.4 10.8 –0.1 –4.1 1.7 –0.6 0.5
Other business activities 74 1.0 0.1 2.3 0.2 0.0 0.1 –0.7 –7.8
PUBLIC ADMIN AND DEFENCE; COMPULSORY SOCIAL SECURITY L 3.8 –1.0 7.1 0.6 1.1 –2.3 1.0 –0.3
EDUCATION M 0.9 –0.9 2.2 –0.2 –0.1 –1.5 1.4 2.5
HEALTH AND SOCIAL WORK N –0.2 –3.4 2.5 –5.2 –2.3 –1.9 –2.2 0.5
OTHER COMMUNITY, SOCIAL AND PERSONAL SERVICES O 0.4 0.0 1.1 0.3 –0.1 –0.3 –0.1 2.3
Sewage and refuse disposal, sanitation and similar activities 90 –2.7 0.5 –4.8 1.3 –1.0 1.2 2.4 3.3
Activities of membership organizations nec 91 0.2 –0.1 0.9 –0.2 –0.4 0.1 0.2 –1.4
Recreational, cultural and sporting activities 92 1.1 1.0 4.4 2.6 –1.6 –0.1 –0.7 –0.1
Other service activities 93 2.5 0.7 2.7 1.4 2.3 0.2 –0.9 2.4

19
Figure 8. Average annual growth rate Service sector energy intensity before (gross) and after (net) correcting for structural changes.
In Figure 9 we take a closer look at the role of the structure and efficiency effects in driving aggregate
Services energy intensity in the Netherlands over time. From the figure it can be seen that since 1987 for
most of the time changes in aggregate Services energy intensity are predominantly influenced by within-
sector efficiency developments.
Figure 9. Decomposition of Services energy intensity development (TOT) into a structure effect (STR) and efficiency
effect (EFF); (index, 1987=100).
Also, Figure 9 shows that between 1990 and 2000, both the increase and subsequent decrease of Services
energy intensity are primarily driven by an efficiency effect. During the same period, structural changes
played only a minor role, in the form of slightly enhancing Service sector energy intensity. Since 2000,
however, structural changes have started to play a more prominent and different role. More specifically,
Gross Net
3.59
3.59
2.41
1.12
0.50
0.50
0.42
0.26
-0.01
-1.02
-1.90
-2.69
-4.72
-7 -6 -5 -4 -3 -2 -1 0 1 2 3 4 5 6
Austria
Spain
Japan
France
Belgium
Finland
NETHERLANDS
Korea
United Kingdom
USA
Portugal
Germany
Denmark
growth rate
1987-2005
aver
ageOECD
3.54
3.54
2.58
0.62
0.55
0.53
0.17
0.05
-0.08
-1.17
-1.32
-2.41
-4.56
-7 -5 -3 -1 1 3 5
Austria
Spain
Japan
NETHERLANDS
Belgium
Finland
United Kingdom
Korea
France
USA
Portugal
Germany
Denmark
growth rate
1987-2005
90
95
100
105
110
115
120
125
1987 1989 1991 1993 1995 1997 1999 2001 2003 2005
Services
TOT EFF STR
20
since 2000 changes in the sector composition have contributed to a lower level of aggregate energy
intensity in the Service sector – contrary to the period before 2000.
In order to further examine the role of individual sectors in driving these results, we identify for
each individual Services sector its percentage contribution of the total efficiency effect and the total
structural effect to the growth rate of energy intensity at the aggregate Services level. The results are
presented in Table 7, again for three different time periods. The Table shows that between 1987 and 2005
about one-third of the negative efficiency improvements were undone by shifts towards a less energy-
intensive sector structure; between 1995 and 2005 structural changes explain about 30% of the decrease
in energy intensity. In contrast, between 1987 and 1995 the contribution of structural changes is virtually
zero.
The sectoral breakdown in Table 7 shows that the overall increase in aggregate energy intensity
between 1987 and 2005 is mainly driven by developments in Wholesale and Commission Trade, Hotels
and Restaurants, Other Business Activities and Public Administration. The contribution of Wholesale and
Commission Trade is mainly caused by a structural effect, while Hotels and Restaurants as well as Public
Administration contribute through a negative efficiency effect. In Other Business Activities structural
changes and energy efficiency improvements reinforce each other in their contribution to an increasing
aggregate Service sector energy intensity level. In addition, the Table shows that in contrast several other
sectors contribute to decreasing aggregate Service sector energy intensity level, most notably the
subsectors Retail Trade, Education, Health and Social Work, and Sewage and Refuse Disposal. Except for
Sewage and Refuse disposal, these contributions result mainly from structural changes. Moreover, from
Table 7 it can be seen that in the sector Post and Telecommunication a considerable energy efficiency
improvement has been compensated by an increasing weight in total Service sector value added. After
1995, the total efficiency effect is mainly driven by energy efficiency improvements in Wholesale trade
and Commission trade, Retail Trade, and Health and Social Work.

21
Table 7. Average percentage contribution of the efficiency effect and the structural effect by Services subsector to the average annual growth rate of energy intensity in the Dutch services sector.
1987–2005 1987–1995 1995–2005
EFF STR TOT EFF STR TOT
EFF STR TOT
Sale etc. of motor vehicles and motorcycles; retail sale of fuel 12.9 –5.3 7.6 6.2 –2.1 4.1
–3.0 0.6 –2.4
Wholesale trade and commission trade, except motor vehicles etc. –13.0 66.3 53.3 6.3 11.1 17.3 –18.5 18.3 –0.3
Retail trade, except motor vehicles etc.; repair of household goods 4.4 –30.9 –26.4 11.7 –4.3 7.3 –13.8 –9.6 –23.4
Hotels and restaurants 49.1 –27.8 21.3 14.9 –0.5 14.4 3.6 –14.8 –11.2
Post and telecommunications –21.2 17.0 –4.2 –2.7 0.3 –2.4 –4.5 6.0 1.5
Financial intermediation, except insurance and pension funding 5.5 5.9 11.4 3.2 0.0 3.2 –2.8 3.5 0.7
Insurance and pension funding, except compulsory social security 2.1 –1.2 0.9 0.5 0.8 1.3 0.3 –1.8 –1.5
Activities related to financial intermediation 2.4 0.1 2.6 1.6 0.1 1.8 –1.3 –0.1 –1.4
Renting of machinery and equipment 0.3 3.3 3.6 0.2 0.9 1.1 –0.1 0.3 0.1
Computer and related activities –3.6 14.1 10.5 –0.2 1.9 1.6 –1.7 4.3 2.6
Research and development 7.4 –3.5 3.9 6.1 –0.6 5.5 –4.7 –1.4 –6.2
Other business activities 13.7 18.7 32.4 4.3 6.7 11.0 0.2 –1.0 –0.9
Public admin and defence; compulsoray social security 90.6 –42.6 47.9 25.1 –6.5 18.7 8.8 –13.6 –4.8
Education 15.9 –50.5 –34.6 6.2 –8.6 –2.4 –0.3 –12.6 –12.9
Health and social work –5.8 –19.5 –25.3 13.7 –2.7 11.1 –22.0 –6.3 –28.3
Sewage and refuse disposal, sanitation and similar activities –43.3 27.5 –15.8 –11.1 6.8 –4.3 –4.0 2.9 –1.1
Activities of membership organizations nec 0.8 –3.0 –2.2 0.6 0.2 0.8 –0.5 –1.7 –2.2
Recreational, cultural and sporting activities 17.4 –4.5 13.0 10.9 –2.1 8.8 –7.7 0.8 –6.9
Other service activities 11.8 –11.7 0.1 1.9 –0.9 1.1 3.1 –4.6 –1.5
SERVICES 147.5 –47.5 100.0 99.6 0.4 100.0 –69.1 –30.9 –100.0

22
We conclude this section by taking a closer at energy intensity levels across Services sectors, as compared
to the OECD average in these sectors. The results are presented in Figure 10 for three years (1987, 1995,
2005). Again, to facilitate interpretation, we present the results in terms of energy productivity, i.e. the
inverse of energy intensity. A relative good performance of the Netherlands is then defined as a relatively
high level of energy productivity, which corresponds to a relatively low level of energy intensity.
Figure 10. Energy productivity level of services sectors in the Netherlands relative to OECD average.
The figure leads to a couple of observations. First, energy productivity levels in the Netherlands are much
above the OECD average in the sectors Machinery and Equipment rental, Post and Telecommunications,
Wholesale and Commission Trade, and to a lesser extent also in Insurance and Pension Funding. Second,
energy productivity levels in the Netherlands are (considerably) below the OECD average in the sectors
Recreation etc., Sewage and Refusal Disposal, Education, Hotels and Restaurant, and to a lesser extent
also in Research & Development.
0.0
0.5
1.0
1.5
2.0
2.5
3.0
Sale and service of vehicles; retail sale of fuel
Other wholesale and commission trade
Other retail trade
Hotels& restaurants
Post & telecommunications
Financial intermediation
Insurance & pension funding
Financial intermediation -related activities
Machinery and equipment rentalComputer & related
activitiesResearch & development
Other business activities
Public admin & defence; compulsory social
security
Education
Health & social work
Sewage & refuse disposal, sanitation etc.
Membership organizations nec
Recreation, culture, sport
Other services
1987
1995
2005
OECD*

23
7. Conclusions
This paper makes use of a new dataset to investigate energy intensity developments in the Netherlands
over the period 1987–2005, in comparison with 18 other OECD countries. We found that between 1987
and 2005 energy intensity in the Netherlands decreased on average with 0.4% points per year at the
aggregate economy level. For Manufacturing and Agriculture the figures are, respectively, 0.2% and 1.1%
points. In contrast, during the same period in Services energy intensity increased on average with 0.4%
points. These aggregate results are predominantly determined by efficiency changes within individual
sectors, but changes in the sectoral composition of the economy also play an important role. In the
Manufacturing sector, between 1987 and 2005 about half of the efficiency improvements (in total about
0.5% points per year) were undone by a shift towards a more energy-intensive industry structure; between
1995 and 2005 this percentage is about one-third. This pattern is largely driven by the Chemicals sector,
which has strengthened its dominant position in Dutch Manufacturing over time. In the Service sector, on
the contrary, structural changes helped in decreasing energy intensity: between 1987 and 2005 about one-
third of the decrease in efficiency (in total about 0.6% points per year) was undone by a shift towards a
less energy-intensive sector structure; between 1995 and 2005 structural changes explain about 30% of
the decrease in energy intensity.
Considering our results from an international perspective, we found that energy intensity growth
rates in the Netherlands are in general below the OECD average, especially between 1987 and 1995.
Remarkably, our data reveal that in the Netherlands between 1987 and 1995 the aggregate energy
intensity level increased, caused by increasing energy intensity in Manufacturing and Services. After
1995, however, in terms of decreasing energy intensity various Dutch Manufacturing subsectors perform
above OECD average while in Services the rate of decrease in energy intensity very much resembles the
OECD average. In terms of energy intensity levels, at the aggregate economy level as well as in
Manufacturing energy productivity performance of the Netherlands is close to the OECD average, but
tends to fall below the OECD average over time – especially in Manufacturing. In Services, the energy
intensity level in the Netherlands was about 50% lower than the OECD average in 1987, but this lead has
almost disappeared by 2005. On the contrary, in Agriculture, energy intensity levels in the Netherlands
are considerably higher than the OECD average, for all years under consideration. This is due to the
important role of energy intensive horticulture in the Dutch Agricultural sector.
In short, these results suggest that natural gas abundance in the Netherlands has a long-term
impact on energy intensity trends through both a structure effect and an efficiency effect. The former
effect is best witnessed by the recent transition towards a more energy-intensive manufacturing structure
that is largely driven by the Chemical sector. The latter effect is revealed by the relatively high energy

24
intensity levels within sectors throughout the Dutch economy, including the non-tradable sectors. One
may argue that these findings are a certain reflection of Dutch Disease: evidence of a relative decline of
Dutch energy productivity performance in response to natural gas discoveries. But specialization in
energy-intensive activities because of a comparative advantage may also very well be interpreted as a
symptom of ordinary substitution effects and well–functioning economic markets. An assessment of the
welfare effects involved requires a thorough examination of the implied benefits and costs, including the
environmental externalities of energy consumption. From an environmental perspective, given the
existence of the European Emission Trading Scheme (ETS) and Dutch energy policies, in theory it may
be better to have energy-intensive industries in the Netherlands than to import energy-intensive
manufacturing goods from outside the European Union. However, the effectiveness of the ETS is yet to
be proven and recent evidence shows that over the last decade energy policies in the Netherlands have
been remarkably ineffective and increasingly less stringent, especially in the energy intensive
manufacturing sectors (Algemene Rekenkamer 2011, De Buck et al. 2010). Hence, it remains to be seen
whether the relatively poor energy productivity of the Netherlands is a Dutch disease after all.

25
References
Algemene Rekenkamer (2011). ‘Energy saving: ambitions and results’: The Hague: Algemene Rekenkamer (The
Court of Audit).
Ang, B.W. (2004). ‘Decomposition for Policymaking in Energy: Which is the Preferred Method?’, Energy Policy,
32, pp. 1131−1139.
Ang, B.W. and F.L. Liu (2001). ‘A new energy decomposition method: perfect in decomposition and consistent in
aggregation’, Energy, 26, pp. 537−547.
Ang, B.W., F.L. Liu and E.P. Chew (2003). ‘Perfect decomposition techniques in energy and environmental
analysis’, Energy Policy, 31, pp. 1561−1566.
Ang B.W., F.L. Liu and H. Chung (2004). ‘A generalized Fisher index approach to energy decomposition analysis’,
Energy Economics, 26, pp. 757−763.
Boonekamp, P.G.M. (1998). Monitoring Energieverbruik 1982–1996, Petten: ECN-C-98-046.
Boonekamp, P.G.M., R. Harmsen, A. Kets and M. Menkveld (2002). Besparingstrends 1990–2000; Besparing,
instrumenten en effectiviteit, Petten: ECN-C-02-015.
Boonekamp, P.G.M., A. Gijssen and H.H.J. Vreuls (2004), Gerealiseerde energiebesparing 1995 -2002. Conform
Protocol Monitoring Energiebesparing, report number ECN-C--04-016, Petten, ECN.
Berndt, E.R. (1978). ‘Aggregate Energy, Efficiency, and Productivity Measurement’, Annual Review of Energy, 3,
pp. 225–273.
Berndt, E.R. and D.O. Wood (1975). ‘Technology, Prices, and the Derived Demand for Energy’, The Review of
Economics and Statistics 57, pp. 259-268.
Boer, P. de (2009). ‘Generalized Fisher index or Siegel-Shapley Decomposition?’, Energy Economics, 31, pp.
810−814.
Boyd, G.A. and J.M. Roop (2004). ‘A note on the Fisher ideal index decomposition for structural change in energy
intensity’, The Energy Journal 25, pp. 87–101.
Buck, A. de, Blom, M.J., Smit, M. and L.M.L. Wielders (2010). ‘Convenant Benchmarking Energie-efficiency:
resultaten en vrijstellingen energiebelasting’, Delft: CE.
Corden, W. M. and J.P. Neary (1982), ‘Booming Sector and De-industrialisation in a Small Open Economy’,
Economic Journal 92, pp. 825-48.
Eichhammer, W. and W. Mannsbart (1997). ‘Industrial Energy Efficiency: Indicators for a European Cross-Country
Comparison of Energy Efficiency in the Manufacturing Industry’, Energy Policy, 25, pp. 759−772.
Ellman, M. (1981), ‘Natural Gas, Restructuring and Re-industrialisation: The Dutch Experience of Industrial
Policy’, in: T. Barker and V. Brailovsky, Oil or Industry?, London: Academic Press.
Farla, J.C.M. and K. Blok (2002). ‘Industrial long-term agreements on energy efficiency in the Netherlands. A
critical assessment of the monitoring methodologies and quantitative results’, Journal of Cleaner Production,
10, pp. 165–182.
Fisher, I. (1922), The Making of Index Numbers, Boston: Houghton Mifflin.
Fisher-Vanden, K., G.H. Jefferson, H.M. Liu and Q. Tao (2004). ‘What’s Driving China’s Decline in Energy
Intensity?’, Resource and Energy Economics, 26, pp. 77−97.

26
Florax, R.J.G.M., H.L.F. de Groot and P. Mulder (2011). Improving Energy Efficiency through Technology: Trends,
Investment Behaviour and Policy Design, Cheltenham: Edward Elgar.
Gerdes, J. and P.G.M. Boonekamp (2009). Energiebesparing in Nederland 1995–2007, Petten: ECN-E-09-040.
Gerlagh, R. and N.A. Mathys (2011). ‘Energy Abundance, Trade and Industry Location’, FEEM Working Paper No.
3.2011.
Howarth, R.B., L. Schipper, P.A. Duerr and S. Strøm (1991). ‘Manufacturing Energy Use in 8 OECD Countries’,
Energy Economics, 13, pp. 135−142.
Huntington, H.G. (2010). ‘Structural Change and U.S. Energy Use: Recent Patterns’, Energy Journal 31, pp. 25–39.
International Energy Agency (IEA), 2004, Oil Crises and Climate Challenges – 30 Years of Energy Use in IEA
Countries, Paris: OECD.
Jorgenson, D.W. (1984). ‘The Role of Energy in Productivity Growth’, Energy Journal 5, pp. 11−26.
Kremers, J.J.M. (1986). ‘The Dutch disease in the Netherlands’, in: J.P. Neary and S.J.G. van Wijnbergen, Natural
resources and the macro economy, Blackwell, Oxford, pp. 96-136.
Lescaroux, F. (2008). ‘Decomposition of US Manufacturing Energy Intensity and Elasticities of Components with
espect to Energy Prices’, Energy Economics, 30, pp. 1068−1080.
Liu, N. and B.W. Ang (2007). ‘Factors Shaping Aggregate Energy Intensity Trend for Industry: Energy Intensity
versus Product Mix’, Energy Economics, 29, pp. 609−635.
Mairet, N. and F. Decellas (2009). ‘Determinants of Energy Demand in the French Service Sector: A Decomposition
Analysis’, Energy Policy, 37, pp. 2733−2744.
Magnus, J.R. (1979). ‘Substitution between Energy and Non-Energy Inputs in the Netherlands 1950-1976’,
International Economic Review 20, pp. 465-484.
Michielsen, T. (2011). ‘The Distribution of Energy-Intensive Sectors in the US’, Tilburg: CentER Working Paper
No. 2011-075
Miketa, A. (2001). ‘Analysis of Energy Intensity Developments in Manufacturing Sectors in Industrialized and
Developing Countries’, Energy Policy, 29, pp. 769−775.
Miketa, A. and P. Mulder (2005). ‘Energy-Productivity Across Developed and Developing Countries in 10
Manufacturing Sectors: Patterns of Growth and Convergence’, Energy Economics, 27, pp. 429−453.
Mulatu A., R. Gerlagh, D. Rigby, and A. Wossink (2010), Environmental Regulation and Industry Location in
Europe, Environmental and Resource Economics 45, pp. 459-479.
Mulder, P. (2005). The Economics of Technology Diffusion and Energy Efficiency, Cheltenham: Edgar Elgar.
Mulder, P. and H.L.F. de Groot (2007). ‘Sectoral Energy- and Labour Productivity Convergence’, Environmental
and Resource Economics, 36, pp. 85−112.
NEEDIS (1995). Sectorstudie Landbouw en Visserij, Report NDS-95-005, Petten: NEEDIS/ECN.
Neelis, M.K., C.A. Ramírez, M.K. Patel, J. Farla, P. Boonekamp and K. Blok (2007). ‘Energy Efficiency
Developments in the Dutch Energy-Intensive Manufacturing Industry, 1980–2003’, Energy Policy, 35, pp.
6112−6131.
Nilsson, L. (1993). ‘Energy Intensity in 31 Industrial and Developing Countries 1950−88’, Energy, 18, pp. 309−322.
O’Mahony, M. and M.P. Timmer (2009). ‘Output, Input and Productivity Measures at the Industrial Level: The EU
KLEMS Database’, Economic Journal, 119, pp. F347−F403.

27
Park, S.H., B. Dissmann and K.Y. Nam (1993). ‘A Cross-Country Decomposition Analysis of Manufacturing
Energy Consumption’, Energy, 18, pp. 843−858.
Phylipsen, G.J.M., K. Blok and E. Worell (1997). ‘International Comparisons of Energy-Efficiency-Methodologies
for the Manufacturing Industry’, Energy Policy 25, pp.715-725.
Popp, D. (2002). ‘Induced Innovation and Energy Prices’, American Economic Review 92, pp. 160-180.
Popp, D.. Newell, R.G. and A.B. Jaffe (2010), ‘Energy, the Environment, and Technological Change’, in: Hall, B.
and N. Rosenberg, Handbook of the Economics of Innovation (vol.2), Academic Press/Elsevier, pp. 873-937.
Ramírez, C.A., M. Patel and K. Blok (2005). ‘The Non-Energy Intensive Manufacturing Sector. An Energy Analysis
Relating to the Netherlands’, Energy, 30, pp. 749−767.
SenterNovem (2006), Meerjarenafspraken Energie-Efficiency; Resultaten 2005, Report 3MJAF0635, Utrecht:
SenterNovem
Schipper, L. and S. Meyers (1992), Energy Efficiency and Human Activity: Past Trends and Future Prospects,
Cambridge: Cambridge University Press.
Shapley, L.S. (1953). ‘A value for n-person games’, in: Kuhn, H. and A.W. Tucker, Contributions to the Theory of
Games II, Princeton, NJ: Princeton University Press, pp. 307–317
Siegel, I.H. (1945). ‘The generalized “ideal” index-number formula’, Journal of the American Statistical
Association, 40, pp. 520–523.
Sue Wing, I. (2008). ‘Explaining the Declining Energy Intensity of the U.S. Economy’, Resource and Energy
Economics, 30, pp. 21−49.
Taylor, P.G., Lavagne d’Ortigue, O., Francoeur, M., and N. Trudeau (2010). ‘Final energy use in IEA countries: The
role of energy efficiency’, Energy Policy 38, pp. 6463-6474.
Unander, F. (2007). ‘Decomposition of manufacturing energy-use in IEA countries; How do recent developments
compare with historical long-term trends?’, Applied Energy, 84, pp. 771−780.
Unander, F., S. Karbuz, L. Schipper, M. Khrushch and M. Ting (1999). ‘Manufacturing Energy Use in OECD
Countries: Decomposition of Long Term Trends’, Energy Policy, 27, pp. 769−778.
Worrell, E. (2004). ‘Industrial Energy Use, Status and Trends’, Encyclopedia of Energy, pp. 395−406.
Zhang, F.Q. and B.W. Ang (2001). ‘Methodological Issues in Cross-Country/Region Decomposition of Energy and
Environmental Indicators’, Energy Economics, 23, pp. 179−190.