
The life cycle energy demand and greenhouse gas emissions ...
13
531 (03) Lederer, J.; Ott, Ch.; Brunner, P.H.; Ossberger, M. (2015) “The Life-Cycle Energy Demand and Greenhouse Gas Emissions of High-Capacity Urban Transport Systems: A Case Study From Vienna's Subway Line U2”, Journal of Sustainable Transportation, Vol. 10, 2, p 120-130, ISSN 1556-8318, DOI: 10.1080/15568318.2013.869704, (Peer reviewed).
Transcript of The life cycle energy demand and greenhouse gas emissions ...

531 (03) Lederer, J.; Ott, Ch.; Brunner, P.H.; Ossberger, M. (2015) “The Life-Cycle Energy Demand and Greenhouse Gas Emissions of High-Capacity Urban Transport Systems: A Case Study From Vienna's Subway Line U2”, Journal of Sustainable Transportation, Vol. 10, 2, p 120-130, ISSN 1556-8318, DOI: 10.1080/15568318.2013.869704, (Peer reviewed).

Full Terms & Conditions of access and use can be found athttp://www.tandfonline.com/action/journalInformation?journalCode=ujst20
Download by: [TU Wien University Library] Date: 11 January 2016, At: 00:27
International Journal of Sustainable Transportation
ISSN: 1556-8318 (Print) 1556-8334 (Online) Journal homepage: http://www.tandfonline.com/loi/ujst20
The life cycle energy demand and greenhousegas emissions of high-capacity urban transportsystems: A case study from Vienna's subway lineU2
Jakob Lederer, Christian Ott, Paul Hans Brunner & Markus Ossberger
To cite this article: Jakob Lederer, Christian Ott, Paul Hans Brunner & Markus Ossberger (2016)The life cycle energy demand and greenhouse gas emissions of high-capacity urban transportsystems: A case study from Vienna's subway line U2, International Journal of SustainableTransportation, 10:2, 120-130, DOI: 10.1080/15568318.2013.869704
To link to this article: http://dx.doi.org/10.1080/15568318.2013.869704
Accepted author version posted online: 12Aug 2014.
Submit your article to this journal
Article views: 34
View related articles
View Crossmark data
The life cycle energy demand and greenhouse gas emissions of high-capacity urbantransport systems: A case study from Vienna’s subway line U2
Jakob Lederera,c, Christian Otta, Paul Hans Brunnera, and Markus Ossbergerb
aInstitute for Water Quality, Resource, and Waste Management, Vienna University of Technology, Vienna, Austria; bWiener Linien, Vienna, Austria;cCD Laboratory for Anthropogenic Resources, TU Wien, Vienna, Austria
ARTICLE HISTORYReceived 21 March 2013Revised 16 July 2013Accepted 22 November 2013
ABSTRACTThis article calculates the impact of three measures in order to reduce the global warming potential (GWP)and cumulative energy demand (CED) of Vienna’s subway line U2. Results show that the increase of thetrain occupancy rate has the highest reduction impact (�30%/�30%), followed by new rolling stock(�26%/�34%), and a change in energy mix (�8%/�4%). The total reduction to be achieved with allmeasures combined is around �55% for GWP and CED, leading to a GWP of 91 [g] and 1.653 [MJ] perpassenger kilometer traveled (PKT). With all these measures applied, the subway has lower GWP and CEDthan other modes of transport presented in the literature.
KEYWORDSCED; energy demand; GHG;global warming potential;greenhouse gas emissions;subway
1. Introduction
Transport and traffic are among the main consumers of energyand main producers of greenhouse gas (GHG) emissions in theurban anthropogenic metabolism, contributing 27% to the finalenergy consumption and 15% to the anthropogenic GHG pro-duction in the world in 2008 (International Energy Agency[IEA], 2010; Organisation for Economic Co-operation andDevelopment [OECD]/International Transport Forum [ITF],2010). More than half of these transport emissions are caused bypetroleum-based diesel and gasoline fuels passenger transport,mostly induced by urbanization and large urban agglomerations(Baccini & Brunner, 2012; IEA, 2009). This combustion of fossilfuels and subsequent energy consumption and GHG produc-tion, expressed as the global warming potential (GWP), corre-lates with the most important emissions in the urban transportsector, such as NOX, CO, and particulate matter, making themthe most important indicators for a brief assessment of environ-mental sustainability in the sector (Huijbregts et al., 2006).
Sustainable urban development seeks a reduction of GWPand fossil fuel consumption in all modes of urban transport,but particularly in fossil-fueled private passenger transport.Suggested measures are sound urban planning with regard toshort transport distances, transition to more sustainableenergy sources, higher energy efficiency, and a shift in themodal split from private to public transport (May, 2012;OECD/ITF, 2010). For cities of a certain size, this publictransport function can most likely be achieved by rapid transitsystems such as subways and commuter rails. However, theirconstruction is often an issue of public and scientific discus-sion due to the GWP and energy demand during the con-struction phase, particularly through the excavation of tunnels(Bekesi, 2005; Melanie, 2010; R€onk€a, Ritola, & Rauhala, 1998).
In the view of these discussions, decision makers, urban plan-ners, and transport companies require a sound knowledgebase on (1) the cumulative life cycle energy demand (CED)and GWP of rapid transit systems compared to other modesof transport and (2) which measures are the most promisingto reduce GWP and CED. This is particularly the case inurban regions that are about to extend their existing subwaysystem such as the Austrian capital of Vienna (Wiener Stadt-werke, 2008).
Thus, the objectives of this article are to calculate the CEDand GWP of newly built subways, assess them in comparisonto other modes of transport, and evaluate and discuss the effectof particular policy measures to reduce both indicators. Bydoing so, a contribution to the aforementioned claim ofexpanding the knowledge base on urban transport systemsshould be made herein for the case study of the city of Vienna.
A number of studies on the energy demand and GWP ofurban transport systems are already available for various urbanregions in the world, but not for Vienna. Eriksson, Blinge, andL€ovgren (1996) compiled a Life Cycle Impact Assessment(LCIA) of the road transport sector in Sweden, taking intoaccount private cars and transport of goods, but excluding pub-lic road passenger transport and nonroad passenger transport.Baumgartner et al. (2000) performed a LCIA on the SwissMetro,a thus-far-not-realized underground high-speed railway net-work in Switzerland connecting the main urban centers of thecountry. The study concludes that 21% of nonrenewable cumu-lative energy demand (CED) comes from the construction of thetunnels and the vehicle. The nonrenewable CED per passengeris similar to that of other high-speed trains, but only because ofthe different passenger occupancy rates (load factors), which areassumed to be twice as high for the Swiss Metro.
CONTACT Jakob Lederer [email protected] Institute for Water Quality, Resource, and Waste Management, Vienna University of Technology, Karlsplatz13/226, A-1040 Vienna, Austria.© 2016 Taylor & Francis Group, LLC
INTERNATIONAL JOURNAL OF SUSTAINABLE TRANSPORTATION2016, VOL. 10, NO. 2, 120�130http://dx.doi.org/10.1080/15568318.2013.869704
Dow
nloa
ded
by [
TU
Wie
n U
nive
rsity
Lib
rary
] at
00:
27 1
1 Ja
nuar
y 20
16

Schmid et al.’s (2001) LCIA on transport services alongparticular travel routes in the German region of Baden Wurt-temberg considers the CED, GWP, and other emissions. Resultsshow far lower GWP for commuter rails than for private cars,explained by the high nuclear power and low fossil fuel propor-tion for the electricity consumed by the trains. As a result, theCED of gasoline-fueled cars was ten and of diesel-fueled carssix times higher than the one of commuter rails. However, fig-ures for the commuter rails are only for peak hours, not off-peak hours. Unfortunately, results are also not given in a com-parable functional unit such as passenger kilometer traveled.
A special focus on the ecological design of metro trainsis presented by Struckl and Wimmer (2007), who carriedout a LCIA case study for the production and operation ofthe so-called Greenline Metro train in Oslo. For this specialcase, they conclude that although materials of a high spe-cific GWP and CED value such as aluminum are used tobuild the trains, the emissions and energy demand is domi-nated by the operation phase. Therein, a remarkably highshare can be assigned to cooling and particularly heating ofthe trains, which shows the high relevance of the geographi-cal conditions.
Chester and Horvath (2009) compare the results of theirLCIA of different long distance and urban transport systems inthe United States, finding the CED and GWP highest for urbandiesel buses during off-peak hours. However, during peakhours, urban diesel buses perform best compared to othermodes of transport. Gasoline cars consume a CED between 3and 5 MJ per passenger kilometer traveled (PKT) and emit 230and 415 g CO2-equiv./PKT of GWP, while commuter rail andlight rail systems consume between 1.4 and 1.9 MJ/PKT CEDand emit 100 to 140 g CO2-equiv./PKT GWP. As a major find-ing, they claim more attention for the emissions and energydemand during the construction phase of rail systems in partic-ular (Chester & Horvath, 2009).
Contrary to the aforementioned studies, Harwatt, Tight, andTimms (2011) explicitly deal with policy options to reduceGHG emissions and energy demand, exercised for the greaterLondon region. A combination of market-based (carbon trad-ing) and live-style-based shift (promotion of cycling and walk-ing) shows the highest reduction potential, while the effect ofsingle measures with high capital investment (cleaner technol-ogy) or multiple measures formulated by the city governmentin their action plan are of lower impact.
Most of the studies reviewed do consider private and pub-lic transport by car, bus, commuter, and light rails, but notsubway systems with extensive tunnel constructions (Chester& Horvath, 2009; Eriksson, Blinge, & L€ovgren, 1996). Somestudies focus solely on particular aspects of subways such asproduct design (Struckl & Wimmer, 2007) or even projectsnot carried out yet (Baumgartner, Tietje, Spielmann, & Ban-del, 2000). Others that consider existing subway systems andcompare them to other modes of transport show high uncer-tainties based on sensitive input values such as occupancyrates (peak and off-peak hours), and electricity productionmix (Chester & Horvath, 2009; Schmid, Wacker, K€urbis,Krewitt, & Friedrich, 2001). What all of these studies have incommon is that they do not aim to investigate the impact ofpolicy measures as a means of implementation of their
conclusions. If it has been done, it is only attempted in aprospective way considering policy, corporate, and techno-logical measures aiming to increase passenger numbers bytrain (occupancy rate) or changing energy mix or energy effi-ciency, not showing and thus evaluating the effect of meas-ures already carried out (Harwatt, Tight, & Timms, 2011).
In order to provide some new information to both localstakeholders in Vienna’s transport system and researchers, theresearch questions addressed in this work are:
1. How big are the life cycle CED and GWP of a newly builtsubway system if compared to other modes of transport?
2. To which extent do the aforementioned CED and GWPreduction measures (occupancy rate, energy productionmix, and higher energy efficiency of rolling stock) influ-ence the results?
To answer these questions, Vienna’s new subway extensionline U2 is investigated as a case study. The reason it was chosenis that (1) the U2 was recently built and does provide the datarequired to carry out the calculations, particularly for provisionof infrastructure and buildings, and (2) it is an example of com-bining measurable attempts of increasing the occupancy rate,changing electricity mix, and investments in new rolling stock.
2. Methods and methodology
LCIA has been developed to analyze the impact of the provisionof services and goods along their life cycle, which means fromthe extraction of raw materials via the production and con-sumption to the final disposal of residues. Unlike environmen-tal impact assessment, it does not only consider the directimpact of the foreground system, but also the background sys-tem in the hinterland, where raw materials are usuallyextracted. This is particularly important for systems such assubways where both operation and construction phases mightbe of relevance (Chester & Horvath, 2009).
2.1 System definition
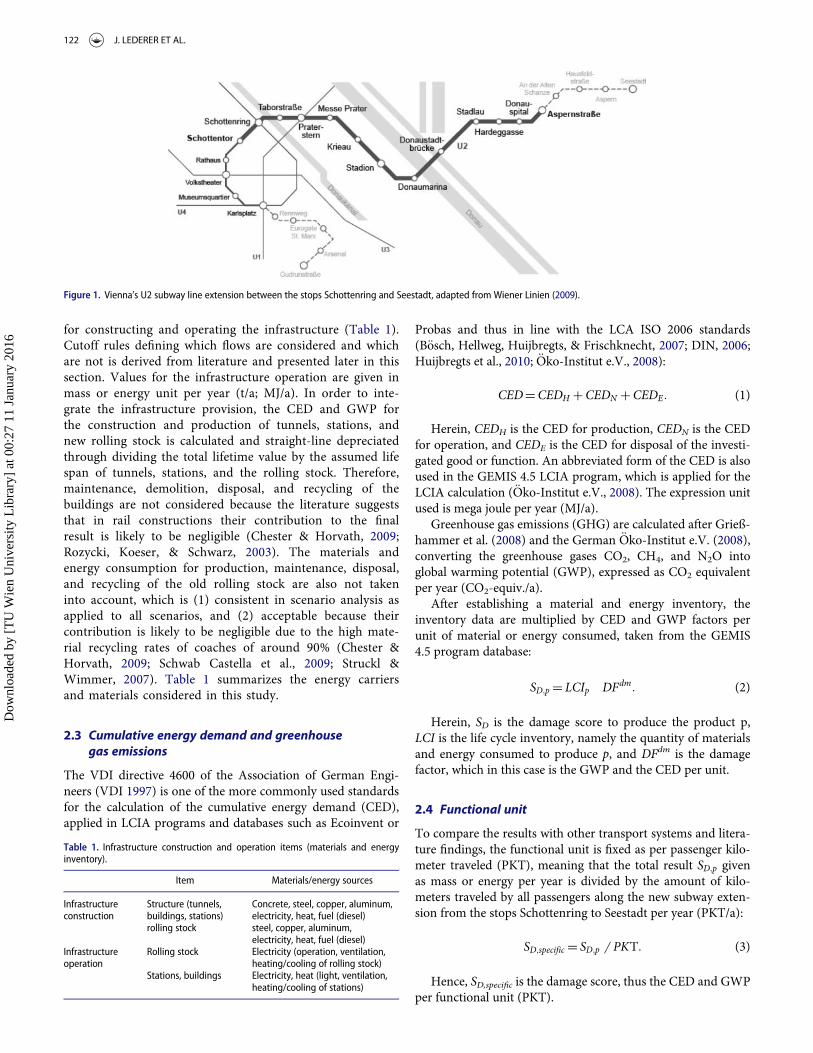
The calculation is based on a life cycle approach after ISO14044:2006 (DIN, 2006), defining first the regarded system,which is the passenger transport function along a particularroute within an urban region, namely the travel route ofthe new subway extension of the U2 subway line of Vien-na’s subway network, between the existing stop Schottenr-ing and the last stop Seestadt (see Figure 1).
The total length of the extension is 14,820 meters, with atunnel section of 3,500 meters and an aboveground sectionof 11,320 meters. The subway line is part of Vienna’s publictransport network of subway lines, commuter rails, and busand light rail lines, all operated by the same provider (Wie-ner Linien). Construction work was carried out between theyears 2003 and 2010. The line was opened for the sectionSchottenring to Stadion in the year 2008, and the section toAspernstrasse in the year 2010.
2.2 Life cycle inventory
The material and energy life cycle inventory (LCI) considersthe quantitatively most relevant material and energy flows
INTERNATIONAL JOURNAL OF SUSTAINABLE TRANSPORTATION 121
Dow
nloa
ded
by [
TU
Wie
n U
nive
rsity
Lib
rary
] at
00:
27 1
1 Ja
nuar
y 20
16
for constructing and operating the infrastructure (Table 1).Cutoff rules defining which flows are considered and whichare not is derived from literature and presented later in thissection. Values for the infrastructure operation are given inmass or energy unit per year (t/a; MJ/a). In order to inte-grate the infrastructure provision, the CED and GWP forthe construction and production of tunnels, stations, andnew rolling stock is calculated and straight-line depreciatedthrough dividing the total lifetime value by the assumed lifespan of tunnels, stations, and the rolling stock. Therefore,maintenance, demolition, disposal, and recycling of thebuildings are not considered because the literature suggeststhat in rail constructions their contribution to the finalresult is likely to be negligible (Chester & Horvath, 2009;Rozycki, Koeser, & Schwarz, 2003). The materials andenergy consumption for production, maintenance, disposal,and recycling of the old rolling stock are also not takeninto account, which is (1) consistent in scenario analysis asapplied to all scenarios, and (2) acceptable because theircontribution is likely to be negligible due to the high mate-rial recycling rates of coaches of around 90% (Chester &Horvath, 2009; Schwab Castella et al., 2009; Struckl &Wimmer, 2007). Table 1 summarizes the energy carriersand materials considered in this study.
2.3 Cumulative energy demand and greenhousegas emissions
The VDI directive 4600 of the Association of German Engi-neers (VDI 1997) is one of the more commonly used standardsfor the calculation of the cumulative energy demand (CED),applied in LCIA programs and databases such as Ecoinvent or
Probas and thus in line with the LCA ISO 2006 standards(B€osch, Hellweg, Huijbregts, & Frischknecht, 2007; DIN, 2006;Huijbregts et al., 2010; €Oko-Institut e.V., 2008):
CEDDCEDH CCEDN CCEDE: (1)
Herein, CEDH is the CED for production, CEDN is the CEDfor operation, and CEDE is the CED for disposal of the investi-gated good or function. An abbreviated form of the CED is alsoused in the GEMIS 4.5 LCIA program, which is applied for theLCIA calculation (€Oko-Institut e.V., 2008). The expression unitused is mega joule per year (MJ/a).
Greenhouse gas emissions (GHG) are calculated after Grieß-hammer et al. (2008) and the German €Oko-Institut e.V. (2008),converting the greenhouse gases CO2, CH4, and N2O intoglobal warming potential (GWP), expressed as CO2 equivalentper year (CO2-equiv./a).
After establishing a material and energy inventory, theinventory data are multiplied by CED and GWP factors perunit of material or energy consumed, taken from the GEMIS4.5 program database:
SD;p D LCIp � DFdm: (2)
Herein, SD is the damage score to produce the product p,LCI is the life cycle inventory, namely the quantity of materialsand energy consumed to produce p, and DFdm is the damagefactor, which in this case is the GWP and the CED per unit.
2.4 Functional unit
To compare the results with other transport systems and litera-ture findings, the functional unit is fixed as per passenger kilo-meter traveled (PKT), meaning that the total result SD;p givenas mass or energy per year is divided by the amount of kilo-meters traveled by all passengers along the new subway exten-sion from the stops Schottenring to Seestadt per year (PKT/a):
SD;specific D SD;p 6 PKT: (3)
Hence, SD,specific is the damage score, thus the CED and GWPper functional unit (PKT).
Figure 1. Vienna’s U2 subway line extension between the stops Schottenring and Seestadt, adapted from Wiener Linien (2009).
Table 1. Infrastructure construction and operation items (materials and energyinventory).
Item Materials/energy sources
Infrastructureconstruction
Structure (tunnels,buildings, stations)
Concrete, steel, copper, aluminum,electricity, heat, fuel (diesel)
rolling stock steel, copper, aluminum,electricity, heat, fuel (diesel)
Infrastructureoperation
Rolling stock Electricity (operation, ventilation,heating/cooling of rolling stock)
Stations, buildings Electricity, heat (light, ventilation,heating/cooling of stations)
122 J. LEDERER ET AL.
Dow
nloa
ded
by [
TU
Wie
n U
nive
rsity
Lib
rary
] at
00:
27 1
1 Ja
nuar
y 20
16

2.5 Variation of parameters through selected measuresand designing of scenarios
The second research question requires a variation of selectedparameters in order to analyze but also predict the impact ofpolicy and corporate decisions regarding (1) occupancy rate,(2) change in energy production mix, and (3) higher energyefficiency of new rolling stock. Starting with a baseline scenariorepresenting the GWP and CED before the measures have beenimplemented, the scenarios are further developed and shown,after describing reduction measures and scenarios, in Table 2.
2.5.1 Measure 1: Higher occupancy rateThe occupancy rate is a function of the number of passengerstransported, which again underlies several assumptions, such aspopulation along the subway line and preferred mode of trans-port. For both, an increase can be observed in Vienna, as thechanges in the modal split and latest population figures show(Deußner & Kovacic, 2010; Schremmer et al., 2011; WienerStadtwerke, 2011a). The latter significantly influences urbanplanning in Vienna, and the city plans to develop the areasalong the subway line U2 in order to cope with this populationgrowth (Magistrat der Stadt Wien 2003). Therefore, this sce-nario considers a continuation of the trend of consumers towardpublic transport, population growth, and housing developmentalong the subway line U2, applying values for the train occu-pancy rate for the years 2015 (baseline scenario 0 and scenarios2, 3, and 5) and 2025 (scenarios considering measure 1—scenar-ios 1, 4, 6, and 7). The variation of this parameter influences theresults from Equation (3) through the increase of the PKT/a.
2.5.2 Measure 2: Energy production mixDuring the last 15 years, Vienna’s main energy supplier WienEnergie made some investments for its energy production. Newwind power parks, biomass, and biogas plants have been built,while heating oil for electricity and heat production has beenreplaced by natural gas (Wiener Stadtwerke, 2011a, 2011b).The objectives of these measures are a reduction of the GWPand CED. These reduction measures are considered in thispaper under measure 2. Therefore, the electricity and heat pro-duction of the year 2001/2002 is applied to the baseline (sce-nario 0) and scenarios 1, 3, and 6, and the one of 2011/2012 forthe scenarios considering measure 2 (scenarios 2, 4, 5, and 7),which will change the LCI (Equation [2]). The damage scoreSD,p is again taken from GEMIS 4.5 for each energy mix.
2.5.3 Measure 3: Higher energy efficiency of rolling stockIn 2010, the first tranche of the new V-Wagen (V-coach)started its operation. The producer (Siemens) promises areduction of the energy consumption by this train type com-pared to the 30-year-old U-Wagen of Vienna’s subway system,particularly through the recovery of energy during braking (Sie-mens, n.d.). According to Wiener Linien, the old coaches couldhave been used for another 30 years, but due to the high energydemand and lower comfort, they will be replaced by the newV-Wagen until 2019 (Wiener Linien, 2010; Wiener Stadtwerke,2011a). Therefore, the scenarios considering this measureassume that all rolling stock running at the U2 line is replacedfrom the U-Wagen (baseline scenario and scenarios 1, 2, and 4)to the newer V-Wagen (scenarios 3, 5, 6, and 7), leading to alower energy demand, which affects the LCI (Equation [2]). Asaforementioned, production, maintenance, disposal, and recy-cling of old trains are not considered.
2.5.4 ScenariosTo assess the impact of the measures, different scenarios aredesigned that consider each of the measures, but also combina-tions of them. Therein, the baseline alternative refers to the sys-tem before the three measures are implemented (scenario 0).All other scenarios are a mix of the different measures, particu-larly scenario 7, which considers all three measures to be imple-mented (Table 2).
3. Materials
3.1 Functional unit for the baseline
To calculate the functional unit (PKT), the projected passengernumbers for the year 2015 per section are used and multipliedby the section’s length. Passenger number data derives fromDeußner and Kovacic (2010). Then the base to calculate thefunctional unit is 128,940,000 PKT/a for the year 2015, whichequals an occupancy rate of about 7% of the total seating andstanding passenger capacity (848 seats in total), but 19% if onlyseating capacity is considered (300 seats in total).
3.2 Life cycle inventory for the baseline
3.2.1 Infrastructure provisionThe quantities of concrete, reinforcing steel, construction steel,and aluminum used in the building constructions wereacquired from the bidding documents of the construction proj-ect from the tendering party Wiener Linien (2010). Data forcopper consumption, which is mainly used in electrical installa-tions and the overhead traction line, were acquired throughinterviews with Wiener Linien. The same is true for electricityand fuel consumption during the construction phase (WienerLinien, 2010). Data for the infrastructure operation are given inmass or energy unit per year (t/a; MJ/a). In order to integratethe infrastructure provision, the GWP and GHG for the con-struction and production of tunnels, stations, and the new roll-ing stock is calculated and straight-line depreciated throughdividing the total lifetime value by the assumed life span of tun-nels and stations (100 years) and the rolling stock (30 years)(Struckl, personal communication, 2010; Struckl & Wimmer,2007; Wiener Linien, 2010).
Table 2. Scenarios for no-action alternative and different GHG emissions and CEDreduction measures.
Scenario no. Train occupancy rate Energy mix (year) Rolling stock (old/new)
0 7% 2001/2002 U-Wagen (old)1 10% 2001/2002 U-Wagen (old)2 7% 2011/2012 U-Wagen (old)3 7% 2001/2002 V-Wagen (new)4 10% 2011/2012 U-Wagen (old)5 7% 2011/2012 V-Wagen (new)6 10% 2001/2002 V-Wagen (new)7 10% 2011/2012 V-Wagen (new)
INTERNATIONAL JOURNAL OF SUSTAINABLE TRANSPORTATION 123
Dow
nloa
ded
by [
TU
Wie
n U
nive
rsity
Lib
rary
] at
00:
27 1
1 Ja
nuar
y 20
16

3.2.2 Infrastructure operationElectricity consumption for the operation (traction current)of the old rolling stock called U-Wagen is 76.32 MJ/train-km traveled (Wiener Linien, 2013). With a total amount of2,267,000 train-km traveled per year (Ossberger, 2010),the annual electricity consumption is 173,017,440 MJ/a.This value corresponds with data from literature of155�182 million MJ/a (Brauner, 2009; Kindler et al., 2006).Electricity consumed for operating the stations is 3,600,000MJ/a for aboveground stops and 2,412,000 MJ/a for subsur-face stops (Kindler et al., 2006). This value correspondswith Hong and Kim’s (2004) data on electricity consump-tion of Seoul’s subway system. In total, the 16 new stops(four subsurface, twelve aboveground) consume 43,344,000MJ/a of electricity. The total heating demand of the 16 newstops is estimated at 6,840,000 MJ/a (Wiener Linien, 2010).Finally, the total energy demand for operating the subwaysystem is 222 million MJ/a.
3.2.3 Energy mixThe energy mix is crucial for the determination of the GWPand CED. In 2001/2002 Wien Energie, the electricity supplierof Wiener Linien, had a domestic electricity production mixof 91% fossil (86% gas and 5% oil), 8% hydropower, and 1%biomass and wind energy, covering 51% of the electricitydemand (Wien Energie, 2003). The residual 49% wasimported from the Austrian grid. The final electricity mix,which is used for the calculation of the GWP and CEDimpact factor through GEMIS, considers this import byusing the Austrian energy mix data from GEMIS 4.5 forimported electricity (€Oko-Institut e.V., 2008). Heat is con-sumed from the district heating provided by Wien Energie,covering 100% of the demand and dominated by natural gas,waste, and heating oil (P€olz, 2007). Both values are shown inTable 3.
3.3 Life cycle inventory for measures 1�3
3.3.1 Measure 1: Higher occupancy rateBased on the assumptions regarding housing development,population growth, and modal split development, an increasein the average passenger occupation rate from 7% to 10%(19% to 27% if only seating capacity is considered) for the
year 2025 is used, which corresponds to 183,996,000 PKT/a(Deußner & Kovacic, 2010). This is still a conservative esti-mate if compared to literature data, stating figures between20% and 60% of average train occupancy rate (Brauner,2009; Chester, 2008).
3.3.2 Measure 2: Change of energy mix for electricity andheat productionThe production electricity mix of Wiener Linien’s electricitysupplier Wien Energie in 2011/2012 is still dominated byfossil fuels, but oil was phased out. Therefore, the share ofwind, hydropower, and biomass increased (see Table 3). Inaddition, the self-sufficiency increased, and the share ofelectricity imported from the Austrian grid decreased from49% to 47% (Wien Energie, 2012). The changes in the dis-trict heating system are established by updating the data ofP€olz (2007) with data from Wiener Stadtwerke (2011a,2011b). These changes include the installation of a new bio-mass, biogas, and waste incineration plant. The energy mixis presented in Table 3, and the resulting damage factorsfrom GEMIS 4.5 are shown in Table 4.
3.3.3 Measure 3: Higher energy efficiency throughtechnological innovationUnpublished electricity consumption measurements for theoperation of the new rolling stock (V-Wagen) show a reduc-tion of 50% compared to the old coaches (U-Wagen) (Struckl,personal communication, 2010). With a total amount of2,267,000 train-km traveled per year (Ossberger, 2010), theelectricity consumption for traction current will reduce to86,146,000 MJ/a.
3.4 Damage factors for CED and GHG emissions
The inventory data is multiplied by emission factors, takenfrom the well-established and ISO 14044:2006 compliantGEMIS 4.5 database (DIN, 2006; Haapio & Viitaniemi, 2008;€Oko-Institut e.V., 2008). As an adjustment, the direct emissionfactors for diesel and natural gas of 0.068 and 0.055 kg CO2 perMJ fuel are added to the indirect emission factors from GEMIS(Buchal, 2007).
Table 3. Energy mix for baseline in %. Electricity production mix data derives from Wien Energie (2003, 2011) and the GEMIS 4.5 database (€Oko-Institut e.V. 2008), heatproduction mix data is taken from P€olz (2007) and Wiener Stadtwerke (2011a, 2011b).
Supplier (GEMIS code) Translation Base scenario (year 2001) Measure 2 (year 2011)
Electricity production Kohle-KW-DT-EU-Import-2010 Coal 4.2 2.1Braunkohle-KW-DT-AT-2000 Lignite 1.3 0.7€Ol-schwer-KW-DT-AT-2000 Heating oil 3.8 0.7Gas-KW-GuD-AT-2010 Natural Gas 50.3 55.3M€ull-KW-DT-AT-2000 Waste Incineration 1.7 1.0Wasser-KW-gross-AT Hydropower 38.2 38.1Bio-KW-DT-EU-2010 Biomass 0.2 1.1Wind-KW-Park-groß-DE-2010 Wind 0.2 1.1
Heat production €Ol-schwer-Kessel-AT-2005 Heating oil 15 9M€ull-HKW-DT-DE-2000-th/el-mix Waste to energy 24 26Gas-HKW-GT-AT-2005-th/el-mix Natural gas 61 61Holz-HS-Waldholz-HKW-10 MW-th-AT-2005 Biomass-fueled 0 4
124 J. LEDERER ET AL.
Dow
nloa
ded
by [
TU
Wie
n U
nive
rsity
Lib
rary
] at
00:
27 1
1 Ja
nuar
y 20
16

4. Results
4.1 Results for life cycle GHG emissions and CED of the U2subway line before implementation of differentmeasures
Under the given conditions, the total baseline results for theregarded system are 26 million kg GHG emissions and a CEDof 381 million MJ per year. Transferred into per person kilome-ter traveled, the result is 199 g CO2-equiv/PKT for the GWPand 3.676 MJ/PKT for CED. The operation of the infrastruc-ture (rolling stock and stations) generates 78% of the totalGHG emissions and consumes 88% of the total CED. Provisionof the infrastructure (19% and 10%) and the rolling stock (3%and 2%) contributes to a significantly smaller portion(Figure 2a and 2b). These results are comparable to the 79%contribution of infrastructure operation given by Baumgartneret al. (2000), but higher than Chester and Horvath’s values(2009), where infrastructure operation is about 50%�60% ofCED and 40%�50% of the GWP. This is remarkable, giventhat Chester and Horvath consider rail systems that do notrequire tunnels and hence should have a supposedly lowerenergy demand in the construction phase (see Figures 2a and2b). A further breakdown shows clearly that the electricity for
operation of rolling stock (60%) and the stations (15%) aredominating the results for the GHG emissions. Other items ofrelevance are materials provided to construct the infrastructure(concrete—12%; steel—5%) and heat to maintain the stations,while all other items are of much smaller relevance (Table 5).
4.2 Reduction potential through higher occupancy rate,new energy mix, and higher energy efficiency of therolling stock
If all measures to reduce the impacts of the U2 are applied, theGWP drops to a level of 91 g CO2-equiv/PKT and the CED to1.653 MJ/PKT, which is around ¡55% for both. Consequently,the impact of the operation on the results drops to 66% for theGWP and 81% for the CED (Figures 2a and 2b, Table 5). Thisis due to the fact that the implemented measures target theoperational phase, and the relative contribution to GHG emis-sions and CED of materials for building and construction willincrease. Finally, the highest contribution to the result isthrough the electricity demand for train operation, followed bysteel and concrete for the provision of infrastructure. All othersare of lesser relevance (Table 5).
From the single reduction measures, scenario 2—the trans-formation in the energy mix toward more gas-fired powerplants, hydropower, and biomass—has the lowest reductionpotential, reducing the GWP by about 8% and the CED byabout 4%. The new rolling stock (scenario 3) has a higherreduction potential on GWP (¡26%) and CED (¡34%). Theincrease in the passenger number and thus average occupationrate from 7% to 10% (scenario 1) has the highest single reduc-tion effect of about 30% for the GWP, and the second-highestfor the CED with ¡30%. Based on this result of each reductionmeasure, it is clear that an increase in occupancy rate and thenew rolling stock is the most effective binary combination forreducing the GWP and CED (scenario 6), with ¡51% for theGWP and ¡54% for the CED. The reduction that can beachieved with this combination is only slightly below scenario
Table 4. Emission factors for energy and materials provision for the baseline.
No. UnitGWP factor(kg/unit) CED total (MJ/unit)
1 Electricity (baseline�2001) MJ 0.089 1.8462 Electricity (measure 2�2011) MJ 0.080 1.7643 Heat (baseline�2001) MJ 0.095 1.7874 Heat (measure 2�2011) MJ 0.086 1.8415 Diesel MJ 0.147 2.1376 Natural Gas MJ 0.122 2.1507 Concrete kg 0.174 1.0858 Steel kg 1.499 20.3619 Copper kg 3.977 50.94510 Aluminum kg 17.601 186.070
Source: GEMIS 4.5 database (Buchal 2007; €Oko-Institut e.V. 2008).
Figure 2a. Baseline (scenario 0) and applying all reduction measures (scenario 7)results for the GWP.
Figure 2b. Baseline (scenario 0) and applying all reduction measures(scenario 7) results for the CED.
INTERNATIONAL JOURNAL OF SUSTAINABLE TRANSPORTATION 125
Dow
nloa
ded
by [
TU
Wie
n U
nive
rsity
Lib
rary
] at
00:
27 1
1 Ja
nuar
y 20
16

Table5.
Results
forscenario
0(baseline,before
applying
anymeasure)and
scenario7(app
lyingallreductio
nmeasures).(1)Unitsfore
nergyaregiveninGJforthe
inventorytotaland
GJ/yearforthe
inventoryperannum
(p.a.);(2)
Unitsform
assaregivenintons
forthe
inventorytotaland
tons/yearfor
theinventoryperann
um(p.a.).
Results
baselinescenario(beforeapplying
measures)
Scenario7(afterapplying
allthree
measures)
DF G
WP
DF C
EDGWP
CEDtotal
DF G
WP
DF C
EDGWP
CEDtotal
Category
Item
Inventorytotal
Inventoryp.a.
t/unit
GJ/unit
t/a
g/PKT
%GJ/a
MJ/PKT
%Inventoryp.a.
t/unit
GJ/unit
t/a
g/PKT
%GJ/a
MJ/PKT
%
Energy
foro
peratio
nElectricity
tractio
n1173,017
0.089
1.846
15,399
119.4
60319,390
2.4770
6786,509
0.080
1.764
6,921
37,6
41152,601
0.8294
50Electricity
stations
143,344
0.089
1.846
3,857
29.9
1580,013
0.6205
1743,344
0.080
1.764
3,468
18.8
2176,459
0.4155
25Heatstatio
ns1
9,720
0.095
1.787
923
7.2
3.6
17,370
0.1347
3.7
9,720
0.086
1.841
836
4.5
5.0
17,895
0.0973
5.9
Energy
andmaterial
infra-structureprovision
Electricity
1360,360
3,603
0.089
1.846
321
2.5
1.2
6,652
0.0516
1.4
3,604
0.089
1.846
321
1.7
1.9
6,652
0.0362
2.2
Diesel1
183,272
1,832
0.080
2.137
146
1.1
0.6
3,916
0.0304
0.8
1,833
0.080
2.137
146
0.8
0.9
3,916
0.0213
1.3
Concrete
21,701,570
17,015
0.174
1.085
2,967
2312
18,469
0.1432
3.9
17,016
0.174
1.085
2,967
16.1
1818,469
0.1004
6.1
Steel2
87,681
876
1.499
20.361
1,315
10.2
5.1
17,853
0.1385
3.8
877
1.499
20.361
1,315
7.1
817,853
0.0970
5.9
Alum
inum
2201
217.601
186.070
350.3
0.1
374
0.0029
0.1
217.601
186.070
350.2
0.2
374
0.0020
0.1
Copp
er2
1,330
133.977
50.945
530.4
0.2
678
0.0053
0.1
133.977
50.945
530.3
0.3
678
0.0037
0.2
Energy
andmaterialrolling
stockprovision
Electricity
116,365
545
0.089
1.846
490.4
0.2
1,007
0.0078
0.2
545
0.089
1.846
490.3
0.3
1,007
0.0055
0.3
Heat1
39,564
1,318
0.095
1.787
125
10.5
2,357
0.0183
0.5
1,319
0.095
1.787
125
0.7
0.7
2,357
0.0128
0.8
Gas
13,681
122
0.068
2.150
80.1
0.0
264
0.0020
0.1
123
0.068
2.150
80.0
0.1
264
0.0014
0.1
Steel2
1,282
421.499
20.361
640.5
0.2
870
0.0067
0.2
431.499
20.361
640.3
0.4
870
0.0047
0.3
Alum
inum
2754
2517.601
186.070
442
3.4
1.7
4,678
0.0363
1.0
2517.601
186.070
442
2.4
2.6
4,678
0.0254
1.5
Copp
er2
752
3.977
50.945
100.1
0.0
128
0.0010
0.0
33.977
50.945
100.1
0.1
128
0.0007
0.0
Total
25,715
199.4
474,018
3.6762
16,759
91.1
304,200
1.6533
126 J. LEDERER ET AL.
Dow
nloa
ded
by [
TU
Wie
n U
nive
rsity
Lib
rary
] at
00:
27 1
1 Ja
nuar
y 20
16
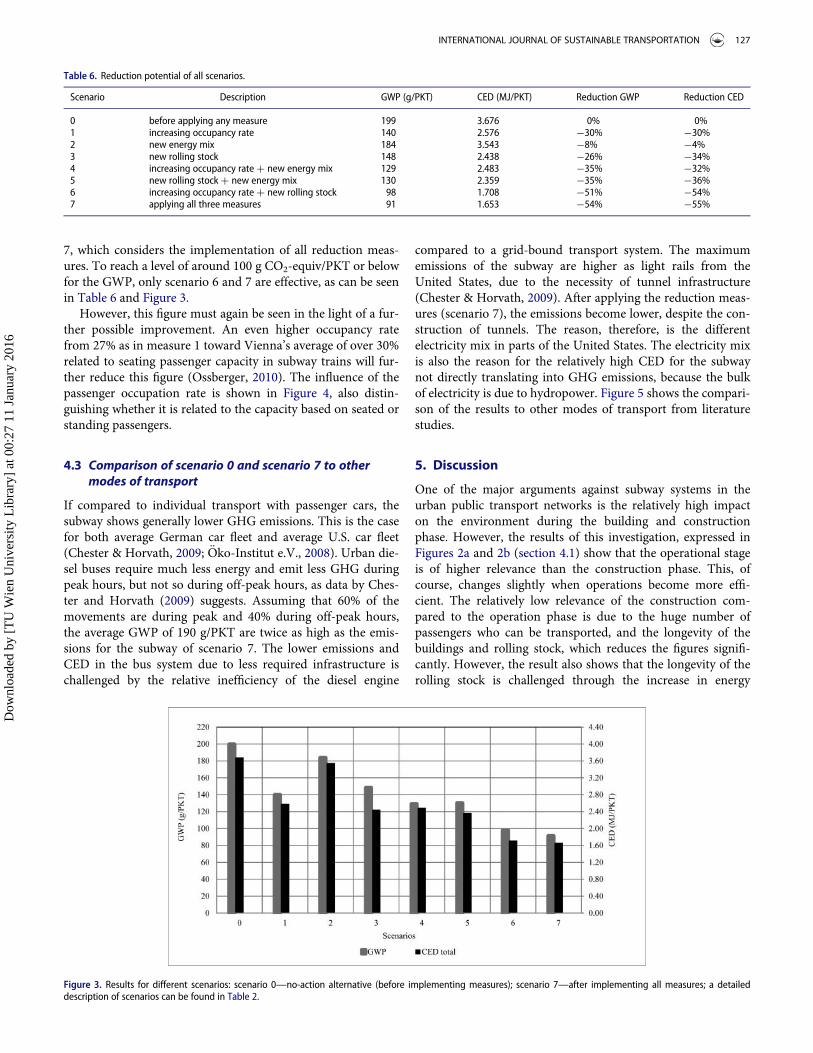
7, which considers the implementation of all reduction meas-ures. To reach a level of around 100 g CO2-equiv/PKT or belowfor the GWP, only scenario 6 and 7 are effective, as can be seenin Table 6 and Figure 3.
However, this figure must again be seen in the light of a fur-ther possible improvement. An even higher occupancy ratefrom 27% as in measure 1 toward Vienna’s average of over 30%related to seating passenger capacity in subway trains will fur-ther reduce this figure (Ossberger, 2010). The influence of thepassenger occupation rate is shown in Figure 4, also distin-guishing whether it is related to the capacity based on seated orstanding passengers.
4.3 Comparison of scenario 0 and scenario 7 to othermodes of transport
If compared to individual transport with passenger cars, thesubway shows generally lower GHG emissions. This is the casefor both average German car fleet and average U.S. car fleet(Chester & Horvath, 2009; €Oko-Institut e.V., 2008). Urban die-sel buses require much less energy and emit less GHG duringpeak hours, but not so during off-peak hours, as data by Ches-ter and Horvath (2009) suggests. Assuming that 60% of themovements are during peak and 40% during off-peak hours,the average GWP of 190 g/PKT are twice as high as the emis-sions for the subway of scenario 7. The lower emissions andCED in the bus system due to less required infrastructure ischallenged by the relative inefficiency of the diesel engine
compared to a grid-bound transport system. The maximumemissions of the subway are higher as light rails from theUnited States, due to the necessity of tunnel infrastructure(Chester & Horvath, 2009). After applying the reduction meas-ures (scenario 7), the emissions become lower, despite the con-struction of tunnels. The reason, therefore, is the differentelectricity mix in parts of the United States. The electricity mixis also the reason for the relatively high CED for the subwaynot directly translating into GHG emissions, because the bulkof electricity is due to hydropower. Figure 5 shows the compari-son of the results to other modes of transport from literaturestudies.
5. Discussion
One of the major arguments against subway systems in theurban public transport networks is the relatively high impacton the environment during the building and constructionphase. However, the results of this investigation, expressed inFigures 2a and 2b (section 4.1) show that the operational stageis of higher relevance than the construction phase. This, ofcourse, changes slightly when operations become more effi-cient. The relatively low relevance of the construction com-pared to the operation phase is due to the huge number ofpassengers who can be transported, and the longevity of thebuildings and rolling stock, which reduces the figures signifi-cantly. However, the result also shows that the longevity of therolling stock is challenged through the increase in energy
Table 6. Reduction potential of all scenarios.
Scenario Description GWP (g/PKT) CED (MJ/PKT) Reduction GWP Reduction CED
0 before applying any measure 199 3.676 0% 0%1 increasing occupancy rate 140 2.576 ¡30% ¡30%2 new energy mix 184 3.543 ¡8% ¡4%3 new rolling stock 148 2.438 ¡26% ¡34%4 increasing occupancy rate C new energy mix 129 2.483 ¡35% ¡32%5 new rolling stock C new energy mix 130 2.359 ¡35% ¡36%6 increasing occupancy rate C new rolling stock 98 1.708 ¡51% ¡54%7 applying all three measures 91 1.653 ¡54% ¡55%
Figure 3. Results for different scenarios: scenario 0—no-action alternative (before implementing measures); scenario 7—after implementing all measures; a detaileddescription of scenarios can be found in Table 2.
INTERNATIONAL JOURNAL OF SUSTAINABLE TRANSPORTATION 127
Dow
nloa
ded
by [
TU
Wie
n U
nive
rsity
Lib
rary
] at
00:
27 1
1 Ja
nuar
y 20
16

efficiency of the new rolling stock, which can reduce the GWPand CED significantly. For instance, recent figures fromWienerLinien (2013) show that by replacing almost half of the old roll-ing stock with new, the energy demand for train operation(traction current) dropped by 23% from 76 to 59 MJ/train-kmtraveled. Therefore, it makes sense for transport companies toreplace their old trains if more efficient technology is available,because it is also the one measure probably easiest toimplement.
Overall, the impact of the occupancy rate is still the highestof all regarded measures. This is of particular relevance for thesubway U2, because the estimated occupancy rate for 2025 isstill below average rates achieved nowadays. However, consid-ering the strong population growth of Vienna of 1% per yearbetween 2001 and 2009 (Schremmer et al., 2011) and the
scarcity of building space in most districts, it is likely, as desiredand planned by the city administration, that the passengernumbers will increase (Magistrat der Stadt Wien, 2009).
Compared to the two measures, the study shows that thechange in the energy mix is of much less relevance. This issurprising, as some major investments have been made inthis field. One reason is that the import of electricity fromthe hydropower-dominated Austrian grid has been reduced;the other reason is that domestic electricity production is stilldominated by natural gas. However, it is clear that not onlyurban transport is affected by this measure, but also all othersectors of energy consumption (industry, housing), whichmust be considered when evaluating this measure.
In the overall comparison to other modes of transport, thesubway shows a relatively low GWP and CED, even with an
Figure 5. Comparison of scenarios 0 and 7 to other modes of transport, based on literature studies; �data from GEMIS 4.5 for the average vehicle fleet in urban transportin Germany 2010 and an occupancy rate of 1.5 passengers per car (€Oko-Institut e.V. 2008); ��data from the USA 2008, first for a compact car in urban transport, secondfor urban diesel bus in peak and off-peak operation hours, and third for two different light rail systems, without declaration of peak-hour, off-peak-hour, or average oper-ation (Chester and Horvath 2009).
Figure 4. Influence of train occupation rate on the GHG emissions for the combined measures calculation.
128 J. LEDERER ET AL.
Dow
nloa
ded
by [
TU
Wie
n U
nive
rsity
Lib
rary
] at
00:
27 1
1 Ja
nuar
y 20
16

old rolling stock, a relatively low occupancy rate, and the oldenergy mix. This is not a surprise for passenger cars, but morefor bus travel. Based on the data of Chester and Horvath(2009), buses have a lower GWP and CED only during peakoperation hours. However, it is clear that a functioning publictransport system must provide operation even in off-peakhours in order to be a more or less suitable and comfortablealternative to private cars. Therefore, calculations must gobeyond peak hours and consider the average occupancy rateduring all operation hours (Baumgartner et al., 2000; Chester &Horvath, 2009; Schmid et al., 2001).
This study is based on a technical�environmental assess-ment and by itself cannot provide sound decision support,which would require more investigations, a bigger number ofindicators, and subsequent weighing. What has not beenregarded in this research is the aforementioned claim of shorttravel distances within urban areas to achieve sustainable urbandevelopment, as considered, for instance, by Harwatt, Tight, andTimms (2011). Subways and commuter rails are modes of trans-port designed for longer travel distances, and thus contradictoryto the claim of short travel distances, because they may causeand initiate urban sprawl. However, cities of a certain size suchas Vienna, with an already high population density and a pro-jected population growth of 12%�85% until the year 2050, willnot be able to further densify the old settlement areas in order tocope with this growth (Schremmer et al. 2011). Thus, a measurefor more or less sustainable growth is to locate future settlementsalong main transport axes, providing access to high-capacitypublic transport lines such as subways or commuter trains.
Finally, most of the data applied in this research was dataretrieved from Wiener Linien. Some of the data, like the electricitydemand to operate the trains and the stations and the materialand energy demand to produce the rolling stock, was primarydata in good quality. The data for material and energy demand toconstruct the buildings was of lesser quality, as it referred to esti-mates based on the environment impact declaration and the bid-ding documents. If the data recorded during the constructionphase is available, the figures used in this study must be assessedand, if necessary, adjusted. Fortunately, this step will be carriedout by the publishing institute in the near future.
6. Conclusions
Provision of high-capacity urban railway transport systemsreplacing fossil based individual passenger transport is, amongother interventions, one option to reduce the GWP and the CEDofmodern cities. The study shows that subway systems have rela-tively low emissions and energy demand when compared toother means of motorized transport, even though the buildingand construction phase is much more important for these emis-sions. One factor, therefore, is the decision to acquire new tech-nology with lower GWP; another is the policy decision on spatialplanning issues, which again influence the number of passengerstransported and thus the occupancy rate. Although widely pro-moted as an important measure to reduce the GWP and theCED in the public transport sector, the change in the energy mixdid not influence the result extensively. Therefore, the researchprovides some valuable information for policymakers and trans-port companies regarding the efficiency of their measures in
reducing their GWP and CED, but it also give some insight intothe methodological challenges, among them the relevance of theexpression of the occupancy rate.
References
Baccini, P., & Brunner, P. H. (2012). Metabolism of the anthroposphere:Analysis, evaluation, design (2nd ed). Cambridge, MA: MIT Press.
Baumgartner, T., Tietje, O., Spielmann, M., & Bandel, R. (2000). €Okobilanzder Swissmetro. Umweltwirkungen durch den Bau und Betrieb Teil 1.und durch induzierte Aktivit€aten Teil 2. Bern, Switzerland: Ecoplan.
Bekesi, S. (2005). Verkehr in Wien. Personenverkehr, Mobilit€at undst€adtische Umwelt 1850 bis 2000. In K. Brunner & P. Schneider(Eds.), Umwelt Stadt: Geschichte des Natur- und LebensraumesWien (pp. 93�103). Vienna, Austria: B€ohlau.
B€osch, M., Hellweg, S., Huijbregts, M. J., & Frischknecht, R. (2007). Apply-ing cumulative exergy demand (CExD) indicators to the ecoinventdatabase. The International Journal of Life Cycle Assessment, 12(3),181�190.
Brauner, G. (2009). Energiebereitstellung f€ur die Elektromobilit€at. Elektro-technik und Informationstechnik, 126, 371�374.
Buchal, C. (2007). Energie. J€ulich, Germany: Forschungszentrum J€ulichGmbH.
Chester, M. V. (2008). Life-cycle environmental inventory of passengertransportation in the United States. (PhD Thesis). Institute of Trans-portation Studies, University of California, Berkeley, CA.
Chester, M. V., & Horvath, A. (2009). Environmental assessment of pas-senger transportation should include infrastructure and supply chains.Environment Resource Letters, 4(2). Retrieved from http://iopscience.iop.org/article/10.1088/1748-9326/4/2/024008/fulltext/024008.
Deußner, R., & Kovacic, G. (2010). Personal communication. Vienna, Aus-tria: Austrian Institute for Regional Studies and Spatial Planning.
DIN (2006). Umweltmanagement—€Okobilanz—Anforderungen und Anlei-tungen (ISO 14044:2006); Environmental management—Life cycleassessment—Requirements and guidelines (ISO 14044:2006). Germanand English version EN ISO 14044:2006. Berlin, Germany: DeutschesInstitut f€ur Normung.
Eriksson, E., Blinge, M., & L€ovgren, G. (1996). Life cycle assessment ofthe road transport sector. Science of the Total Environment,189�190, 69�76.
Grießhammer, R., Brommer, E., Gattermann, M., Grether, S., Kr€uger, M.,Teufel, J., & Zimmer, W. (2008). C02-Einsparpotenziale f€ur Ver-braucher. Freiburg, Germany: €Oko-Institut e.V.
Haapio, A., & Viitaniemi, P.. (2008). A critical review of building environ-mental assessment tools. Environmental Impact Assessment Review, 28(7), 469�482.
Harwatt, H., Tight, M., & Timms, P. (2011). Personal transport emis-sions within London: Exploring policy scenarios and carbon reduc-tions up to 2050. International Journal of SustainableTransportation, 5(5), 270�288.
Hong, W., & Kim, S. (2004). A study on the energy consumption unit ofsubway stations in Korea. Building and Environment, 39, 1497�1503.
Huijbregts, M. A. J, Hellweg, S., Frischknecht, R., Hendriks, H. W. M,Hungerb€uhler, K., & Hendriks, A. J. (2010). Cumulative energydemand as predictor for the environmental burden of commodity pro-duction. Environmental Science and Technology , 44, 2189�2196.
Huijbregts, M. A. J, Rombouts, L. J., Hellweg, S., Frischknecht, R., Hen-driks, A. J., van de Meent, D., Ragas, A. M., Reijnders, L., & Struijs, J.(2006). Is cumulative fossil energy demand a useful indicator for theenvironmental performance of products? Environmental Science &Technology, 40, 641�648.
International Energy Agency (IEA). (2009). Transport energy and CO2.Moving towards sustainability. Paris, France: International EnergyAgency/OECD.
International Energy Agency (IEA). (2010). 2010 World key energy statis-tics. Paris, France: Author.
Kindler, A., Ehrengruber, J., Hubin, T., Ramskogler, C., Reiter, S., & Stranz,R. (2006). Bericht 2005. Ein Unternehmen das Menschen bewegt. Aufdem Weg zur Nachhaltigkeit. Vienna, Austria: Wiener Linien GmbHand Co KG.
INTERNATIONAL JOURNAL OF SUSTAINABLE TRANSPORTATION 129
Dow
nloa
ded
by [
TU
Wie
n U
nive
rsity
Lib
rary
] at
00:
27 1
1 Ja
nuar
y 20
16

Magistrat der Stadt, Wien. (2003). SUPer NOW. StrategischeUmweltpr€ufung f€ur den Nordosten Wiens. Vienna, Austria: Magis-tratsabteilung 18 Stadt Wien.
Magistrat der Stadt, Wien. (2009). Klimaschutzprogramm der StadtWien Fortschreibung 2010�2020. Vienna, Austria: Magistrat derStadt Wien.
May, A. D. (2012). Urban transport and sustainability: The key challenges.International Journal of Sustainable Transportation, 7(3), 170�185.
Melanie, L. (2010). Stuttgart 21 Pro und Contra: Fakten zu einem besondersumstrittenen Bauprojekt unserer Zeit. Norderstedt, Germany: BoD-Books on Demand.
Organisation for Economic Co-operation and Development (OECD)/International Transport Forum (ITF). (2010). Reducing transportgreenhouse gas emissions: Trends and data 2010. Paris, France:Authors.
€Oko-Institut e.V. (2008). Globales Emissions-Modell Integrierter SystemeGEMIS 4.5. Freiburg. Retrieved from http://www.iinas.org/gemis.html.
Ossberger, M. (2010). Personal communication. Vienna, Austria: WienerLinien GmbH and Co KG.
P€olz, W. (2007). Emissionen der Fernw€arme Wien 2005. Vienna, Aus-tria: Umweltbundesamt.
R€onk€a, K., Ritola, J., & Rauhala, K.. (1998). Underground space in land-useplanning. Tunnelling andUnderground Space Technology, 13(1), 39�49.
Rozycki, C., Koeser, H., & Schwarz, H. (2003). Ecology profile of the Ger-man high-speed rail passenger transport system, ICE. The InternationalJournal of Life Cycle Assessment, 8 (2), 83�91.
Schmid, V., Wacker, M., K€urbis, I., Krewitt, W., & Friedrich, R. (2001).Systematischer Vergleich konkreter Fahrten im Personenverkehr im Hin-blick auf umwelt- und klimarelevante Wirkungen verschiedener Ver-kehrsmittel. Stuttgart, Germany: University of Stuttgart.
Schremmer, C., Bory, B., Collon, H., Mollay, U., Neugebauer, W., Novak,S., Tordy, J., Schmitt, P., Dubois, A., Galera-Lindblom, P., Reardon, M.,Weber, R., Pratacos, P., & Mantelas, E. (2011). Urban development sce-narios. Vienna, Austria: Austrian Institute for Regional Studies andSpatial Planning (€OIR).
Schwab Castella, P., Blanc, I., Gomez Ferrer, M., Ecabert, B., Wakeman,M., Manson, J. A., Emery, D., Han, S. H., Hong, J., & Jolliet, O. (2009).Integrating life cycle costs and environmental impacts of composite railcar-bodies for a Korean train. The International Journal of Life CycleAssessment, 14, 429�442.
Siemens, A. G. (n.d.). Metro system—Wien V-Wagen, €Osterreich.Retrieved from http://www.bahnindustrie.at/upload/dokumente/172/V-Wagen.pdf
Struckl, W., & Wimmer, W. (2007). Green Line—Strategies forenvironmentally improved railway vehicles. In S. Takata and Y.Umeda (Eds.), Advances in life cycle engineering for sustainablemanufacturing businesses. Proceedings of the 14th CIRP Interna-tional Conference on Life Cycle Engineering (pp. 77�82). London,UK: Springer
VDI. (1997). Cumulative energy demand. Terms, definitions, methods ofcalculations. VDI Richtlinie 4600. D€usseldorf, Germany: Association ofGerman Engineers (VDI).
Wien Energie. (2003). Gesch€aftsbericht 2002/03(01.10.2002-30.09.2003)Vienna, Austria: Author.
Wien Energie. (2012). The Road to Renewable Energy: Wien EnergieAnnual Review 2011/12. Vienna, Austria: Author.
Wiener Linien. (2009). Jahresbericht 2008. Vienna, Austria: Author.Wiener Linien. (2010). Personal communication. Vienna, Austria:
Author.Wiener Linien. (2013). Personal communication. Vienna, Austria:
Author.Wiener Stadtwerke. (2008). Materialien der Wiener Stadtwerke zur nach-
haltigen Entwicklung. Nummer 1—Klimaschutz: Einf€uhrung politischeMeilensteine und die Ansatzpunkte der Wiener Stadtwerke. Vienna,Austria: Author.
Wiener Stadtwerke. (2011a). Ein Blick auf die Fakten. Gesch€afts- und Nach-haltigkeitsbericht 2010. Vienna, Austria: Author.
Wiener Stadtwerke. (2011b). Energieerzeugung und -bereitstellung. Vienna,Austria: Author.
Appendix
Abbreviations
CED cumulative energy demandCO2-equiv. CO2 equivalentGEMIS globales emissions-modell integrierter systeme
(global emissions model for integrated systems)GHG greenhouse gas emissionsGWP global warming potentialLCI life cycle inventoryLCIA life cycle impact assessmentPKT person kilometer traveled
130 J. LEDERER ET AL.
Dow
nloa
ded
by [
TU
Wie
n U
nive
rsity
Lib
rary
] at
00:
27 1
1 Ja
nuar
y 20
16


![Mitigation of Greenhouse Gas Emissions from Tropical Soils ...The predicted increase in greenhouse gas emissions (GHG) and the growing demand for manufactured goods[1] promote the](https://static.fdocuments.in/doc/165x107/5ecffe31df7e6609157f34b0/mitigation-of-greenhouse-gas-emissions-from-tropical-soils-the-predicted-increase.jpg)


