Asheesh Mehra, Infosys & Mark Leigh, Hudson - Journey to BPO
The journey of BPO: From business process services to business outcome service

2 Tata Consultancy Services
AbstractThe cookie-cutter approach to business process services (BPS) – wrapping mass commoditized technology levers on standard operating procedures – belies the leaps in innovation that can be achieved.
This whitepaper traces the BPS industry’s genesis and evolution with a focus on the “next big thing” that will offer enterprises an early mover advantage through a shift in business outcome driven services (BOS). The primary objective is to share real-life situations that highlight the stark differences between doing things right, versus doing the right things.
When successful outcomes in tomorrow’s BPS universe are juxtaposed with what we have been doing till date, the erstwhile critical measures for infrastructure, and operational and low-level business metrics fall woefully short of strategic goals, which is the Holy Grail of the BPS tenet.
This transition is expected to be swift, and will blend innovative levers such as ‘Captain’s Table’ from a governance perspective and ‘domain knowledge powered process as a service’ from an industry expertise standpoint using the new-age levers of digital, agile, design thinking and cloud. BPS providers who ace this test of innovation are likely to reap a disproportionate competitive advantage on a sustainable basis.
BackdropEastman Kodak blazed the trail in business process outsourcing (BPO) trail in the late-1980s by outsourcing its IT systems, and its success – in line with the theory of gaining a competitive advantage by retaining and concentrating on the core and divesting of all non-core functions – prompted others to join the bandwagon. However, the telecom revolution was yet to happen, and BPO companies were still either near-shore or domestic in their operations.
As organizations turned global, competition intensified and businesses began outsourcing more non-core operations to save costs. Simultaneously, the 1990s saw the gradual economic liberalization of several Asian countries, including India. Suddenly, there was a vast skill pool eager to fulfill business needs of organizations in North America, Europe, UK, and even Australia, at a much lower cost. The only missing piece was a way to connect these landmasses virtually, and the brewing telecommunications and internet revolution did just that.
The rest, as they say, is history, with the outsourcing trend continuing its upward trajectory. While BPOs were all about non-core processes, they also triggered a gradual shift in the definition of core versus non-core processes that could be outsourced. For example, complaints handling, once considered core, also became outsourceable, and helped improve the end customer satisfaction scores (CSAT). Tele sales followed the same path, setting the stage for the evolution of the BPO industry
3Tata Consultancy Services
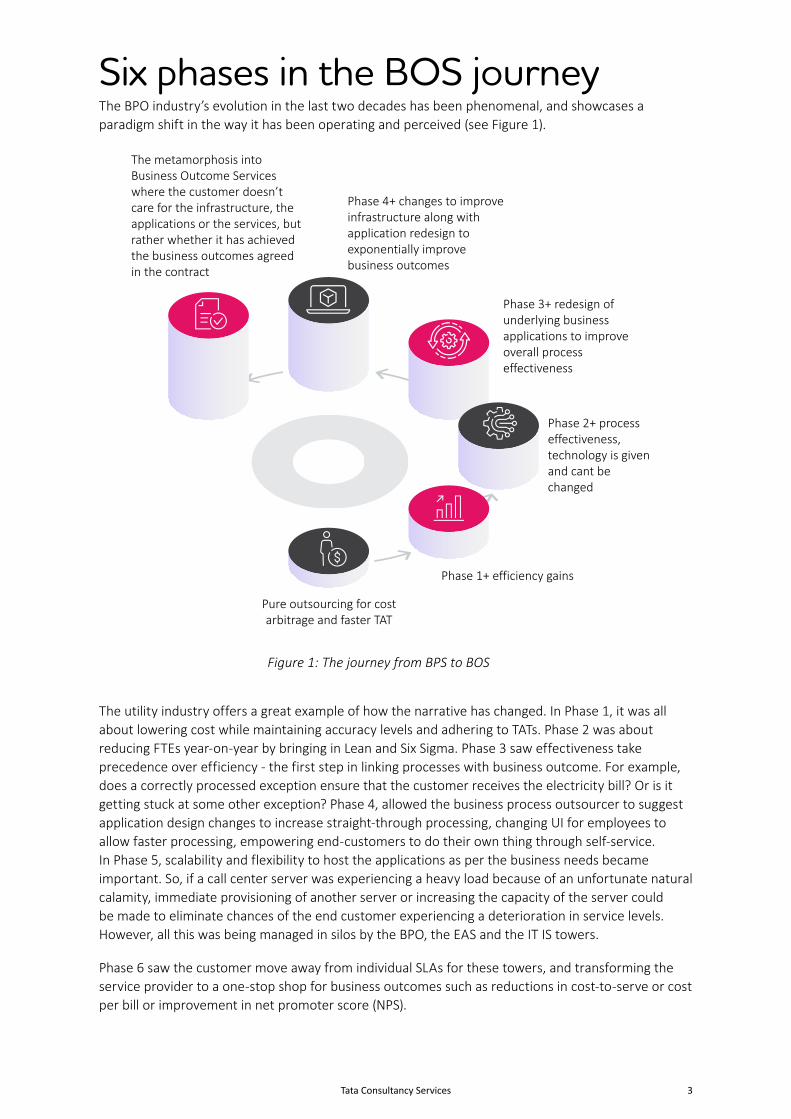
Six phases in the BOS journeyThe BPO industry’s evolution in the last two decades has been phenomenal, and showcases a paradigm shift in the way it has been operating and perceived (see Figure 1).
Figure 1: The journey from BPS to BOS
The utility industry offers a great example of how the narrative has changed. In Phase 1, it was all about lowering cost while maintaining accuracy levels and adhering to TATs. Phase 2 was about reducing FTEs year-on-year by bringing in Lean and Six Sigma. Phase 3 saw effectiveness take precedence over efficiency - the first step in linking processes with business outcome. For example, does a correctly processed exception ensure that the customer receives the electricity bill? Or is it getting stuck at some other exception? Phase 4, allowed the business process outsourcer to suggest application design changes to increase straight-through processing, changing UI for employees to allow faster processing, empowering end-customers to do their own thing through self-service. In Phase 5, scalability and flexibility to host the applications as per the business needs became important. So, if a call center server was experiencing a heavy load because of an unfortunate natural calamity, immediate provisioning of another server or increasing the capacity of the server could be made to eliminate chances of the end customer experiencing a deterioration in service levels. However, all this was being managed in silos by the BPO, the EAS and the IT IS towers.
Phase 6 saw the customer move away from individual SLAs for these towers, and transforming the service provider to a one-stop shop for business outcomes such as reductions in cost-to-serve or cost per bill or improvement in net promoter score (NPS).
Pure outsourcing for cost arbitrage and faster TAT
Phase 1+ efficiency gains
Phase 2+ process effectiveness, technology is given and cant be changed
Phase 3+ redesign of underlying business applications to improve overall process effectiveness
Phase 4+ changes to improve infrastructure along with application redesign to exponentially improve business outcomes
The metamorphosis into Business Outcome Services where the customer doesn’t care for the infrastructure, the applications or the services, but rather whether it has achieved the business outcomes agreed in the contract
4 Tata Consultancy Services
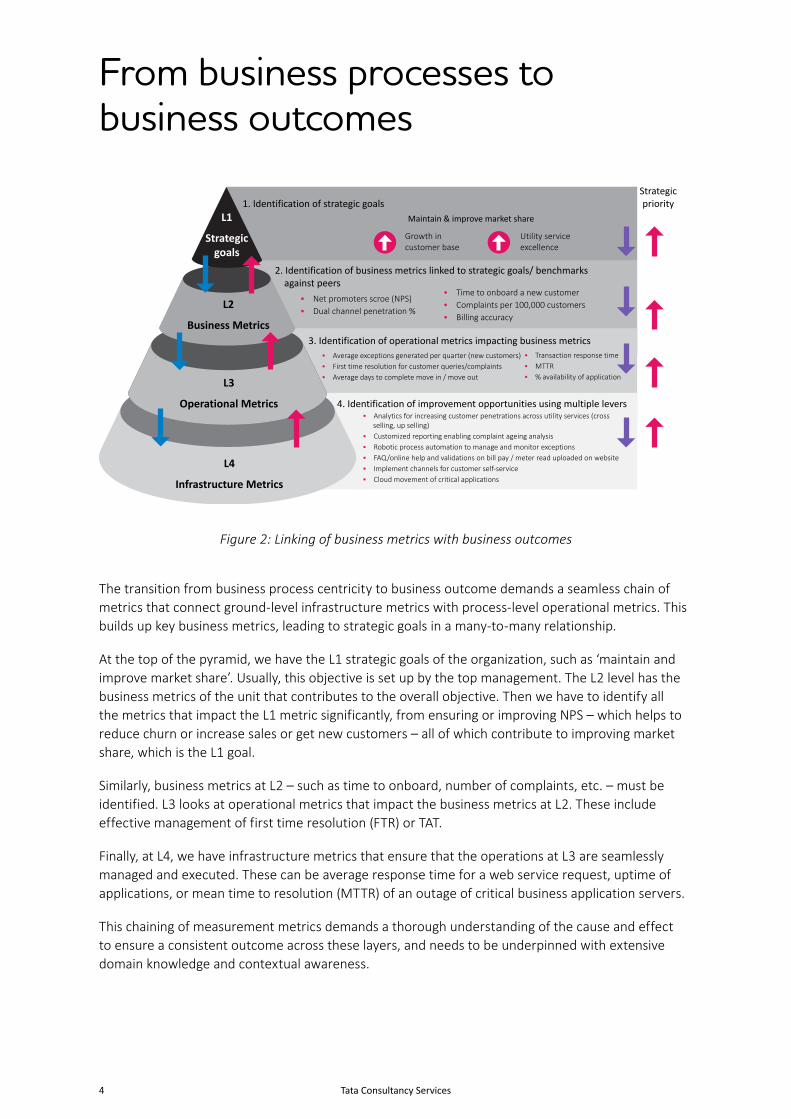
From business processes to business outcomes
The transition from business process centricity to business outcome demands a seamless chain of metrics that connect ground-level infrastructure metrics with process-level operational metrics. This builds up key business metrics, leading to strategic goals in a many-to-many relationship.
At the top of the pyramid, we have the L1 strategic goals of the organization, such as ‘maintain and improve market share’. Usually, this objective is set up by the top management. The L2 level has the business metrics of the unit that contributes to the overall objective. Then we have to identify all the metrics that impact the L1 metric significantly, from ensuring or improving NPS – which helps to reduce churn or increase sales or get new customers – all of which contribute to improving market share, which is the L1 goal.
Similarly, business metrics at L2 – such as time to onboard, number of complaints, etc. – must be identified. L3 looks at operational metrics that impact the business metrics at L2. These include effective management of first time resolution (FTR) or TAT.
Finally, at L4, we have infrastructure metrics that ensure that the operations at L3 are seamlessly managed and executed. These can be average response time for a web service request, uptime of applications, or mean time to resolution (MTTR) of an outage of critical business application servers.
This chaining of measurement metrics demands a thorough understanding of the cause and effect to ensure a consistent outcome across these layers, and needs to be underpinned with extensive domain knowledge and contextual awareness.
1. Identification of strategic goals
2. Identification of business metrics linked to strategic goals/ benchmarks against peers
4. Identification of improvement opportunities using multiple levers
3. Identification of operational metrics impacting business metrics
Maintain & improve market share
Growth in customer base
• Analytics for increasing customer penetrations across utility services (cross selling, up selling)
• Customized reporting enabling complaint ageing analysis• Robotic process automation to manage and monitor exceptions• FAQ/online help and validations on bill pay / meter read uploaded on website• Implement channels for customer self-service• Cloud movement of critical applications
• Average exceptions generated per quarter (new customers)• First time resolution for customer queries/complaints• Average days to complete move in / move out
• Transaction response time• MTTR• % availability of application
• Net promoters scroe (NPS)• Dual channel penetration %
• Time to onboard a new customer• Complaints per 100,000 customers• Billing accuracy
Utility service excellence
Strategic priority
L1
Strategic goals
L2
Business Metrics
L3
Operational Metrics
L4
Infrastructure Metrics
Figure 2: Linking of business metrics with business outcomes

5Tata Consultancy Services
A real-life example of this evolutionLet’s look at how the business outcomes can be linked to the business processes, business applications, and the underlying infrastructure through a many-to-many relationship through a utilities use case. To ensure on-time billing of the customers, the related business processes must function optimally. This includes input data (in this case the quality and timeliness of the meter read), on which the various operands have to be applied by the underlying business application logic or, where it fails, manually by the agents. The business application must be thus fine-tuned to ensure maximum straight-through processing, while preventing erroneous or doubtful data ingestion or processing, which is left to human judgment or, as we are seeing currently, more and more application of cognitive automation. Similarly, the business application is hosted and connected through an underlying infrastructure of data centers and networks that needs to function effectively to ensure that the right bill is sent out to the customer at the right time.
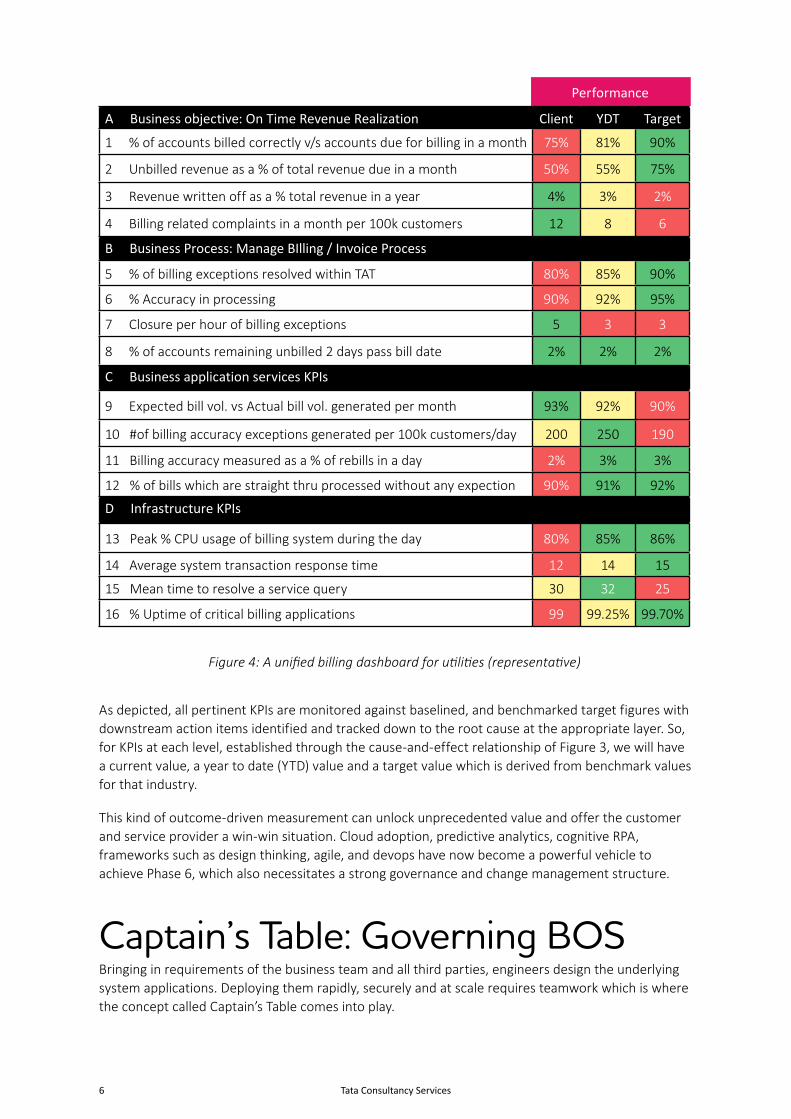
This linkage would then help create a KPI metrics dashboard which would holistically help us determine the achievement of the business objectives – a kind of balanced score card for the business objective (Figure 4) below:
Business objective
Business processes
Business application
IT infrastructure
Service desk
CRM Billing application
Manage meter data / Meter
reading process
Bill calculation
Bill simulation / generation
Invoice simulation / generation
Bill print / Mailing Bill excep�on / adjustment
Manage billing / Invoicing process
Manage cash applications
On time revenue realization
Manage collections /
Dunning
Otherapplications
Network/server/routers/ desktops/handhelds
Data centerNetwork
Figure 3: A value map for a utility company targeting KPIs of on-time revenue realization.
6 Tata Consultancy Services
As depicted, all pertinent KPIs are monitored against baselined, and benchmarked target figures with downstream action items identified and tracked down to the root cause at the appropriate layer. So, for KPIs at each level, established through the cause-and-effect relationship of Figure 3, we will have a current value, a year to date (YTD) value and a target value which is derived from benchmark values for that industry.
This kind of outcome-driven measurement can unlock unprecedented value and offer the customer and service provider a win-win situation. Cloud adoption, predictive analytics, cognitive RPA, frameworks such as design thinking, agile, and devops have now become a powerful vehicle to achieve Phase 6, which also necessitates a strong governance and change management structure.
Captain’s Table: Governing BOSBringing in requirements of the business team and all third parties, engineers design the underlying system applications. Deploying them rapidly, securely and at scale requires teamwork which is where the concept called Captain’s Table comes into play.
Performance
A Business objective: On Time Revenue Realization Client YDT Target
1 % of accounts billed correctly v/s accounts due for billing in a month 75% 81% 90%
2 Unbilled revenue as a % of total revenue due in a month 50% 55% 75%
3 Revenue written off as a % total revenue in a year 4% 3% 2%
4 Billing related complaints in a month per 100k customers 12 8 6
B Business Process: Manage BIlling / Invoice Process
5 % of billing exceptions resolved within TAT 80% 85% 90%
6 % Accuracy in processing 90% 92% 95%
7 Closure per hour of billing exceptions 5 3 3
8 % of accounts remaining unbilled 2 days pass bill date 2% 2% 2%
C Business application services KPIs
9 Expected bill vol. vs Actual bill vol. generated per month 93% 92% 90%
10 #of billing accuracy exceptions generated per 100k customers/day 200 250 190
11 Billing accuracy measured as a % of rebills in a day 2% 3% 3%
12 % of bills which are straight thru processed without any expection 90% 91% 92%
D Infrastructure KPIs
13 Peak % CPU usage of billing system during the day 80% 85% 86%
14 Average system transaction response time 12 14 15
15 Mean time to resolve a service query 30 32 25
16 % Uptime of critical billing applications 99 99.25% 99.70%
Figure 4: A unified billing dashboard for utilities (representative)

7Tata Consultancy Services
The Captain’s Table, a governance concept, ensures mutual trust and transparency in a multi-stakeholder environment where the final outcomes are tied to interdependencies. This begins with each party agreeing on a responsible, accountable, consulted, informed (RACI) matrix, adhering to back-to-back operational level agreements (OLAs), and a well-defined escalation matrix. While this can be initially managed by a consultant, as the program goes into BAU, the stakeholders need to own and manage the show collaboratively.
The objective of this framework is to ensure:
• Unambiguous stakeholder communication
• Trust and collaboration
• Agreement short-term, medium-term and long term objectives
• Resolution of operational conflicts
These are enforced through rules of engagement, which may include regular meetings for service quality reviews, monitoring of action items, participation of all relevant stakeholders through their representatives so that decisions can be taken without delays, reports, and agendas being circulated prior to the meeting, and so on.
Through this framework, we also ensure adherence to softer aspects of management, such as cultural alignment with a forward-looking solution approach to enhance collaboration and trust.
The shift away from the siloed process as separate areas fueled by enablers which include digital, dev-ops, agile, automation, among others, along with the governance structures such as Captain’s Table, have shifted focus to providing business outcomes as a service. This is now at the heart of all and every IT development/change, be it at the process, enterprise application, or IT infrastructure level.
Figure 5: Governance in a multi-stakeholder environment: Captain’s Table
Business
OLAs
SLAsKPIs on inter-vendor interfaces with measurable target
Governance structureOrganization mapping for issue resolution
Governance forumsOperational management forums and Captain’s Table
Change managementProcedure depicting change execution on OLAs
Unified RACIResponsibility Matrix depicting responsibilities & dependencies
Collaboration rulesCollaboration rules with 3rd parties to ensure E2E services
Data driven integrationReporting
requirements ownership
Captain’s Table

8 Tata Consultancy Services
Evolution of the service providersThe outsourcing industry has spawned experts who have developed deep expertise, assimilated the best practices from across the globe, cross-pollinated ideas and innovations from other industries, improvised them for their industry, and brought in an outside-in view for organizations.
Horizontal functions such as F&A, HRO, SCM have matured and improved greatly in terms of how they are managed. However, the same cannot be said about domain-specific processes. It is time we harness the wealth of domain-specific knowledge and enable them to provide tailored recommendations that have a much better chance of success in achieving the desired business outcomes. This, along with the agility in bringing about changes in the business applications, and readiness with which they can be hosted, will define the winners. IT organizations who can get their act together and approach the market with such full-service play will ride the next wave of the industry, that is BPS to BOS.
Referenceshttps://hbr.org/2011/10/a-kodak-moment-to-reconsider-t.
https://www.cgsinc.com/blog/the-evolution-of-business-process-outsourcing#:~:text=BPO%20service%20providers%2C%20as%20
we,to%20outsource%20its%20IT%20systems.
Author profileSaumabha (Somu) Barua
Saumabha (Somu) Barua leads the transformation practice for utilities and manufacturing for TCS. With 25 years of experience in building relationships with organizations from CxO level to technical level, he possesses a 360-degree view of business and industry, especially in the area of technology-led process improvement and adoption of best practices. His current areas of work include robotics, AI-ML-led digital initiatives, and predictive analytics.
Saumabha is a Bachelor in Chemical Engineering and holds an MBA degree from IIM, Calcutta.
Contact
Visit the Cognitive Business Operations page on https://www.tcs.com
Email: [email protected]
About Tata Consultancy Services Ltd (TCS)
Tata Consultancy Services is a purpose-led transformation partner to many of the world’s largest businesses. For more than 50 years, it has been collaborating with clients and communities to build a greater future through innovation and collective knowledge. TCS offers an integrated portfolio of cognitive powered business, technology, and engineering services and solutions. The company’s 488,000 consultants in 46 countries help empower individuals, enterprises, and societies to build on belief.
Visit www.tcs.com and follow TCS news @TCS.
All content / information present here is the exclusive property of Tata Consultancy Services Limited (TCS). The content / information contained here is correct at the time of publishing. No material from here may be copied, modified, reproduced, republished, uploaded, transmitted, posted or distributed in any form without prior written permission from TCS. Unauthorized use of the content / information appearing here may violate copyright, trademark and other applicable laws, and could result in criminal or civil penalties.
Copyright © 2021 Tata Consultancy Services Limited Corp
orat
e M
arke
ting
| D
esig
n Se
rvic
es |
M |
08
| 21
Awards and accolades