The Jobs Crisis. Household recession in Eastern Europe and
136
The Jobs Crisis Household and Government Responses to the Great Recession in Eastern Europe and Central Asia DIRECTIONS IN DEVELOPMENT Human Development
Transcript of The Jobs Crisis. Household recession in Eastern Europe and

ISBN 978-0-8213-8742-9
SKU 18742
The global financial crisis that began in 2007 with the implosion of the real estate bubblein the United States and parts of Western Europe led to an economic downturn so severe thatit ranks as the worst since the Great Depression. Experts coined the term “Great Recession”to convey the magnitude of the crisis. Even though the impacts, including the tightening ofcredit markets, bank failures, firm closures, and high demand for social safety nets, were feltaround the world, the countries of Eastern Europe and Central Asia were the hardest hit.
The Jobs Crisis: Household and Government Responses to the Great Recession in Eastern Europeand Central Asia brings together evidence that World Bank teams have collected on theimpact of the crisis on families in the region. The multiple monitoring tools deployed forthis effort range from qualitative studies to Crisis Response Surveys, and from extensiveuse of administrative data to monitoring policy responses from many client governmentsin the region.
The book finds that some of the strategies adopted by families to cope with the crisis, suchas reducing health care spending, ended up putting households at a higher long-term risk.Most families kept their children in school, but crisis conditions continue in some countriesand as a result, education investments may still be reduced in favor of short-term survivalin some cases.
Governments played a crucial role in mitigating the impact of the crisis on householdincomes, the book notes. Unemployment benefits were among the first to reach crisis-affected households in a number of countries. Unemployment insurance coverage variedacross countries, however, in some cases leaving many families to fend for themselvesafter the breadwinner lost his or her job. Poverty-targeted social assistance programs alsoplayed an important role in some countries to help families whose incomes had fallenbelow the poverty line. But these programs reached needy households with a delay andalso suffered from low coverage in some countries.
One of the first systematic accounts of the consequences of the current macroeconomiccrisis on the welfare of people, The Jobs Crisis examines household and governmentresponses to the crisis. The book concludes with a discussion of how governments canbetter respond to future shocks with social policies and initiatives.
TheJobs
CrisisT
HE
WO
RLD
BA
NK
The Jobs CrisisHousehold and Government Responses to
the Great Recession in Eastern Europe and Central Asia
D I R E C T I O N S I N D E V E L O P M E N T
Human Development

RUSS
IAN
FEDE
RATIO
N
KAZA
KHST
AN
KYRG
YZ R
EP.
TAJIK
ISTAN
UZBE
KIST
AN
ESTO
NIA BE
LARU
S
ROMA
NIA
HUNG
ARY
CZEC
H RE
P.SL
OVAK
REP.
SERB
IA FYR
MACE
DONI
A
MONT
ENEG
RO
BOSN
IA A
ND H
ERZ.
CROA
TIA
ALBA
NIA
SLOV
ENIA
MOLD
OVA
BULG
ARIA
POLA
ND
UKRA
INE
LATV
IA
LITHU
ANIA
RUSS
IAN
FED.
TURK
MENI
STAN
TURK
EY
GEOR
GIA
ARME
NIA
AZER
BAIJA
NKO
SOVO
Bla
ck S
ea
Ca
spia
nS
ea
Ba
ltic
Sea
Ara
l S
ea
Med
iter
ran
ean
Sea
IBRD
3828
0JU
LY 2
010
015
0
015
030
0 Mi
les
300
Kilom
eters
This
map w
as pr
oduc
ed by
the M
ap D
esign
Unit
of Th
e Wor
ld Ba
nk.
The b
ound
aries
, colo
rs, de
nomi
natio
ns an
d any
othe
r inf
orma
tion s
hown
onth
is ma
p do n
ot im
ply, o
n the
part
of Th
e Wor
ld Ba
nk G
roup
, any
judg
ment
on th
e leg
al sta
tus o
f any
terri
tory,
or an
y end
orse
ment
or ac
cepta
nce o
fsu
ch bo
unda
ries.
C
M
Y
CM
MY
CY
CMY
K
ECA inside-1.pdf 2/28/11 12:38:41 PM

The Jobs Crisis


The Jobs CrisisHousehold and Government Responses to the Great Recession in Eastern Europe and Central Asia

© 2011 The International Bank for Reconstruction and Development/The World Bank1818 H Street NWWashington DC 20433Telephone: 202-473-1000Internet: www.worldbank.org
All rights reserved
1 2 3 4 14 13 12 11
This volume is a product of the staff of the International Bank for Reconstruction andDevelopment/The World Bank. The findings, interpretations, and conclusions expressed in thisvolume do not necessarily reflect the views of the Executive Directors of The World Bank or thegovernments they represent.
The World Bank does not guarantee the accuracy of the data included in this work. The bound-aries, colors, denominations, and other information shown on any map in this work do not implyany judgement on the part of The World Bank concerning the legal status of any territory or theendorsement or acceptance of such boundaries.
Rights and PermissionsThe material in this publication is copyrighted. Copying and/or transmitting portions or all ofthis work without permission may be a violation of applicable law. The International Bank forReconstruction and Development/The World Bank encourages dissemination of its work and willnormally grant permission to reproduce portions of the work promptly.
For permission to photocopy or reprint any part of this work, please send a request with com-plete information to the Copyright Clearance Center Inc., 222 Rosewood Drive, Danvers, MA01923, USA; telephone: 978-750-8400; fax: 978-750-4470; Internet: www.copyright.com.
All other queries on rights and licenses, including subsidiary rights, should be addressed to theOffice of the Publisher, The World Bank, 1818 H Street NW, Washington, DC 20433, USA; fax:202-522-2422; e-mail: [email protected].
ISBN: 978-0-8213-8742-9eISBN: 978-0-8213-8743-6DOI: 10.1596/978-0-8213-8742-9
Library of Congress Cataloging-in-Publication DataThe jobs crisis : household and government responses to the great recession in Eastern Europeand Central Asia.
p. cm. — (Directions in development)Includes bibliographical references.ISBN 978-0-8213-8742-9 (alk. paper) — ISBN 978-0-8213-8743-61. Manpower policy—Europe, Eastern. 2. Europe, Eastern—Social policy. 3. Recessions—Europe,
Eastern. I. World Bank.HD5764.7.A6J63 2011331.12'0420947—dc22
2011006400
Cover photo: Unemployment office in Kurgan, Russia. Photo by ITAR-TASS / AlexanderAlpatkin.Cover design: Naylor Design.

v
Foreword xiAcknowledgments xiiiAbbreviations xvOverview xvii
Chapter 1 Introduction 1Eastern Europe and Central Asia Were
Particularly Hard Hit by the Global GDP Contraction, the First Since World War II 2
Four Transmission Channels: How the Crisis Affects Household Welfare 5
About This Report 7Note 11
Chapter 2 Labor Market Impacts 13Labor Markets Were the Main Transmission
Channel for the Crisis 14Unemployment Increased Sharply 15Workers Who Kept Their Jobs Took Home
Smaller Paychecks 20
Contents

In Bulgaria, Labor Market Adjustments Were More Severe on Roma and Turkish Minorities 26
The Employment Decline Varied across Countries Due Not Only to Labor Market Regulations but also to a Confluence of Factors 26
Foreign Labor Market Conditions Spawned Domestic Consequences 29
Notes 31
Chapter 3 Household Coping Mechanisms 33Crisis Impacts Prompt Steps to Increase
Disposable Income and Reduce Expenditures 34Households That Experienced a Shock
Sought to Cope by Increasing Disposable Income 37
Households That Experienced a Shock also Coped by Reducing Expenditures during the Crisis 41
Poor and Minority Households Coped by Adopting Riskier Coping Strategies than Rich Households 46
Notes 51
Chapter 4 Social Policy Responses to Protect Households 55Four Tools Have Been Deployed to Protect People
from the Effects of the Crisis 56Labor Market Measures Have Been Deployed
and Early Results Are Encouraging 57Social Assistance Measures Have Been Leveraged
and the Response Is Mixed 64Minimum Pensions Were Used as a Crisis Response
to Protect the Poor 70Government Education Spending Was
Protected More than Government Health Sector Spending in 2009, and Some Governments Tried to Shield the Poor from Service Disruptions 70
Notes 76
vi Contents

Chapter 5 Improving Responses to Subsequent Crises 79Automatic Stabilizers 82Adjusters 84Starters 87Crisis Responses Require Fiscal Discipline,
Planning, and Data 90More Work on Crisis Responses Is Needed 92Notes 92
References 95
Boxes1.1 Crisis Response Surveys 83.1 Methodology to Assess the Social Impacts of the
2009 Crisis 423.2 The Impacts of Past Crises on Education Outcomes
Were Mixed 443.3 Most Impacts of Past Crises on Health Outcomes
Were Negative 473.4 Serbia Roma Crisis Assessment 514.1 Eastern European and Central Asian Countries
Used the Crisis as an Impetus to Initiate or Accelerate Structural Adjustments to Reduce High Fiscal Deficits 73
FiguresO.1 GDP Contracted More Significantly in Eastern
Europe and Central Asia in 2009 Relative to Other Regions and the Recovery in 2010 Was also More Muted than in Other Regions xviii
O.2 Unemployment Increased in Most of Eastern Europe and Central Asia between 2008 and 2009 xx
O.3 Far More Workers Took Home Smaller Paychecks than Lost Their Jobs xxi
O.4 Households Tried to Increase Income or Reduce Expenditures to Mitigate the Impacts of the Crisis xxiii
O.5 Crisis-affected Households Increased Vulnerability to Future Shocks by Adopting Risky Coping Strategies xxiv
O.6 Three Pillars to an Effective Crisis Response xxviii
Contents vii

1.1 GDP Contracted More Significantly in Eastern Europe and Central Asia in 2009 Relative to Other Regions 2
1.2 Twenty of 30 Eastern European and Central Asian Economies Contracted in 2009 3
1.3 Years of Development in Eastern Europe and Central Asia Were Undone by the 2009 Recession,Which Was More Severe than Past Financial Crises in the Region 4
1.4 Fiscal Positions Deteriorated Substantially in Many Eastern European and Central Asian Countries, 2008–10 6
1.5 Economic Crises Affect Households through Four Main Transmission Channels 7
2.1 Firm Responses to Demand Shocks 152.2 In Four Eastern European and Central Asian Countries,
the 2009 Crisis Affected Most Households through the Labor Market Channel 16
2.3 Unemployment Increased in Most Eastern European and Central Asian Countries between 2008 and 2009 17
2.4 In a Majority of Eastern European and Central Asian Countries, Males Made Up a Bigger Fraction of the Registered Unemployed in 2009 Relative to 2008 18
2.5 Youth Unemployment Rates in Eastern Europe and Central Asia Were Twice Those of Adult Unemployment Rates in 2009 According to LFS Data 19
2.6 Long-Term Unemployment Increased Dramatically in Some Countries between End–2008 and End–2009 20
2.7 Number of Registered Job Seekers per Vacancy Increased between 2008 and 2009, Revealing a Tighter Labor Market in Most Countries 21
2.8 Far More Workers Took Home Smaller Paychecks than Lost Their Jobs 22
2.9 Education Shielded Some Workers from Job Losses, but Not from Earnings Reductions 23
2.10 Part-Time and Temporary Employment Increased from Q4 2008 to Q4 2009, Albeit from a Low Base 24
2.11 Real Wages Declined Sharply in Some Eastern European and Central Asian Countries, and Increased in Others from Q4 2008 to Q4 2009 25
viii Contents

2.12 In Bulgaria, Roma and Turkish Ethnic Minorities Were Hit Harder by Labor Market Shocks than Nonminorities 26
2.13 The Employment Growth to Economic Growth Relationship Varied Considerably across Eastern European and Central Asian Countries, 2008–09 28
2.14 Remittances Declined Significantly in 2009 across Eastern Europe and Central Asia 30
2.15 Remittance Inflows Contracted Significantly in Some Eastern European and Central Asian Countries between 2008 and 2009 31
3.1 Households Tried to Increase Income or Reduce Expenditures to Mitigate the Impacts of the Crisis 35
3.2 Households Coped with the Crisis by Adopting Measures to Increase Incomes or Decrease Household Expenditures 36
3.3 Households Increased Labor Supply in Response to the Crisis 38
3.4 In Bulgaria, Wealthy Households Were More Likely to Succeed in Finding Additional Work than Poor Households 39
3.5 In Montenegro, Poor Households Were More Likely to Increase Labor Supply in Agriculture 40
3.6 Households That Were Directly Affected by the Crisis Increased Their Vulnerability to Future Shocks by Adopting Riskier Coping Strategies than Crisis-UnaffectedHouseholds 49
3.7 In Bulgaria, Roma and Turkish Minority Households Adopted Riskier Coping Strategies than the Majority 50
4.1 A Typology of Labor Market Policy Measures Enacted to Mitigate the Impact of the Crisis 58
4.2 Unemployment Insurance Was the First Government Social Response to Households Affected by the Crisis 59
4.3 Unemployment Benefits Cover Only a Fraction of Total Registered Unemployed in Many Eastern European and Central Asian Countries 60
4.4 Informal Sector Employment Is Sizable in Some Countries and These Workers Generally Are Not Covered by Unemployment Insurance 61
4.5 In Ukraine, Higher Proportions of the Unemployed Have Lost Coverage of Unemployment Insurance Benefits since the Onset of the Crisis 62
Contents ix

4.6 Active Labor Market Program Budgets Were Fortified in Many Countries to Reduce Long-Term Unemployment 63
4.7 Last-Resort Social Assistance Programs Account for a Small Share of Social Assistance Spending and Cover a Small Share of the Poor in Many Eastern European and Central Asian Countries 65
4.8 Performance Varied among Last-Resort Social Assistance Programs as a Crisis Response 66
4.9 Some Eastern European and Central Asian Countries Reduced Real Health and Education Spending during the Crisis 71
5.1 Three Pillars to an Effective Crisis Response 805.2 Social Transfers Increased in Most Countries in 2009
Relative to 2008 91
Tables3.1 Health and Some Education Coping Strategies Were
Adopted by Households across Four Eastern European and Central Asian Countries 44
4.1 Mechanisms for Governments to Mitigate the Impact of the Crisis on Households 56
4.2 Measures Taken by Eastern European and Central Asian Countries to Improve the Last-Resort Social Assistance Response to the Crisis 69
x Contents

xi
The financial crisis and the ensuing economic downturn, the worst sincethe Great Depression in the 1930s, went hand in hand with tightening ofcredit markets, bank failures, firm closures, and high demand for socialsafety nets. In no region of the world were such consequences more pro-nounced than in the countries of Eastern Europe and Central Asia.
This report, The Jobs Crisis: Household and Government Responses to theGreat Recession in Eastern Europe and Central Asia, brings together evi-dence that World Bank teams have collected on the impact of the crisison households and families in Eastern Europe and Central Asia. The mul-tiple monitoring tools employed in this study range from qualitative stud-ies to the fielding of Crisis Response Surveys, and from extensively usingadministrative data to collecting information on policy responses frommany client governments in the region.
This report shows how the crisis was felt by Eastern European andCentral Asian households. Not only did unemployment rise sharply but italso lasted longer.The report also shows that the pain of the recession wasbroader, with workers taking home smaller paychecks as firms offeredlower wage rates and fewer hours of work to their workers. The Jobs Crisisfinds that households used a variety of ways to cope with the crisis. Insome cases, those strategies put households at a higher long-term risk, for
Foreword

example, by reducing spending on health care. Thankfully, most house-holds kept their children in school, but the longer crisis conditions con-tinue, the higher the chances are that education investments will bereduced in favor of short-term survival.
The Jobs Crisis presents an account of how governments reacted to thecrisis through social policy reforms and initiatives—and how suchresponses could be improved in the future. Unemployment insurancebenefits played a particularly important cushioning role, but coverage ofthe unemployed tended to be limited. Poverty-targeted social assistanceprograms often reacted only with a lag and suffered from low coverage insome countries. Despite severe fiscal pressures, however, governmentstended to protect education budgets, and health budget cuts were oftensmaller than the overall gross domestic product contraction. Althoughboth education and health sectors are in need of structural reforms inmany countries, protecting those budgets while implementing long-termreforms is crucial to ensuring basic human capital investments.Strengthening automatic stabilizers, adjusting program parameters, andstarting new social programs can help governments respond better tocrises in the future.
We hope that The Jobs Crisis will find interested readers in the regionand beyond, as it is one of the first systematic accounts of the conse-quences of the current macroeconomic crisis on the welfare of people.
Philippe H. Le Houérou Vice President, Europe and Central Asia
The World Bank
xii Foreword

xiii
This report was prepared by a team led by Mohamed Ihsan Ajwad andcomprising Mehtabul Azam, Basab Dasgupta, Lire Ersado, SarojiniHirshleifer (Consultant), Aylin Isik-Dikmelik, Johannes Koettl, ArvoKuddo, Nadezhda Lepeshko, Isil Oral, Emily Sinnott, Owen K. Smith,and Julia Smolyar.
The team benefited from contributions from Meltem Aran(Consultant), Rajna Cemerska-Krtova, Ufuk Guven, FranciscoHaimovich (Inter-American Development Bank), Oleksiy Ivaschenko,Laurie Joshua (Consultant), Sachiko Kataoka, Igor Kheyfets, Andrei R.Markov, Ambar Narayan, Daniel Owen, Katerina Petrina, CristobalRidao-Cano, Jan J. Rutkowski, Carolina Sanchez-Paramo, Pia HeleneSchneider, Anita M. Schwarz, Ivan Shulga, Lars M. Sondergaard, VictoriaStrokova, Ramya Sundaram, Emil Daniel Tesliuc, and Carolyn Turk.
The work was conducted under the general guidance of JeskoHentschel and Indermit Gill. Excellent advice was received from TamarManuelyan Atinc, Arup Banerji, Gordon Betcherman (University ofOttawa), Charles Griffin, Kathy A. Lindert, Mamta Murthi, TrumanPackard, M. Willem van Eeghen, and Abdo Yazbeck.
Acknowledgments

The work benefited greatly from the following peer reviewers: LouiseJ. Cord, Aline Coudouel, Andrew D. Mason, and Marijn Verhoeven.Excellent suggestions were received from David Balan, Amit Dar,Shivanthi Gunasekera, and William F. Maloney.
Katerina Timina served as the program assistant. Bonita J. Brindley andEEI Communications edited the document. Dorota Kowalska coordinatedthe launch and dissemination of the publication. Paola Scalabrin, AzizGökdemir, and Deb Barker of the World Bank Office of the Publishercoordinated book production including design, editing, typesetting, print-ing, and electronic conversion.
xiv Acknowledgments

xv
ALMP Active Labor Market ProgramCRS Crisis Response SurveyESF European Social Fund EU European UnionGDP Gross Domestic ProductGMI Guaranteed Minimum IncomeHBS Household Budget SurveyHIF Health Insurance FundsILO International Labour OrganizationIMF International Monetary FundISKUR Turkish Employment AgencyLFS Labor Force SurveyLRSA Last-Resort Social AssistanceLVL Latvian LatMIP Medical Insurance ProgramNGO Nongovernmental OrganizationOECD Organisation for Economic Co-operation and
DevelopmentOSI Open Society Institute
Abbreviations

PSM Propensity Score MatchingUI Unemployment InsuranceUNICEF United Nations Children’s FundWWS Workplaces with StipendsYoY Year over Year
xvi Abbreviations

xviixvii
Introduction
The onset of the financial crisis was evident as early as mid-2007 when areal estate bubble in the United States and parts of Western Europeimploded, triggering multiple bank failures. In a short period of time, prop-erty values plummeted, the value of retirement accounts shrank, house-hold savings evaporated, and general consumer and producer confidencedisappeared. The financial crisis swiftly expanded into an economic crisisthroughout America and Western Europe, from where it spread to devel-oping countries that had depended on foreign direct investment, consumerand mortgage credit, trade, and remittances. By early 2009, it was clear thatthis economic downturn would be more severe than any crisis since theGreat Depression, prompting some to refer to it as the “Great Recession.”
Eastern European and Central Asian countries were hit particularlyhard (see figure O.1). During 2009, global gross domestic product (GDP)contracted for the first time since World War II—about 2.2 percent—butacross the region,1 the average contraction was more than 5 percentand 20 of 30 economies recorded declines in GDP. Simulations ofpoverty rates given GDP contractions indicate that by the end of 2010,there could be 10 million more poor people in Eastern Europe andCentral Asia, relative to baseline precrisis projections. Estonia, Latvia,
Overview

xviii Overview
and Lithuania were among the hardest hit with sharp economic contrac-tions of 14 to 18 percent. Large countries also suffered severe GDP con-tractions: the Russian Federation, 7.9 percent; Turkey, 4.7 percent; andUkraine, 15.1 percent.
Unprecedented fiscal pressures emerged in many of the region’s coun-tries. Public finances deteriorated sharply in 2009, with an average declinein the fiscal position equivalent to 3.8 percent of GDP. As growth weak-ened, government revenues fell and spending on social protection pro-grams rose for those countries worst hit by the economic downturn.
The fiscal reaction to the crisis varied across the region. Three oil andgas exporters—Azerbaijan, Russia, and Uzbekistan—suffered the largestdecline in the fiscal balance in 2009. Abundant public savings built up inrecent boom years allowed these countries to put in place expansionaryfiscal policies. In contrast, for a number of countries in Eastern Europe,
Figure O.1 GDP Contracted More Significantly in Eastern Europe and Central Asia in 2009 Relative to Other Regions and the Recovery in 2010 Was also More Mutedthan in Other Regions
–6
–4
–2
0
2
per
cen
t ch
ang
e
4
6
8
10
12
Eastern
Europe and
Central A
sia
Latin A
meric
a and
the C
aribbean
Mid
dle East and
North A
frica
East Asia
and
the Pacif
ic
South A
sia
Sub-Sahara
n Afri
ca
2009 2010
GDP growth for 2009 and forecasts for 2010
Source: World Bank staff calculations using IMF World Economic Outlook Database, October 2010.Note: Regional averages include only low- and middle-income countries based on World Bank classification ofregions. Eastern Europe and Central Asia also includes Croatia, Czech Republic, Estonia, Hungary, Latvia, Poland,Slovak Republic, and Slovenia.

the boom years had led to growing public spending commitments withno accumulation of buffer-stock savings.
About This Report
The impact of economic crises on household welfare typically aretraced through four main transmission channels: (i) financial markets,via reduced access to credit, eroding savings, and sinking asset values;(ii) product markets, via lower growth and production, and relativeprice changes; (iii) labor markets, via falling employment, wages, andremittances; and (iv) government services, via declining education,health, and social protection services. Although these four transmis-sion channels all affect household welfare, this report focuses on labormarkets and government services.
This report presents the findings that emerged from a heightenedmonitoring effort launched by the World Bank to track the impacts ofdeteriorating macroeconomic conditions on families and governmentsocial responses to the crisis in Eastern European and Central Asian coun-tries. The report synthesizes findings from administrative sources (forexample, public employment offices, social benefits monitoring), CrisisResponse Surveys, and government social responses. The report exploresthe following topics: (i) labor market adjustments, from firms halting newhiring, laying off workers, and reducing the wage bill by changing thehours of work, wage rates, and so on; (ii) coping strategies adopted byhouseholds, including measures to increase household income and reducehousehold expenditures following an income shock; and (iii) governmentsocial initiatives to protect household welfare, sometimes concurrentlywith tough fiscal consolidation measures.The report ends with reflectionson policy options for governments to better prepare themselves torespond to future shocks.
Labor Market Impacts
Crisis Response Surveys confirm that labor market deterioration was themain transmission channel of the crisis to households, as firms laid offworkers, halted hiring, and reduced their wage bill. Year over year (YoY)increases in registered unemployment in 27 Eastern European andCentral Asian countries averaged 30 percent, increasing from 9.4 to 12.2million between December 2008 and 2009 (see figure O.2).Unemployment rates rose sharply in Estonia, Latvia, and Lithuania, but
Overview xix

xx Overview
also in larger countries such as Russia,Turkey, and Ukraine. Job losses haveoccurred across the board, but the construction, retail, and manufactur-ing sectors were hit particularly hard. Among all workers, the share ofmen among registered job seekers increased, likely because the hardest hitsectors of the economy were typically male dominated. New entrants tothe labor market faced difficult employment prospects, with youthunemployment reaching record highs of 25 percent (twice the adult rate)in 17 Eastern European and Central Asian countries in 2009.
Unemployment has lasted longer and competition for jobs hasincreased considerably since the crisis. Among 20 countries, long-termunemployment increases were sharpest in Estonia, Latvia, and Lithuania.People who have remained unemployed for long periods have had diffi-culty getting rehired because of stigma, discouragement, or deteriorationof their skills. Increasingly, long-term registered unemployment has fallen
Figure O.2 Unemployment Increased in Most of Eastern Europe and Central Asiabetween 2008 and 2009
–20
0
20
40
60
80
100
120
140
160
per
cen
t ch
ang
e
Mace
donia, FYR
Kazakhsta
n
Bosnia and H
erzegovin
a
Monte
negro
Croatia
Poland
Romania
Bulgaria
Slovak Republic
EU-15
EU-27
Hungary
Turkey
Russian Federa
tion
Slovenia
Ukrain
e
Czech
Republic
Mold
ova
Latvia
Lithuania
Estonia
Source: Kuddo (2010a) using various Labor Force Surveys (rather than administrative data).Note: EU-15 countries are Austria, Belgium, Denmark, Finland, France, Germany, Greece, Ireland, Italy, Luxembourg,Netherlands, Portugal, Spain, Sweden, and the United Kingdom. EU-27 countries are EU-15 plus Bulgaria, Cyprus,Czech Republic, Estonia, Hungary, Latvia, Lithuania, Malta, Poland, Romania, Slovak Republic, and Slovenia.
Overview xxi
on youth, low-skilled workers, and minority ethnic groups. These groupsalso are more prone to poverty and social exclusion, and hence long spellsof unemployment can have a more permanent impact on these groupsthan other vulnerable groups.
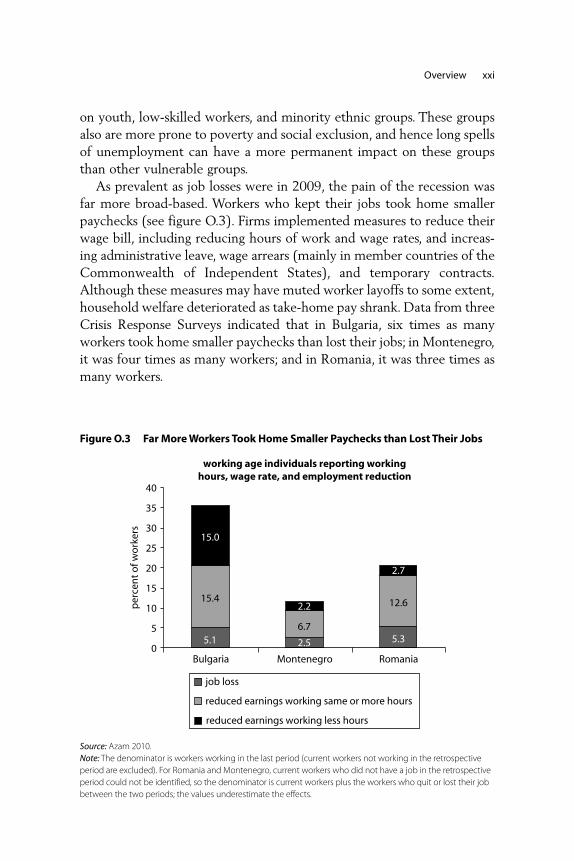
As prevalent as job losses were in 2009, the pain of the recession wasfar more broad-based. Workers who kept their jobs took home smallerpaychecks (see figure O.3). Firms implemented measures to reduce theirwage bill, including reducing hours of work and wage rates, and increas-ing administrative leave, wage arrears (mainly in member countries of theCommonwealth of Independent States), and temporary contracts.Although these measures may have muted worker layoffs to some extent,household welfare deteriorated as take-home pay shrank. Data from threeCrisis Response Surveys indicated that in Bulgaria, six times as manyworkers took home smaller paychecks than lost their jobs; in Montenegro,it was four times as many workers; and in Romania, it was three times asmany workers.
Figure O.3 Far More Workers Took Home Smaller Paychecks than Lost Their Jobs
5.1 2.5 5.3
15.4
6.7
12.6
15.0
2.2
2.7
0
5
10
15
20
25
30
35
40
Bulgaria Montenegro Romania
per
cen
t o
f wo
rker
s
job loss
reduced earnings working same or more hours
reduced earnings working less hours
working age individuals reporting workinghours, wage rate, and employment reduction
Source: Azam 2010.Note: The denominator is workers working in the last period (current workers not working in the retrospectiveperiod are excluded). For Romania and Montenegro, current workers who did not have a job in the retrospectiveperiod could not be identified, so the denominator is current workers plus the workers who quit or lost their jobbetween the two periods; the values underestimate the effects.

xxii Overview
The employment decline for each percent of GDP contractionvaried widely across countries. Relatively low worker firing costs inEstonia and Latvia led to a high employment contraction; Lithuaniaand Turkey reduced real hourly wages significantly, leading to a smalleremployment contraction; Ukraine and the former Yugoslav Republic ofMacedonia provided subsidies to companies that agreed to retainworkers, leading to less unemployment; Turkey witnessed a shift inemployment from industry to agriculture and services, most likely intothe informal sector and unpaid family labor (LFS); and, in Croatia, rel-atively inflexible labor regulations led firms to hold on to employeesearly on in the crisis, but as the crisis dragged on, layoffs increased. Assuch, the employment-to-GDP relationship depended heavily onworker firing costs, firm behavior to shrink their wage bill, governmentinterventions, and perceptions about the crisis.
Finally, because the 2009 crisis was a global crisis, deteriorating foreignlabor markets resulted in lower domestic remittance inflows to families.Here too, the region was hit harder than other regions around the world.Across the region, official remittance inflows are estimated to have fallenby 23 percent in 2009, compared with a 6 percent decline across alldeveloping countries. Armenia, Kazakhstan, Moldova, and Romania areexpected to witness sharp reductions of one-third to one-half of 2008remittance levels. These remittances have provided vital income forfamilies and, hence, these reductions could affect household welfare.
Household Coping Mechanisms
Crisis Response Surveys analyzed in Armenia, Bulgaria, Latvia,Montenegro, and Romania reflected a broad array of measures householdstook in the wake of shocks to increase incomes or reduce expenditures (seefigure O.4). Strategies to increase household disposable incomes includedincreasing labor supply, borrowing or drawing down on savings, and tap-ping informal (charitable donations, remittances, cash from friends andfamily) and formal transfers (government social safety nets). Strategies toreduce expenditures included reducing consumption of durable goods, andalso basic welfare items such as food, health care, and education.
Labor supply. Households that experienced an income shock weremore than twice as likely to increase labor supply as households that didnot, although with varying success. Many crisis-affected households sentnonworking family members to find work, and working family members

Overview xxiii
sought additional work, especially if their hours had been reduced attheir primary jobs.
Savings and borrowing. Few households were able to rely on savings andmore often households increased indebtedness. Vulnerable householdsthat experienced income shocks were more likely to be already indebtedand without savings.
Informal and formal transfers. Informal transfers were not among themost important mitigation strategies for most households and the effective-ness of formal transfers varied in their response to the crisis. In fact, giventhe global nature of the crisis, informal transfers such as remittances,receipts from charities, and help from relatives were also a transmissionchannel of the crisis.
Food expenditures. Households reduced food expenditures in fivecountries in which Crisis Response Surveys were launched, with somehouseholds reducing the quality and others the quantity of food con-sumed. Poor households were more likely to adopt this coping strategy,in some cases putting their nutritional status at risk.
Health care. Households consistently reported reducing health careexpenditures and utilization. As a result, people exposed themselves to ahigher risk of illness, disability, or in extreme cases, death. Crisis-affected
Figure O.4 Households Tried to Increase Income or Reduce Expenditures toMitigate the Impacts of the Crisis
Source of shock tohousehold
Household responses
Household welfareimpacts
• Labor markets • Increase disposable income
• Impact on poverty
• Impact on long-term human capital accumulation
• Impact on savings and assets• Reduce household
expenditure
• Credit markets
• Product markets
• Government services
• Labor supply• Dissaving/borrowing• Informal safety nets• Formal safety nets
• Durable goods• Food• Education/health• Insurance• Other
Source: World Bank staff.

xxiv Overview
Figure O.5 Crisis-affected Households Increased Vulnerability to Future Shocks byAdopting Risky Coping Strategies
Q1(poorest)
2 3 4 Q5(richest)
0
5
10
15
20
25
30
per
cen
t o
f ho
use
ho
lds
affe
cted
by
cris
is
Montenegro
asset quintile
cancelled insurance
reduced preventive care
Q1(poorest)
2 3 4 Q5(richest)
0
5
10
15
20
25
30
35
40
per
cen
t o
f ho
use
ho
lds
affe
cted
by
cris
is
Bulgaria
proportion of households that adopted health related coping strategies across asset quintiles
asset quintile
stopped buying regular medicines
skipped preventative health visits
did not visit the doctor after falling ill
Source: Azam 2010.
households in Armenia, Bulgaria, and Montenegro reduced doctor visits,medical care, and prescription drug use significantly.
In Bulgaria and Montenegro, poor households were more likely thanrich households to adopt risky coping strategies (such as reducing preven-tative health care visits, cutting prescription drug use), increasing theirvulnerability to future shocks (see figure O.5).
For example, in Bulgaria, 36 percent of crisis-affected households in thepoorest quintile stopped buying regular medications, while 7 percent ofhouseholds in the richest quintile resorted to this coping strategy; and inMontenegro, a quarter of households in the poorest quintile reduced pre-ventative care utilization, while 13 percent of households in the richestquintile did the same. In Bulgaria, the only country in which the ethnicdimension was analyzed, Roma and Turkish minorities were more likely toadopt such risky coping strategies during the crisis than nonminorities.
Education. Evidence from Armenia, Bulgaria, Montenegro, and Romaniashowed that few households reduced education investments. Generally,children in crisis-affected households were not withdrawn from schools, norwere children moved from private schools to public schools in higher pro-portions when compared with households that were unaffected by thecrisis. The low out-of-pocket and opportunity costs (because child labor isrelatively rare in the region) of sending children to school in most countriesin the region are likely to have helped families keep their children in school.

Overview xxv
Households directly affected by the crisis, however, adopted responsesthat put education outcomes at indirect risk. In Bulgaria, householdssignificantly reduced education expenditures on transportation, basicsupplies, and tutoring; also in Bulgaria and Montenegro, households can-celed or postponed training (for example, in languages and informationtechnology). These choices could reduce lifetime earnings, but are not assevere as withdrawing from general schooling.
Social Policy Responses to Protect Households
In the face of sharp GDP contractions, many Eastern European andCentral Asian countries implemented or scaled up policies and programsto protect human welfare and long-term human capital. Measures to pro-tect affected households included gearing up passive and active labormarket programs, strengthening social assistance, maintaining or increas-ing minimum pensions, and in a few instances ensuring access to healthand education services.
Passive labor market programs. In about one-third of Eastern Europeanand Central Asian countries, unemployment insurance (UI) benefits wereamong the first benefits to reach crisis-affected households, tracking reg-istered unemployment rates relatively well. Simulations of the impact ofthe recession on household welfare for Latvia showed that the presenceof a functioning UI system likely prevented an additional 3 percentagepoint increase in poverty during the height of the crisis. However, UI cov-erage is low and many unemployed people are ineligible for benefits. InDecember 2009, on average across 24 Eastern European and CentralAsian countries, Labor Force Surveys (LFSs) indicate that less than one-third of unemployed people were covered by UI.
Because of fiscal constraints brought on or exacerbated by thecrisis, some countries implemented measures to reduce UI expendi-tures. For example, Hungary and Ukraine tightened UI eligibility crite-ria, Ukraine tightened eligibility criteria to register as unemployed, theCzech Republic reduced benefit periods, and Estonia raised contribu-tion rates.
Active labor market programs. In 2009, a number of Eastern Europeanand Central Asian countries responded to deteriorating labor market con-ditions by increasing spending on programs to support those who areemployed, support new employment, provide income support, enhanceemployability, and improve job matching. Some active labor market

programs implemented during the crisis included reducing nonwage coststo raise labor force participation rates among women and youth (Turkey);implementing public works programs or increasing public investment(Armenia, Kazakhstan, Latvia, Russia); introducing or scaling up wagesubsidy programs by offering incentives for “short-time work” and reduc-ing social security contributions (Bulgaria, Estonia, Russia, Turkey); andexpanding access to training or retraining (Bulgaria, Russia).
Social assistance. Some Eastern European and Central Asian countriesleveraged Last-Resort Social Assistance (LRSA) programs as a crisisresponse. LRSA programs in the region often are well targeted to poorpeople by global standards, but make up only a small share of overallsocial assistance (noncontributory system) spending and cover a smallshare of the population. In Bulgaria, Montenegro, and Serbia, the coun-tries’ flagship LRSAs responded to the crisis by increasing coverage rates.In Armenia, coverage rates decreased during 2009, but that was due tothe government’s attempts to reduce leakage and improve targeting. Incontrast, in Romania and Ukraine, there was no appreciable increase inthe number of social assistance beneficiaries.
Pensions. A larger share of households in the region receive pensionsthan in other emerging market regions. Although pensions are notdesigned to act as LRSA, the broad coverage can make them moreeffective as a last-resort source of income during an economic contrac-tion than other safety net programs. Armenia, Romania, Russia, andTurkey significantly increased minimum pensions in 2009 to protectthe poor. In Romania, for example, the increase in pensions likelyexplains the small poverty reduction that occurred between 2008 and2009 despite the 7 percent GDP contraction. The increase in pensions,however, also contributed to a steep deterioration in the country’s fiscalbalance.
Access to education and health. Most Eastern European and Central Asiancountries protected spending on education and health. Across sevencountries analyzed, four countries increased real expenditures on educa-tion (Armenia, Moldova, Russia, Turkey), whereas the other threecountries (Bulgaria, Latvia, Ukraine) cut education expenditures but byless than their GDP contraction. A few countries implemented meas-ures to protect the poor by providing additional resources to students in schools that are planned to be consolidated (Bulgaria), protecting
xxvi Overview

programs targeting the poor and vulnerable (Armenia), and reducingout-of-pocket educational expenses (Latvia). Armenia, Moldova,Russia, and Turkey increased real health expenditures in 2009 relative to2008, and Latvia and Ukraine cut expenditures but by less than theirGDP contraction. Bulgaria, however, reduced real health expendituresby more than its GDP contraction. A few Eastern European and CentralAsian countries implemented special measures to protect poor peoplefrom further hardships resulting from health sector consolidation:increasing health care coverage (Georgia), redirecting resources to serv-ices valuable to poor people (Latvia), and exempting out-of-pocketexpenses (Armenia, Romania).
Improving Responses to Subsequent Jobs Crises
Effective crisis responses are those fiscally responsible measures that aretimely, targeted, and temporary. Timely measures inject money into theeconomy quickly to provide income support. Targeted measures provideincome support to people who are most affected by the downturn andhence would support at least a minimum welfare basket of goods for theexisting and “new” poor. Finally, temporary measures reduce or expire asthe economy improves and hence should not increase budget deficits inthe long run.
There are three pillars to an effective crisis response: (i) automatic sta-bilizers, (ii) adjusters, and (iii) starters (see figure O.6).
Automatic StabilizersEastern European and Central Asian countries’ response to the crisis wasaided by the presence of automatic stabilizers, which were establishedlong before the onset of the crisis. This helped avoid more expensivemeasures such as generalized price and wage subsidies, or prolongeddelays from implementing ad hoc emergency measures. UI benefitsworked well as an automatic stabilizer in nine Eastern European andCentral Asian countries for which benefits monitoring data are available.In Bulgaria, Estonia, Latvia, Lithuania, and Romania, the number of UIbeneficiaries more than doubled between December 2008 and 2009,likely preventing a large increase in poverty. However, the UI systemneeds to undergo reforms to further increase coverage if it is to work as abroad-based stabilizer.
Existing LRSA programs can act as automatic stabilizers during reces-sions to help households deal with income shocks. In six countries for
Overview xxvii

xxviii Overview
which benefits data are available, only three showed the expected crisisresponse. LRSA targeting performance is generally good by global stan-dards, and the programs are designed to be temporary in that they expireafter several months of benefit receipt, making them suitable automaticstabilizers. Many countries can benefit from improving the agility of thetargeting mechanism, upgrading safety net benefit administration byphasing in automated processes, and placing the burden of LRSA fundingmore on central governments, rather than local governments.
AdjustersSome judicious policy adjustments during a crisis can improve the crisisresponse. Three sets of parameters are identified in this report. First, UIbenefit amounts (Estonia, Russia, and Turkey), duration of payout(Latvia, Poland, Romania), and eligibility rules (Latvia) can be alteredwhen moral hazard is less of a risk during a downturn. Second, LRSAprogram performance can be improved (Armenia, Poland), guidelinescan be altered to increase coverage (Latvia, Romania), benefit amountscan be increased (Azerbaijan, Georgia, Kazakhstan, Latvia, Romania),and the financing burden can be altered to acknowledge local govern-ment fiscal positions (Latvia, Romania). In addition, countries could
Figure O.6 Three Pillars to an Effective Crisis Response
Automatic stabilizers
Adjusters
Starters
• Unemployment insurance benefits
• Unemployment insurance parameters
• Social assistance parameters
• Binding minimum wage levels
• Public works
• Other programs (youth apprenticeships, second- chance education programs, etc.)
• Last-resort social assistance
Source: World Bank staff.

relax activation conditions so that deserving people do not lose benefitsor become trapped in a cycle of poverty at a time when jobs are scarce.Third, minimum wage rates can be adjusted downward to reduce lay-offs among low-wage workers and to ensure that new entrants to thelabor force (youth) have a fair chance at securing employment, whileweighing tax revenue implications and the stimulus value of the lowerminimum wage.
StartersWhen existing safety nets cannot respond to the emerging vulnerablepopulation, even when program parameters are adjusted, new programscan be started to reach uncovered people and protect household welfare.For example, public works can be an effective countercyclical labor mar-ket program during covariate shocks, such as economic crises or naturaldisasters. Several Eastern European and Central Asian countries, includ-ing Armenia and Latvia, implemented public works programs in 2009 tocarry out maintenance and create community assets while reducing theswelling ranks of unemployed people by providing a minimum safety net.
To reduce implementation delays during a crisis, countries could main-tain priority “shovel-ready” programs that could ensure that resources areallocated to building infrastructure or maintaining assets with the highestvalue to the community. Also, governments could maintain flexibility insocial investment funds to generate labor-intensive work for people whenprivate sector labor demand falls.
During crises, as information emerges about uncovered vulnerablegroups, social programs can be launched to protect incomes and helphouseholds to avoid making decisions that would hurt long-term humancapital accumulation. The range of programs can vary considerablydepending on the safety net and labor programs available in the country.In Eastern Europe and Central Asia, these programs include youthapprenticeship programs, second-chance education programs, and mobil-ity allowances. However, to minimize delays and to ensure effective pro-gram design, these programs also need to be planned ahead of time.
Crisis Responses Require Fiscal Discipline, Planning, and Data
In designing social responses, the implications for the budget positionacross the cycle are important to consider. Increasing the countercyclicalsocial response can result in sharp government spending expansions dur-ing deep recessions, particularly when unemployment increases are large.
Overview xxix

Crisis responses also require reliable and timely monitoring indicators.Most of the region’s countries have strong administrative information sys-tems and regular household surveys and LFSs, but some countries mayneed to improve the reliability of their data collection.
Note
1. In this report, Eastern European and Central Asian countries refer to Albania,Armenia, Azerbaijan, Belarus, Bosnia and Herzegovina, Bulgaria, Croatia, theCzech Republic, Estonia, Georgia, Hungary, Kazakhstan, Kosovo, the KyrgyzRepublic, Latvia, Lithuania, FYR Macedonia, Moldova, Montenegro, Poland,Romania, Russian Federation, Serbia, the Slovak Republic, Slovenia,Tajikistan, Turkey, Turkmenistan, Ukraine, and Uzbekistan.
xxx Overview

1
The onset of the financial crisis was evident as early as mid-2007 whenthe real estate bubble began to deflate throughout the United Statesand parts of Western Europe, triggering multiple bank failures. BetweenFebruary and September 2008, Northern Rock, Bear Stearns, IndyMacBank, and Washington Mutual were all seized by their respective gov-ernments. On September 15, 2008, the financial world was rocked tothe foundations when Lehman Brothers filed for bankruptcy.
In rapid succession, property values plummeted, the value of retire-ment accounts shrank, household savings evaporated, and general con-sumer and producer confidence disappeared. The financial crisisswiftly expanded into an economic crisis throughout America andWestern Europe, where it spread to developing countries that haddepended on foreign direct investment, consumer and mortgage credit,trade, and remittances. By early 2009, it was clear that this economicdownturn would be more severe than any crisis since the GreatDepression during the 1930s, prompting some to refer to it as the“Great Recession.”
C H A P T E R 1
Introduction

Eastern Europe and Central Asia Were Particularly Hard Hit by the Global GDP Contraction, the First Since World War II
Globally, the gross domestic product contraction was about 2.2 percent,but in Eastern Europe and Central Asia it was more than 5 percent (seefigure 1.1). The effects of the financial crisis were particularly severe inthe region because before the crisis, most of these countries were enjoy-ing large-scale capital inflows. Simulations of poverty rates for a givenGDP contraction indicate that by 2010, there could be 10 million morepoor people in the region, relative to baseline precrisis GDP growth pro-jections if no new policies are enacted (Tiongson et al. 2010).
In 2009, output in 20 of 30 Eastern European and Central Asianeconomies contracted (see figure 1.2). Estonia, Latvia, and Lithuaniawere among the hardest hit, with sharp economic contractions thatranged from 14 to 18 percent. Large (populous) countries also suffered
2 The Jobs Crisis
Figure 1.1 GDP Contracted More Significantly in Eastern Europe and Central Asiain 2009 Relative to Other Regions
Source: World Bank staff calculations using IMF World Economic Outlook Database, October 2010.Note: Regional averages include only low- and middle-income countries based on World Bank classification ofregions. Eastern Europe and Central Asia also includes Croatia, Czech Republic, Estonia, Hungary, Latvia, Poland,Slovak Republic, and Slovenia.
–6
–4
–2
0
2
ann
ual
per
cen
tag
e ch
ang
e
4
6
8
10
12
Eastern
Europe and
Central A
sia
Latin A
meric
a and
the C
aribbean
Mid
dle East and
North A
frica
East Asia
and the
Pacific
South A
sia
Sub-Sahara
n Afri
ca
2009 2010
GDP growth for 2009 and forecasts for 2010

Fig
ure
1.2
Twen
ty o
f 30
East
ern
Eu
rop
ean
an
d C
entr
al A
sian
Eco
no
mie
s C
on
trac
ted
in 2
009
–20
–15
–10–5051015
Latvia Ukrain
eLith
uania Armenia Esto
nia
Russian Federa
tion Slo
venia Romania
Mold
ova Hungary Croatia
Monte
negro Bulgaria Turk
ey
Slovak Republic
Czech
Republic Georgia
Bosnia and H
erzegovin
a Serbia
Mace
donia, FYR Belaru
s
Kazakhsta
n Poland
Kyrgyz R
epublic Albania
Tajikist
an Kosovo
Turkm
enistan
Uzbekist
anAze
rbaija
n
aver
age
–5
.2%
annual percentage ratere
al G
DP
gro
wth
rat
es in
Eas
tern
Eu
rop
ean
an
d C
entr
al A
sian
co
un
trie
s
Sour
ce:W
orld
Ban
k st
aff c
alcu
latio
ns u
sing
IMF
Wor
ld E
cono
mic
Out
look
Dat
abas
e, O
ctob
er 2
010.
3

severe GDP contractions: the Russian Federation, 7.9 percent; Turkey,4.7 percent; and Ukraine, 15.1 percent. Fortunately, Central Asiancountries appear to have been spared from a GDP contraction in 2009.
The depth of the crisis has eroded benefits accrued during several yearsof rapid economic growth and development (see figure 1.3). Real GDP hasbeen set back several years—in Latvia, to levels seen four to five years ago;in Ukraine, seen four years ago; and in Turkey and Armenia, three yearsago.These development setbacks are comparable to the setbacks caused bythe Asian Crisis of 1998, and the Mexican Peso Crisis of 1994. The 2009
4 The Jobs Crisis
Figure 1.3 Years of Development in Eastern Europe and Central Asia Were Undone bythe 2009 Recession,Which Was More Severe than Past Financial Crises in the Region
Sources: World Bank staff calculations using IMF World Economic Outlook Database, October 2010, for all coun-tries except the United States; data for the United States are from the National Bureau of Economic Research(NBER) Macrohistory database.Note: Reference year may not identify the beginning of the crisis but instead is the year in which real GDP con-tracted by the largest amount.
–2
–2
–2
–2.5
–3
–3
–4
–4.5
Bulgaria
Moldova
Romania
Russian Federation
Armenia
Turkey
Ukraine
Latvia
–2
–2
–3
–4
–7
–10
Russian Federation (1998)
Turkey (2001)
Mexico (1995)
Thailand (1998)
Argentina (2002)
United States (1932)
current financial crisis: number of years real GDP setback (closest absolute value), year 2009 = 0
past financial crises: number of years real GDP setback (closest absolute value, reference year in brackets)

economic downturn set Russia back by more than its 1998 crisis andaffected Turkey by more than its 2001 financial crisis. This report makesno attempt to compare the impact of the 2009 crisis with the transitionfrom a planned economy to a market economy, which took place in theearly 1990s in Eastern European and Central Asian countries.
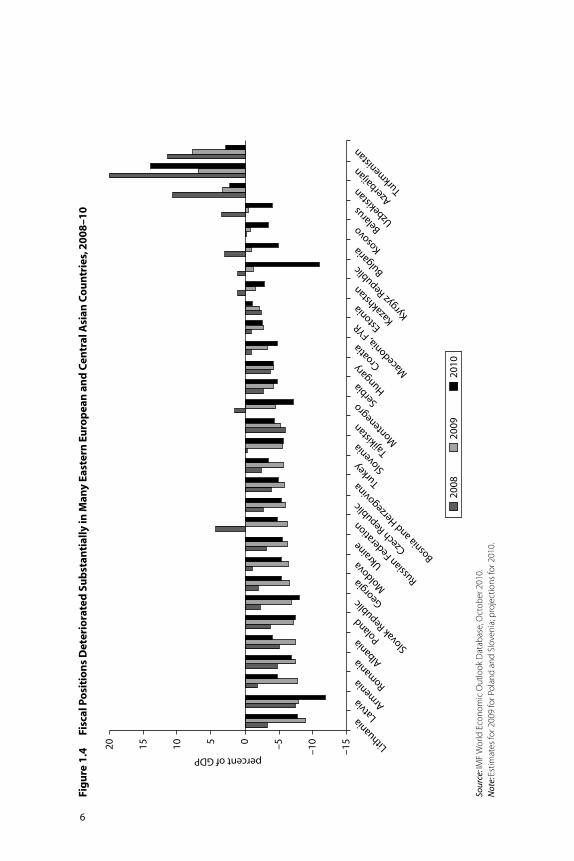
Unprecedented Fiscal Pressures Have Emerged in Many Eastern European and Central Asian CountriesPublic finances deteriorated sharply in many Eastern European andCentral Asian countries in 2009, with an average increase in fiscal deficitsequivalent to 3.8 percent of GDP (see figure 1.4). The fiscal reaction tothe crisis, however, was diverse across the region. Three oil and gasexporters in the region had the largest decline in the fiscal balance in 2009,namely, Azerbaijan, Russia, and Uzbekistan. However, abundant publicsavings built up in recent years during the boom in hydrocarbon pricesallowed these countries to put in place expansionary fiscal policies. In con-trast, for a number of countries in Eastern Europe, the boom years had ledto growing spending commitments and no accumulation of public buffer-stock savings. In general, these countries also had a higher level of auto-matic stabilizers on the expenditure side, leading to larger emergingspending pressures as the crisis unfolded. Therefore, they faced the crisiswith limited fiscal space, forcing them to adjust fiscal spending downwardas government deficits widened.
Four Transmission Channels: How the Crisis Affects Household Welfare
The social impacts of the crisis on household welfare can be tracedthrough four main transmission channels (see figure 1.5): (i) financialmarkets, via reduced access to credit, eroding savings, and sinking assetvalues; (ii) labor markets, via falling employment, wages, and remittances;(iii) product markets, via declining growth and production, and relativeprice changes; and (iv) government services, via reduced education,health, and social protection services.
Financial markets can transmit crisis effects through declining realestate prices, interest or inflation rate changes, falling stock market values,and reduced credit availability. Labor markets can transmit crisis effectswhen sector profitability declines or governments pursue contractionarypolicies. The impact on labor markets depends on the national labor mar-ket institutional structure, but usually includes reductions in employment,wages, benefits, hours of work, and accruals of wage arrears; reduced
Introduction 5
–15
–10–505101520
percent of GDP
LithuaniaLatv
ia Armenia Romania Albania Poland
Slovak Republic Georg
ia Mold
ova Ukrain
e
Russian Federa
tion
Czech
Republic
Bosnia and H
erzegovin
a Turkey Slo
venia Tajikist
an
Monte
negroSerb
ia Hungary Croatia
Mace
donia, FYR Estonia
Kazakhsta
n
Kyrgyz R
epublic Bulgaria Koso
vo Belarus
Uzbekist
anAze
rbaija
n
Turkm
enistan
2009
2010
2008
Fig
ure
1.4
Fisc
al P
osi
tio
ns
Det
erio
rate
d S
ub
stan
tial
ly in
Man
y Ea
ster
n E
uro
pea
n a
nd
Cen
tral
Asi
an C
ou
ntr
ies,
2008
–10
Sour
ce:IM
F W
orld
Eco
nom
ic O
utlo
ok D
atab
ase,
Oct
ober
201
0.N
ote:
Estim
ates
for 2
009
for P
olan
d an
d Sl
oven
ia; p
roje
ctio
ns fo
r 201
0.
6

demand for household enterprise products; and shifts from formal toinformal sector employment. Product markets can transmit effects of aneconomic crisis through changes to commodity prices, assets, exchangerates, and taxes or tariffs, triggering changes to the profitability of thesesectors, and affecting wages and employment. Government service provi-sions can transmit effects of an economic crisis through budget cuts ineducation, health, and social protection, among others.
About This Report
This report presents the first empirical findings that emerged fromanalyzing data in the region on the following: (i) the impacts of dete-riorating macroeconomic conditions on families, and (ii) the house-hold and government social responses to the crisis. It does so by drawingon a heightened monitoring effort that included synthesizing datafrom administrative sources, and specialized household surveys (CrisisResponse Surveys, see box 1.1). The report aims to introduce policymakers from Ministries of Finance, Labor, Welfare, Education, and
Introduction 7
Figure 1.5 Economic Crises Affect Households through Four Main TransmissionChannels
Labor markets
Financialmarkets
Product markets
Governmentservices
Income oremployment
shock
Credit marketshock
Relative priceshock
Education, health,social protection
service shock
Impact onhousehold
wealth
Eco
no
mic
cri
sis
Source: World Bank staff. Note: The figure shows only direct transmission channels and omits linkages among the four main channels andsecond-round impacts of the crisis. For example, teacher layoffs reduce educational services, which affect labormarkets. Also omitted are the differential impacts according to household characteristics, such as employmentsector, gender, location, mortgage type, and so on.

8 The Jobs Crisis
Box 1.1
Crisis Response Surveys
Crisis Response Surveys (CRSs) were launched in several Eastern European and
Central Asian countries to assess the effects of the crisis on households. The CRS
focused on the following, albeit to different extents:
• Assessing primary transmission channels for the effects of the crisis—labor mar-
kets, access to credit, government services—through which household welfare
was affected.
• Determining the impacts on welfare by tracking expenditures on health,
education, and food security—that cannot be quantified by administrative
data.
• Understanding household responses, such as increasing labor supply, reducing
expenditures, postponing investments, selling assets, relying on formal or infor-
mal credit, and the extent to which existing social safety nets allow effective
family coping.
Crisis Response Surveys Were Fielded in Several Countries
Led by government Led by Bank or other organization
Stand-alone survey Montenegro Bulgaria (OSI)Georgia (UNICEF)Romania (government)Tajikistan (government)
Crisis module added Life in Transition Survey Armenia (HBS, to regular survey government)
Croatia (LFS, government)Latvia (LFS, government) Serbia (LFS, government)
Source: World Bank staff.Note: HBS = Household Budget Survey; LFS = Labor Force Survey; OSI = Open Society Institute; UNICEF =United Nations Children’s Fund.
The CRS were sometimes stand-alone surveys and at other times modules
added to existing or scheduled surveys. The pros and cons of the two basic mod-
els for CRS are described below.
(continued next page)

Health to information that can improve future social responses to crises.Although all four transmission channels affect household welfare, theprimary focus of this report is on the labor channel and governmentservices channel.1
The report focuses on the following topics: (i) labor market adjust-ment, both from employment and unemployment impacts andchanges in the wage bill resulting from changes in hours of work, wagerates, and so on; (ii) coping strategies adopted by households, includ-ing measures to increase household income and reduce householdexpenditures following an income shock; (iii) government social ini-tiatives to protect household welfare, sometimes concurrently withtough fiscal consolidation measures; and (iv) policy options for
Introduction 9
Box 1.1 (continued)
Comparing a Stand-alone Survey with a Crisis Module Added to a RegularSurvey
Pros Cons
Stand-alone survey Can be implemented in a Bypasses government relatively short time systems
Flexibility with timing, Usually cannot questions incorporate a strong
No restrictions on data consumption module access or release (no poverty numbers)
Crisis module added Cheaper to carry out HBS/LFS: questionnaires to regular survey HBS: consumption module are usually long and
is available can affect response HBS/LFS: Can compare quality
some observed coping HBS: response rates are strategies with stated low in Europe and coping strategies Central Asia
HBS/LFS: delays in data release
Source: World Bank staff.Note: HBS = Household Budget Survey; LFS = Labor Force Survey.
Each CRS was tailored to country-specific crisis-related information needs and
benefited from coordination with teams that were implementing and monitor-
ing crisis-related assistance programs.
Source: World Bank staff.

governments to better prepare themselves to respond to future shocks(see chapter 5).
The report complements two other crisis-related World Bank publica-tions written in the region, namely, Mitra, Selowsky, and Zalduendo (2010)and Tiongson et al. (2010). The former report focuses on (i) whether thetransition from planned to market economies might have made the region’scountries more vulnerable to the crisis; (ii) whether the choices made inthe transition will affect the recovery; and (iii) what structural reforms areneeded to address growth constraints given the likely drop in capital flowsin the postcrisis world. Tiongson et al. (2010) focus on understanding thekey macroeconomic shocks confronted by the region and the simulatedimpact of such shocks on household welfare. Both reports analyze datathat were available at the beginning of the crisis.
This report analyzes data collected during the crisis. There are threeimportant caveats regarding findings presented in this report. First, formany people, hardships continue and the recovery is not fully realized,which in turn means that findings presented in this report must be seen asintermediate findings rather than an evaluation of the final impact of thecrisis on Eastern European and Central Asian countries. Recession condi-tions prevail in many countries with high unemployment, tight credit,eroded pension balances, diminished savings, and low consumer confi-dence. These conditions could trigger long-term impacts: people mayspend their savings or take on more debt; assets could be eroded andhuman capital accumulation could be jeopardized; job seekers maybecome discouraged and withdraw from the labor force; and people maylose their ability to smooth consumption during other (and more fre-quent) idiosyncratic shocks.
A second caveat is that, at the time of writing this report, most coun-tries have implemented only one round of fiscal consolidation measures,and more measures are likely through 2011 and possibly longer for manycrisis-affected countries as they struggle to control deficits. Especially inEuropean Union (EU) member countries, euro convergence criteria (alsoknown as the Maastricht criteria) will require more fiscal consolidationmeasures. The process of fiscal retrenchment could put human develop-ment service provisions—and, hence, human capital accumulation—atrisk if not carefully implemented.
A third caveat is that the report does not fully evaluate the impact ofthe crisis on final human development outcomes, but instead evaluatesthe impact on intermediary human development indicators. A full-scaleevaluation of the impact on final human development outcomes cannot
10 The Jobs Crisis

be undertaken at this point on a regional level because data requirementswill not be met for several months in most countries.
The report is organized as follows. Chapter 2 synthesizes findings onthe impact of the crisis on labor markets. Chapter 3 presents the copingstrategies adopted by those crisis-affected households to protect theirwelfare following an income shock. Chapter 4 presents the governments’social initiatives undertaken to protect household welfare of thoseaffected by the crisis. Finally, chapter 5 provides recommendations forgovernments to prepare for future crises based on findings from this mon-itoring effort.
Note
1. For a discussion of the financial markets channel in the region, see Tiongsonet al. (2010). The product market channel was less dominant in this crisisbecause Eastern European and Central Asian countries did not experiencelarge-scale devaluation or high inflation.
Introduction 11


13
Households reported that the effects of the crisis primarily were trans-mitted through labor market impacts: when unemployment increased,those who kept their jobs took home smaller paychecks, and remittanceinflows fell as foreign labor markets deteriorated. The findings in thischapter are derived from Labor Force Surveys (LFSs), Crisis ResponseSurveys (CRSs), and government administration units, mainly publicemployment offices.
Registered unemployment in the region rose 30 percent in one year toreach 12.2 million in December 2009. Increasing unemployment affectedmen and ethnic minorities more, because these groups are highly repre-sented in the hard-hit construction and manufacturing sectors, but youthunemployment, too, reached record highs. Unemployment lasts longerand competition for jobs has increased since the crisis began. Theseincreases in long-term unemployment are sharpest in Estonia, Latvia, andLithuania. Youth, low-skilled workers, and ethnic minorities are growingamong the registered long-term unemployed; a disturbing trend giventhat these groups are more difficult to return to employment and aremore vulnerable to poverty, social exclusion, and risk of structural (nottemporary) unemployment.
C H A P T E R 2
Labor Market Impacts

Despite the large number of job losses, a far more broad-based impactresulted as labor markets deteriorated through increased part-timeemployment, administrative leave, wage arrears, and temporary contractsas firms tried to reduce their wage bill.
The employment decline varied widely across countries. Relatively lowworker firing costs in Estonia and Latvia led to a high employment con-traction; Lithuania and Turkey reduced real hourly wages significantly,leading to a smaller employment contraction; Ukraine and the formerYugoslav Republic of Macedonia provided subsidies to companies thatagreed to retain workers, dampening unemployment figures; and, inCroatia, tight labor regulations led to a smaller initial impact on employ-ment, but as the crisis dragged on, layoffs became more common. As suchthe employment-GDP relationship depended heavily on worker firingcosts, firm behavior to shrink their wage bill, government interventions,and perceptions about the duration of the crisis.
Finally, because the 2009 crisis was a global crisis, deteriorating foreignlabor markets resulted in lower domestic remittance inflows to families.
Labor Markets Were the Main Transmission Channel for the Crisis
The 2009 crisis led firms to respond to lower output demand by reduc-ing input costs, which included labor costs. Firms can control laborcosts by (i) laying off workers; (ii) halting new worker hires; or (iii)reducing the wage bill by implementing measures that affect currentlyemployed workers, such as reducing wage rates or hours of work, shift-ing workers from permanent to temporary status, putting workers onadministrative leave, and accumulating wage arrears (figure 2.1).Therefore, the chosen mechanism with which firms reduce labor costsdepends, among other things, on firing costs, government policies dur-ing the crisis, labor union strength, and perceptions about the lengthand depth of the crisis. This report focuses on unemployment andemployment rates, and also analyzes the measures used by firms toreduce their wage bills, which have measurable impacts on households’welfare.1
CRSs (see box 1.1) reveal that deteriorating conditions in domesticand foreign labor markets were a more common reason for declining wel-fare than reductions in pensions, safety net benefits, investments, or rentalincomes2 (see figure 2.2).
14 The Jobs Crisis

• In Armenia, of the 33 percent of households that reported incomedeclines in 2009 relative to 2008, 13 percent reported income declinesfrom lower wages, 14 percent of households reported a reduction inself employment income, and 19 percent reported declines in bothinternal and external remittances.3
• In Bulgaria, of the 28 percent of households that reported a direct cri-sis impact, almost 22 percent reported that labor market conditionshad deteriorated compared with the previous year.
• In Latvia, of the 71 percent of households that reported a crisisimpact, 64 percent reported that income from wages declined.
• In Montenegro, of the 22 percent of households that reported a crisisimpact, 15 percent reported being affected by reduced wage income.4
Unemployment Increased Sharply
Across the region, some 12.2 million people were registered as unem-ployed in December 2009 compared with 8.4 million in June 2008, and9.4 million in December 2008 (Kuddo 2010a). Job losses have occurredin most sectors, but entrepreneurs and workers in construction, retail,and manufacturing sectors were hit particularly hard. The severe fiscalsqueeze also compelled some governments to shrink their payrolls inresponse to ballooning deficits, leading to government layoffs.
Labor Market Impacts 15
Figure 2.1 Firm Responses to Demand Shocks
Firm response todemand shock
Halt new hiring
Lay off workers
Reduce wage bill
Reduce working hours
Shift from permanent totemporary contracts
Reduce wage rates(bonus, benefits, etc.)
Accumulate wagearrears and put workerson administrative leave
Source: World Bank staff.

Among new EU member states, the number of unemployed rosesharply according to available LFSs. During 2008–09, unemployment inEstonia increased by 151 percent; in Lithuania, 136 percent; and inLatvia, 128 percent (Kuddo 2010a). Unemployment increases were notrestricted to small countries; Russia, Turkey, and Ukraine experiencedincreases of around 30 percent between 2008 and 2009, slightly morethan the increase in EU-15 countries. Unemployment actually declined inFYR Macedonia and Kazakhstan (see figure 2.3).
Male Representation among the Unemployed IncreasedThe share of men among registered job seekers increased in most EasternEuropean and Central Asian countries. From December 2008 toDecember 2009, the share of men among registered job seekers increased
16 The Jobs Crisis
Figure 2.2 In Four Eastern European and Central Asian Countries, the 2009 CrisisAffected Most Households through the Labor Market Channel
Armenia
13 14
percent of households reporting a shock to household income in 2009 relative to 2008
19
2
33
0
5
10
15
20
25
30
35
reduce
d wage
inco
me
decline in
fam
ily
business
decline in
rem
ittance
s
decline in
socia
l
prote
ctio
n benefit
s
crisi
s-affe
cted
reduce
d wage
inco
me
decline in
fam
ily
business
decline in
rem
ittance
s
decline in
socia
l
prote
ctio
n benefit
s
crisi
s-affe
cted
Bulgaria
22
53 3
28
0
5
10
15
20
25
30
per
cen
t
per
cen
tp
erce
nt
per
cen
t
reduce
d wage
inco
me
decline in
fam
ily
business
decline in
rem
ittance
s
decline in
socia
l
prote
ctio
n benefit
s
crisi
s-affe
cted
reduce
d wage
inco
me
decline in
fam
ily
business
decline in
rem
ittance
s
decline in
socia
l
prote
ctio
n benefit
s
crisi
s-affe
cted
Latvia
64
6 8 5
71
01020304050607080
Montenegro
15
46
0
22
0
5
10
15
20
25
Sources: Azam 2010; World Bank 2010a. Note: This report defines a labor market shock as a job loss, wage rate reduction, hours of work reduction, accu-mulation of wage arrears, or administrative leave. Each Crisis Response Survey queried households aboutwhether components of income were affected during the crisis relative to those components in 2008. A house-hold is characterized as crisis-affected if any of the household income components are lower in 2009 than theywere in 2008.

from 37 percent to 45 percent in Bulgaria, 52 percent to 58 percent inLithuania, and 44 percent to 49 percent in Poland (see figure 2.4) (Kuddo2010b). Among the sectors most affected by the crisis were the male-dominated construction and manufacturing industries.
Youth Unemployment Is Twice the Adult RateBetween 2008 and 2009, youth5 unemployment rates increased by 5.4 per-centage points, reaching 25 percent, twice the rate of adult unemploymentin 17 Eastern European and Central Asian countries (see figure 2.5). Thatis not to say that younger workers were affected disproportionately by thecrisis. In fact, high unemployment rates among youth are relatively com-mon, especially in middle-income countries.6 In 2009, in Latvia andLithuania, youth unemployment rates more than doubled relative to2008; new EU member states also witnessed a large but less significantincrease in youth unemployment. Youth-to-adult unemployment ratesacross countries, however, vary. In Romania, the youth unemploymentrate is three times the adult unemployment rate; in Kazakhstan, the youthunemployment rate is almost equal to the adult unemployment rate.
Labor Market Impacts 17
Figure 2.3 Unemployment Increased in Most Eastern European and Central AsianCountries between 2008 and 2009
Source: Kuddo 2010a.Note: EU-15 countries are Austria, Belgium, Denmark, Finland, France, Germany, Greece, Ireland, Italy, Luxembourg,Netherlands, Portugal, Spain, Sweden, and the United Kingdom. EU-27 countries are EU-15 plus Bulgaria, Cyprus,Czech Republic, Estonia, Hungary, Latvia, Lithuania, Malta, Poland, Romania, Slovak Republic, and Slovenia.
–20
0
20
40
60
80
100
120
140
160
per
cen
t ch
ang
e
Mace
donia, FYR
Kazakhsta
n
Bosnia and H
erzegovin
a
Monte
negro
Croatia
Poland
Romania
Bulgaria
Slovak Republic
EU-15
EU-27
Hungary
Turkey
Russian Federa
tion
Slovenia
Ukrain
e
Czech
Republic
Mold
ova
Latvia
Lithuania
Estonia

The increase in youth unemployment is cause for concern becauseyouth joblessness can lower lifetime earnings as youth take up jobs thatare beneath their skill levels and as employers discriminate against youth(who have gaps in their work history or have no work history) becausethey perceive a low-quality worker. Past work on crises also has shownthat labor market prospects among less-qualified youth are particularlyaffected by recessions, which in turn, escalates vulnerability to long-termunemployment (World Bank 2007). Young people with low educationalattainment are more susceptible to long-term unemployment, inactivity,or difficult school-to-work transitions than are young people with upper-secondary or university education.
In Some Countries, Long-Term Unemployment Increased Sharply and Competition for Jobs Became FierceThe number of workers unemployed for more than one year increaseddramatically in Estonia, Latvia, and Lithuania between the fourth quarter(Q4) 2008 and Q4 2009 (see figure 2.6). In Q4 2009, there were 38,700long-term unemployed workers in Lithuania, up from 3,100 at Q4 2008(not pictured). In Estonia, long-term unemployment in Q4 2009 was
18 The Jobs Crisis
Figure 2.4 In a Majority of Eastern European and Central Asian Countries, MalesMade Up a Bigger Fraction of the Registered Unemployed in 2009 Relative to 2008
–6
–4
–2
0
2
4
6
8
10
per
cen
t in
crea
se
Croatia
Turkey
Albania
Monte
negro
Kyrgyzs
tan
Belarus
Tajikist
an
Mace
donia, FYR
Serbia
RS B&Ha
Latvia
Hungary
Slovenia
Azerb
aijan
Armenia
Estonia
Romania
Mold
ova
Slovak Republic
Russian Federa
tion
Poland
Lithuania
Bulgaria
Source: Kuddo 2010a. a. RS B&H = Republic of Srpska (Bosnia and Herzegovina).

3.8 times higher than in Q4 2008, and in Latvia, it was 2.6 times higher.However, some countries, notably Belarus, Montenegro, Serbia, andTajikistan reduced the number of long-term unemployed.
The share of youth, low-skilled workers, and ethnic minorities grewamong the registered unemployed; this is a problem in the mediumterm as well because these groups are more difficult to return to employ-ment, and are more vulnerable to poverty, social exclusion, and structuralunemployment. Vulnerable groups easily can fall into a perpetual cycle ofunemployment if the duration of unemployment is long. The unem-ployed might get into the habit of being unemployed, their skills maydepreciate, and gaps in recent work experience may hinder their chancesof being hired.
Competition for jobs increased rapidly in 2009 relative to 2008, mak-ing it harder for job seekers to get employed, but also increasing the caseloads for public employment office staff. Between 2008 and 2009, the
Labor Market Impacts 19
Figure 2.5 Youth Unemployment Rates in Eastern Europe and Central Asia WereTwice Those of Adult Unemployment Rates in 2009 According to LFS Data
EU-27
BGRCZE
EST
LVALTUHUN
POLROM
SVN
SVK
HRVTUR
OECD
BIH
MNE
MKD
KAZ
RUS
y = 1.98x
0
10
20
30
40
50
60
70
0 5 10 15 20 25 30 35adult unemployment rate (percent)
you
th u
nem
plo
ymen
t ra
te (p
erce
nt)
Source: World Bank staff calculations based on Kuddo 2010a.Note: BGR = Bulgaria; BIH = Bosnia and Herzegovina; CZE = Czech Republic; EST = Estonia; HRV = Croatia; HUN = Hungary; KAZ = Kazakhstan; LTU = Lithuania; LVA = Latvia; MKD = Macedonia, FYR; MNE = Montenegro;OECD = Organisation for Economic Co-operation and Development; POL = Poland; ROM = Romania; RUS = Russian Federation; TUR = Turkey; SVK = Slovak Republic; SVN = Slovenia; EU-27 countries are Austria,Belgium, Bulgaria, Cyprus, Czech Republic, Denmark, Estonia, Finland, France, Germany, Greece, Hungary, Ireland,Italy, Latvia, Lithuania, Luxembourg, Malta, Netherlands, Poland, Portugal, Romania, Slovak Republic, Slovenia,Spain, Sweden, and the United Kingdom.

number of registered job seekers per vacancy increased significantly (seefigure 2.7).7 Large increases were recorded in Estonia, Latvia, and theSlovak Republic. Similarly, in the Slovak Republic, there were five timesmore job seekers in 2009 than in 2008 for each job vacancy; in Estonia,there were 10 times more job seekers in 2009 than in 2008 for each jobvacancy. At the other extreme, little change in the ratio of job seekers tovacancies was seen in Bulgaria, Kazakhstan, and Tajikistan.
Workers Who Kept Their Jobs Took Home Smaller Paychecks
Unemployment rate increases, although very significant, are only part ofthe story and do not reveal the full extent of the labor market deteriora-tion that also occurred through lower wage rates, reduced hours of work,increased mandatory administrative leave, and higher wage arrears, all ofwhich are common during economic downturns in the region. Thesemeasures helped firms control costs without laying off workers, buthousehold welfare deteriorated as incomes shrank in Eastern Europeanand Central Asian countries in response to financial uncertainty.8
20 The Jobs Crisis
Figure 2.6 Long-Term Unemployment Increased Dramatically in Some Countries between End–2008 and End–2009
–50
0
50
100
150
200
250
300
per
cen
t ch
ang
e
Tajikist
an
Belarus
Monte
negro
Serbia
Azerb
aijan
Russian Federa
tion
Armenia
Bulgaria
Poland
Croatia
Albania
RS B&H
Hungary
Slovenia
Mold
ova
Romania
Slovak Republic
Latvia
Estonia
Mace
donia, FYR
Source: Kuddo 2010a. Note: RS B&H = Republic of Srpska (Bosnia and Herzegovina). For Lithuania data, see text.

For a number of Eastern European and Central Asian countries in 2009,reduced salaries and hours of work were far more common than job losses(see figure 2.8). In Bulgaria, six times more workers took home smallerpaychecks than the number losing jobs; in Montenegro, it was four timesas many workers; and in Romania, it was three times as many workers.
Education shielded some workers from extreme income losses. InBulgaria and Romania, job losses were relatively more concentratedamong workers with no schooling or only primary school attainment(see figure 2.9). Total earnings reductions were observed across all edu-cation attainment levels, however, with more take-home pay adjust-ment for more educated workers. Because less educated workers arealso generally poorer, this pattern of labor adjustment suggests thatpoorer people were likely to have experienced a precipitous incomedecline (sparked by job loss) compared with the nonpoor (who experi-enced income reductions).9
Part-time Employment Increased, but from a Low Base Part-time employment rates increased, but the incidence of part-timeemployment in Eastern European and Central Asian countries is
Labor Market Impacts 21
Figure 2.7 Number of Registered Job Seekers per Vacancy Increased between2008 and 2009, Revealing a Tighter Labor Market in Most Countries
Source: World Bank staff calculations based on Kuddo 2010a.Note: ALB = Albania; ARM = Armenia; AZE = Azerbaijan; BGR = Bulgaria; BLR = Belarus; CZE = Czech Republic; EST = Estonia; HRV = Croatia; HUN = Hungary; KAZ = Kazakhstan; KGZ = Kyrgyz Republic; LTU = Lithuania; LVA = Latvia; MDA = Moldova; MNE = Montenegro; POL = Poland; ROM = Romania; RUS = Russian Federation;SRB = Serbia; SVK = Slovak Republic; SVN = Slovenia; TJK = Tajikistan; TUR = Turkey; UKR = Ukraine.
CZEHUN
POL
SVK
SVN
EST
LVA
LTUBGR
ROM
HRV
MNE
SRB
BLR
MDA
RUS
UKR
ARM
AZEKAZ
KGZ
TJK
TUR
y = 1.67x
0
10
20
30
40
50
60
70
80
0 10 20 30 40 50 60 70 80
registered unemployed to vacancy ratio, June 2008
reg
iste
red
un
emp
loye
d t
o v
acan
cyra
tio
, Ju
ne
2009
if registeredunemployment tovacancy ratios remainedthe same in 2009 as in2008

low relative to EU-15 countries. Between Q4 2008 and Q4 2009, thebiggest increases in part-time employment occurred in Latvia,34 percent from a base of 6.7 percent of total employment; Lithuania,25 percent from a base of 6.7; and Estonia, 22 percent from a base of7.6 percent (see figure 2.10). Some 1.2 million Ukrainian workers ofthe 20.2 million total workers were on reduced working hours duringQ1 2009. In Russia, about 4 percent of all employees at large and mid-size enterprises in key sectors worked part-time under employer-initiatedarrangements alone, and another 8 percent of employees worked part-time following mutual agreements with their employers (World Bank2010e).
Temporary Employment Increased, also from a Low BaseThe number of employees with temporary employment contractsincreased in Latvia by 49 percent and in Hungary and the CzechRepublic by 13 percent, but from a relatively low base (see figure 2.10).
22 The Jobs Crisis
Figure 2.8 Far More Workers Took Home Smaller Paychecks than Lost Their Jobs
Source: Azam 2010. Note: The denominator is workers working in the last period (current workers not working in the retrospectiveperiod are excluded). For Romania and Montenegro, current workers who did not have a job in the retrospectiveperiod could not be identified, so the denominator is current workers plus the workers who quit or lost their jobbetween the two periods; the values underestimate the effects.
5.1 2.5 5.3
15.4
6.7
12.6
15.0
2.2
2.7
0
5
10
15
20
25
30
35
40
Bulgaria Montenegro Romania
per
cen
t o
f wo
rker
s
job loss
reduced earnings working same or more hours
reduced earnings working less hours
working age individuals reporting workinghours, wage rate, and employment reduction

In Latvia, employment with temporary contracts increased to 5.2 percentof the total workforce, in Hungary to 9.3 percent, and in the CzechRepublic to 9 percent. Among new EU member states, Poland has thehighest proportion of employees with temporary contracts at 26.5 percent,followed by Slovenia with 17.1 percent.
Wage Rates Declined . . . in Some CountriesIn some new EU member states, real wages adjusted downward, especiallyin Estonia, Hungary, Latvia, Lithuania, and Slovenia (see figure 2.11). InLithuania, real hourly wages fell by 12.5 percent YoY through Q4 2009.In Estonia, Hungary, Latvia, and Slovenia, real wages declined more than4 percent YoY through Q4 2009. However, Bulgaria showed an 11 percentincrease in average hourly wages YoY through Q4 2009. In Croatia, theaverage real wage in December 2009 was nearly 3 percent lower than oneyear earlier (World Bank 2010b). Between December 2008 and December2009, in Russia, real wages fell by 2.8 percent; but in Kazakhstan, wagesincreased by 6 percent (World Bank 2010e).
Labor Market Impacts 23
Figure 2.9 Education Shielded Some Workers from Job Losses, but Not from Earnings Reductions
Source: Azam 2010.
0
5
10
15
20
25
30
35
40
per
cen
t
none
primary
seco
ndary
university
none
primary
seco
ndary
university
none
primary
seco
ndary
university
Bulgaria Montenegro Romania
job loss reduced salary
working age adults reporting job losses andearnings reductions by education attainment

24 The Jobs Crisis
Figure 2.10 Part-Time and Temporary Employment Increased from Q4 2008 to Q42009, Albeit from a Low Base
–10
–5
0
5
10
15
20
25
30
35
part-time employment rate
temporary employment rate
40
per
cen
t ch
ang
ep
erce
nt
chan
ge
Poland
Romania
EU-27
Bulgaria
Czech
Republic
Slovenia
Hungary
Slovak R
epublic
Estonia
Lithuania
Latvia
–30
–20
–10
0
10
20
30
40
50
60
Lithuania
Estonia
Romania
Bulgaria
Slovak R
epublic
Poland
EU-27
Slovenia
Czech
Republic
Hungary
Latvia
Sources: World Bank staff calculations based on Massarelli, Giovannola, and Wozowczyk 2010.

Firms Accumulated Wage Arrears and Put Workers onAdministrative Leave, Especially in Some Member Countriesof the Commonwealth of Independent States, to Control Labor CostsIn the past, particularly in member countries of the Commonwealth ofIndependent States, employers have resorted to wage arrears to postponelayoffs, especially if severance pay rules are enforced and labor laws areinflexible. However, now that governments are imposing penalties onbusinesses that accrue wage arrears, use of this measure has declined.Nevertheless, in Russia during 2009 wage arrears still amounted to3.24 billion rubles (US$105 million), or around 1 percent of the monthlywage fund in large and midsize enterprises. During 2009, an estimated1.1 million workers were on involuntary administrative leave and another859,000 were involuntarily employed part time, a 10-fold increase overthe previous year (Kuddo 2009a).
Labor Market Impacts 25
Figure 2.11 Real Wages Declined Sharply in Some Eastern European and CentralAsian Countries, and Increased in Others from Q4 2008 to Q4 2009
–15
–10
–5
0
5
10
per
cen
t ch
ang
e
15
Lithuania
Estonia
Latvia
Slovenia
Hungary
Slovak Republic
EU-27
Romania
Czech
Republic
Poland
Bulgaria
Sources: World Bank staff calculations based on Eurostat 2010; Massarelli, Giovannola, and Wozowczyk 2010; Mrlianova and Wirtz 2010.Note: Percent change in Q4 2009 compared with Q4 2008, working day adjusted. Data for Bulgaria, Hungary, Latvia, Romania, and Slovenia are provisional. Real change calculated based on annual inflation rates in December 2009.

In Bulgaria, Labor Market Adjustments Were More Severe on Roma and Turkish Minorities
In Bulgaria,10 the only country in which ethnic issues were analyzed,Roma and Turkish groups suffered disproportionately from deteriorat-ing labor market conditions (see figure 2.12).11 Among surveyrespondents, about 45 percent of Roma and 40 percent of Turkishhouseholds reported a layoff, reduced salary, or fewer hours of workrelative to 34 percent for majority households. Only 4 percent ofmajority households lost jobs compared with 17 percent of Romahouseholds and 11 percent of Turkish households. Salary reductionswere similar across the ethnic groups.
The Employment Decline Varied across Countries Due Not Only to Labor Market Regulations but also to a Confluence of Factors
As economic output declined, firms took steps to reduce their input costs,which also included controlling their labor costs. However, as describedin figure 2.1 firms controlled labor costs by (i) laying off workers; (ii) halt-ing new worker hires; or (iii) reducing the wage bill by implementing
26 The Jobs Crisis
50
per
cen
t
working-age adults reporting a job loss or reducedearnings by ethnicity
40
30
30.3
28.7
28.3
16.510.9
4.1
20
10
0Majority Turkish Roma
job loss reduced salary
Figure 2.12 In Bulgaria, Roma and Turkish Ethnic Minorities Were Hit Harder byLabor Market Shocks than Nonminorities
Source: Azam 2010.

measures that affect currently employed workers. Reducing the wage billincludes reducing wage rates or hours of work, shifting workers frompermanent to temporary status, putting workers on administrative leave,and accumulating wage arrears. Because firms have a variety of mecha-nisms in which to control labor costs, the employment growth to GDPgrowth varies with the chosen mechanism in firms, industries, and coun-tries. Therefore, the chosen mechanism with which firms reduce laborcosts depends on firing costs, government policies, labor union strength,and perceptions about the length and depth of the crisis.
Across 20 Eastern European and Central Asian countries for which2009 employment and GDP data are available, on average, a 1 percentdecrease in GDP growth was associated with a 0.5 percent decrease inemployment (see figure 2.13).12 Countries above the trend line arethose that experienced a smaller (larger) employment contraction(expansion) than the average regionwide impact for a given GDP con-traction (expansion) and vice versa. For example, FYR Macedonia,Romania, Turkey, and Ukraine all experienced smaller employment con-tractions (or even expanded employment) than would have beenexpected for a given GDP contraction. At the other extreme, Estonia,Latvia, Moldova, and Serbia all experienced larger employment con-tractions than expected for their respective GDP contractions.
The employment decline varied widely across countries because ofcountry-specific factors. Reasons for high or low employment elasticitiesof GDP are described for the following outliers:
• Low worker firing costs led to bigger employment declines in somecountries in response to a given GDP contraction (see Boeri and vanOurs 2008).13 Countries such as Latvia and Estonia, with relativelyflexible labor markets are below the trend line, meaning that moreworkers lost their jobs controlling for the size of the GDP contractionthan other Eastern European and Central Asian countries.
• Some national governments negotiated or mandated specific labormarket conditions and thereby reduced the expected employmentreduction that could have accompanied the GDP contraction. InUkraine, the government provided subsidies to selected firms inexchange for firms retaining workers. FYR Macedonia reducedsocial contributions from 32 to 26.9 percent of gross wages in 2009,essentially reducing the cost to hire or keep workers (Kuddo2009b).
Labor Market Impacts 27

• Firms’ crisis response also varied across countries and affected theemployment-GDP relationship. In Romania, fiscal consolidationmeasures launched in 2009 included lowering the public sectorwage bill by suspending bonus payments and overtime payments,and introducing a 10-day unpaid leave of absence. These measuresmay have spilled over into the private sector and, hence, layoffswere less common as firms controlled input costs with wage ratereductions rather than layoffs. Lithuania’s GDP contraction wascomparable to Estonia’s, but Estonia had a larger employment
28 The Jobs Crisis
Figure 2.13 The Employment Growth to Economic Growth Relationship VariedConsiderably across Eastern European and Central Asian Countries, 2008–09
ALBBLR
BGR
HRVCZE
EST
HUN
KAZ
LVA
LTU
MKD
MDA
POL
ROM
RUS
SRB
SVK
SVN
TUR
UKR
y = 0.5x + 0.2
–14
–12
–10
–8
–6
–4
–2
0
2
4
6
–20 –15 –10 –5 0 5
tota
l em
plo
ymen
t g
row
th (p
erce
nt)
real GDP growth (percent)
Sources: World Bank staff calculations based on IMF World Economic Outlook Database, October 2010, and ILOLABORSTA Database.Note: Official employment estimates for Belarus and Serbia; Labor Force Survey for others. Persons age 15 andover for all, except Russia (15–72 years) and Ukraine (15–70 years). Quarterly annual average data; monthly an-nual average data for Belarus, Russia, Serbia, and Turkey. ALB = Albania; BGR = Bulgaria; BLR = Belarus; CZE =Czech Republic; EST = Estonia; HRV = Croatia; HUN = Hungary; KAZ = Kazakhstan; LTU = Lithuania; LVA = Latvia;MDA = Moldova; MKD = Macedonia, FYR; POL = Poland; ROM = Romania; RUS = Russia; SRB = Serbia; SVK = Slovak Republic; SVN = Slovenia; TUR = Turkey; UKR = Ukraine.

reduction in part because real hourly wages fell more significantlyin Lithuania than in Estonia.
• Intersectoral transitions led to an increase in employment in Turkey in2009 relative to 2008. Although 309,500 jobs were lost in the indus-trial sector, 230,000 jobs were created in the agriculture sector and149,250 were created in the service sector (according to LFS data). Itappears that the jobs were created in the informal sector and that theinformal sector provided a safety net for people who could not get orcould not remain employed in the formal sector as the 2009 crisis tookits toll on the Turkish economy.
• Perceptions about the length and depth of the crisis also affectedemployment elasticities of GDP. For example, in Croatia, the sharpeconomic downturn after the onset of the crisis resulted in only asmall employment contraction because strict employment protectionlegislation led companies to weigh the high cost of firing workersagainst the projected duration of the crisis (World Bank 2010b).
Foreign Labor Market Conditions Spawned Domestic Consequences
Across the region, unemployment in host countries caused 2009 officialremittance flows to fall by 23 percent, compared with a 6 percent declineacross all developing countries (Ratha, Mohapatra, and Silwal 2010).Remittance flows essentially have the same impact on households asdomestic labor market shocks, meaning that households’ incomes fall.Although remittances are thought to be relatively resilient during crises,this decline in remittance inflows created hardships in Eastern Europeanand Central Asian countries where remittances are a significant source ofhousehold income. In the most remittance-dependent countries in theregion, the ratio of remittance incomes to GDP in 2009 was 35 percentin Tajikistan, 23 percent in Moldova, and 15 percent in the KyrgyzRepublic (see figure 2.14).
Between 2008 and 2009, remittance inflows fell in most countriesin the region, but the amount of the drop varied considerably acrosscountries; Kazakhstan, Moldova, and Romania witnessed reductions ofone-half to one-third 2008 remittance levels (see figure 2.15). Georgia,FYR Macedonia, and Latvia saw little change between 2008 and 2009remittance levels.
Labor Market Impacts 29

30 The Jobs Crisis
Figure 2.14 Remittances Declined Significantly in 2009 across Eastern Europe andCentral Asia
35.1
23.1
15.412.712.6
10.99.0
6.44.5 4.4 3.3 3.0 2.9 2.2 2.0 2.0 0.6 0.5 0.2 0.10
5
10
15
20
25
30
35
40remittances as a share of GDP, 2009
Tajikist
an
Mold
ova
Kyrgyz R
epublic
Bosnia and H
erzegovin
a
Serbia
Albania
Armenia
Georgia
Mace
donia, FYR
Romania
Bulgaria
Azerb
aijan
Lithuania
Latvia
Poland
Ukrain
e
Belarus
Russian Federa
tion
Turkey
Kazakhsta
n
–30
–20
–10
0
10
20
30
40
50
60
per
cen
tp
erce
nt
2006 2007 2008 2009
change in remittance flows, 2006–09
East Asia and the Pacific Eastern Europe and Central Asia
Latin America and the Caribbean Middle East and North Africa
South Asia Sub-Saharan Africa
Source: Inflows data from Mohapatra, Ratha, and Silwal (2010).

Notes
1. In doing so, the report ignores the “churning” that occurs in the labor marketas firms both hire and fire workers, leading to turnover.
2. A study conducted in the United States by the Pew Research Center, Socialand Demographic Trends Report (2010), revealed that 55 percent of allworking adults reported a period of unemployment, pay cut, reduced workhours, or involuntary part-time work.
3. According to the official estimates, remittances constitute 14 percent ofthe GDP.
4. In addition, around 10 percent of the households reported wage arrears inSerbia and Montenegro.
5. For this study, the term “youth” means those who are 15–24 years old.
6. Among OECD countries, youth unemployment rates increased by about6 percentage points to reach 19 percent in 2009, or about 2.8 times that ofadults. In EU-27 countries, youth unemployment rates are 2.2 times that ofadults. See Scarpetta, Sonnet, and Manfredi (2010) for details.
7. Countries with higher perceived benefits to registering, such as eligibility foractive labor market programs, social assistance, and other programs, typicallyrecord high ratios of job seekers to vacancies.
8. This finding is consistent with Khanna, Newhouse, and Paci (2010) in theiranalysis of 41 middle-income countries around the world; they found that the
Labor Market Impacts 31
Figure 2.15 Remittance Inflows Contracted Significantly in Some Eastern European and Central Asian Countries between 2008 and 2009
Source: World Bank staff calculations based on Inflows data from Mohapatra, Ratha, and Silwal (2010).
–50–45–40–35–30–25–20–15–10
–50
per
cen
t
Romania
Mold
ova
Kazakhsta
n
Turkey
Tajikist
an
Kyrgyz R
epublic
Armenia
Bosnia and H
erzegovin
a
Belarus
Lithuania
Azerb
aijan
Bulgaria
Poland
Ukrain
e
Albania
Russian Federa
tion
Georgia
Serbia
Mace
donia, FYR
Latvia

impact of the economic downturn fell disproportionately on employmentquality, meaning reduced work hours and a shift away from better-paid indus-trial sector jobs.
9. The surveys do not capture the severity of total earnings cuts (percent ofdecline).
10. The Bulgaria Crisis Response Survey is the only one that also contained aRoma booster sample and hence contained sufficient observations for Roma-specific analysis.
11. Minorities are often more vulnerable during crises. The Pew Research CenterSocial and Demographic Trends Report (2010) reported that blacks andHispanics in the United States bore disproportionately high effects from thecrisis.
12. Okun (1962) found that a 3 percent increase in output is associated with a1-percentage-point decline in unemployment.
13. However, low firing costs also are often associated with increased hiring whenthe economic recovery takes hold.
32 The Jobs Crisis

33
This chapter focuses on the coping strategies adopted by crisis-affectedhouseholds to protect their welfare following an income shock. Thechapter presents findings from a unique set of CRSs carried out duringmid-2009 and early 2010 in several Eastern European and Central Asiancountries, including Armenia, Bulgaria, Latvia, Montenegro, andRomania (see box 1.1).
Crisis-affected1 households tried to cope with income shocks byincreasing disposable income or by decreasing household expenditures.Remarkably, several key features in household responses to shocks arecommon across the countries surveyed, despite the range of differingcharacteristics among them:
• Households relied on a portfolio of strategies rather than a single strat-egy to cope with the crisis.
• Households adopted coping strategies even when they were notdirectly affected by the crisis; however, a larger proportion of crisis-affected households and poorer households adopted coping strategiesrelative to crisis-unaffected and nonpoor households.
• The most common set of strategies adopted during the crisis involvedreducing household expenditures. Surveyed households reduced
C H A P T E R 3
Household Coping Mechanisms

expenditures on a broad range of goods and services during the crisis.Durable goods purchases and food expenditures were reduced.Alarm-ingly, food purchases were reduced by the poor, whose nutritional sta-tus was at risk to begin with.
• Surveyed households tried to cope with the crisis by increasing laborsupply, despite the challenges of a weak labor market, either byincreasing the number of hours worked, or by sending nonworkingmembers of the household into the labor market.
• Few surveyed households could rely on savings and many householdswere in fact indebted when the crisis struck.
• Crisis-affected households were particularly likely to adopt riskierstrategies by cutting expenditures on health care, but at least thus farhouseholds have not pulled their children out of school.
• Crisis-affected households in the poorest quintile and in vulnerablegroups were less able to respond by increasing their incomes, andthus were more likely to reduce expenditures. These expenditurecuts included those on basic welfare goods, such as health care andsome educational expenditure.
This chapter presents the coping strategies discussed above, but leavesfor chapter 4 the discussion of households tapping formal safety nets,such as unemployment insurance and social assistance.
Crisis Impacts Prompt Steps to Increase Disposable Income and Reduce Expenditures
In response to income shocks, households try to increase income andreduce expenditures (see figure 3.1). Crisis-affected households oftenattempt to increase disposable income by expanding their labor supply,either with nonworking members of the household joining the labor forceor with working members increasing the number of jobs or hours worked;suspending saving and increasing borrowing; and relying on resourcesavailable through formal and informal safety nets. Households seeking toincrease disposable income, however, may find it difficult to do so in acontracting economy. Consequently, most households also seek to reducetheir household expenditures, sometimes cutting spending on durable andnondurable goods, but also on insurance, health, and education, whichundermines welfare and creates vulnerability to any further shocks. Afterthe initial shock, each household is forced to rely on a mix of responsesthat shifts over time as the household pool of options changes.
34 The Jobs Crisis

Evidence from CRSs shows that crisis-affected households were morelikely than unaffected households to increase labor supply, increase agri-cultural production, reduce visits to health care professionals and stopbuying prescribed medication in 2009 relative to 2008 (see figure 3.2).2
Almost always, crisis-affected households were more likely to adopt acoping strategy that included reducing a “basic welfare” item, such asfood, health care, or medicines. There are, however, two exceptions: inMontenegro, crisis-affected households were less likely to cut down onfood consumption; and in Latvia, crisis-affected households were lesslikely to cut prescription medicine purchases. More positively, house-holds did not reduce education consumption (not pictured) in 2009 rel-ative to consumption in 2008 in all countries except Latvia, where theincidence of children from crisis-affected households withdrawing fromschool was slightly higher.
In five countries in which CRSs were analyzed, households that werenot affected directly by the crisis also adopted defensive coping strate-gies along with households that were affected. This occurs partlybecause households adopt certain strategies independent of the eco-nomic cycle. These strategies might be adopted in the event of idiosyn-cratic shocks (for example, illness or death in the family, loss of incomefrom the family business failing) that were not necessarily brought on bythe economic downturn. However, these strategies also are dependent onoverall optimism or pessimism about the economy, which might beaffected by political, security, economic, or financial factors. For example,
Household Coping Mechanisms 35
Source: World Bank staff.
Figure 3.1 Households Tried to Increase Income or Reduce Expenditures to Mitigate the Impacts of the Crisis
Source of shock tohousehold
Household responses
Household welfareimpacts
• Labor markets • Increase disposable income
• Impact on poverty
• Impact on long-term human capital accumulation
• Impact on savings and assets• Reduce household
expenditure
• Credit markets
• Product markets
• Government services
• Labor supply• Dissaving/borrowing• Informal safety nets• Formal safety nets
• Durable goods• Food• Education/health• Insurance• Other

36 The Jobs Crisis
reduce
d food
consu
mptio
n
incr
eased la
bor supply
0
10
20
30
40
50
60
70
delayed medica
l
visits
reduce
d medici
ne
purchase
s
produce
d more
food
in h
ousehold
Romania
reduce
d food
consu
mptio
n
reduce
d food
consu
mptio
n
reduce
d food
consu
mptio
n
reduce
d food
consu
mptio
n
incr
eased la
bor supply
incr
eased la
bor supply
incr
eased la
bor supply
incr
eased la
bor supply
reduce
d/stopped visi
t
to h
ealth ca
re ce
nters
reduce
d buyin
g
medici
nes
incr
eased arg
icultu
ral
product
ion
incr
eased arg
icultu
ral
product
ion
incr
eased arg
icultu
ral
product
ion
incr
eased arg
icultu
ral
product
ion
0
10
20
30
40
05
10152025303540
0
5
10
15
20
25
30
35
50
60
0
10
20
30
40
50
60
reduce
d/stopped
visit t
o doct
or
reduce
d buyin
g
regular m
edicines
reduce
d visit t
o doct
or
for p
reventiv
e care
stopped b
uying
presc
ribed m
edicines
postponed visi
ting
doctors
stopped b
uying
needed medici
nes
Armenia Bulgaria
MontenegroLatvia
not affected affected
Figure 3.2 Households Coped with the Crisis by Adopting Measures to IncreaseIncomes or Decrease Household Expenditures
Source: Azam 2010.

33 percent of households in Armenia and almost 50 percent of house-holds in Latvia and Romania that were not affected directly by the crisis reported reducing food consumption in 2009 relative to 2008.These include large proportions of households and are unlikely to beexplained by the general churning that might occur as a result of idio-syncratic shocks, and instead reflect pessimism about job stability, pri-vate business earnings, relative price fluctuations, or government serviceprovision.
Households That Experienced a Shock Sought to Cope by Increasing Disposable Income
Households affected by the crisis were significantly more likely to takesteps to increase disposable income available to the family. CRSs allowthree separate categories to be investigated. First, household surveys inArmenia, Bulgaria, Montenegro, and Romania reveal that householdstried to increase labor supply by finding work for nonworking familymembers and also by increasing the number of hours of work amongworking members. Second, only a few households had access to savingsand, therefore, households had to increase borrowing to raise disposableincome. Third, households tried to tap informal transfers (remittances,charitable donations, and so on), but this strategy, which ordinarily woulddepend on foreign migrant workers, was not very successful because thecrisis was broad based and global.
Households Increased Labor SupplyIncreasing labor supply was among the most important mitigation strate-gies for households—households that experienced an income shock weremore than twice as likely to seek to increase labor supply as other house-holds.3 Most crisis-affected households sent nonworking family membersto find work, and working family members sought additional work, espe-cially if their hours had been reduced at their primary jobs. However, themajority of those who sought formal sector employment were unlikely tofind such jobs. Between 20 percent and 34 percent of crisis-affectedhouseholds increased labor supply in response to the crisis in Armenia,Bulgaria, Montenegro, and Romania (see figure 3.3). Less than 10 percentof households in Latvia used the same coping strategy. The likely expla-nation is that the labor market in Latvia was significantly less likely to beable to absorb nonworking family members or workers who were lookingto supplement their current jobs.
Household Coping Mechanisms 37

Evidence from Bulgaria reveals that while many crisis-affected house-holds tried to increase their labor supply during the recession, this strat-egy was not always successful. As many as 29 percent of crisis-affectedhouseholds tried to find additional work for nonworking family membersand did not succeed; in contrast, only 8 percent of crisis-unaffectedhouseholds tried the same strategy and did not find work (see figure 3.4,top panel). Further evidence from Bulgaria reveals that increasing laborsupply as a coping strategy was more successful for wealthier households(see figure 3.4, bottom panel). Nearly 80 percent of poor crisis-affectedhouseholds sought additional work, but only 20 percent were successful.4
In contrast, 50 percent of households in the wealthiest quintile soughtadditional work and more than half of them succeeded.
Attempts by households to increase labor supply at a time of low jobvacancies are somewhat surprising. Findings from the CRS in Montenegroreveal that crisis-affected households were almost twice as likely to seekwork during 2009 relative to 2008 (see figure 3.5). Similarly, twice asmany crisis-affected households increased agricultural production in2009 relative to 2008 than crisis-unaffected households. In Armenia,
38 The Jobs Crisis
Figure 3.3 Households Increased Labor Supply in Response to the Crisis
Source: Azam 2010.
0
5
10
15
20
25
30
35
40
per
cen
t
Armenia
Bulgaria
Latvia
Monte
negro
Romania
households that increased labor supplyin 2009 relative to 2008
not affected affected

Household Coping Mechanisms 39
Figure 3.4 In Bulgaria,Wealthy Households Were More Likely to Succeed in Finding Additional Work than Poor Households
Source: Azam 2010.
instances of finding additional work as a coping mechanism,percent of households
0 5 10 15 20 25 30
worker found additional work
nonworker found occasional work
nonworker found a full-time job
worker could not find additional work
nonworker could not find additional work
percent of households
affected not affected
0
10
20
30
40
50
60
70
Q1 (poorest) Q2 Q3 Q4 Q5 (richest)
per
cen
t o
f ho
use
ho
lds
quintiles based on per capita income
instances of finding additional work as a coping mechanism for crisis-affectedhouseholds, by income quintiles
found a job did not find a job

workers shifted into agriculture as a sector of last resort. In more formal-ized economies, such as Bulgaria, shifts took place outside the agricul-ture sector. Although 35 percent of Bulgarians suffered a labor marketshock during the crisis, others found work or increased their hours.Thesejobs were taken by households that experienced a shock, and because
40 The Jobs Crisis
Figure 3.5 In Montenegro, Poor Households Were More Likely to Increase LaborSupply in Agriculture
Source: Azam 2010.
nonworking household membersought work
increased agriculturalproduction
households that turned to agriculture in2009 relative to 2008
Q1 (poorest) Q2 Q3 Q4 Q5 (richest)
households that looked to agriculture in2009 relative to 2008 by asset quintile
0
5
10
15
20
25
per
cen
tp
erce
nt
0
5
10
15
20
25
30
35
40
increased agricultural production
increased household labor supply
affected not affected

these jobs are likely lower quality, it is not surprising that householdsalso reported income declines.
Evidence from Bulgaria Reveals That Few Households Could Rely on SavingsAcross the region, data are scarce on household-level borrowing andsaving, but available data suggest that few households were able to relyon savings to cushion the income shock during the crisis. In Bulgaria,only 23 percent of all households—and only 7 percent of householdsin the poorest quintile—reported having savings to rely on during thecrisis.
Informal Transfers Could Not Be Leveraged to Increase Disposable Income, They Were More often a Transmission Channel to Households during the 2009 CrisisInformal transfers, such as remittances, receipts from charities, and helpfrom relatives can be a mitigation strategy for households.5 However,CRSs show that informal transfers were not among the most importantmitigation strategies for most households during this crisis.6,7 For exam-ple, in Bulgaria, 6.7 percent of households reported unsuccessful attemptsto gain informal support. Unsurprisingly, the effectiveness of informaltransfers declines with the breadth of the covariate shock. With a trulyglobal crisis, or more important, when the crisis also hits countries andsectors that might be the source of informal transfers, the likelihood ofinformal transfers playing a big mitigation role is small.
In Armenia, large numbers of migrants returned from Russia and otherdestinations, and migrants who normally would head to Russia during thespring did not leave. As a result, the lack of remittances from Russia likelytransmitted the effects of the crisis to certain Armenian households.However, another informal transfer played an important role in cushion-ing the income shock on Armenian households. Nonimmediate family inthe Armenian diaspora increased their assistance to Armenian householdsin the wake of the crisis, underscoring strong extended family ties ofArmenians abroad (World Bank 2010a).
Households That Experienced a Shock also Coped by ReducingExpenditures during the Crisis
Many households reduced expenditures during the crisis (see box 3.1for discussion of the methodology). However, households that did
Household Coping Mechanisms 41

42 The Jobs Crisis
Box 3.1
Methodology to Assess the Social Impacts of the 2009 Crisis
In a background paper for this report, Dasgupta (2010) evaluated the impact of
the crisis on statistically identical households by applying a matching technique.
The analysis was conducted in four Eastern European and Central Asian countries,
namely, Armenia, Bulgaria, Montenegro, and Romania. The paper focuses on
household coping behavior in health, education, and other social sectors to iden-
tify some early patterns in deteriorating human development investments.
The methodology adopted is similar to that which is used in impact evalua-
tions. Household characteristics are expected to play a role in determining the
impact of the crisis on households. For example, households that depend on
income from the construction sector are more likely to be affected by the crisis
than households dependent on income from other sectors. This causality between
household characteristics and crisis impact leads to a selection bias, but to cor-
rect this selection bias, the methodology adopts a Propensity Score Matching
(PSM) technique. PSM identifies similar households (household characteristics
such as demographic characteristics, highest level of education, ethnicity, religion,
native language, and location are compared) except that one set of households
was affected by the crisis and the other set was unaffected by the crisis. More
specifically, the study (i) uses a Probit model to estimate the predicted probability
of being affected by the crisis and (ii) plots a kernel density for the households
affected and unaffected by the crisis and a common support region between
these two groups is identified.
The average impact is calculated as follows:
Average Treatment Effect on Treated = E(Y1 – Y0|D = 1) = E(Y1|D = 1) – E(Y0|D = 1)
Where, the first component on the right hand side is the expected value of
outcome for households who are affected by the crisis and the second compo-
nent is the same for a control group of households not affected by the crisis.
Source: Dasgupta 2010.
experience an income shock were significantly more likely to reducemajor nonessential expenditures (such as vacations and durables) andexpenditures with potential effects on basic welfare (such as food,health, and education). Focusing on what might be considered basicwelfare items, CRSs indicate that (i) large numbers of households

reduced food expenditures; (ii) families continued education consump-tion, but the true test of the education commitment will be revealedwhen data from the beginning of the new school year is analyzed; and(iii) a significant portion of households reduced health care consump-tion, sometimes by reducing visits to the doctor, sometimes by reducingmedication use, and sometimes by discontinuing health insurance cov-erage. Households in the poorest quintile and in vulnerable groups weremore likely to reduce basic welfare goods expenditures in response tomeasured shocks.
Households Reduced Food ExpendituresCRSs in five countries indicate that food expenditures were cut duringthe 2009 crisis. It can be difficult to determine the extent to whichreductions in food expenditures affect human welfare, but reductions infood expenditures can put the poorest households at risk.8 In Serbia,some people reported their struggles to afford all but the most limitedstaple foods, and in Bulgaria, 18 percent of poor households reportedskipping meals. In all countries except Armenia, food expenditure cutswere driven primarily by poverty rather than measured income shocks.In Armenia, however, households with measured shocks were signifi-cantly more likely to reduce food expenditures than households withouta measured income shock.
Thus Far, Households Protected School Enrollments of Their ChildrenCRSs in Armenia, Bulgaria, Montenegro, and Romania reveal that house-holds protected education investments by continuing schooling (ratherthan withdrawing children from school) (see table 3.1). Householdsthat did cut back on education spending increased their vulnerabi-lity to further shocks and potentially reduced long-term human capitalaccumulation—a particular concern for the already vulnerable becauseit could reduce lifetime earnings. The crisis did not lead to many house-holds placing education attainment at direct risk.9 Children in crisis-affected households were not withdrawn from schools, nor were childrenmoved from private schools to public schools in higher proportionswhen compared with households that were not affected by the crisis.This is consistent with household responses in other middle-incomecountries (see box 3.2). The cost of sending children to school tends tobe low and the opportunity cost of sending them to school is likely to below because child labor is less common in most Eastern European andCentral Asian countries.
Household Coping Mechanisms 43

44 The Jobs Crisis
Table 3.1 Health and Some Education Coping Strategies Were Adopted by Households across Four Eastern European and Central Asian Countries
Armenia Bulgaria Montenegro Romania
EducationWithdrew children from
schoolNo No No N/A
Postponed or canceled training
No Yes Yes N/A
Cut education expenditure
N/A Yes No N/A
Dropped extracurricular activities
N/A N/A N/A Yes
Moved from expensive to cheaper schools
N/A N/A No N/A
HealthReduced or canceled
doctors visitsYes No No No
Reduced or canceled medical care
N/A Yes Yes N/A
Reduced medicine purchases
Yes N/A No No
Canceled medical insurance
N/A Yes N/A N/A
Source: Dasgupta (2010) using various Crisis Response Surveys.
Box 3.2
The Impacts of Past Crises on Education Outcomes Were Mixed
Experience from past crises demonstrates that the impact of a shock on educa-
tion varies in scope depending on a number of factors. At the household level, if
the substitution effect dominates, the labor market deterioration reduces the
opportunity cost of education and more people use education services. If the
income effect dominates, families feel poorer, raising the marginal value of each
extra dollar of family income, which typically results in postponing school or
reducing education consumption. Government policies also have an important
impact on education outcomes, both during crises and even once the recovery
begins as government undertakes fiscal consolidation measures.
(continued next page)

Household Coping Mechanisms 45
Box 3.2 (continued)
Effects of Previous Crises on Education Indicators Were Mixed
Channel Country examples
Behavior andDemand
Argentina: Reduced school supply purchases.
Indonesia: Enrollment decline averaged 3 to 4 percent; up to 11 percent in secondary schools, especially private schools. In1998, male student dropout rates increased by 5.7 percent andthe proportion of 7 to 12 year olds not enrolled in schools doubledfrom 6 to 12 percent.
Malaysia: Primary and secondary enrollment increased at 3.4 per-cent and 3.7 percent, respectively. Upper secondary increased by13.7 percent. Tertiary enrollment increased because overseas stu-dents returned when the government sponsorship program wastemporarily suspended.
Mexico: Growth in gross primary enrollment fell from 0.44 percent in 1994 to 0.09 percent in 1995.
Turkey: Households reduced education spending; children with-drawn from school. Some 35 percent of urban and 44 percent ofrural households reported spending less on health and education.
Government Spending and Supply
Argentina: Decreased financing for school lunches and infrastruc-ture. Discontinuity of classes because of labor conflicts with teach-ers triggered by delayed salary payments.
Indonesia: Increased real basic education budget by 55 percentbetween 1996–97 and 1998–99, mainly for “Stay-at-School” schol-arships and school block grants.
Malaysia: Suspended higher education government sponsorshipfor studying abroad.
Philippines: Deferred 1998 programs for school building andtextbooks because of cutbacks.
Thailand: Cut budget for education by 15 percent in 1998.
Outcomes Indonesia: Shift from private to public schools in poor and urbanareas.
Malaysia: Increased tertiary enrollment when students returnedfrom abroad.
Russian Federation: Worsening inequity in education status andoutcomes across regions since 1998 crisis.
Sources: Chang et al. 2009; Lustig and Walton 1998; Pastor and Wise 2004; Ramesh 2009.

Households that were affected directly by the crisis adopted responsesthat put education outcomes at indirect risk. In Bulgaria, householdssignificantly reduced education-related expenditures, such as trans-portation, basic supplies, and tutoring. In Bulgaria and Montenegro,households canceled or postponed training, for example, in languagesand information technology. These choices could affect lifetime earn-ings, but they are not as severe as withdrawing children from school,and it is difficult to assess the effects on long-term welfare becauselittle is known about economic returns to training in the region.However, reduced spending on education-related items such as trans-portation and basic supplies can lead to lower educational outcomes(learning) and possibly increased dropouts, particularly among poorhouseholds.
Households Reduced Health Investments and Increased Risk ExposureCRSs in Armenia, Bulgaria, Montenegro, and Romania show that house-holds consistently reported reducing health expenditures and utilizationacross a range of indicators (see table 3.1). This finding is consistent withfindings from other countries (see box 3.3). Typically, crisis-affectedhouseholds and poor households were significantly more likely to reducehealth care during the crisis. Crisis-affected households in Armenia,Bulgaria, and Montenegro reduced doctor visits or reduced medical caremuch more frequently than crisis-unaffected households.10 However,the long-term impact on people who adopt such responses will varywidely; the impacts of reducing preventative health care may show upin the longer term, and foregoing medical appointments could haveimmediate and devastating effects for some but relatively little impactfor most people.
Poor and Minority Households Coped by Adopting Riskier Coping Strategies than Rich Households
In Bulgaria and Montenegro, poor households are more likely than richhouseholds to adopt riskier coping strategies, increasing their vulnera-bility to future shocks (see figure 3.6). Controlling for a range of house-hold characteristics, poor households were more likely than nonpoorhouseholds to (i) reduce health care consumption; and (ii) reduce foodexpenditures by cutting quality or quantity (Azam 2010). Among
46 The Jobs Crisis

Box 3.3
Most Impacts of Past Crises on Health Outcomes Were Negative
The literature on the impact of crises on health outcomes differ according to coun-
try wealth. In several low-income countries, crises have led to infant mortality and
malnutrition increases. In many cases, girls suffer disproportionately. Evidence
from high-income countries suggests that economic downturns are surprisingly
“good for health.” The examples below present selected evidence from middle-
income countries, where most findings indicate overall negative impacts of eco-
nomic crises on health. Evidence is stronger, however, for immediate indicators
such as government health spending and utilization of services than for key
health outcomes. The positive policy responses in Argentina and Thailand are
noteworthy examples.
For Eastern Europe and Central Asia, past experiences reveal two important
themes. First, studies suggest that nutrition was not significantly affected by eco-
nomic turmoil during the transition in the early 1990s, suggesting that most
households protected themselves during hard times. Evidence from past crises
in 22 countries associates poor macroeconomic performance with rising male
suicide rates, especially in the Baltics, Belarus, and Russia.
Effects of Previous Crises on Health Indicators Were Mostly Negative
Household Coping Mechanisms 47
Channel Country examples
Behavior Turkey: Cutbacks in fruit and vegetable consumption.
Eastern Europe in the 1990s: Diet and nutrition remained fairlystable during economic turmoil of transition.
Demand Turkey: Demand fell for health services.
Argentina: Health insurance coverage declined; utilization of carefell, including children’s preventive visits to health centers.
Indonesia: Utilization declined for primary care, including chil-dren’s visits, but not for hospitals; household spending on healthdeclined faster than overall spending.
Thailand: Utilization increased for public health services becauseof expansion of targeted programs; household spending onhealth declined faster than overall spending.
Malaysia: Utilization shifted from private to public facilities.
(continued next page)

48 The Jobs Crisis
Box 3.3 (continued)
Sources: Chang et al. 2009; Ferreira and Schady 2009; Lustig and Walton 1998; Pastor and Wise 2004;Ramesh 2009; Ruhm 2000.
Channel Country examples
Mexico: Decline in out-of-pocket spending and utilization.
Thailand, Indonesia, and Argentina: Drug prices increasedbecause of sharp exchange rate depreciation.
Government Spending and Supply
Russian Federation: Decline in government spending.
Thailand: Decline in government spending but expansion ofprograms targeted to the poor.
Argentina: Increase in public health spending, particularly formaternal and child health.
Indonesia: Decline in government spending; increased donorspending.
Mexico: Decline in government spending.
Latin America in the 1980s: Decline in government health budgets.
Outcomes Russian Federation: Life expectancy declined; suicides increased.
Mexico: Mortality among children and elderly was about 5–7 percent worse than precrisis trends.
Indonesia: Infant mortality rose; reports on nutrition impactsvaried among studies.
Republic of Korea: Suicides increased.
crisis-affected households in Montenegro, 25 percent of households inthe bottom quintile reduced preventative care visits to doctors; only13 percent of households in the top quintile adopted this strategy.Similarly, poor households were considerably more likely to respondto the crisis by canceling health insurance. In Bulgaria, 36 percent ofcrisis-affected households in quintile 1 (poorest 20 percent) stoppedbuying regular medications, while 7 percent of households in the rich-est quintile resorted to this coping strategy. Similarly, 22 percent ofpoor crisis-affected households and 5 percent of rich crisis-affectedhouseholds did not visit the doctor after falling ill.
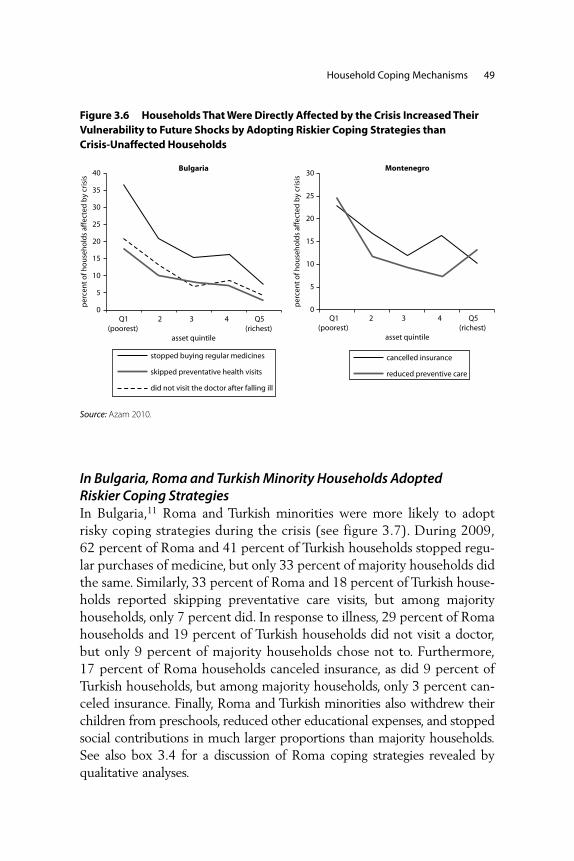
Household Coping Mechanisms 49
Figure 3.6 Households That Were Directly Affected by the Crisis Increased TheirVulnerability to Future Shocks by Adopting Riskier Coping Strategies than Crisis-Unaffected Households
Source: Azam 2010.
Q1(poorest)
2 3 4 Q5(richest)
0
5
10
15
20
25
30
per
cen
t o
f ho
use
ho
lds
affe
cted
by
cris
is
Montenegro
asset quintile
cancelled insurance
reduced preventive care
Q1(poorest)
2 3 4 Q5(richest)
0
5
10
15
20
25
30
35
40
per
cen
t o
f ho
use
ho
lds
affe
cted
by
cris
is
Bulgaria
asset quintile
stopped buying regular medicines
skipped preventative health visits
did not visit the doctor after falling ill
In Bulgaria, Roma and Turkish Minority Households Adopted Riskier Coping StrategiesIn Bulgaria,11 Roma and Turkish minorities were more likely to adoptrisky coping strategies during the crisis (see figure 3.7). During 2009,62 percent of Roma and 41 percent of Turkish households stopped regu-lar purchases of medicine, but only 33 percent of majority households didthe same. Similarly, 33 percent of Roma and 18 percent of Turkish house-holds reported skipping preventative care visits, but among majorityhouseholds, only 7 percent did. In response to illness, 29 percent of Romahouseholds and 19 percent of Turkish households did not visit a doctor,but only 9 percent of majority households chose not to. Furthermore,17 percent of Roma households canceled insurance, as did 9 percent ofTurkish households, but among majority households, only 3 percent can-celed insurance. Finally, Roma and Turkish minorities also withdrew theirchildren from preschools, reduced other educational expenses, and stoppedsocial contributions in much larger proportions than majority households.See also box 3.4 for a discussion of Roma coping strategies revealed byqualitative analyses.

50 The Jobs Crisis
Figure 3.7 In Bulgaria, Roma and Turkish Minority Households Adopted RiskierCoping Strategies than the Majority
stopped buyingregular medicine
skipped preventativehealth visits
did not visit doctorafter falling ill
cancelled healthinsurance
withdrew frompreschool
reduced othereducational expenses
stopped socialcontributions
0
5
10
15
20
25
0
10
20
30
40
50
60
70
per
cen
tp
erce
nt
majority Turkish Roma all
Source: Azam 2010.

Notes
1. A household is defined as crisis-affected if it reported a decline in total incomebecause of (or during) the crisis. By this definition, around 33 percent of house-holds in Armenia, 28 percent of households in Bulgaria, 71 percent ofhouseholds in Latvia, 22 percent of households in Montenegro, and 18 per-cent of households in Romania were affected by the crisis.
2. During a crisis, households may consider behavioral adjustments determinedby observable and unobservable factors. That is, although some householdsreact to income reductions, others may prepare themselves for an incomereduction in the future based on their perceptions about being affected by ashock in the future.
3. This implies that, for crisis-affected households, the income effect dominatedthe substitution effect. The income effect suggests that a drop in wages would
Household Coping Mechanisms 51
Box 3.4
Serbia Roma Crisis Assessment
To assess the impact of the crisis on Roma in Serbia, focus group discussions
were undertaken. All Roma groups in Serbia revealed that the crisis had led to a
deteriorated economic condition at the household level. The Roma also revealed
that the impact of the crisis was transmitted through the labor market through
fewer job opportunities, lower wages, and increased discrimination against the
Roma. The Roma also identified increased food prices, increased debts (utility
bills, loans), increased health care costs, and increased uncertainty as key corre-
lates of the crisis. As a consequence of economic hardships, the Roma pointed to
deteriorating intrahousehold relationships, especially manifesting through dis-
putes between spouses.
Most Roma households reported that they coped with the income shocks by
decreasing household expenditures. These measures included delaying pay-
ments on utility bills, reducing the quality of food consumed, and in extreme
cases scavenging for food in rubbish containers. Parents also reported cutting
back on textbooks and other school supplies for children.
Some Roma households also coped with income shocks by attempting to
increase household incomes. These measures included accepting jobs that they
did not accept previously (lower pay or harder work conditions) and increasing
begging (also by children).
Source: Matkovic, Mijatovic, and Petrovic 2010.

52 The Jobs Crisis
result in increased labor supply; the substitution effect implies that lowerwages reduce leisure costs, thereby reducing the labor supply.
4. During the 1997 Asian economic crisis, labor force participation (includingunpaid work) increased among women in Indonesia. However, upper-income classes benefited the most in the urban areas and poorer people inthe rural areas (Fallon and Lucas 2002). Following the 2001 crisis inArgentina, 13 percent of households tried to add a new member of thehousehold to the labor market, especially among low-income households. In50 percent of the cases, it involved the son or daughter, and in 25 percent, thespouse of the head of the household. However, most of those previously inac-tive often ended up unemployed, and those who did find work were not nec-essarily from the poorest groups (World Bank 2003). In contrast, during thePeso Crisis, Mexican households did not seem to pursue the strategy of work-ing longer hours or inserting new household members into the labor force. Infact, growth in labor force participation decreased (McKenzie 2003).
5. In the aftermath of the 1994–95 Peso Crisis, remittances from friends andfamily in the United States mitigated the impact of the downturn on Mexicanhouseholds (McKenzie 2003, 1197).
6. The importance of informal transfers is determined by social networks, whichvary in intensity across countries and communities in the region. See Lokshinand Ravallion (2000) for an analysis of the 1998 crisis in Russia.
7. In contrast, during the Asian financial crisis in 1997–98, informal assistancefrom family and friends played an important role in Indonesia, where around25 percent of households received informal assistance, the median value ofwhich was considerably higher than for that from the formal public sector(Frankenberg, Thomas, and Beegle 1999, v). During the 2001 crisis inArgentina, around 8 percent of households relied on informal credit at neigh-borhood stores to delay payment for purchases; nearly 15 percent of the poor-est households resorted to this coping strategy, but less than 1 percent of thosein the upper quintile did (World Bank 2003, 23).
8. After the 1998 crisis in Russia, total expenditures on food dropped sharply,especially in fruit and vegetable consumption that led to deterioration in thenutritional status for children from poor households (Stillman and Thomas2004). Gottret (2009) summarizes nutritional outcomes in countries affectedby crises as follows: the incidence of anemia among pregnant womenincreased by 22 percent during the East Asia crisis in Thailand; micronutrientdeficiencies (especially vitamin A) in children and women (of reproductiveage) increased, and the incidence of dangerously low Body Mass Indexes rose25 percent in Indonesia.
9. Past work suggests that the question of whether economic crises and disasterslead to decreased schooling for children remains to be settled (Skoufias 2003).Jacoby and Skoufias (1997) find that child school attendance decreases as a

consequence of the shocks experienced by poor households in rural India.Duryea (1998) for Brazil and Skoufias and Parker (2002) for urban Mexico,both find similar negative effects on school attainment. In contrast, McKenzie(2003) finds that school attendance rates actually rose among 15–18 year oldsduring the Mexican crisis. One possible explanation for such a finding is thataggregate shocks give rise to opposing income and substitution effects. On theone hand, decreases in income (negative income effect) lead households towithdraw children from school. On the other hand, wage decreases or poorlabor market conditions during the crisis lower the opportunity cost of school-ing, inducing households to keep their children in school. Within this frame-work, the final outcome on schooling depends on whether the negative effectof income or the positive effect of declining opportunity costs is bigger.
10. After the 1997 crisis hit in Malaysia, private hospitals and clinics reported adrop of 15–50 percent in the number of patients seeking treatment (Ramesh2009). Following the crisis in Argentina, 12 percent of hospitals reported thatthey had lost or changed their health coverage; and 57 percent of hospitalsreported a decrease in the frequency of preventive controls for children(Fiszbein et al. 2002).
11. As discussed earlier, the Bulgaria CRS is the only one that also contained aRoma booster sample and hence contained sufficient observations for Roma-specific analysis.
Household Coping Mechanisms 53


55
During the 2009 crisis, sharp GDP contractions prompted EasternEuropean and Central Asian countries to implement or scale up policiesand programs to protect human welfare and long-term human capital.Measures to protect the affected households have included scaling uppassive and active labor market programs, strengthening social assistance,protecting and sometimes increasing minimum pensions, and ensuringaccess to health and education services.
UI benefits played an important role in protecting households affectedby the crisis. These benefits, however, reached only a minority of thosewho needed help during the crisis in many countries. Last-resort socialassistance (LRSA), too, was leveraged, but coverage remained weak rela-tive to the size of the crisis and, in some countries, coverage rates did notincrease significantly as expected. A few countries maintained minimumpensions, despite fiscal pressure to consolidate their budgets, and a fewcountries increased minimum pensions as a crisis response. Many govern-ments were compelled to undertake austerity measures to control debtlevels, but in a number of instances, governments protected poor familieswith education and health sector fiscal consolidation efforts.
Given the breadth and depth of the crisis, the early findings are thatthe government social response was prudent. Instruments to protect the
C H A P T E R 4
Social Policy Responses to ProtectHouseholds

56 The Jobs Crisis
Table 4.1 Mechanisms for Governments to Mitigate the Impact of the Crisis on Households
Examples
1. Labor Market Measures
Support currently employed √ Wage subsidies, social security tax reduction forcurrently employed (Poland)
√ Short work schedule (Poland)Facilitate job creation √ Start-up support, business tax reduction
(Bulgaria, Estonia, Poland, Russia, Turkey)√ Wage subsidies (for new entrants)/social security
tax reductions (Estonia, Russia, Turkey)√ Apprenticeships, internships (Bulgaria, Estonia,
Kazakhstan, Turkey)Provide income support √ Unemployment insurance
√ Public works; public investment program (e.g.,Kazakhstan, Latvia, Russia, Turkey)
√ Training for pay (conditional cash transfer)√ Activation
Enhance employability √ Retraining, preventative training (Bulgaria, Russia)
√ Training/retraining (with or without stipends)Improve job matching √ Job search assistance (all countries)
√ Job fairs, job brokerage√ Mobility allowances (Russia)
welfare of the poor were deployed during the crisis, but those instrumentssometimes fell short because of low coverage rates, delays in deployment,fiscal constraints, and data availability.
Four Tools Have Been Deployed to Protect People from the Effects of the Crisis
To protect households from the effects of the crisis, four main tools wereadopted, albeit to varying extents, by governments in the Eastern Europeand Central Asia region (see table 4.1).
• First, labor market measures were deployed to address the deteriorat-ing labor market conditions. Programs included those to support thecurrently employed, facilitate job creation, provide income support,enhance employability, and improve job matching.
• Second, social assistance programs were used to protect poor house-holds from falling below minimum welfare levels.
(continued next page)

• Third, pension policies were adopted to respond to the crisis in a fewcountries.
• Fourth, countries enacted measures to maintain human capital toensure access to education, promote health care utilization, anduphold sustainability of Health Insurance Funds (HIFs) while protect-ing the poor.
Labor Market Measures Have Been Deployed and Early Results Are Encouraging
In response to deteriorating labor market conditions, Eastern Europeanand Central Asian countries have boosted labor market programs tofocus on employed workers and unemployed workers. Countries imple-mented or scaled up a host of discretionary labor market policy meas-ures, including programs to support the currently employed, facilitate jobcreation, provide income support, enhance employability, and improvejob matching (see figure 4.1).
Social Policy Responses to Protect Households 57
Table 4.1 (continued)
2. Social AssistanceLaunch or adjust parameters to LRSA
programs
3. Social InsuranceParameter adjustment to minimum
pensionsParameter adjustment to
disability, sickness, maternal, survivor, and so on
4. Measures to Maintain Human CapitalEnsure access to education √ Protect vulnerable students
√ Redirect funding to programs that target poor people
√ Exempt poor students from out-of-pocket expenditures
Maintain health care utilization rates √ Increase health care coverage√ Redirect resources to services valuable to
poor people√ Exempt out-of-pocket expenses
Protect Health Insurance Funds √ Protect core health spending for primary careand prescription drugs
Source: World Bank staff.Note: LRSA = Last-Resort Social Assistance.

Unemployment Insurance Was Often the First Benefit to Reach Crisis-Affected HouseholdsIn Eastern European and Central Asian countries, UI benefits are anattractive and rapid response to job loss designed to provide relief to theunemployed who qualify for the benefit. In Armenia, Bulgaria, Croatia,Latvia, Montenegro, Romania, Serbia, Turkey, and Ukraine, contributoryand noncontributory unemployment insurance benefits were the firstgovernment social response to help households affected by incomeshocks (World Bank Forthcoming). Figure 4.2 plots figures and timelinesfor the registered unemployed and unemployment insurance beneficiar-ies for nine countries. Overall, the number of UI beneficiaries follows thetrajectory of the number of registered unemployed for all nine countries,confirming that UI benefits responded to layoffs in the economy.
However, coverage of unemployment insurance is low. Many unem-ployed people are ineligible for unemployment benefits. Figure 4.3 shows
58 The Jobs Crisis
Figure 4.1 A Typology of Labor Market Policy Measures Enacted to Mitigate theImpact of the Crisis
• Wage subsidies, social security tax reduction for currently employed• Short work schedule
Support currently employed
• Start-up support; business tax reduction (Bulgaria, Estonia, Poland, Russia, Turkey)• Wage subsidies (for new entrants)/social security tax reductions (Estonia, Russia, Turkey)• Apprenticeships, internships (Bulgaria, Estonia, Kazakhstan, Turkey)
Facilitate job creation
• Job search assistance (Latvia, Slovenia) • Job fairs, job brokerage• Mobility allowances (Russia)
Improve job matching
• Retraining, preventative training (Bulgaria, Russia)• Training/retraining (with or without stipends)Enhance employability
Provide income support
• Public works; public investment program (e.g., Kazakhstan, Latvia, Russia, Turkey) • Training for pay (conditional cash transfer)
• Activation
Source: World Bank staff.

Social Policy Responses to Protect Households 59
Source: World Bank staff calculations using Kuddo 2010a. Note: For Estonia, data on unemployment insurance beneficiaries also includes recipients of unemployment allowance.
Figure 4.2 Unemployment Insurance Was the First Government Social Response to Households Affected by the Crisis
0
50
100
150
200
250
300
0
10
20
30
40
50
60
70
0
10
20
30
40
50
60
70
80
90
–20
0
20
40
60
80
100
120
0
20
40
60
80
100
120
140
160
180
–20–10
01020304050607080
0
50
100
150
200
250
–50–40–30–20–10
01020304050
100
150
200
250
300
350
Armenia Bulgaria
Year-over-year growth in total registered unemployment and unemployment beneficiaries, 2008–09
Latvia Romania
Turkey UkraineRussia
Poland
Estonia
Jan
FebM
arApr
May
Jun Ju
lAug
SepOct
NovDec
Jan
FebM
arApr
May
Jun Ju
lAug
SepOct
NovDec
Jan
FebM
arApr
May
Jun Ju
lAug
SepOct
NovDec
Jan
FebM
arApr
May
Jun Ju
lAug
SepOct
NovDec
Jan
FebM
arApr
May
Jun Ju
lAug
SepOct
NovDec
Jan
FebM
arApr
May
Jun Ju
lAug
SepOct
NovDec
Jan
FebM
arApr
May
Jun Ju
lAug
SepOct
NovDec
Jan
FebM
arApr
May
Jun Ju
lAug
SepOct
NovDec
Jan
FebM
arApr
May
Jun Ju
lAug
SepOct
NovDec
registered unemployedUI beneficiaries
the large range in UI benefits coverage among the registered unemployed,ranging from less than 3 percent in the poor Central Asian economies ofTajikistan and Kyrgyzstan, to more than 75 percent in Russia and Ukraine.Clearly, UI benefits are viable as a safety net for deteriorating labor mar-ket conditions if coverage is large relative to registered unemployment.1
In Croatia, for example, only 30 percent of the registered unemployedpopulation receives UI benefits and among the recently unemployed,only 40 percent receive benefits (World Bank 2010b). The UI benefit

coverage gap reveals that most of the newly unemployed are new labormarket entrants or informal sector workers.
Several factors determine UI coverage rates, primarily, that the workeris in the formal sector. This factor alone excludes a significant fraction ofthe region’s labor force. Across 18 Eastern European and Central Asiancountries, between 5 and 65 percent of the labor force works in the infor-mal sector, according to some estimates (see figure 4.4) (Kuddo 2009b).2
Conversely, 35 to 95 percent of workers are in the formal sector, but onlya fraction is protected by UI because many workers do not meet tenureand eligibility requirements.
Some Governments Focused on the Fiscal Implications of Unemployment Insurance and Tightened Eligibility and Conditions, and Others Focused on Revenue GenerationFiscal constraints motivated some countries to tighten eligibility criteria forUI. The UI benefit payouts increased significantly, but in some countries,benefit payments were outstripped by increases in the number of registeredunemployed. For example, in Poland, Romania, and Turkey, UI benefit cov-erage rates were trending down before registered unemployment rates beganto decline. This could be because beneficiaries were removed from the UIrolls as their eligibility expired, or because eligibility criteria had tightened.
60 The Jobs Crisis
Figure 4.3 Unemployment Benefits Cover Only a Fraction of Total Registered Unemployed in Many Eastern European and Central Asian Countries
0
10
20
30
40
50
60
70
80
90
registered unemployed who received unemploymentinsurance benefits, December 2009
100
per
cen
t
Tajikist
an
Kyrgyzs
tan
Mold
ova
Albania
Azerb
aijan
Mace
donia, FYR
Serbia
Slovak Republic
Turkey
Poland
Lithuania
Croatia
Belarus
Armenia
Slovenia
Romania
Russian Federa
tion
Estonia
Ukrain
e
Bulgaria
Latvia
Czech
Republic
Hungary
Monte
negro
Source: World Bank staff calculations using Kuddo 2010a.

Comparing registered unemployment and UI beneficiaries can be mis-leading. In Ukraine, for example, UI benefits tracked registered unem-ployment fairly well in 2008 (see figure 4.5), but the subsequentdeclining trend in registered unemployment and UI beneficiaries is coun-terintuitive given the relatively high unemployed population. In fact, inJanuary 2009, the government limited UI benefit payouts to people whohad no land, meaning that people who had some land were removed fromthe registered unemployment lists. This measure effectively excluded anumber of the rural unemployed from UI benefit payments, even when theyonly owned small plots. In March 2009, the government began to requireweekly visits to the employment office, up from monthly visits, torenew employment status. The more frequent visits increase the cost ofregistering and hence the intake of registrations is reduced (see chapter5 recommendations).
Some governments focused more on increasing revenue generation forsocial insurance funds by raising contribution rates or lowering expendi-tures by tightening eligibility criteria and reducing the period duringwhich benefits were paid. For example, Estonia raised UI contributionrates from 0.9 percent to 4.2 percent, including the employee share.Hungary tightened eligibility for welfare provisions among long-termunemployed people. The Czech Republic shortened the duration of
Social Policy Responses to Protect Households 61
Figure 4.4 Informal Sector Employment Is Sizable in Some Countries and TheseWorkers Generally Are Not Covered by Unemployment Insurance
Source: Kuddo 2009b.
0
10
20
30
40
50
60
70
per
cen
t
Mold
ova
Albania
Azerb
aijan
Mace
donia, FYR
Serbia
Slovak Republic
Kyrgyz R
epublic
Turkey
Poland
Lithuania
Croatia
Bosnia and H
erzegovin
a
Armenia
Romania
Ukrain
e
Latvia
Czech
Republic
Hungary
labor force employed in the informal sector

UI benefit payments by one month to enable higher benefits during thefirst two months of UI benefits.
Active Labor Market Programs Have Been Scaled Up but Their Impact Is UnclearIn 2009, Eastern European and Central Asian countries responded todeteriorating labor market conditions by increasing spending on activelabor market programs (ALMPs) (see figure 4.6).3 Even at elevatedspending levels, during the crisis, ALMP spending often was much lowerthan the 0.47 percent of GDP allocated in EU-27 countries and the 1.32percent of GDP allocated by member countries of the Organisation forEconomic Co-operation and Development (OECD) before the crisis in2007 (OECD 2009a). Low expenditures on ALMPs before the onset ofthe crisis suggest that ALMP coverage was small as was the impact onaggregate employability and labor force competitiveness. In 2009,Bulgaria, Estonia, Latvia, and Slovenia considerably increased theirALMP shares in GDP, albeit from a small base and to a large extent dueto European Social Fund (ESF) transfers.4
Although several Eastern European and Central Asian countries imple-mented a series of ALMPs to respond to weak labor market conditions,impacts on household welfare and service delivery efficiency depend on
62 The Jobs Crisis
Figure 4.5 In Ukraine, Higher Proportions of the Unemployed Have Lost Coverageof Unemployment Insurance Benefits since the Onset of the Crisis
Sources: World Bank staff calculations using Kuddo (2010a) data on the number of people who are registered unemployed and unemployment insurance beneficiaries. ILO LABORSTA Database for number of unemployed.
0
500
1,000
1,500
2,000
2,500
(thousands)
Jan
FebM
arApr
May
Jun Ju
lAug
SepOct
NovDec
Jan
FebM
arApr
May
Jun Ju
lAug
SepOct
NovDec
2008 2009
total unemployment registered unemployed UI beneficiaries

budget allocations, enforcement levels, and political commitment. SomeALMPs implemented during the crisis include the following:
• To support the currently employed, Ukraine provided subsidies tomining firms.
• To facilitate job creation, Bulgaria paid temporary wage subsidies toemployers for hiring newly laid-off workers.5 Similarly, Turkey pro-vided social security tax reductions to firms that hired unemployedwomen.
• To provide income support to the unemployed, Latvia implementeda new public works program where participants, registered unem-ployed people not receiving UI benefits, were paid less than the bind-ing minimum wage for low-skilled labor-intensive work for up to sixmonths.6
• To enhance employability, Turkey accelerated expansion of ISKUR’s(the Turkish Employment Agency) vocational training and trainee
Social Policy Responses to Protect Households 63
Figure 4.6 Active Labor Market Program Budgets Were Fortified in Many Countries to Reduce Long-Term Unemployment
Source: World Bank staff calculations using ALMP spending from Kuddo (2010a) and GDP data from the IMFWorld Economic Outlook Database, October 2010. Note: Data as of October 2010. Croatia and Bosnia and Herzegovina data not available for 2010.
0
Monte
negro
Bulgaria
Slovenia
Latvia
Lithuania
Estonia
Croatia
Bosnia and
Herzegovin
aArm
enia
0.1
0.2
0.3
0.4
0.5
0.6
per
cen
t
2008 2009 2010 (planned)
budgets for ALMPs as a percentage of GDP in selectedEastern European and Central Asian countries

stipends that reached 167,000 people in 2009, up from 30,000 in2008, and introduced youth internships. A number of countries, espe-cially EU countries with access to ESF resources, also scaled up train-ing programs and provided stipends to participants.
• To improve job matching, countries also provided more intensive jobsearch assistance (Latvia and Slovenia) and mobility allowances (Russia).
Across Eastern Europe and Central Asia, and in many OECD coun-tries, governments introduced or scaled up wage subsidy programs toencourage businesses to retain or hire workers under schemes thatincluded short-time work,7 hiring subsidies,8 and reduced social securitycontributions (Kuddo 2010b). These programs offer considerable short-term value to support labor demand, but often have been plagued by highdeadweight costs if they postpone necessary industrial restructuring andwithdrawing them can be politically unpopular. Wage subsidies also canresult in job substitution rather than job creation. To minimize costs, theseschemes need to be temporary and targeted to workers experiencing atemporary demand decline and to those at high risk of long-term unem-ployment. Otherwise, these schemes risk being less effective in preserv-ing jobs and even can become an obstacle to recovery—slowing workerreallocation from declining to expanding firms.
Social Assistance Measures Have Been Leveraged and the Response Is Mixed
On average, countries in the region spend about 1.6 percent of GDP ona range of social assistance programs that have multiple objectives (seefigure 4.7). Among these programs, most Eastern European and CentralAsian countries have at least one LRSA program, often well targeted topoor people by global standards. These LRSAs represent a small share ofoverall social assistance (noncontributory system) spending and cover asmall share of the population and a small share of the poor.9
Predicting the point at which households turn to LRSA is difficultusing existing data, but it is likely that a time lag occurs between negativeGDP growth and lower household welfare, and a further lag occursbetween lower household welfare and household demand for LRSA. Thisreport uses registered unemployment rates as a proxy, although otherindicators might be more accurate, such as when UI benefits terminate,but those data were unavailable for this report.Assuming that the demandfor LRSA programs increases with unemployment, and not necessarily
64 The Jobs Crisis

with GDP contractions, it is reasonable to compare patterns of peoplewho are registered as unemployed and those who receive LRSA benefits.Only a minority of unemployed workers receive UI benefits and, there-fore, a larger group of the unemployed have to endure joblessness with nosafety net. Therefore, an increase in registered unemployment is likely tobe proportional to an increase in social assistance demand.
Social Policy Responses to Protect Households 65
Source: World Bank staff. Note: To facilitate comparison across countries, LRSA performance indicators (coverage, targeting accuracy, ade-quacy, and so on) are calculated using a standardized methodology that ranks individuals into quintiles based onharmonized consumption aggregates (World Bank 2005) and pretransfer consumption per capita. An asterisk (*)before a program indicates that the standardized methodology was not applied.
Figure 4.7 Last-Resort Social Assistance Programs Account for a Small Share of Social Assistance Spending and Cover a Small Share of the Poor in Many Eastern European and Central Asian Countries
0
1
2
3
4
0
5
10
15
20
25
30
35
40
45
per
cen
tas
a s
har
e o
f GD
P
Croatia
08
Croatia
socia
l allo
wance
Hungary re
gular SA
Estonia M
T benefit
s
Bosnia and H
erzegovin
a 08
Romania 08
Romania G
MI
Belarus 0
8
Georgia 08
Georgia TSA
Lithuania 08
Kosovo 08
Mold
ova 08
Bulgaria
08
Bulgaria
GM
I
Monte
negro 08
Monte
negro FM
S/MOP
Serbia M
OP
Ukrain
e XP p
rogra
m
Latvia G
MI a
nd dwellin
g
Lithuania so
cial b
enefit
Bosnia and H
erzegovin
a CSW
*Uzb
ekistan SA fo
r low in
com
e
Kazakhsta
n TSA
Armenia 08
Mace
donia, FYR 08
Mace
donia, FYR SFA
Serbia C
A
Kyrgyz R
epublic 08
Latvia 08
Azerb
aijan 08
*Aze
rbaija
n TSA
Tajikist
an 08
Turkey 07
Poland 07
Poland SW b
enefits
Ukrain
e 08
Albania 08
Albania N
E
Serbia 08
Russian Federa
tion 06
Estonia 06
Armenia FB p
rogra
m
Kosovo SA
*Russ
ian Federatio
n CA
*Turk
ey CCT
Kyrgyzs
tan U
MB
social assistance programs
LRSA coverage of the poorest quintile
last-resort social assistance family and child allowances disability benefits
war veteran benefits other

In Bulgaria, Montenegro, and Serbia, initial evidence suggests that eachcountry’s flagship LRSA responded to the crisis. That is, levels of regis-tered unemployment and the numbers of LRSA beneficiaries corre-sponded to some degree (see figure 4.8). In all three countries, thenumber of LRSA beneficiaries had been declining over the years, and the
66 The Jobs Crisis
Source: World Bank staff calculations based on World Bank (Forthcoming).
Figure 4.8 Performance Varied among Last-Resort Social Assistance Programs as a Crisis Response
868482807876747270
32
31
30
29
28
27
26
820
800
780
760
740
720
700
13.2 800 400
350
300
250
200
150
100
50
700
600
500
400
300
200
13.0
12.8
12.6
12.4
12.2
12.0
70 1,100
1,000
900
800
700
600
500
400
300
200
180
160
140
120
100
80
60
656055504540353025
65605550454035302520
135
130
125
120
115
110
105
100
360340320300280260240220200
2008
Armenia Bulgaria
RomaniaMontenegro
Serbia Ukraine
2009 2008 2009
Jan
Mar
May Ju
lSep
NovJa
nM
arM
ay Jul
SepNov
Jan
Mar
May Ju
lSep
NovJa
nM
arM
ay Jul
SepNov
number of registered unemployed (left), thousands
number of beneficiaries of LRSAs (right), thousands
2008 2009
Jan
Mar
May Ju
lSep
NovJa
nM
arM
ay Jul
SepNov
2008 2009
Jan
Mar
May Ju
lSep
NovJa
nM
arM
ay Jul
SepNov
2008 2009
Jan
Mar
May Ju
lSep
NovJa
nM
arM
ay Jul
SepNov
2008 2009
Jan
Mar
May Ju
lSep
NovJa
nM
arM
ay Jul
SepNov

2009 crisis led to a reversal in those trends with new entrants into theprogram.
In Armenia, Romania, and Ukraine, LRSA coverage was unresponsiveto increasing registered unemployment rates. In fact, in Armenia andUkraine, LRSA incidence declined during 2008 and 2009; and in Romania,LRSAs remained essentially flat during the same 24 months. Armenia’sdeclining LRSA incidence can be explained by the government’s effort toremove the nonpoor from the list of beneficiaries and at the same timeincrease the number of poor beneficiaries. This move led to an overalldecrease in beneficiaries, but early evidence suggests that the gains to thepoor were significant (World Bank 2010a). Romania went a different routeto help the poor during the crisis. Rather than scaling up LRSAs, Romaniafocused on increasing minimum pensions (Azam and Isik-Dikmelik 2010).
Relative to the speed of UI, LRSAs either responded with a lag or insome cases did not respond at all. The reasons for these patterns requirefurther investigation, but some hypotheses are outlined below:
• In some countries, LRSAs have been decentralized to local govern-ments, where typically the constraints of balanced budget requirementsprevent countercyclical expenditures. In Latvia, cash-strapped localgovernments diverted LRSA applicants to public works programs,which are centrally financed, effectively imposing a work requirementto the social assistance program (World Bank 2010d).
• Despite the acute need to expand and scale up LRSA programs,bureaucratic and procedural requirements may slow participant flows.For example, some countries, including Bulgaria, require LRSA appli-cants to be registered as unemployed for a specified period beforethey are eligible for LRSAs. Similarly, bureaucratic requirements candelay the disbursement of social benefits because of the time needed toenroll an applicant, perform targeting exercises, and provide benefits.
• Negative social stereotypes of LRSA beneficiaries (such as substanceabusers who have little interest in holding a job) may deter potentiallyqualified LRSA applicants from enrolling because of the stigma asso-ciated with social benefits. Instead, they may deplete their own assetsor adopt risky coping strategies, such as reducing health or educationutilization. As a result, the trend across Eastern Europe and CentralAsia shows declining enrollment in LRSAs, the programs cover only asmall fraction of the population and only a small fraction of the poor(see figure 4.7).
Social Policy Responses to Protect Households 67

68 The Jobs Crisis
Some Eastern European and Central Asian Countries Altered Last-Resort Social Assistance Program Guidelines to Improve the Crisis Response Countries responded to increased safety net demands through the follow-ing measures (see table 4.2)
• Improving performance of existing programs (Armenia, FYR Macedonia,Poland, Romania)
• Relaxing eligibility criteria for participation or increasing funding(Azerbaijan, Bulgaria, Croatia, Latvia, Poland, Romania, Serbia)
• Increasing benefit amounts (Azerbaijan, Georgia, Kazakhstan,Kyrgyzstan, Latvia)
• Introducing new programs or safeguards to protect vulnerable groups(Kazakhstan, FYR Macedonia, Moldova)
Armenia and Georgia strengthened LRSA performance by improv-ing targeting accuracy to exclude nonpoor households from social assis-tance programs, thus supporting more poor people with minimal fiscalimpact. In 2008, Armenia improved the targeting performance of itsmain LRSA (the Family Benefit) by reducing leakage to the nonpoor,thereby increasing the volume of program resources to the bottomquintile from 43 to 61 percent between 2007 and 2009.10 This mighthelp explain the declining trend in social assistance beneficiaries seen infigure 4.8.
Some countries reversed declining trends in social assistance cover-age to address the immediate effects of the economic downturn.Bulgaria increased its Guaranteed Minimum Income (GMI), a targetedpoverty alleviation program, threshold by 20 percent; Latvia increasedeligibility thresholds for its GMI by more than 40 percent, albeit froma low level; Georgia doubled the monthly benefit for additional (non-head) household members (from about US$7 to US$14); and Romaniaincreased its GMI threshold by 15 percent. Latvia and Romania alsoaltered financing mechanisms to reduce the burden on local govern-ments, which were struggling to maintain balanced budgets during thecrisis while increasing GMI payouts. For example, in Latvia, local govern-ments were slow to enroll people in their LRSA because municipalitieswere cash strapped as a result of the fall in tax revenues. The central gov-ernment eased that constraint by providing 50 percent cofinancing forthe LRSA.11

69
Tab
le 4
.2M
easu
res
Take
n b
y Ea
ster
n E
uro
pea
n a
nd
Cen
tral
Asi
an C
ou
ntr
ies
to Im
pro
ve t
he
Last
-Res
ort
So
cial
Ass
ista
nce
Res
po
nse
to
th
e C
risi
s
Arm
enia
A
zerb
aija
nBu
lgar
iaC
roat
iaG
eorg
iaKa
zakh
stan
Koso
voKy
rgyz
stan
Latv
ia
Mac
edon
ia,
FYR
Mol
dova
Mon
tene
gro
Pola
ndRo
man
iaSe
rbia
Ukr
aine
Adj
ust S
ocia
l Ass
ista
nce
Spen
ding
in N
atio
nal B
udge
tIn
crea
se s
pend
ing
on L
RSA
sX
XX
XX
XX
XX
XX
Expa
nd E
xist
ing
Soci
al B
enef
its C
over
age
Revi
se e
ligib
ility
crit
eria
or
incr
ease
elig
ibili
ty th
resh
olds
XX
XX
XX
Incr
ease
ben
efits
am
ount
XX
XX
XX
XX
XX
Exte
nd d
urat
ion
of b
enef
itsX
X
Intr
oduc
e a
new
cris
is-s
peci
ficso
cial
ass
ista
nce
prog
ram
(not
incl
udin
g pu
blic
wor
ks)
XX
X
Stre
ngth
en B
enef
its A
dmin
istr
atio
n
Impr
ove
targ
etin
g ac
cura
cy o
f ex
istin
g LR
SAs
XX
XX
Cons
olid
ate
bene
ficia
ry
regi
strie
sX
XD
evel
op M
anag
emen
tIn
form
atio
n Sy
stem
s (M
IS)
XX
XX
Spee
d up
regi
stra
tion
and
targ
etin
g pr
oces
ses
X
Sour
ce:W
orld
Ban
k (F
orth
com
ing)
.

Minimum Pensions Were Used as a Crisis Response to Protect the Poor
Some countries took steps to scale up or introduce minimum pensions toprotect the poor. Armenia, Romania, Russia, and Turkey significantlyincreased minimum pensions in 2009.12 Because of high pension coveragein the region, pension increases are likely to have immediate povertyrelief.13 Romania is an interesting example in this respect. Between 2008and 2009, average monthly pensions rose 20 percent, while average pricesrose 5 percent.This increase explains most of the poverty reduction, whichfell from 5.7 to 4.4 percent between 2008 and 2009. This poverty reduc-tion is particularly significant, and counterintuitive, given the 7 percentGDP contraction and the earlier simulated 1.7-percentage-point increase inpoverty rates between 2008 and 2009 (Azam and Isik-Dikmelik 2010).
Although pensions may protect welfare during a crisis in countries withwide coverage, adjusting pension benefits has to be balanced against thecosts of providing benefits. First, because pensions are not means tested, andhence are not targeted to those who need special protection, a sizable por-tion of benefits might accrue to the nonpoor. For example, 52 percent of allhouseholds in Romania benefited from the increase in pensions, whereasonly 4.4 percent of households are poor. Second, minimum pensions arepensions that might accrue to the poorer segments of the population, butthey are not an ideal tool to reach crisis-affected households and hencebenefits are not likely to accrue to the “new poor.”Third, altering the pen-sions’ benefit amounts has long-term implications unless the governmentis able to reduce pensions in the future.14 Pension benefit amounts havepolitical significance, and thus, reducing them can be politically costly.
Government Education Spending Was Protected More than Government Health Sector Spending in 2009, and Some Governments Tried to Shield the Poor from Service Disruptions
Most Eastern European and Central Asian countries protected spendingon education and health. Of the two, education expenditures were shel-tered more than health expenditures. Cuts could come after a lag becauseeducation sector budgets are somewhat inflexible: the bulk of expendi-tures go toward teacher salaries, which are not easily adjusted, and gov-ernments are unlikely to lay off teachers and close schools during theschool year. Figure 4.9 illustrates changes in real expenditure patterns.Governments in Armenia, Moldova, Russia, and Turkey increased realeducation spending; the other three countries cut education expenditures
70 The Jobs Crisis

Social Policy Responses to Protect Households 71
Figure 4.9 Some Eastern European and Central Asian Countries Reduced RealHealth and Education Spending during the Crisis
–20
–15
–10
–5
0
5
10
15
per
cen
t ch
ang
e
real GDP and education spending growth, 2009
–20
–15
–10
–5
0
5
10
15
20
Latvia
Ukrain
e
Armenia
Russian Federa
tion
Mold
ova
Bulgaria
Turkey
Latv
ia
Ukrain
e
Armenia
Russian Federa
tion
Mold
ova
Bulgaria
Turkey
per
cen
t ch
ang
e
real GDP and health spending growth, 2009
GDP health spending total government expenditure
GDP education spending total government expenditure
Sources: World Bank staff calculations based on Ministry of Finance (Armenia, Bulgaria, Moldova, and Turkey); Central Statistical Bureau (Latvia); Federal State Statistics Service (Russian Federation); Verkhovna Rada BudgetCommittee (Ukraine); and IMF World Economic Outlook Database, October 2010.Note: Armenia and Turkey: central government expenditure only. Russia: health spending includes sport expenditure.

72 The Jobs Crisis
by less than their GDP contraction.Armenia, Moldova, Russia, and Turkeyincreased real health spending in 2009 relative to 2008. Among the coun-tries analyzed, Latvia and Bulgaria made the toughest health-spendingcuts. In Latvia, the cut was 15 percent in 2009, but even so, it was less thanthe 18 percent GDP contraction. Bulgaria, however, reduced real healthspending by 11 percent, which was considerably more than its GDP con-traction. These reductions in health spending by the government mostlikely will cause patients’ out-of-pocket payments to increase if the healthsector is not able to achieve comparable cost reductions.
A few Eastern European and Central Asian countries implementedmeasures to protect poor people by (i) providing additional resources tostudents of schools targeted for consolidation, (ii) protecting programs tar-geting the poor and vulnerable, and (iii) reducing out-of-pocket educationexpenses. Bulgaria continued to consolidate schools, a process begun dur-ing the boom years, but ensured that more vulnerable students were pro-tected through a mitigation fund that enabled municipalities consolidatingschools to provide additional services to at-risk students. The governmentalso created opportunities for second-chance education and providedtraining for early school leavers and for people with low-level skills.Armenia enacted a decree that restored education (and health) spendingfor high-priority programs targeting the poor and vulnerable. Latvia addedcriteria for higher education subsidies to include poverty and social con-siderations that would reduce out-of-pocket expenses for the poor.
From this brief look at social spending trends in response to the crisis,it is not possible to deduce what happened to service provisions as a resultof cuts. Spending reductions do not necessarily have to lead to a worsen-ing of health and education outcomes. Research on the link between gov-ernment education spending and education outcomes has highlighted thesignificance of factors other than the level of public spending, namely (i)efficiency of public spending, (ii) intrasectoral allocation of public spend-ing, (iii) private education spending, and (iv) governance (summarized inGrey, Lane, and Varoudakis 2007). Empirical work in the area of healthalso supports the importance of cost-effectiveness—and not just themagnitude—of public spending for health outcomes (see, for example,Filmer and Pritchett 1999; Gupta, Verhoeven, and Tiongson 1999). TheWorld Bank’s World Development Report 2004 suggests that organizationaland allocative efficiency, institutional capacity, and governance are criticalto the relationship between public spending on health and health out-comes. As part of cost-cutting measures, a number of countries in theregion embarked on structural reforms in the health and educationsectors aimed at increasing efficiency (see box 4.1).

Social Policy Responses to Protect Households 73
Box 4.1
Eastern European and Central Asian Countries Used theCrisis as an Impetus to Initiate or Accelerate StructuralAdjustments to Reduce High Fiscal Deficits
A few Eastern European and Central Asian countries realized that fiscal con-
straints arising from the crisis required a sustained public spending reallocation
or reduction, rather than a one-time budget cut. As a result, they enacted ambi-
tious efficiency-enhancing reforms.a Some governments implemented
improved funding mechanisms in education and health to provide incentives
for facility consolidation using improved resource allocation, and strengthened
management oversight to control costs and improve quality. Some govern-
ments also raised the retirement age for pensions and revised indexation
formulas. This box presents some of the efficiency reforms enacted by a few
countries in the region.
Education Sector Reforms
In many Eastern European and Central Asian countries, substantial scope exists
for savings in education without reducing access or quality. In most countries,
staff numbers and school infrastructure are too large for existing student enroll-
ment. Substantial savings could be achieved and used to improve education
quality, or diverted to other sectors, if larger class sizes were created within exist-
ing schools through school closings or mergers. Interventions to accelerate
school network consolidation include implementing such measures as “funds-fol-
low-student” formulas, transferring school management to municipalities and
nongovernmental organizations (NGOs) to improve incentives for efficient
resource use and stronger accountability for results. For instance, Bulgaria closed
about 15 percent of schools by implementing a per-student financing formula,
which strengthened school-based management by increasing principals’ discre-
tion over budgeting, staff salaries, and staffing levels. In Latvia and Romania, for-
mula-based per capita financing was enabled in 2010. In Poland, NGOs took over
small schools to increase efficiency; now education inspectors can no longer
block closures by local governments; and teachers can be hired under the labor
code rather than the restrictive Teachers’ Charter.
Health Sector Reforms
A few countries in the region took steps to enhance health sector efficiency by
adopting reforms for drug procurement, hospital rationalization plans, health
(continued next page)

74 The Jobs Crisis
care payments and oversight, and measures to strengthen general practice. In
Hungary, Romania, and Turkey, governments approved regulations to contain
pharmaceutical and medical expenditures. Most Eastern European and Central
Asian countries have inherited extensive hospital networks and the hospital staff
has an incentive to treat patients in costly hospital-based services instead of
cheaper outpatient and primary care services. These countries could benefit from
politically unpopular hospital rationalization strategies, and some countries have
begun to align incentives for hospitals to improve efficiency.
Hungary and Poland issued corporatization guidelines for hospitals, subject
to commercial audit standards and bankruptcy. Romania updated their hospi-
tal rationalization strategy. Bulgaria implemented measures to improve health
sector stewardship by strengthening the role of the Health Insurance Fund as
the primary payer of hospitals. Georgia established a stakeholder forum to
oversee health insurance companies’ implementation of state-funded pro-
grams. Turkey implemented a fixed global budget for all Ministry of Health
hospitals to contain hospital spending growth. Bulgaria, Hungary, Latvia, and
Tajikistan strengthened the role of general practitioners in the health care
delivery system to reduce overutilization of health specialists and tertiary
health care.
Pension System Reforms
In most Eastern European and Central Asian countries, higher unemployment
rates and falling wages during the economic downturn reduced worker contri-
butions to pension systems, but expenditures remained constant or increased.
The impact of the economic crisis compounds the fiscal impact from the demo-
graphic crisis. Throughout the region, long-term pension system sustainability is
undermined because the ratio of beneficiaries to contributors is high—that is,
the number of elderly retired people is rising in relation to the number of workers.
As a result, Hungary and Poland increased the effective retirement age and
abandoned the generous pension indexation formula. Hungary’s new pension
reform law will increase the statutory retirement age starting in 2012; introduce
penalties for early retirement; index pension parameters to GDP growth, to slow
benefit increases during slow GDP growth; and since July 2009, abolished the
13th-month pension to reduce pension benefit outlays. Poland implemented a
program to increase labor force participation among workers age 50 years and
above, and enacted the Law on Bridging Pensions to reduce the number of
(continued next page)
Box 4.1 (continued)

Social Policy Responses to Protect Households 75
people eligible for early retirement from 1.7 million to 300,000, while safeguard-
ing pension base levels for those affected by the change.
Eastern European and Central Asian Countries Implemented Measures toPromote Long-term Pension System Sustainability
Most Efficiency-enhancing Measures Must Be Implemented with
Safeguards for the Poor
Implementing structural reforms requires conscious steps to avoid damaging the
welfare of poor and vulnerable households. Lessons can be taken from Latvia,
which implemented deficit-reducing measures and protected vital government
services. Prominent among the fiscal consolidation measures enacted was
increased cost recovery through improved copay arrangements, closing hospitals
and removing hospital beds, and shutting down unviable schools. The govern-
ment, however, took steps to protect poor people who depend on government
services by eliminating copayments for health care and pharmaceuticals;
strengthening primary health care; providing transport for students from closed
schools; and eliminating plans to abolish preschool education for 5 and 6 year-
olds. The government also emphasized public information on the rationale for
structural reforms through outreach activities, including disseminating informa-
tion on propoor measures.
Source: Ajwad and Oral 2010.a. This summary of key reforms is not an exhaustive list; information on reforms is drawn from World BankDevelopment Policy Lending documents.
Legislated Planned
Change indexation/minimum and basic pension and benefit cuts
Armenia, Hungary, Kosovo, Latvia, Lithuania,FYR Macedonia, Romania,Russian Federation, Serbia, Turkey, Ukraine
Estonia, Latvia, Moldova,Ukraine
Increase retirement age Azerbaijan, Hungary Croatia, Romania, UkraineReduce incentives for early
retirementHungary, Latvia, Poland Romania, Ukraine
Source: World Bank staff.
Box 4.1 (continued)

76 The Jobs Crisis
A number of countries implemented special measures to protect poorpeople from further hardships because of ill health: increasing health carecoverage, redirecting resources to services valuable to poor people, andexempting out-of-pocket expenses.15 Georgia extended its MedicalInsurance Program (MIP) coverage targeted to the poor from 750,000 to900,000 beneficiaries. Latvia redirected resources toward services valu-able to the poor by providing funding for additional public health nursesso that operating hours could be expanded to ensure that all patientsreceived necessary preventive care and screenings. Romania plannedcopayments and hospital services reimbursements for vulnerable groups;Latvia exempted poor patients from various copayments.
Despite Fiscal Pressures on Health Insurance Funds, Core HealthSpending Was Largely Protected Although HIFs suffered a substantial drop in revenues,16 governmentsreduced health expenditure growth, while protecting some core healthspending for primary health care and prescription drugs (see Koettl2010).17 Much of the expenditure cuts were achieved by squeezing hos-pitals to decrease spending or to ration access to hospital services. Mostcountries in the region can increase efficiency by shifting their focus toprimary health care from tertiary care, but it remains to be seen whetherthe HIF strategy of squeezing hospitals has enhanced efficiency or simplyshifted the burden to system clients through higher out-of-pocket pay-ments or rationing.
Notes
1. During the Asian crisis, Indonesia, Malaysia, the Philippines, and Thailand hadno UI programs. The Republic of Korea had a functioning UI system and thegovernment shortened the contribution period to increase eligibility andextended the duration of benefits so the number of beneficiaries rose from5.7 to 8.7 million. Despite these efforts, 90 percent of unemployed people didnot meet eligibility criteria for unemployment insurance (Ramesh 2009).
2. Informal workers do not contribute or accrue pension rights in any majormandatory pension schemes. However, many of the European and CentralAsian countries not included in Kuddo (2009b) are likely to have higher infor-mal labor force participation rates.
3. Often using European Social Funds.
4. ESFs are the European Union’s main financial instrument designed to supportthe creation of more and better jobs in EU member states. ESF spending con-stitutes about 10 percent of the EU’s total budget.

Social Policy Responses to Protect Households 77
5. During the Asian crisis, the Republic of Korea introduced a job maintenanceprogram, which was essentially a wage subsidy of between 0.33 and 0.66 per-cent of wages if a firm demonstrates the need for economic adjustment. Anassessment of the program found that 22 percent of jobs would have been losthad it not been for the subsidy (Atinc 2003).
6. In May 1999, the Republic of Korea launched a public works program for theunemployed not covered by UI benefits. Around 2.5 times more people ben-efited from the public works program compared with UI. The wage had to beadjusted downward several times as some workers were leaving their jobs toreceive the higher wages available through the program (Blomquist et al.2002).
7. Germany gained notoriety for its short-time work program called Kurzarbeit.The government provides a subsidy from its UI funds to workers and employersso firms can cut labor costs without layoffs by spreading hourly cuts across allemployees.
8. Different types of subsidies have been used widely in postcrisis periods: ear-lier examples include Argentina, Indonesia, the Republic of Korea, Malaysia,and Thailand (see Atinc 2003; Ramesh 2009).
9. Ongoing research on safety net performance across the Eastern Europe andCentral Asia region suggests that errors of exclusion and inclusion persist.
10. Armenia reduced leakage by cross-checking databases of paid dividends byallowing the authorities to identify nearly 17,000 families receiving benefitsthat would have been ineligible had they fully disclosed their earnings (WorldBank 2010a).
11. During 1998, in response to the crisis, the Republic of Korea expanded eligi-bility by adding a temporary component to the Livelihood Protection Program,for which 75 percent of benefits were covered by the central government(Blomquist et al. 2002). Despite the expanded coverage and increased budgetallocation, however, only 7 percent of the new poor benefited from theexpanded program, and the overall coverage decreased from 32 percent of thepoor in 1997 to 17 percent in 1998 (Fallon and Lucas 2002).
12. World Bank (2009) reviews the crisis-inspired pension reforms.
13. Pensions cover between 40 and 50 percent of all households in a majority ofcountries in the region.
14. Although pension benefit increases are within the purview of the govern-ment, cuts in pensions are sometimes protected by the judicial system andcuts often are politically costly. This makes it difficult to roll back or decreasebenefit levels. For example, in June 2010, a top court in Romania ruled out apension cut demanded by the country’s government as part of a fiscal auster-ity measure. Similarly, in December 2009, Latvia’s constitutional court struckdown pension cuts that were part of the austerity measures.

78 The Jobs Crisis
15. Argentina scaled up programs for maternal and child health during its 2001crisis by about 70 percent, despite a 25 percent total government budget con-traction. Thailand expanded its Public Assistance Program to protect vulner-able groups, and the Voluntary Health Card Program targeted to those closeto poverty (Gottret 2009).
16. Most HIFs rely on payroll taxes so revenue is sensitive to changes in employ-ment and wages, and revenue growth follows a procyclical pattern. However,HIFs also obtain significant revenues from other sources, such as the statebudget and social insurers like pensions and unemployment funds.
17. Findings were based on detailed surveys on revenues, expenditures, insuredpopulations, utilization, and wait lists. Surveys were sent to the HIFs of eastern-central Europe, Baltic, and Western Balkan countries. Ten countries reporteddata for 2007, 2008, and the first six months of 2009: Albania, Bosnia andHerzegovina, Bulgaria, Croatia, Estonia, Latvia, Lithuania, FYR Macedonia,Montenegro, and Serbia.

79
Several lessons emerged while monitoring the social impacts of the 2009crisis.This chapter presents the lessons that can improve responses to sub-sequent crises.
Effective crisis responses are fiscally responsible measures that are pre-pared in advance of a crisis and that are timely, targeted, and temporary.Timely measures provide income support quickly. Eastern European andCentral Asian countries’ mostly timely response to the crisis was aided bysafety net programs established long before the onset of the crisis.1
Targeted measures provide income to people who are most affected bythe downturn and hence would support at least a minimum welfare bas-ket of goods for the existing and new poor. Initially, well-performingsafety nets could be scaled up by expanding coverage or increasing bene-fits, but this depends critically on national core capacity for safety net sys-tems before a crisis. In some cases, new programs had to be launched toreach the new poor because existing program parameters could notbe altered appropriately. Finally, temporary measures reduce or expire asthe economy improves and hence should not increase budget deficits inthe long run.
There are three pillars to an effective crisis response: (i) automaticstabilizers, (ii) adjusters, and (iii) starters (see figure 5.1). Although
C H A P T E R 5
Improving Responses toSubsequent Crises

80 The Jobs Crisis
automatic stabilizers can be either revenue or expenditure items thatadjust automatically and countercyclically, this report focuses onUI and LRSA. In light of new realities on the ground, such as higher inci-dence of people not covered by existing safety nets and reduced worriesof moral hazard, governments can adjust parameters of existing safetynets. When existing programs cannot address the needs of the crisis, evenif program parameters are adjusted, new programs can be started. Mostcountries in the region already had an array of safety nets in place, butone category of crisis responses that was missing was public works. Thisreport focuses on public works, youth apprenticeships, second chanceeducation programs, and mobility allowances as examples of programsimplemented in the region in response to the crisis.
This chapter focuses on measures to protect households’ welfare dur-ing a crisis and, as such, does not address the more general question of therole of fiscal policy in stabilizing output over the economic cycle.
Experience from the 2009 crisis reveals that several ECA countriesalready had a number of automatic stabilizers that worked reasonably welland others that did not respond as quickly as expected. Although UIappears to have worked in a number of countries, it is not yet a broad-based automatic stabilizer because UI coverage rates are relatively low.
Automatic stabilizers
Adjusters
Starters
• Unemployment insurance benefits
• Unemployment insurance parameters
• Social assistance parameters
• Binding minimum wage levels
• Public works
• Other programs (youth apprenticeships, second- chance education programs, etc.)
• Last-resort social assistance
Figure 5.1 Three Pillars to an Effective Crisis Response
Source: World Bank staff.

LRSA program performance was mixed, and some countries might benefitfrom modernizing these programs so they can better react to future crises.Program parameter adjustments were made during the crisis to betterrespond to the crisis, but some adjustments were not well exploited.Some countries altered UI parameters and LRSA parameters, but thestrategy was underutilized given its potential; and minimum wage ratesand activation conditions rarely were adjusted even during the worst ofthe crisis. Finally, some countries did start new programs, such as publicworks, in response to high unemployment. Because many EasternEuropean and Central Asian countries already have at least one LRSAprogram that targets poor people, none of the countries had to resort tolaunching a new social assistance scheme during the 2009 crisis.
Tilting the policy balance toward more precrisis preparation and lesspostcrisis reaction can be beneficial for three reasons. First, postcrisisreactionary policy suffers from implementation lags, sometimes due tothe political decision-making process or administrative capacity constraints.2
Second, postcrisis reactionary policy is not always reversed automaticallywhen the economic cycle improves. As a result, reactionary policies havethe potential to lead to higher government deficits (Baunsgaard andSymansky 2009). Third, ex ante planning of policy responses to a down-turn can lead to better-designed programs during a crisis and increasedforesight on how to manage the fiscal costs of any such interventionsacross the economic cycle.
Responding to a crisis with existing safety nets by altering programparameters and starting new programs requires considerable fiscal dis-cipline and planning. Failure to recognize those needs could lead toinappropriate responses to crises and to high costs to taxpayers. In addi-tion, increasing the balance toward more precrisis preparation does notremove the need for postcrisis discretionary actions to confront a crisis.For example, governments embarked on a series of unplanned interven-tions over 2008–10, including monetary policy easing, bank bailouts, toxicasset buy backs, and loan forgiveness.
Depending on the fiscal position, it may be inappropriate in certaincircumstances to allow a precrisis planned response to operate fully. If fis-cal space is constrained because of concerns about fiscal solvency or thelimited availability or high cost of financing, then allowing the budgetdeficit to increase in response to an output contraction may underminemacroeconomic stability. Fiscal savings built up in good times, for exam-ple, through the reduction of public debt, mitigate this risk. Finally, auto-matic stabilization is less desirable if the economy is faced with a supply
Improving Responses to Subsequent Crises 81

82 The Jobs Crisis
shock (Blanchard 2000). In the case of a more permanent shock to the sup-ply side of the economy, automatic stabilizers delay the adjustment of actualoutput to its new potential level and lead to a widening of the output gap.
Automatic Stabilizers
One of the key lessons of the 2009 crisis in Eastern European and CentralAsian countries is that automatic stabilizers such as UI benefits weretimely, targeted, and temporary in their response. LRSA, which, too, issupposed to scale up during a crisis and wind down during good times,however, experienced some delays in its response.
Unemployment Insurance Worked as an Automatic Stabilizer, but ItCovers too FewUI benefits, worked well as an automatic stabilizer in several EasternEuropean and Central Asian countries to cushion household incomeshocks. Unemployment benefits were timely in that they reacted withminimum delay (as described in chapter 4), they were targeted to peo-ple who lost their jobs, and they are temporary because unemploymentbenefits expire after a specified duration of benefits receipt. Social insur-ance agencies and public employment services offices responded capably,considering the large and rapid increases in beneficiaries and fiscal out-lays. Across 24 Eastern European and Central Asian countries for whichUI benefit incidence data are available, Bulgaria, Estonia, Latvia,Lithuania, and Romania all more than doubled the number of UI benefi-ciaries between December 2008 and 2009, likely preventing a largeincrease in poverty. For example, simulations indicate that the Latvianpoverty rate would have been 23 percent rather than 20 percent in theabsence of UI in the country (Ajwad, Haimovich, and Azam 2010).
At a household level, unemployment benefits provide much-neededincome for households that have suffered a job loss. On a macroeconomiclevel, unemployment benefits dampen output fluctuations by increasinggovernment spending on transfers to households during downturns andreducing them during good times. In Latvia, during 2008–09, a 144 percentnominal increase in UI benefits amounted to a stimulus of 0.61 percentof GDP. Romania increased spending on UI benefits and in turn stimu-lated the economy by 0.21 percent of GDP, and Ukraine by 0.16 percent.Between 2008 and 2009, Armenia increased UI benefits spending innominal terms by 74 percent and Azerbaijan by 31 percent, but coverageis low in these two countries and, hence, the stimulus effect was less than0.01 percent of GDP. Unemployed people are more likely to spend

Improving Responses to Subsequent Crises 83
domestically, which supports local jobs, and very little of their UI benefitsare likely to be saved or invested, especially among the poorer people. Assuch, the multiplier associated with unemployment benefits is likelyhigher than one.
To become an economywide automatic stabilizer, Eastern Europeanand Central Asian UI systems could be reformed to increase coverage. Insome countries, long work tenure requirements are mandated; in others,part-time workers are not covered by UI; and in many countries, the self-employed are not covered. These are all groups that could be coveredwith UI by varying the pay-in amounts, duration of benefits, and amountof benefits, for example. In addition to altering eligibility rules, formal-izing workers who operate in the informal economy and integrating theminto the UI system will broaden the base considerably. The formalizingprocess can be fostered by reducing operating costs and ensuring thathiring and firing practices are more flexible, according to an OECD study(OECD 2009b).3
To Perform as an Automatic Stabilizer, Timeliness of Last-Resort Social Assistance Needs to ImproveDuring a crisis, social assistance can be leveraged to help people who fallon hard times and have limited savings to cushion the shock.4 As such,LRSAs can work as automatic stabilizers by expanding during recessionsto help households smooth consumption, and then contracting duringthe recovery when the labor market improves. Across six countries in theregion for which data are available, three had LRSA programs thatresponded to the crisis, while coverage rates of LRSAs did not increase asexpected in the remaining countries. LRSA targeting performance in theregion is generally good by global standards (see chapter 4), and the pro-grams are designed to be temporary in that they expire after severalmonths of benefit receipt. In addition, LRSAs can be effective automaticstabilizers because poor households generally save very little (see chapter3) and, hence, spend their benefits in the local economy, which in turninduces a large multiplier effect.
LRSA performance in many countries in the region has been mixed andits fiscal stimulus effect low because LRSA coverage and budgets aresmall. Between 2008 and 2009, Armenia increased LRSA spending by0.21 percent of GDP, Latvia by 0.07 percent, and Serbia by 0.02 percent(World Bank Forthcoming). However, these increases were small, giventhe dramatic drop in remittances in Armenia and very high unemploy-ment in Latvia and Serbia in 2009. Most LRSAs are better at alleviatingchronic poverty than transient poverty, not only because of the design, but

84 The Jobs Crisis
also because of the manner in which the budgeting process and financingsources function. Transforming LRSAs into more effective instruments toprotect the most vulnerable households during deep recessions willrequire design modifications, including the following:5
• Promote effective targeting and incentive compatibility by phasing ineligibility that is based on criteria for assessing welfare, such as incomelevels, assets, and proxy indicators, instead of using criteria based onregistered unemployment status and age (minimum pensions).
• Strengthen benefits administration to speed up registration and tar-geting and reduce errors and fraud. Eastern European and CentralAsian countries can gain from upgrading social assistance benefitadministration systems by phasing in automated processes, reorgan-izing service delivery, strengthening the referral function, and pro-moting results-based management within and across programs.Developing and implementing systems for detecting, remedying, andminimizing errors and fraud are critical for efficiency and politicalsustainability.
• Increase the central government’s LRSA financing burden relative tothe local government’s burden. Experience in a few countries in theregion showed that during the crisis, as tax revenues fell, local govern-ments were neither willing nor able to absorb high LRSA benefit costs.6
After the onset of the crisis, the decentralized financing model used bysome countries to finance centrally mandated benefits almost guaran-teed system failure. That is, cash-strapped local governments, whichusually are expected to maintain balanced budgets, could not meet theincreased demand for safety nets in the face of their reduced revenues.7
Adjusters
Program parameters can be adjusted to improve the crisis response. Threesets of parameters are identified in this report. First, UI benefit amounts,duration of payout, and eligibility rules can all be altered when moral haz-ard is less of a risk during a downturn. Second, LRSA program guidelinescan be altered to increase coverage and reduce activation conditions.Third, minimum wage rates can be altered to minimize layoffs amonglow-wage workers, while weighing tax revenue implications and the stim-ulus value of the lower minimum wage.

Improving Responses to Subsequent Crises 85
Unemployment Insurance Program Parameters Can Be Adjusted toReflect Labor Market ConditionsUI program parameters can be adjusted to respond to labor market con-ditions by changing the duration, coverage, and benefit amounts whencertain thresholds are exceeded. During a recession, unemployment ismore likely to stem from weak labor market conditions rather than indi-vidual decisions to choose leisure over work. As a result, more generousUI benefits may be desirable. The duration of benefit payments oftensparks passionate debates on the relative weight given to protecting work-ers who paid into UI programs and who became unemployed due to nofault of their own. Additionally, a potential moral hazard might result ifworkers perceive an opportunity to live comfortably on UI benefits and,as a result, put little effort into staying employed, reduce their job searcheffort, or maintain unrealistic job expectations.
Latvia, Poland, and Romania all increased the duration of unemploy-ment benefits during 2009. Latvia increased the unemployment benefitperiod to nine months by providing one-quarter of the gross minimumwage to UI beneficiaries whose benefits were exhausted within ninemonths; Poland extended the social unemployment subsidy from 12 to18 months; and Romania extended the maximum duration of unemploy-ment benefits from six to nine months. For comparison, in the UnitedStates, which generally maintains a less generous unemployment benefitsystem, the benefit duration was extended from 6.5 months to as muchas two years for residents in states with high unemployment rates.
Some countries also changed the eligibility criteria to ensure thatUI benefit coverage increased. In Latvia, the contribution period beforea worker could claim benefits decreased from 12 months in the last18 months to 9 months in the last 12 months.
Finally, Estonia, Russia, and Turkey increased the unemployment benefitamount.
Last-Resort Social Assistance Program Guidelines Can Be Altered toReflect Crisis ConditionsLRSA program parameters can be adjusted to reflect crisis conditions onthe ground. Based on country-specific criteria, such as labor market indi-cators or other proxies for household welfare, design changes can be madeto ensure a stronger crisis response. In this vein, see table 4.2 for someexamples from the 2009 crisis. Noteworthy among attempts to protectthe poor in the midst of deteriorating economic conditions are measuresto increase coverage (Azerbaijan, Croatia, Latvia, Romania, Serbia, Ukraine)

86 The Jobs Crisis
and measures to alter the financing burden to acknowledge local govern-ment fiscal positions (Latvia, Romania). For example, Latvia took steps toincrease coverage of its LRSA program by increasing eligibility thresholdsby more than 40 percent for its GMI poverty alleviation programbetween 2008 and 2009, albeit from a low level. In addition to increasingeligibility thresholds, Latvia temporarily altered financing mechanisms toreduce the burden on local governments, which before 2009 fullyfinanced LRSAs (World Bank 2010d). Recognizing that cash-strappedlocal governments might restrict LRSA applications during the height ofthe crisis, the central government agreed to a temporary 50/50 split forall LRSA spending.8 Between 2008 and 2009, real LRSA spending inLatvia increased by 133 percent.
Health financing systems, if tied to social assistance programs, can bealtered as needed during a crisis to protect the poor. Households tend tocut down on health care during crises (see chapter 3) because of lowerincomes or because of out-of-pocket expenses and hence, providing tar-geted financial protection to the poor can protect human capital.
Activation conditions could be altered to better reflect weak labormarket conditions and increased workload among social welfare workersand public employment services staff. Although relatively unused bycountries in the 2009 crisis, countries could have relaxed activation con-ditions so that deserving people did not lose benefits or become trappedin a cycle of poverty. Tighter activation conditions are useful to preventwelfare dependency, but when moral hazard worries are allayed, as theyusually are when labor market conditions are weak, relaxing activationconditions can improve efficiency by reducing the workload on socialworkers and public employment services staff.
Adjust the Binding Minimum Wage if Layoffs Affect Low-wage Workers or New Entrants (Youth)Governments could consider reducing binding minimum wages if moni-toring statistics show a high proportion of minimum wage workers beinglaid off during an economic downturn or if new entrants and youthare disproportionately shut out of the labor force. Minimum wage ratesare set such that the rates are high enough to secure a socially acceptablestandard of living, while at the same time low enough that less produc-tive workers are not excluded from the formal labor market. Reducingbinding minimum wages is a politically unpopular measure that makessense only during a recession, when layoffs are widespread among people

Improving Responses to Subsequent Crises 87
earning close to minimum wage or job prospects for new entrants to thelabor force are weak. Recessions can lead to wage rate reductions at dif-ferent points in the wage distribution and, therefore, governments couldreduce statutory minimum wages to ensure that workers at or close to theminimum wage do not suffer job losses or that new entrants to the laborforce (youth) are not shut out.
During 2009, countries in the region did not lower statutory mini-mum wage levels as a crisis response policy instrument. Instead, govern-ments maintained minimum wages either to help families, maintainincome tax revenues, or stimulate the economy. However, these goals arenot necessarily achieved with minimum wages. With respect to poorfamilies, minimum wages are generally an inappropriate poverty-reductiontool because most poor households are more affected by unemploymentor informal sector employment than low minimum wages. On tax rev-enues, it is unclear whether income tax revenues fall more when mini-mum wage rates are maintained, but layoffs are high, or when minimumwage rates are decreased, but layoffs are low.
Starters
When existing safety nets cannot respond to the emerging vulnerable pop-ulation, even when program parameters are adjusted, new programs can bestarted to cover uncovered people and protect household welfare. A rela-tively well-established program, especially for demand shocks, is publicworks. However, other programs also can be launched during a crisis if theyare planned ahead of time. Programs could include youth apprenticeshipprograms, second-chance education programs, and mobility allowances.
Public Works Can Be an Effective Countercyclical MeasureLabor-intensive public works can be an effective countercyclical labormarket program during covariate shocks, such as economic crises ornatural disasters.9 One reason for their desirability is that public worksprograms generally are self-targeting, where people self-select into theprogram based on the stipend rate and the labor intensiveness of thework. When stipends are low and the work is labor intensive, thennonpoor people are less likely to participate. As such, little time is lostimplementing targeting systems.
Before the onset of the 2009 financial crisis, public works programswere relatively underutilized in Eastern European and Central Asian

88 The Jobs Crisis
countries. However, several countries in the region implemented publicworks programs in 2009 to carry out maintenance projects and createcommunity assets. These public works programs served as a minimumsafety net for the swelling ranks of unemployed people who were notcovered by unemployment insurance benefits.
In Latvia, the government initiated an emergency public works pro-gram known as Workplaces with Stipends (WWS) to respond to highunemployment rates. The program targeted registered unemployed peo-ple who were not receiving UI benefits, a group that expanded as a resultof the crisis. The program self-targets poor people by offering a lowstipend for labor-intensive work—Latvian lat (LVL) 100 (US$200) permonth, or about 80 percent of the net minimum monthly wage.Participants are hired on a first-come, first-served basis and are eligible towork for up to six months, with a minimum two-week requirement.Workers carry out maintenance of public infrastructure, conduct environ-mental cleanups, provide social services by working through civil societyorganizations, and provide some municipal and state services.
In Armenia, the Lifeline Road Improvement Project was prepared as aRapid Response Project to create short-term jobs in road constructionand to mitigate the crisis impact on the construction sector, which hadsuffered declines of 38 percent in outputs and 40 percent in employment.The project aimed to rehabilitate 240 kilometers of roads that the gov-ernment already had identified and prioritized; it created 16,000 person-months of employment and helped local construction industries copewith the recession by hiring regionally based contractors. The programalso helped increase local construction industry capacity by introducingmodern and cost-effective technologies, providing hands-on support, andoffering training by supervision consultants to increase industry efficiencyand sustainability.
Initiating public works programs at the beginning of a crisis is notideal because of the time required to design and implement the pro-gram, but the following recommendations can speed public worksresponses during a crisis:
• Maintain a list of priority shovel-ready programs to implement to ensurethat resources are allocated to building infrastructure or maintainingassets with the highest value to the community. Shovel-ready projectplans require regular updating to facilitate scale-up when needed.
• Maintain flexibility in social investment funds to generate labor-intensive work for people when private sector labor demand falls.

Improving Responses to Subsequent Crises 89
Other Programs Can Be Initiated to Narrow the Coverage GapDuring crises, as information emerges about uncovered vulnerablegroups, social programs can be launched to protect incomes and helphouseholds to avoid making decisions that would hurt long-termhuman capital accumulation. The range of programs can vary consider-ably depending on the safety net and labor programs available in thecountry. In past crises, conditional cash transfer programs, social assis-tance schemes, price subsidies, and labor market programs werelaunched to protect people who were not eligible for government pro-grams. In Eastern European and Central Asian countries, safety net pro-grams were already relatively well established. However, the severity ofthe crisis required that additional safety net programs be launched.These programs included youth apprenticeship programs, second-chance education programs, and mobility allowances. To reduce delaysand to ensure effective program design, these programs, too, need to beplanned ahead of time.
Youth apprenticeships can help new entrants to the labor market secureemployment and gain valuable skills during a time of low job creation.Employers generally like the program because it helps them keep laborcosts relatively low while at the same time adding value to the firm. Inaddition, the program usually requires the apprentice to make a commit-ment to the firm, thereby giving the employer an incentive to teach theapprentice the trade. During a crisis, countries could use youth apprentice-ship programs to temporarily provide employment to youth and also usethe programs to enhance the skills of new labor market entrants. The pro-grams, however, need to be designed with care to ensure that they are costeffective and cause minimal labor market distortions.
Second-chance education programs can be leveraged during a crisis tohelp people upgrade their skills. During a recession, the opportunity costof participating in the second-chance program is low for beneficiariesand, hence, it is a good time to make these opportunities available tothose people who missed out the first time they went through the edu-cation system. Often, second-chance education opportunities are takenup by people who did not complete secondary school and even may nothave completed primary school. Thus, the average beneficiary is likely tobe poor. As a result, providing a stipend can both encourage participationin the program and also provide income support to beneficiaries. Usingthe same logic, university quotas might be relaxed during recessions toallow larger cohorts of students to further their education while labordemand remains low.

90 The Jobs Crisis
Mobility allowances can help to facilitate employment when some sec-tors contract while other sectors expand. People might be reluctant tomove to geographic regions of the country where jobs are more abundantif moving costs are high and, therefore, mobility schemes can help reducethis resistance to moving.
Crisis Responses Require Fiscal Discipline, Planning, and Data
Prudent Fiscal Policies during Good Times Are Needed to Build UpSavings for Use in Hard TimesIn designing social responses, the implications for the budget positionacross the cycle are important to consider. Increasing the countercyclicalsocial response can result in sharp government spending expansions dur-ing deep recessions, particularly when unemployment increases signifi-cantly. Although the focus has been on spending responses, revenues alsoadjust automatically—and often substantially—to sharp cyclical down-turns. Together with spending increases, this has the potential to lead tofiscal deficit widening.
Where financing options are constrained or debt sustainability is a con-cern, cyclical changes in revenue or spending can result in a reduction inthe fiscal space. One implication could be that the ability of a country toallow automatic responses to operate on the expenditure side of thebudget becomes limited and the economy has to go through a costly fis-cal contraction during a recession. Therefore, the use of prudent fiscalpolicies during good times to build up buffer stock savings becomes crit-ical for effective responses in bad times.
For some countries in the region, the rise in spending on social trans-fers was substantial during the recent crisis: the increase was almost aslarge as the annual growth in the overall fiscal deficit for a couple of coun-tries in 2009 (see figure 5.2). The expansion in social transfers is depend-ent not just on coverage, but also on the duration of benefits and thereplacement rate for wages. At the same time, revenues adjusted down-ward in reaction to the collapse in output. In fact, in some cases, the con-traction in GDP was accompanied by a higher-than-proportionate drop inrevenues: the revenue-to-GDP ratio in 2009 fell by 4 percentage pointsin Latvia and by 2 percentage points in Lithuania compared with 2008.
Beware of Efficiency CostsAlthough steps can be taken to improve crisis responses, they also mayimpose efficiency costs. For example, generous unemployment benefits

Improving Responses to Subsequent Crises 91
–1
0
1
2
3
4
5
6
7
per
cen
t of G
DP
–10
–5
0
5
10
15
20
25
30
per
cen
t ch
ang
e
real growth in social benefits and transfers in-kind
increase in social benefits and transfers andincrease in fiscal deficit
Latvia
Lithuania
Estonia
Slovak Republic
Slovenia
Romania
Bulgaria
Czech
Republic
Poland
Hungary
Latvia
Lithuania
Estonia
Slovak Republic
Slovenia
Romania
Bulgaria
Czech
Republic
Poland
Hungary
increase in social benefits and in-kind social transfers
increase in fiscal deficit
Figure 5.2 Social Transfers Increased in Most Countries in 2009 Relative to 2008
Source: World Bank staff calculations based on Eurostat and IMF World Economic Outlook Database, October 2010.Note: Social benefits data consist of transfers made in cash to households to relieve them of the financial burdenof certain risks or needs, for example, pensions, family and child allowances, and disabled persons’ allowances.Social transfers in kind covers expenditures on products supplied to households via market producers.

92 The Jobs Crisis
might result in lower job search and job acceptance, in addition to distor-tions from the increases in taxes required to pay for the program.Furthermore, in countries with large and segmented labor markets,increasing UI benefits may magnify the segmentation between formal andinformal labor markets.
Crisis Responses Must Be Based on Reliable and Timely Monitoring IndicatorsCrisis responses require reliable and timely monitoring indicators. In thatrespect, countries in the region often are ahead of the curve relative toother regions, with very strong administrative information and regularhousehold and Labor Force Surveys. Access to reliable and timely data toinfluence policies, however, varies across Eastern European and CentralAsian countries.
More Work on Crisis Responses Is Needed
Increasing government social spending during a crisis entails efficiencyand equity implications. Another way to increase the governmentresponse during the economic cycle is to allow the parameters that gov-ern taxes or transfers to change based on some trigger linked to cyclicaleconomic factors (Baunsgaard and Symansky 2009). This chapter hascovered a number of these automatic responses. Further options can beconsidered. One possibility is to look for temporary tax policy measuresto target low-income households.10 Additional work is needed to identifyother temporary tax or spending policies that have the potential to havea large multiplier impact on output or to protect the vulnerable from theimpact of a deep recession. In any case, such temporary measures do notcome with the wider efficiency or equity considerations that permanentlyincreasing the size of government would have.
Notes
1. Past work demonstrates that countries with adequate safety nets establishedbefore the crisis have more capacity to minimize harmful effects on poor peo-ple (see, for example, Ferreira et al. 1999).
2. Only 50 percent of the “Contracts, Grants and Loans” portion of theAmerican Recovery and Reinvestment Act of 2009, which was passed by theU.S. Congress on February 13, 2009, had been paid out as of August 20, 2010.

Improving Responses to Subsequent Crises 93
3. In particular, the OECD study recommends the following: lower minimumwages and labor taxation; set less restrictive employment protection legisla-tion, especially if enforcement capacity is limited; remove restrictions ontemporary employment; establish a direct relationship between social insur-ance contributions and benefits; simplify administrative procedures to set upa business; reduce red tape and corruption; simplify household and businesstax schemes; encourage compliance with better governance; improve enforce-ment of tax, social security, and labor regulations; and improve coordinationamong agencies in charge of these institutions.
4. Successful examples of social assistance programs can be found in the postcrisisresponse schemes of Argentina (Jefes y Jefas Program), Mexico (Oportunidades),and the Republic of Korea (Livelihood Protection Program). See Galasso andRavallion (2004); Lustig and Walton (1998); and Fallon and Lucas (2002),respectively, for details.
5. These recommendations focus on increasing safety net flexibility and respon-siveness during crises, and hence they are a subset of required reforms.
6. Local governments have little or no leeway to finance expenditures by incur-ring a deficit.
7. As a result, considerable anecdotal evidence suggests that social welfare work-ers were pressured to keep new entrants to LRSA at a minimum.
8. During 1998, in response to the crisis, the Republic of Korea expanded eligi-bility by adding a temporary component to the Livelihood Protection Program,for which 75 percent of benefits were covered by the central government(Blomquist et al. 2002). However, despite the expanded coverage andincreased budget allocation, only 7 percent of the new poor benefited from theexpanded program, and the overall coverage decreased from 32 percent of thepoor in 1997 to 17 percent in 1998 (Fallon and Lucas 2002).
9. Del Ninno, Subbarao, and Milazzo (2009) report: public works programswere launched in East Asia in 1997, in Latin America in 2002, and in manyAsian countries after the 2004 tsunami. The authors argue that programswere set up to mitigate the negative effects of a shock among the most vul-nerable population.
10. Blanchard, Dell’Ariccia, and Mauro (2010) suggest a flat refundable taxrebate as an example of such a measure.


95
Ajwad, M. I., F. Haimovich, and M. Azam. 2010. “The Employment and WelfareImpact of the Financial Crisis in Latvia.” World Bank, Washington, DC.
Ajwad, M. I., and I. Oral. 2010. “The Social Sector Response to the GreatRecession in Europe and Central Asia: A Summary of Recent World BankDevelopment Policy Loans.” World Bank, Washington, DC.
Atinc, T. M. 2003. “How the East Asian Crisis Changed the Social Situation.” InNew Social Policy Agendas for Europe and Asia: Challenges, Experience, andLessons, ed. Katherine Marshall and Olivier Butzbach. Washington, DC:World Bank.
Azam, M. 2010. “Impact of Financial Crisis on Households: How Did HouseholdsDeal with the Crisis? — Evidence from Europe and Central Asia Countries.”World Bank, Washington, DC.
Azam, M., and A. Isik-Dikmelik. 2010. “A Note on Recent Trends in Poverty inRomania.” World Bank, Washington DC.
Baunsgaard T., and S. A. Symansky. 2009. “Automatic Fiscal Stabilizers: How CanThey Be Enhanced without Increasing the Size of Government?” InternationalMonetary Fund Staff Position Note SPN/09/23, Washington, DC.
Blanchard, O. 2000. “The Automatic Fiscal Stabilizers: Quietly Doing TheirThing—Commentary.” Economic Policy Review, Federal Reserve Bank of NewYork (April): 69–74.
References

Blanchard, O., G. Dell’Ariccia, and P. Mauro. 2010. “Rethinking MacroeconomicPolicy.” IMF Staff Position Note SPN/10/03, International Monetary Fund,Washington, DC.
Blomquist, J., M.Verhoeven, J. P. Cordoba, C. Bouillon, and P. Moser. 2002. “SocialSafety Nets in Response to Crisis: Lessons and Guidelines from Asia and LatinAmerica.” In Towards Asia’s Sustainable Development: The Role of SocialProtection, ed. Peter Whiteford. Paris: OECD.
Boeri, T., and J. van Ours. 2008. The Economics of Imperfect Labor Markets.Princeton, NJ: Princeton University Press.
Chang, S., D. Gunnella, J. A. C. Sternea, T. Luc, and A. T. A. Cheng. 2009. “Wasthe Economic Crisis 1997–1998 Responsible for Rising Suicide Rates inEast/Southeast Asia? A Time-Trend Analysis for Japan, Hong Kong, SouthKorea, Taiwan, Singapore and Thailand.” Social Science & Medicine 68 (7):1322–31.
Dasgupta, B. 2010. “The Impact of Financial Crisis on Household Welfare andHuman Development Outcomes.” Europe and Central Asia Knowledge Brief,World Bank, Washington, DC.
Del Ninno, C., K. Subbarao, and A. Milazzo. 2009. “How to Make Public WorksWork: A Review of the Experiences.” Social Protection Discussion Paper No.48567, World Bank, Washington, DC.
Duryea, S. 1998. “Children’s Advancement through School in Brazil: The Role ofTransitory Shocks to Household Income.” RES Working Papers No. 4124,Research Department, Inter-American Development Bank, Washington, DC.
Eurostat. 2010. “Euro Area Hourly Labour Costs Rose by 2.2%.” Euro Indicators,40/2010, March 17.
Fallon, P. R., and R. E. B. Lucas. 2002. “The Impact of Financial Crises on LaborMarkets, Household Incomes and Poverty: A Review of Evidence.” The WorldBank Research Observer 17 (1): 21–45.
Ferreira, F. H. G., G. Prennushi, and M. Ravallion. 1999. “Protecting the Poor fromMacroeconomic Shocks.” Policy Research Working Paper No. 2160, WorldBank, Washington, DC.
Ferreira, F. and N. Schady. 2009. “Aggregate Economic Shocks, Child Schoolingand Child Health.” The World Bank Research Observer 24 (2): 147–81.
Filmer, D., and L. Pritchett. 1999.“The Effect of Household Wealth on EducationalAttainment: Evidence from 35 Countries.” Population and Development Review25 (1): 85–120.
Fiszbein, A., P. Giovagnoli, I. Adúriz, J. Uribe, and N. Schwab. 2002. “TheArgentine Health Sector in the Context of the Crisis.” Working Paper No.2/02, World Bank, Washington, DC.
96 References

Fiszbein, A., D. Ringold, and S. Srinivasan. 2010. “Cash Transfers and the Crisis:Opportunities and Limits.” World Bank, Washington, DC.
Frankenberg, E., D. Thomas, and K. Beegle. 1999. “The Real Costs of Indonesia’sEconomic Crisis: Preliminary Findings from the Indonesia Family LifeSurveys.” Labor and Population Program Working Paper Series 99-04, RAND,Santa Monica, California. http://www.rand.org/pubs/drafts/2008/DRU2064.pdf (accessed March 3, 2010).
Galasso, E., and M. Ravallion. 2004. “Social Protection in a Crisis:Argentina’s PlanJefes y Jefas.” World Bank Economic Review 18 (3): 367–99.
Gottret, P. 2009. “Protecting Pro-Poor Health Services during Financial Crises:Lessons from Experience.” Health, Nutrition, and Population, World Bank,Washington, DC. http://www.ncbi.nlm.nih.gov/pubmed/19791698.
Grey, C., T. Lane, and A. Varoudakis. 2007. Fiscal Policy and Economic Growth:Lessons for Eastern Europe and Central Asia. Washington, DC: WorldBank.
Gupta, S., M. Verhoeven, and E. Tiongson. 1999. “Does Higher GovernmentSpending Buy Better Results in Education and Health Care?” IMF WorkingPaper WP/99/21, International Monetary Fund, Washington, DC.
ILO (International Labour Organization). LABORSTA Database. ILO, Geneva,Switzerland.
IMF (International Monetary Fund). 2010a. “World Economic Outlook:Rebalancing Growth.” Washington, DC, April.
———. 2010b. “World Economic Outlook: Sustaining the Recovery.”Washington,DC, October.
Jacoby, H. G., and E. Skoufias. 1997. “Risk, Financial Markets, and Human Capitalin a Developing Country.” Review of Economic Studies 64 (3): 311–35.
Khanna, G., D. Newhouse, and P. Paci. 2010. “Fewer Jobs or Smaller Paychecks?Labor Market Impacts of the Recent Crisis in Middle-Income Countries.”Economic Premise 11 (April).
Koettl, J. 2010. “The Financial Impact of the Economic Crisis on Health InsuranceFunds in Eastern Europe.” Mimeo, World Bank, Washington, DC.
Kuddo, A. 2009a. “Labor Market Monitoring in Europe and Central AsiaCountries: Recent Trends (Round Two).” ECSHD Mimeo, World Bank,Washington, DC.
———. 2009b. “Informal Sector in Europe and Central Asia Countries.” ECSHDMimeo, World Bank, Washington, DC.
———. 2009c. “Economic Downturn and the Labor Market in Europe andCentral Asia Region.” World Bank, Washington, DC.
References 97

———. 2010a. “Labor Market Monitoring in Eastern Europe and Central AsiaCountries: Recent Trends (Round Three).” ECSHD Mimeo, World Bank,Washington, DC.
———. 2010b. “Employment Related Mitigation Measures in Europe and CentralAsia Countries.” Europe and Central Asia Knowledge Brief, World Bank,Washington, DC.
Lokshin, M., and M. Ravallion. 2000. “Welfare Impacts of the 1998 FinancialCrisis in Russia and the Response of the Public Safety Net.” The Economics ofTransition, 8, no. 2 (July): 269–95.
Lustig, N., and M. Walton. 1998. “Crises and the Poor: A Template for Action.”World Bank and Inter-American Development Bank Note, Washington, DC.
Massarelli, N., D. Giovannola, and M. Wozowczyk. 2010. “No Turn-around Yet forthe EU-27 Labour Market.” Eurostat Statistics in Focus 22/2010.
Matkovic, G., B. Mijatovic, and M. Petrovic. 2010. “Impact of the Financial Crisison the Labor Market and Living Conditions Outcomes.” Study prepared forCenter for Liberal-Democratic Studies.
McKenzie, D. J. 2003. “How Do Households Cope with Aggregate Shocks?Evidence from the Mexican Peso Crisis.” World Development 31 (7): 1179–99.
Mitra, P., M. Selowsky, and J. Zalduendo. 2010. Turmoil at Twenty: Recession,Recovery, and Reform in Central and Eastern Europe and the Former SovietUnion. Washington, DC: World Bank.
Mohapatra, S., D. Ratha, and A. Silwal. 2010. “Outlook for Remittance Flows2011–12.” Migration and Development Brief 13, Migration and RemittancesTeam—Development Prospects Group, World Bank, Washington, DC.
Mrlianova, T., and C. Wirtz. 2010. “Harmonized Indices of Consumer Prices.”Eurostat Data in Focus.
OECD (Organisation for Economic Co-operation and Development). 2009a.“OECD Employment Outlook: Tackling the Jobs Crisis.” OECD, Paris.
———. 2009b. “Promoting Pro-Poor Growth: Employment and SocialProtection.” OECD, Paris.
Okun, A. M. 1962. “Potential GNP: Its Measurement and Significance.” Proceedingsof the Business and Economics Statistics Section,American Statistical Association,Washington, DC.
Pastor, M., and C. Wise. 2004. “Picking Up the Pieces: Comparing the SocialImpacts of Financial Crisis in Mexico and Argentina.” Paper presented at theannual meeting of the International Studies Association, Le Centre SheratonHotel, Montreal, Quebec, Canada, March 17.
Pew Research Center. 2010. “How the Great Recession Has Changed Life inAmerica: A Balance Sheet at 30 Months.” Social and Demographic TrendsReport.
98 References

Ramesh, M. 2009. “Economic Crisis and Its Social Impacts: Lessons from the1997 Asian Economic Crisis.” Global Social Policy 9 (1): 79–99.
Ratha, D., S. Mohapatra, and A. Silwal. 2010. “Outlook for Remittance Flows2010–11.” Migration and Development Brief 12, Migration and RemittancesTeam—Development Prospects Group, World Bank, Washington, DC.
Ruhm, C. J. 2000. “Parental Employment and Child Cognitive Development.”NBER Working Papers 7666, National Bureau of Economic Research, Inc.,Cambridge, MA.
Scarpetta, S., A. Sonnet, and T. Manfredi. 2010. “Rising Youth Unemploymentduring the Crisis: How to Prevent Negative Long-Term Consequences on aGeneration?” OECD Economics Department, Paris.
Skoufias, E. 2003. “Economic Crises and Natural Disasters: Coping Strategies andPolicy Implications.” World Development 31 (7): 1087–102.
Skoufias, E., and S. W. Parker. 2002. “Labor Market Shocks and Their Impacts onWork and Schooling.” FCND Discussion Paper 129, International Food PolicyResearch Institute (IFPRI), Washington, DC.
Stillman, S., and D. Thomas. 2004. “The Effect of Economic Crises on NutritionalStatus: Evidence from Russia.” IZA Discussion Paper No. 1092, Institute forthe Study of Labor, Bonn.
Tiongson, E. R., N. Sugawara, V. Sulla, A. Taylor, A. I. Gueorguieva, V. Levin, andK. Subbarao. 2010. The Crisis Hits Home: Stress-Testing Households in Europeand Central Asia. Washington, DC: World Bank.
World Bank. 2003. “Argentina Crisis and Poverty. A Poverty Assessment: MainReport.” World Bank, Washington, DC.
———. 2004. World Development Report 2004: Making Services Work for PoorPeople. Washington, DC: World Bank.
———. 2005. “Growth, Poverty, and Inequality: Eastern Europe and the FormerSoviet Union.” World Bank, Washington, DC.
———. 2007. World Development Report 2007: Development and the NextGeneration. Washington, DC: World Bank.
———. 2009. “Pensions in Crisis: Europe and Central Asia.” Regional Policy Note,World Bank, Washington, DC.
———. 2010a. “Armenia: The 2008–09 Global Economic Crisis, PolicyResponses, and Household Coping Strategies.” World Bank, Washington, DC.
———. 2010b. “Croatia Crisis’ Social Impact: Labor Market and Poverty: AnAssessment.” World Bank, Washington, DC.
———. 2010c. “Europe and Central Asia Regional Strategy: Post Crisis Strategyfor Europe and Central Asia.” World Bank, Washington, DC.
———. 2010d. “Latvia: Public Expenditure Review.” World Bank, Washington, DC.
References 99

———. 2010e. “Russian Labor Market Monitoring.” World Bank, Washington,DC.
———. 2010f. “Smart Safety Nets in Europe and Central Asia: Directions for theKnowledge and Policy Agenda for the Crisis and Beyond.” World Bank,Washington, DC.
———. Forthcoming. “Response of Social Benefits in Eastern Europe and CentralAsia to the Crisis.” World Bank, Washington, DC.
100 References


ECO-AUDIT
Environmental Benefits Statement
The World Bank is committed to preservingendangered forests and natural resources. TheOffice of the Publisher has chosen to print TheJobs Crisis: Household and GovernmentResponses to the Great Recession in EasternEurope and Central Asia on recycledpaper with 50 percent post-consumer waste,in accordance with the recommended stan-dards for paper usage set by the Green PressInitiative, a nonprofit program supportingpublishers in using fiber that is not sourcedfrom endangered forests. For more informa-tion, visit www.greenpressinitiative.org.
Saved:• 2 trees• 1 million British
thermal units of total energy
• 183 pounds of net greenhouse gases(CO2 equivalent)
• 883 gallons of waste water
• 54 pounds of solidwaste


ISBN 978-0-8213-8742-9
SKU 18742
The global financial crisis that began in 2007 with the implosion of the real estate bubblein the United States and parts of Western Europe led to an economic downturn so severe thatit ranks as the worst since the Great Depression. Experts coined the term “Great Recession”to convey the magnitude of the crisis. Even though the impacts, including the tightening ofcredit markets, bank failures, firm closures, and high demand for social safety nets, were feltaround the world, the countries of Eastern Europe and Central Asia were the hardest hit.
The Jobs Crisis: Household and Government Responses to the Great Recession in Eastern Europeand Central Asia brings together evidence that World Bank teams have collected on theimpact of the crisis on families in the region. The multiple monitoring tools deployed forthis effort range from qualitative studies to Crisis Response Surveys, and from extensiveuse of administrative data to monitoring policy responses from many client governmentsin the region.
The book finds that some of the strategies adopted by families to cope with the crisis, suchas reducing health care spending, ended up putting households at a higher long-term risk.Most families kept their children in school, but crisis conditions continue in some countriesand as a result, education investments may still be reduced in favor of short-term survivalin some cases.
Governments played a crucial role in mitigating the impact of the crisis on householdincomes, the book notes. Unemployment benefits were among the first to reach crisis-affected households in a number of countries. Unemployment insurance coverage variedacross countries, however, in some cases leaving many families to fend for themselvesafter the breadwinner lost his or her job. Poverty-targeted social assistance programs alsoplayed an important role in some countries to help families whose incomes had fallenbelow the poverty line. But these programs reached needy households with a delay andalso suffered from low coverage in some countries.
One of the first systematic accounts of the consequences of the current macroeconomiccrisis on the welfare of people, The Jobs Crisis examines household and governmentresponses to the crisis. The book concludes with a discussion of how governments canbetter respond to future shocks with social policies and initiatives.
TheJobs
CrisisT
HE
WO
RLD
BA
NK
The Jobs CrisisHousehold and Government Responses to
the Great Recession in Eastern Europe and Central Asia
D I R E C T I O N S I N D E V E L O P M E N T
Human Development