The Perfect Storm Great Recession Aging Population Unprepared Workforce Upskilling of Jobs 1 2 3 4.
Upload
gerard-greeneCategory
view
219download
4
European Jobs Monitor
Shifts in the employment structure in Europe during the Great Recession
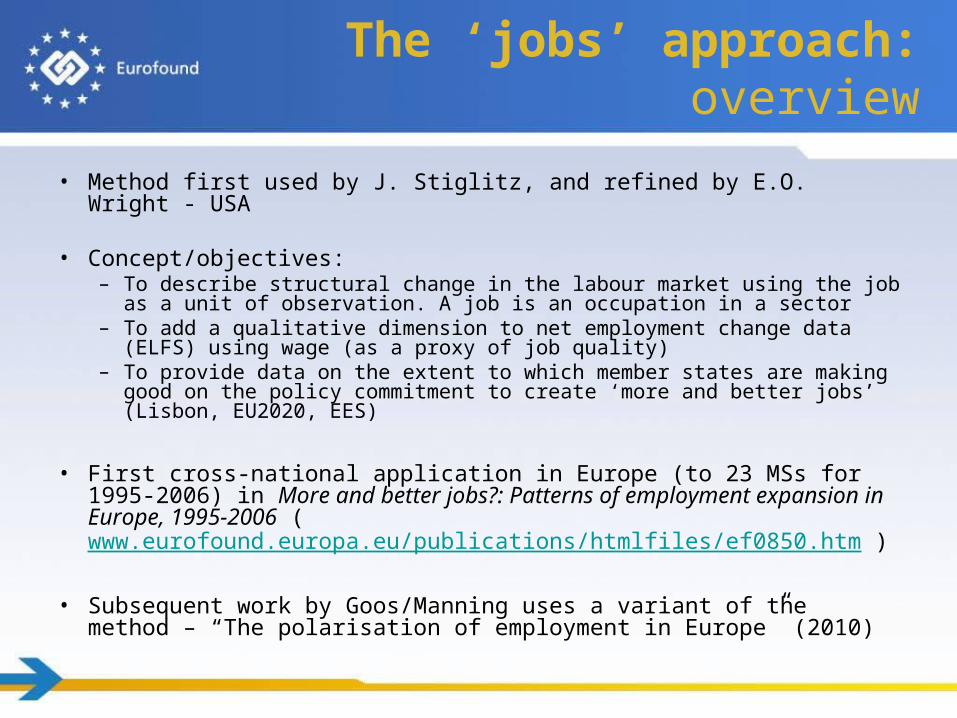
• Method first used by J. Stiglitz, and refined by E.O. Wright - USA
• Concept/objectives: – To describe structural change in the labour market using the job as a unit of
observation. A job is an occupation in a sector– To add a qualitative dimension to net employment change data (ELFS) using
wage (as a proxy of job quality)– To provide data on the extent to which member states are making good on
the policy commitment to create ‘more and better jobs’ (Lisbon, EU2020, EES)
• First cross-national application in Europe (to 23 MSs for 1995-2006) in More and better jobs?: Patterns of employment expansion in Europe, 1995-2006 (www.eurofound.europa.eu/publications/htmlfiles/ef0850.htm )
• Subsequent work by Goos/Manning uses a variant of the method – “The polarisation of employment in Europe” (2010)
The ‘jobs’ approach: overview
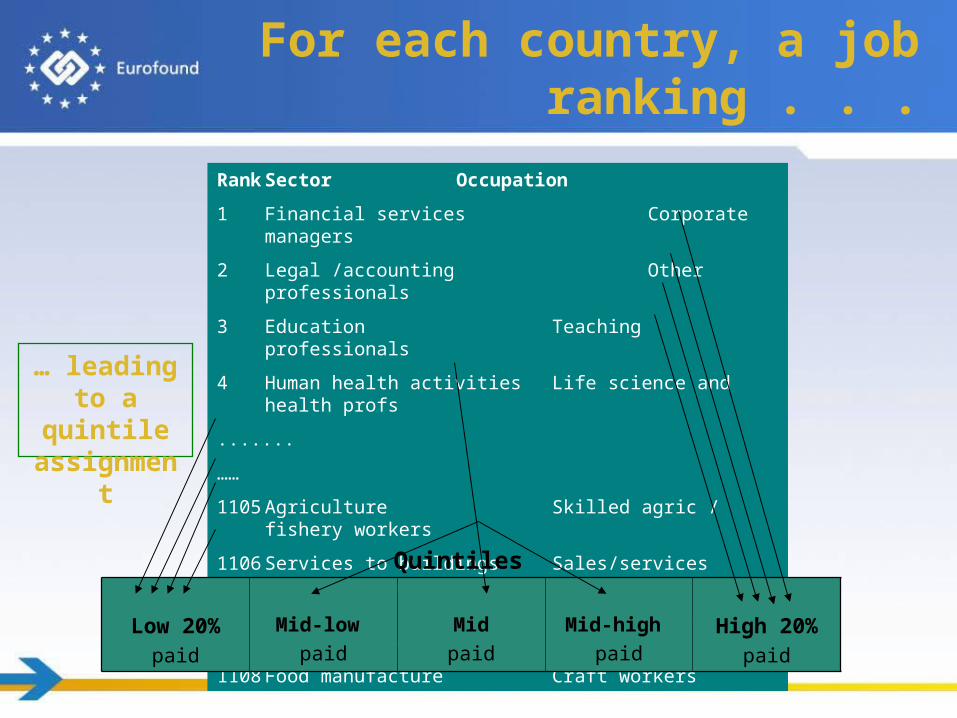
… leading to a quintile
assignment
Rank Sector Occupation
1 Financial services Corporate managers
2 Legal /accounting Other professionals
3 Education Teaching professionals
4 Human health activities Life science and health profs
.......
……
1105 Agriculture Skilled agric / fishery workers
1106 Services to buildings Sales/services elementary occups
1107 Education Sales/services elementary occups
1108 Food manufacture Craft workers
Low 20%paid
Mid-low paid
Midpaid
Mid-high paid
High 20%paid
Quintiles
For each country, a job ranking . . .
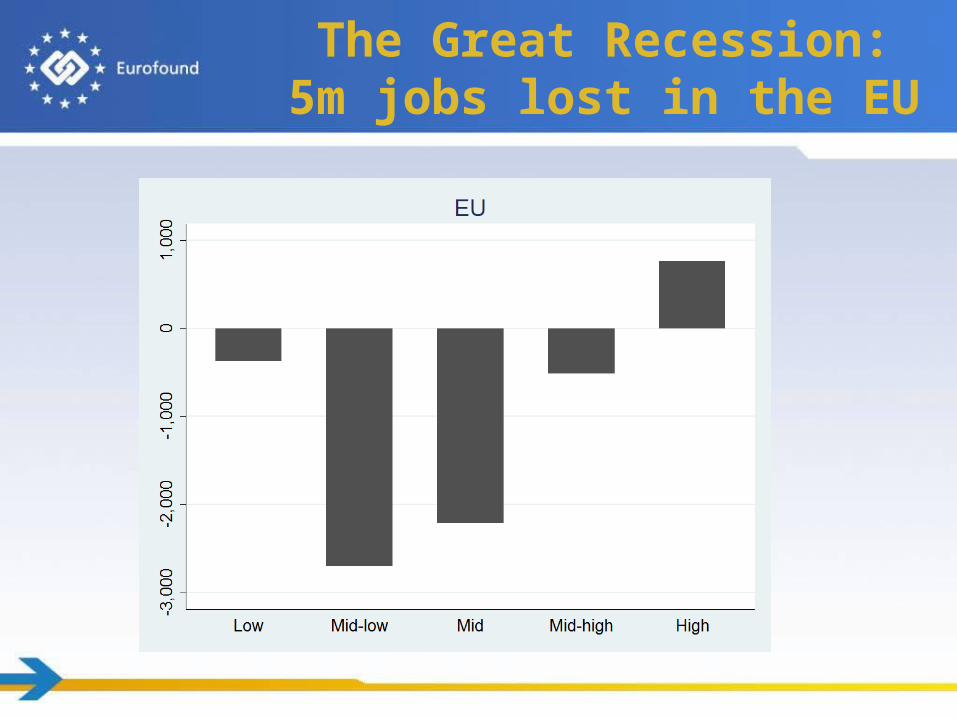
The Great Recession: 5m jobs lost in the EU

02
,00
04
,00
06
,00
08
,00
0
US, 1992-2000 (Wright/Dwyer)
02
,00
04
,00
06
,00
08
,00
0
EU(23), 1998-2007
Recent employment expansionsin EU and US (different periods)
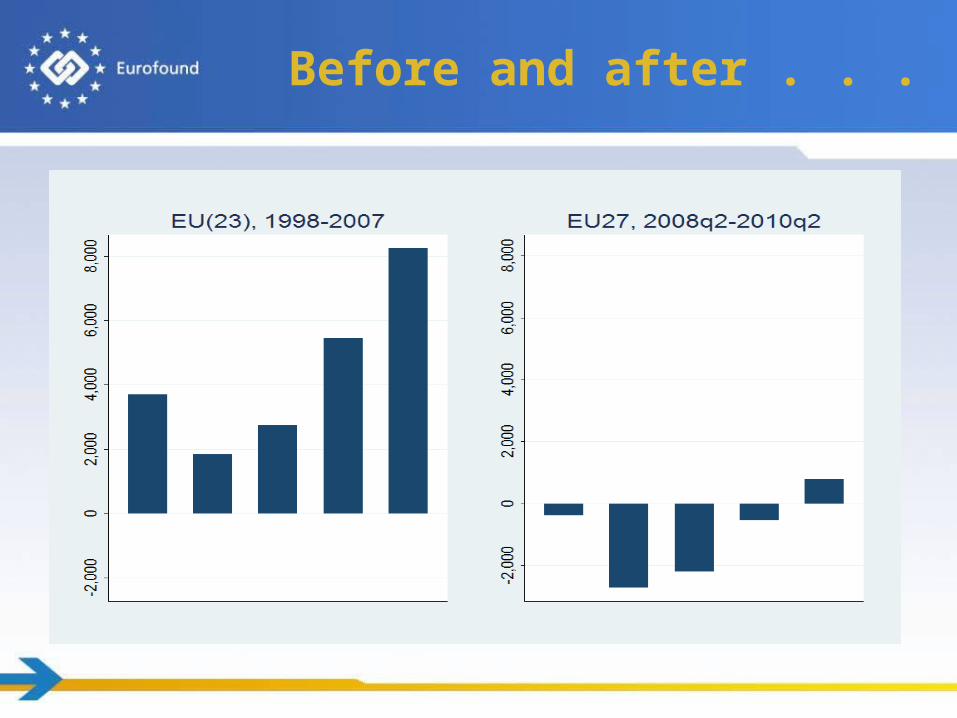
Before and after . . .

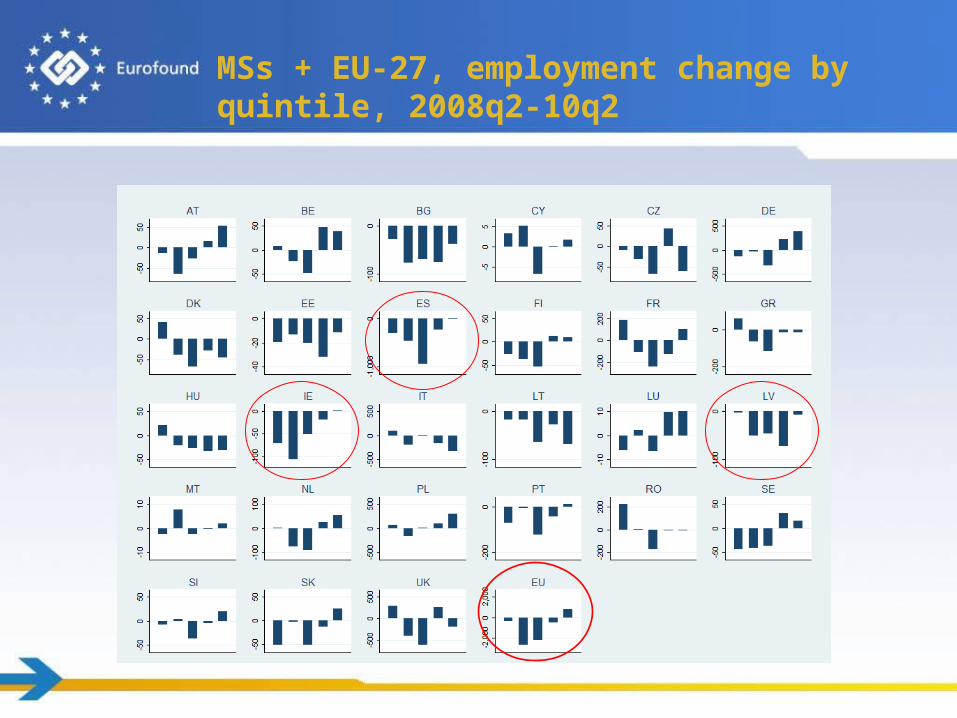
MSs + EU-27, employment change by quintile, 2008q2-10q2

MSs + EU-27, employment change by quintile, 2008q2-10q2
MSs + EU-27, employment change by quintile, 2008q2-10q2

MSs + EU-27, employment change by quintile, 2008q2-10q2

Polarisation Upgrading Downgrading
Variety of national patterns(2008-10)
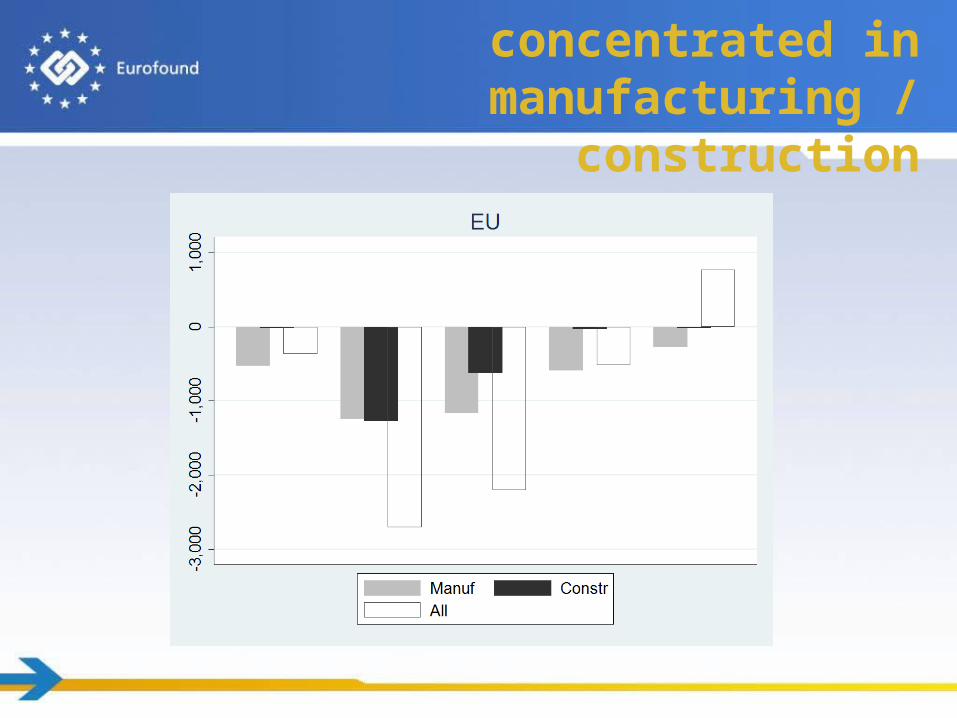
Sector: loss concentrated in manufacturing / construction

Services: where the growth is
* (L)KIS=(Less) Knowledge Intensive services

Gender: heavy male job losses, heavily polarised
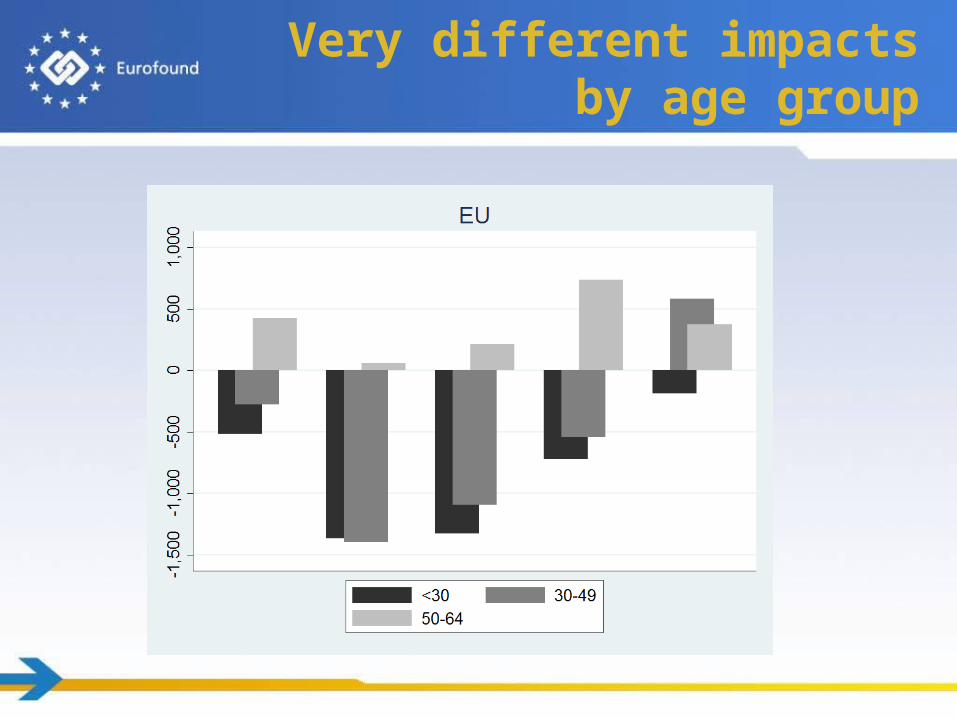
Very different impactsby age group

Foreign-born workers:Growth in low-paid employment
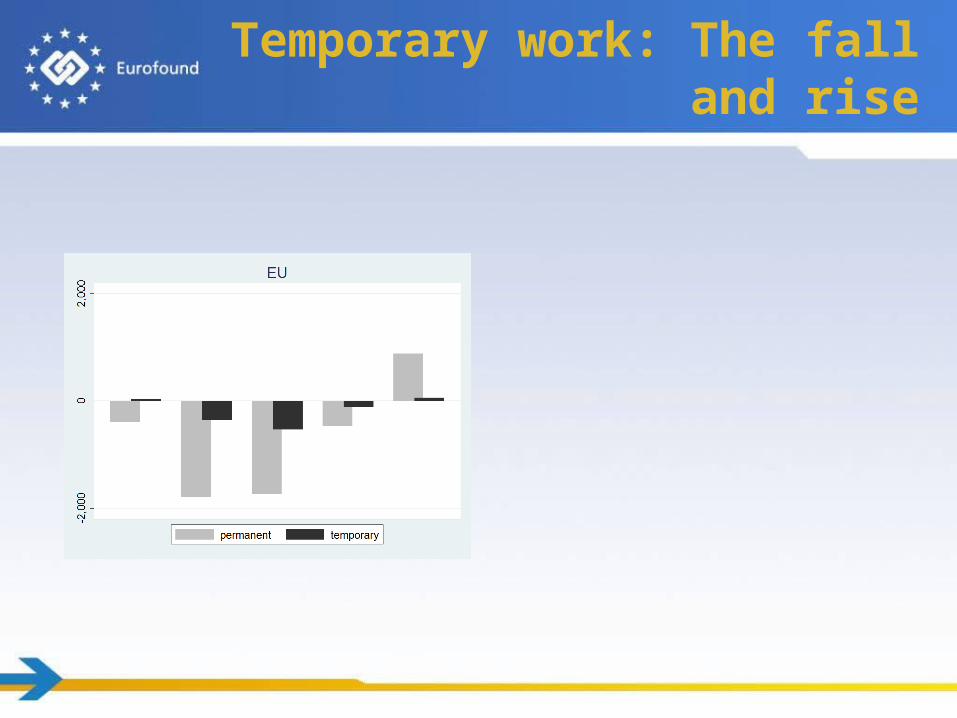
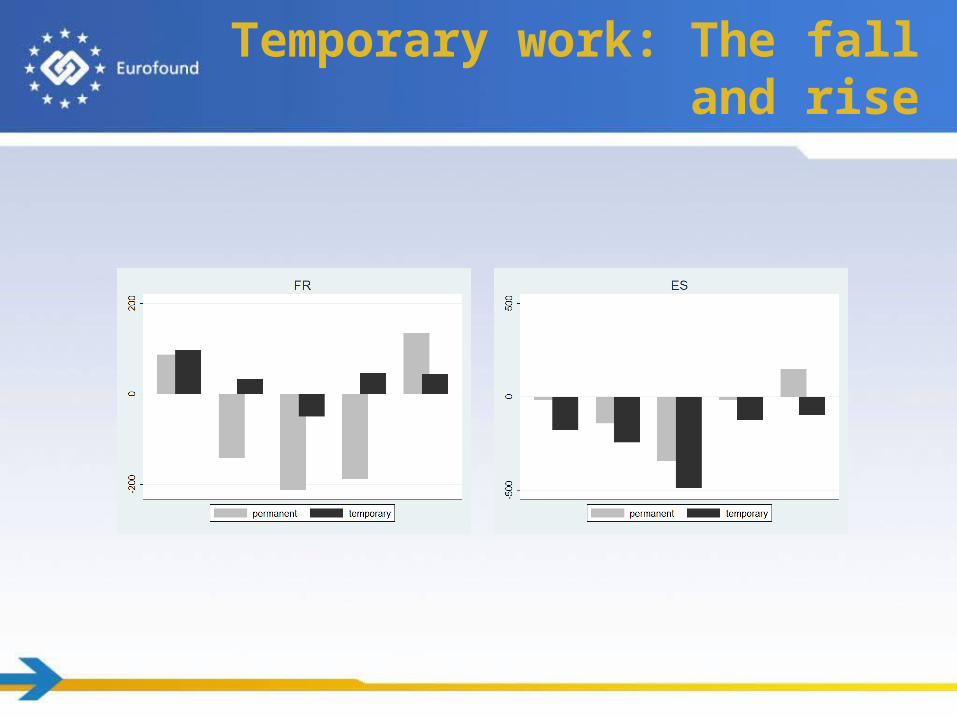
Temporary work: The fall and rise

Temporary work: The fall and rise

• Labour market impacts of recession varied very much between member states
• Resilience of growth in top-quintile jobs • Disappearing middle
– Polarisation – distributional inequality, ‘Blocs’ of good and bad jobs, – What do those who lose their jobs in medium-paying jobs do?– Occupational mobility
• Youth unemployment– ‘New skills for new jobs’?
• Destandardisation – Increasing part-time, temporary/fixed-term work (absent ES)
• Next 5 years?– The public sector
Conclusions and policy pointers

• Thank you for your attention

• Extra slides

White collar Blue collar Total
Sector/Occupation High skill
Low skill
High skill
Low skill
Primary sector -7.7 -2.6 -0.9 2.9 -0.8
Construction -3.6 -10.5 -11.2 -16.4 -10.7
Manufacturing -6.9 -7.8 -10.1 -14.0 -10.2
Retail -2.7 -3.4 -5.8 -6.3 -3.7
Other private services 1.6 -0.8 -2.0 -0.9 0.1
Public services and utilities 4.3 3.0 -3.7 -0.6 3.2
Total 0.7 -1.1 -7.3 -6.1 -2.5
EU-27 employment shifts by occupation/sector, 2008q2-2010q2

Services, esp public sector: where the growth was
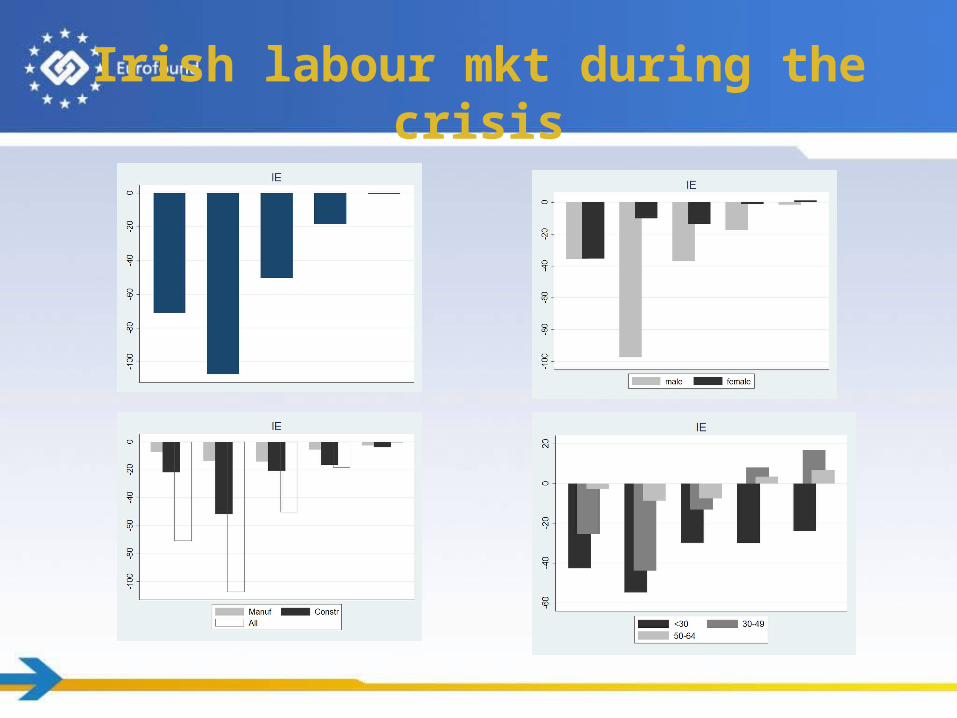
Irish labour mkt during the crisis
Temporary work: The fall and rise

Part-time work:Increasing across the board

From upgrading with some polarisation
(1998-2007) to
polarisation with some upgrading (2008-2010)
more “hollowing out” than growth in the tails
In summary
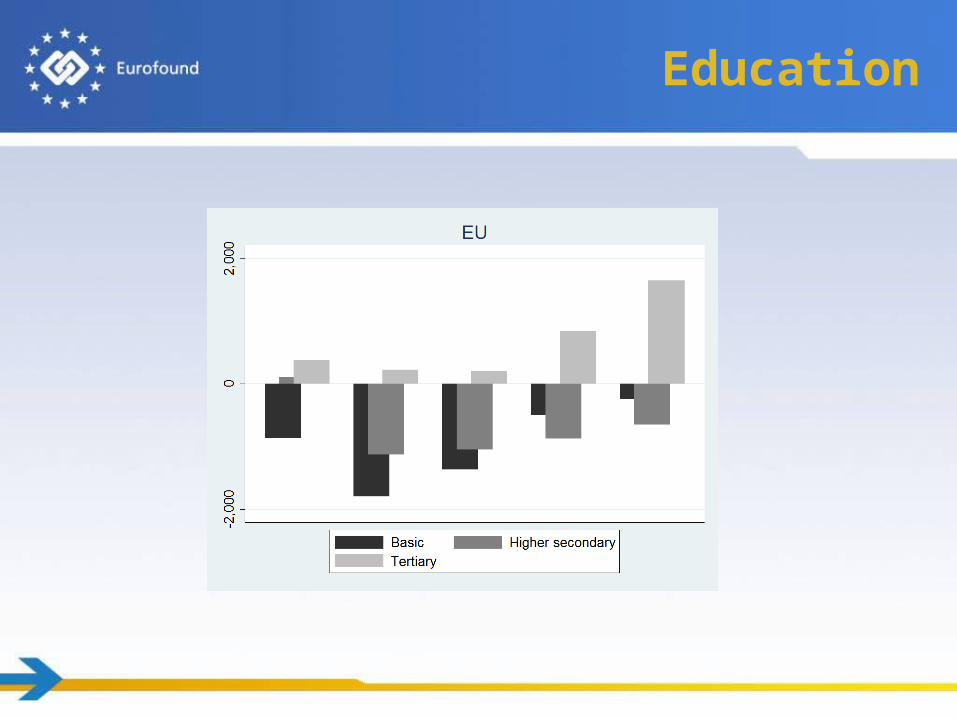
Education

Comparing job-wage and job-skill rankings (% per annum employment change by quintile, EU27)

Manufacturing:a German exception

AGE

Job-wage rankings
• Source: ELFS 2008 annual data• Mean net wage per hour per employee in job• Data not available for all countries, yet. Our solution:
– To enquire with MSs for missing countries positive response from Denmark
– Generate a common EU ranking (based on 13 MS inc UK, IT, FR and PL) and apply to countries where we have no data. Second-best but practical. High level of correlation of job-wage ranks between countries.
• Eurostat wage data - coverage and quality - will improve.

Irish labour mkt during the crisis

• Breaks in data 2007 – transition to NACE (sector) rev 2.0 • 3 yrs of ELFS data with the new sector classification. • Wage data in the ELFS available for 14 countries
(ELFS annual 2008).• First application of ‘jobs approach’ using NACE rev 2 sector
data with up-to-date data. • We start today with analysis of change in structure of jobs
between 2008Q2 & 2010Q2.
But first how to rank jobs & present results in quintiles
European Jobs Monitor 2011

Gender, age and emp status
• Gender: “a very male recession” – not only quantitatively • Age:
- old gained in all quintiles esp. at the top- young lose in all quintiles esp. towards the bottom
• Part-time- net gains equally shared between sexes- male in lower quintiles, women in higher
• Temporary work- Steep losses 08-09, rapid growth 09-10- shift to lower quintiles