THE GROWTH OF RENEWABLE ENERGY IN CALIFORNIA IRED … · THE GROWTH OF RENEWABLE ENERGY IN...
42
1 THE GROWTH OF RENEWABLE ENERGY IN CALIFORNIA IRED 2014 David Hochschild California Energy Commission
Transcript of THE GROWTH OF RENEWABLE ENERGY IN CALIFORNIA IRED … · THE GROWTH OF RENEWABLE ENERGY IN...

1
THE GROWTH OF RENEWABLE ENERGY IN
CALIFORNIA
IRED 2014
David Hochschild California Energy Commission

The Challenge is Big...
2
The 2020 Goal: 33% Renewables
& 12 GW of Clean
Distributed Generation
& 1 million Electric
Vehicles
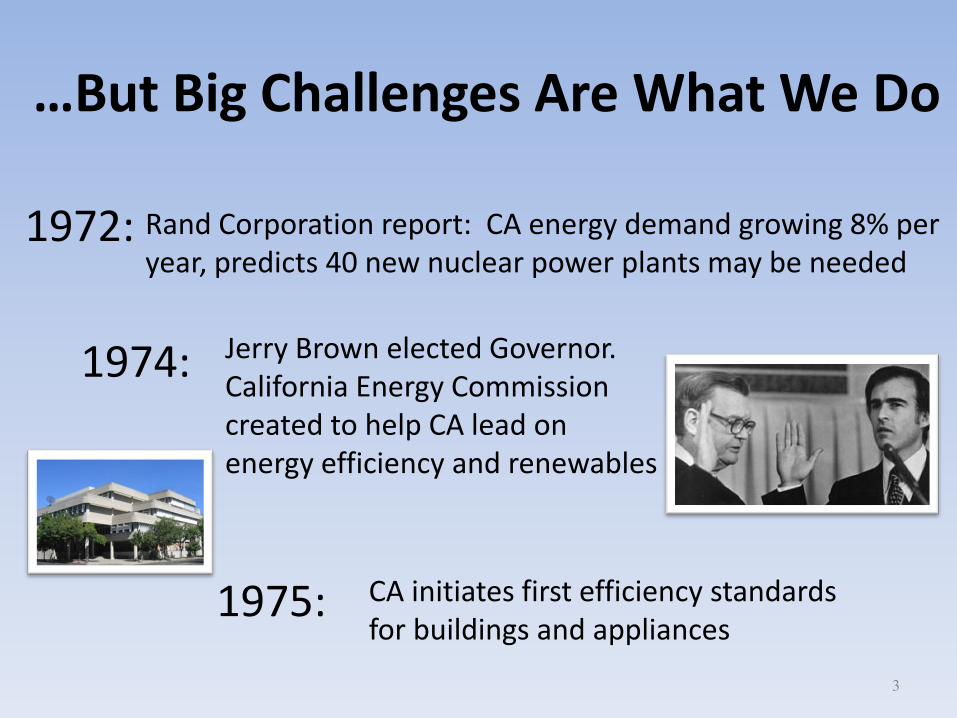
…But Big Challenges Are What We Do
3
1972:
1974:
1975:
Rand Corporation report: CA energy demand growing 8% per year, predicts 40 new nuclear power plants may be needed
CA initiates first efficiency standards for buildings and appliances
Jerry Brown elected Governor. California Energy Commission created to help CA lead on energy efficiency and renewables
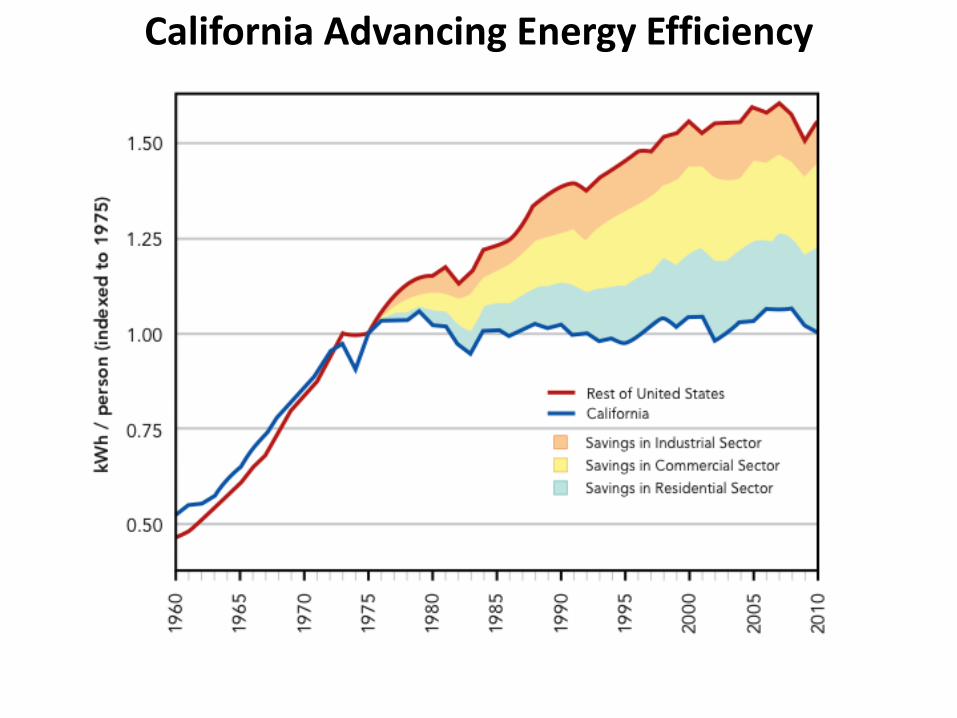
California Advancing Energy Efficiency


2009: The Energy Commission’s TV efficiency standards take effect, saving Californians
$1 billion/year…
6
2012: The plug-in charger efficiency standard begins,
saves Californians $300 M/year

The Loading Order: California’s Energy Priorities
1. Energy Efficiency and Demand Response
2. Renewable and Distributed Energy Generation
3. Clean Fossil-Fueled Generation (Natural Gas)
7

2013 2020
Governor Brown Increases CA RPS. “33% is a floor not a ceiling”

9
The World’s Largest Solar Thermal Power Plant (Tower)
Ivanpah Solar Thermal Project 393 MW San Bernardino County, CA

Desert Sunlight Solar Project 550 MW Riverside County, CA
10
The World’s Largest Thin Film Solar PV Project…

The World’s Largest Wind Project
11
Alta Wind Energy Center 1550 MW Kern County, CA

The World’s Largest Silicon PV Project
Solar Star Project 579 MW Kern County, CA
12

13
Geysers Geothermal Power Plant 955 MW Lake County, CA
The World’s Largest Geothermal Power Plant
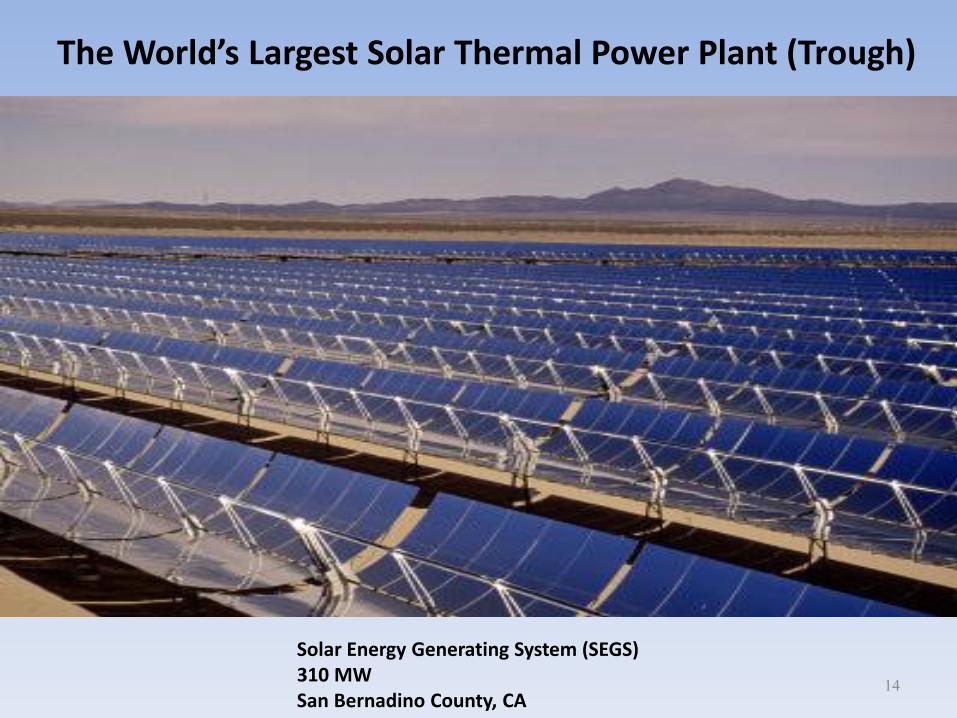
The World’s Largest Solar Thermal Power Plant (Trough)
14
Solar Energy Generating System (SEGS) 310 MW San Bernadino County, CA

The World’s Largest Iron-Chromium Flow Battery
15
EnerVault Iron-Chromium Technology 1 MW-hr capacity at 250 kW (4 hour duration) Turlock, CA

Largest Manufacturing Plant in CA is Now Electric Vehicles
16
Over 6000 workers now
at Tesla
Tesla Factory Fremont, CA
MORE THAN 100,000 EV’s AND PLUG-IN VEHICLES
IN CALIFORNIA TODAY
17
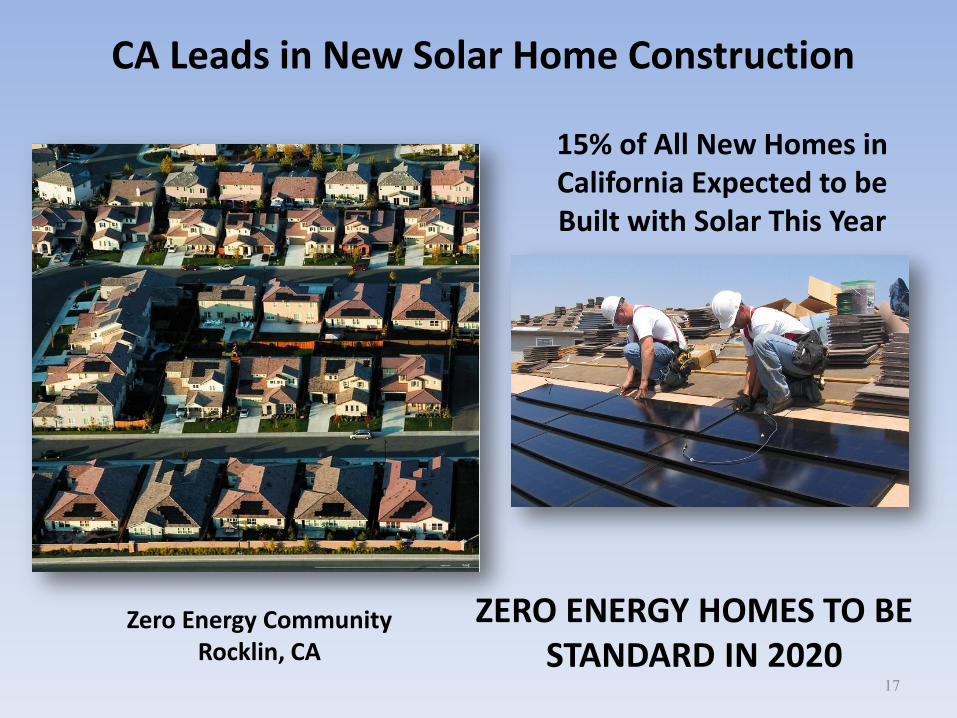
CA Leads in New Solar Home Construction
Zero Energy Community Rocklin, CA
15% of All New Homes in California Expected to be Built with Solar This Year
ZERO ENERGY HOMES TO BE STANDARD IN 2020

65,000
26,000 24,000
15,000
9,600 6,400
4,200
0
10,000
20,000
30,000
40,000
50,000
60,000
70,000
U.S. California China Japan Norway France Germany
Electric Vehicle Sales (2014 January – July)
18 Source: EV Obsession (http://evobsession.com/), 2014 Alan Baum, Baum & Associates, 2014

Solar Expected to be half of all Renewable Energy in California by 2020
Source: CPUC RPS Report
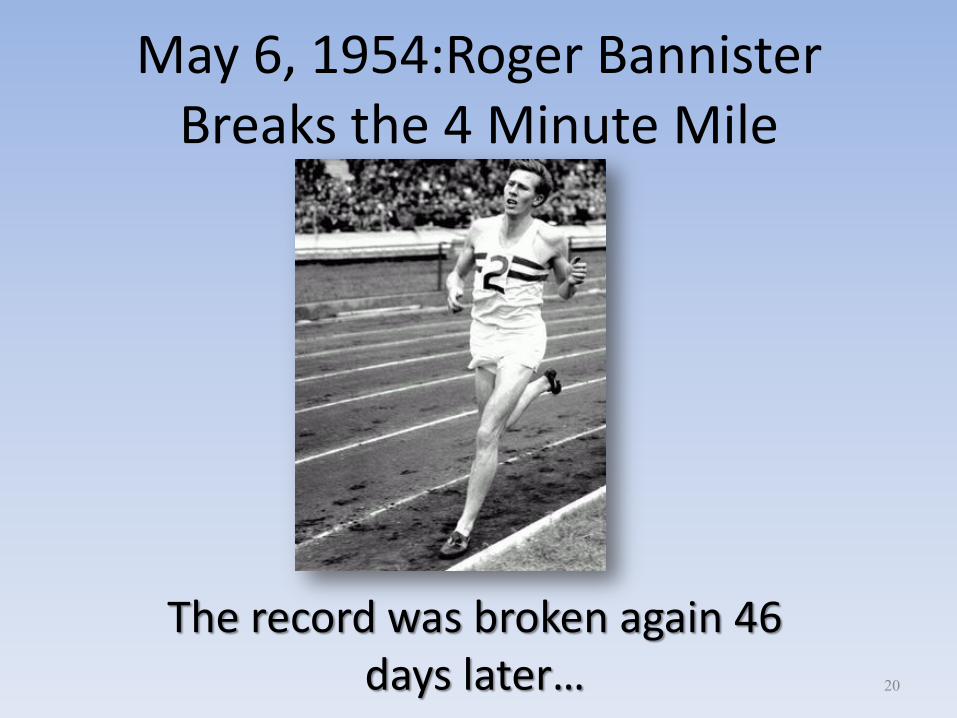
May 6, 1954:Roger Bannister Breaks the 4 Minute Mile
20
The record was broken again 46 days later…
21
0.60
6.00
60.00
1 10 100 1000 10000 100000
Pri
ce (
20
10
$/W
)
Cumulative Production (MW)
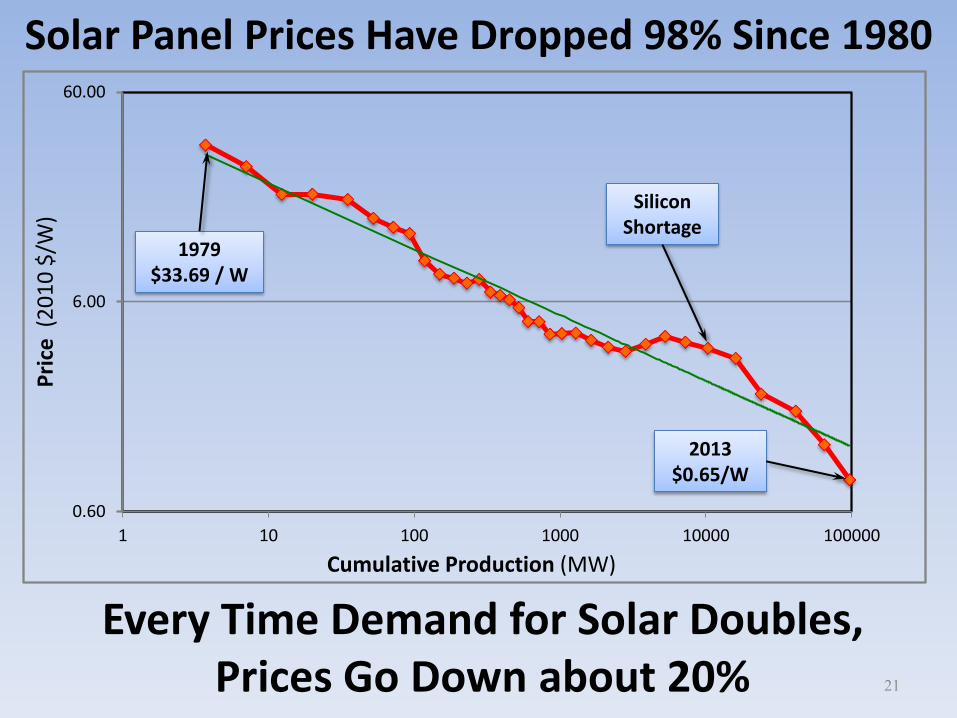
Solar Panel Prices Have Dropped 98% Since 1980
Every Time Demand for Solar Doubles, Prices Go Down about 20%
Silicon Shortage
2013 $0.65/W
1979 $33.69 / W
0
1
2
3
4
5
6
7
2000Predicted
2000 20140
1
2
3
4
5
6
7
2000Predicted
2000 2014
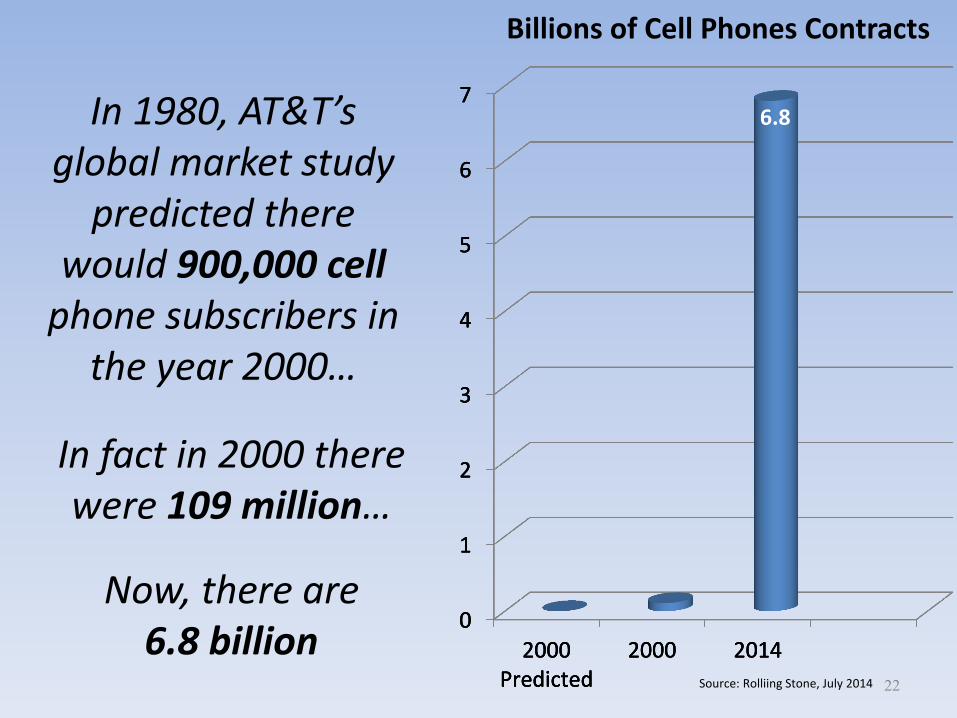
Billions of Cell Phones Contracts
22
In 1980, AT&T’s global market study
predicted there would 900,000 cell
phone subscribers in the year 2000…
0
1
2
3
4
5
6
7
2000Predicted
2000 2014
6.8
In fact in 2000 there were 109 million…
Now, there are 6.8 billion
Source: Rolliing Stone, July 2014

Global Solar Market to
Grow to 52 GW in 2014
0
10
20
30
40
50
60
2004 2014
1 GW
23
52 GW
Global PV Market
Source: Bloomberg New Energy Finance
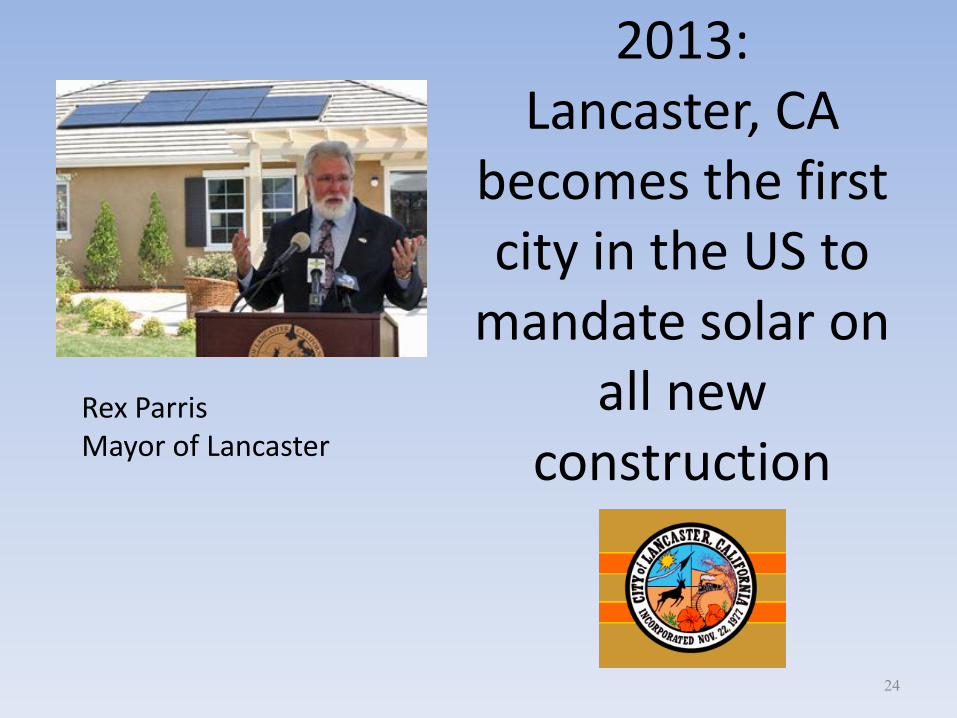
2013: Lancaster, CA
becomes the first city in the US to
mandate solar on all new
construction
24
Rex Parris Mayor of Lancaster

25
US State Solar Market Share
Source: SPV Research
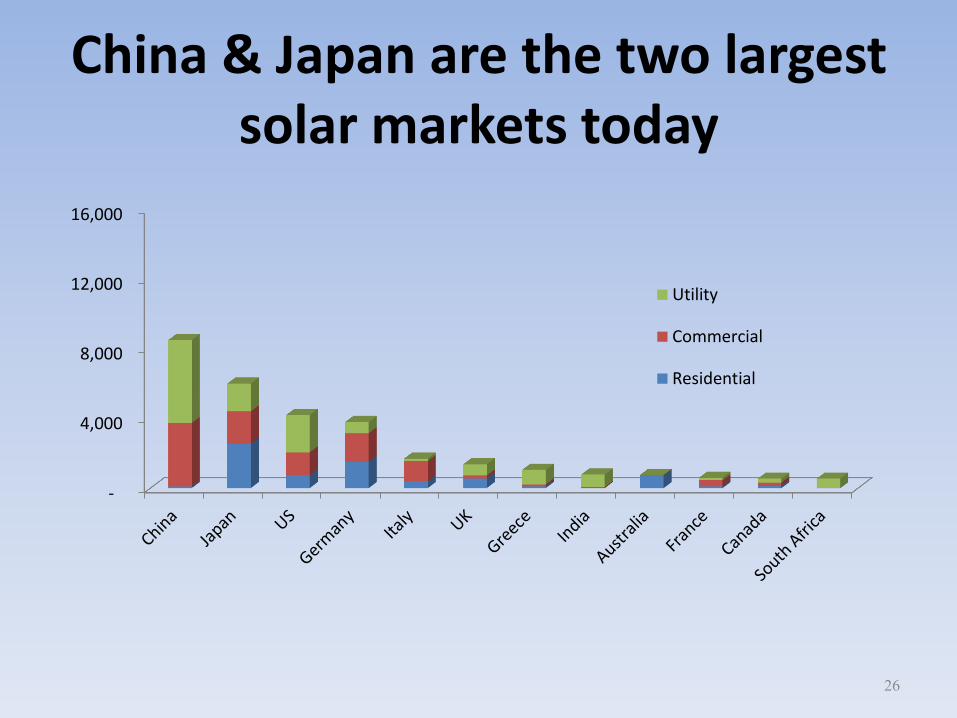
China & Japan are the two largest solar markets today
26
-
4,000
8,000
12,000
16,000
Utility
Commercial
Residential
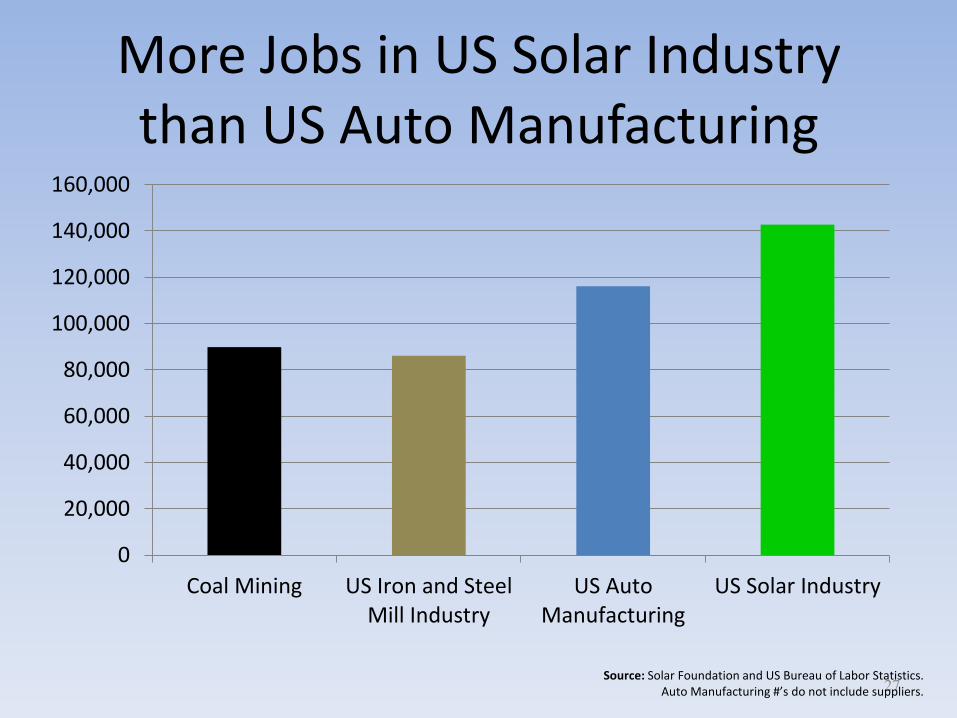
More Jobs in US Solar Industry than US Auto Manufacturing
0
20,000
40,000
60,000
80,000
100,000
120,000
140,000
160,000
Coal Mining US Iron and SteelMill Industry
US AutoManufacturing
US Solar Industry
27 Source: Solar Foundation and US Bureau of Labor Statistics.
Auto Manufacturing #’s do not include suppliers.

More Jobs in US Solar Industry than US Auto Manufacturing
0
20,000
40,000
60,000
80,000
100,000
120,000
140,000
160,000
Coal Mining US Iron and SteelMill Industry
US AutoManufacturing
US Solar Industry
89,838 86,122
116,100
142,698
28 Source: Solar Foundation and US Bureau of Labor Statistics.
Auto Manufacturing #’s do not include suppliers.

3 YEAR JOB GROWTH RATES
-10
0
10
20
30
40
50
60
Coal Mining US Iron and SteelMill Industry
US AutoManufacturing
US Solar Industry
- 3%
4%
21%
53%
29 Source: Solar Foundation and US Bureau of Labor Statistics.
Auto Manufacturing #’s do not include suppliers.

30
The Latest Solar Customer: Solar Panels on the White House Roof

California Residential Electric Bills Are 20% Below the National Average
31

32
Learning from the German Experience
2020 2030 2040 2050
Germany Went from 200 generators to over 2 million…
California has gone from 200 generators to over 300,000…

Over 30 US military bases in CA Representing approximately $130B annually to the California Economy
33 Source: California Energy Commission, 2014 Geographic Information Systems Data
Navy: 50% renewables by 2020 Marines: zero fossil
fuels on bases by 2025
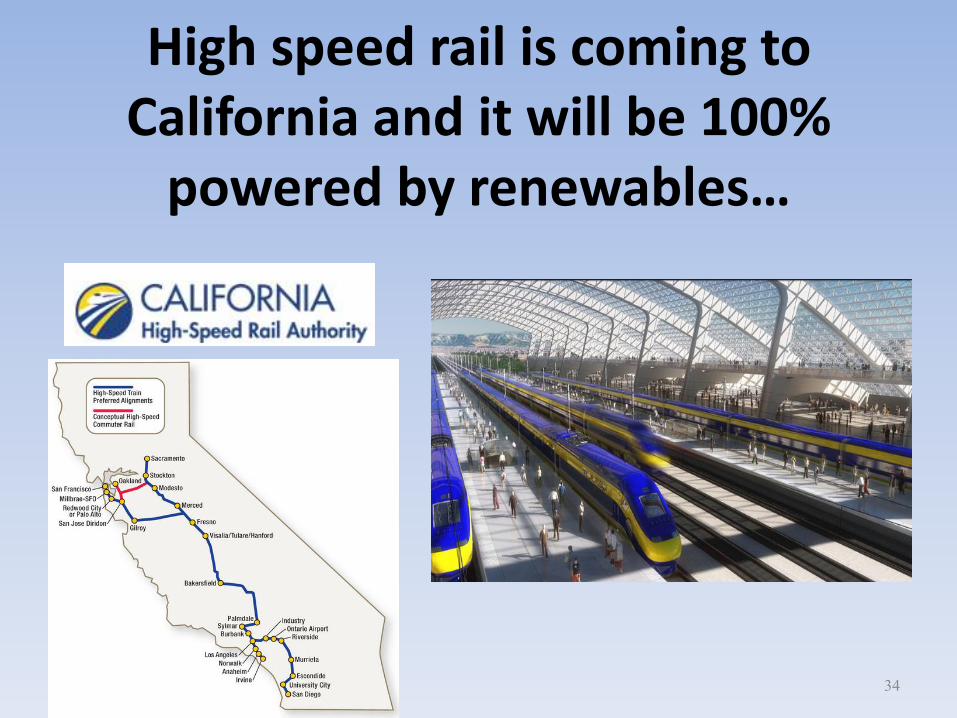
High speed rail is coming to California and it will be 100%
powered by renewables…
34

Getting Smarter About Energy Savings
35

R&D FUNDING PRIORITIES FOR RENEWABLE INTEGRATION
36
Validate New Storage Such as new efficient
batteries for renewables
Demonstrate Microgrids Use advanced technologies to integrate solar, fuel cells etc.
Improved Forecasting to advance our ability to predict
solar and wind energy
Vehicle to Grid Integration to connect EV’s to the grid
for energy storage and demand response
Smart Inverters including programmable
functionalities to better support grid reliability with high penetration of
renewables

WHAT IS THE ROLE OF THE UTILITIES?
They must be agents of change rather than victims of change
37

Source: Climate Central 38
Transitioning to Renewable Energy Reduces Water Consumption, Which is
Now a Priority in California

Smoking in the US
39

0
10
20
30
40
50
60
70
1960 1965 1970 1975 1980 1985 1990 1995 2000 2005 2010 2015 2020Source: Centers for Disease Control and Prevention (CDC), 2014
http://www.cdc.gov/tobacco/data_statistics/tables/trends/cig_smoking/index.htm
1965: Health warnings required on packaging
1983: Cigarette tax doubles
1988: U.S. Bans Smoking on Airplanes
2013: Smoking Rate Falls to 18%
1970: Advertisements banned from TV
1998: CA Bans Smoking in Bars
2014: CVS Stops cigarette sales at 7,600
retail pharmacies
1992: U.S. Bans Sale to Minors
% of Americans Who Smoke
41
“The Stone Age came to an end not for a lack of stones and the oil age will end, but not for a lack of oil.”
- Sheik Ahmed Zaki Yamani, former Saudi Oil Minister
42
Thank you