California Renewable Energy resource potential and Cost update
Upload
truongthuyCategory
view
216download
4
RESEARCH RESULTS FORUM FOR RENEWABLE ENERGY
TECHNOLOGY AND RESOURCE ASSESSMENTS
Public Workshop at the California Energy Commission (CEC)
September 3, 2014
California Renewable Energy Center

California Renewable Energy Center
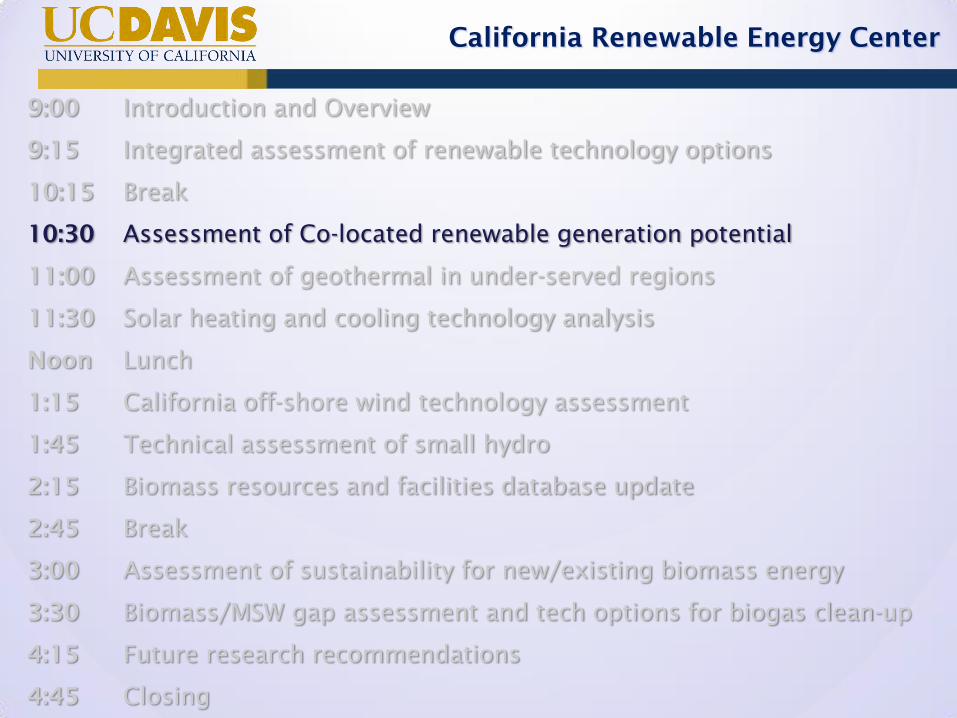
9:00 Introduction and Overview
9:15 Integrated assessment of renewable technology options
10:15 Break
10:30 Assessment of Co-located renewable generation potential
11:00 Assessment of geothermal in under-served regions
11:30 Solar heating and cooling technology analysis
Noon Lunch
1:15 California off-shore wind technology assessment
1:45 Technical assessment of small hydro
2:15 Biomass resources and facilities database update
2:45 Break
3:00 Assessment of sustainability for new/existing biomass energy
3:30 Biomass/MSW gap assessment and tech options for biogas clean-up
4:15 Future research recommendations
4:45 Closing

California Renewable Energy Center
Introduction
and
Overview
California Renewable Energy Center
• Funded since 2002 through the Energy Commission’s Public Interest
Energy Research (PIER) program.
• Currently funded through multi-year contract from the Energy
Commission.
• Integrated multi-sector research center focused on the development of
a sustainable energy future in California. The CREC is comprised of
five renewable collaboratives: (a) Geothermal, (b) Biomass, (c) Small
Hydro, (d) Wind, and (e) Solar.
California Renewable Energy
Center (CREC)

California Renewable Energy Center
Scope of Work
To help meet California’s aggressive goals set forth via AB 32
and the RPS, the Energy Commission retained the California
Renewable Energy Center to:
(1) Update/refine existing renewable resource and technology
assessments and databases.
(2) Provide renewable energy assessments that are integrated,
comparative, and multi-dimensional.
(3) Address complex issues of renewable energy development and
integration data needs.
(4) Conduct data-driven and science-based analyses to answer
emerging renewable energy technology and economic
questions.
(5) Support sate level policy making and achievement of California
renewable energy goals.

California Renewable Energy Center
9:00 Introduction and Overview
9:15 Integrated assessment of renewable technology options
10:15 Break
10:30 Assessment of Co-located renewable generation potential
11:00 Assessment of geothermal in under-served regions
11:30 Solar heating and cooling technology analysis
Noon Lunch
1:15 California off-shore wind technology assessment
1:45 Technical assessment of small hydro
2:15 Biomass resources and facilities database update
2:45 Break
3:00 Assessment of sustainability for new/existing biomass energy
3:30 Biomass/MSW gap assessment and tech options for biogas clean-up
4:15 Future research recommendations
4:45 Closing
California Renewable Energy Center
Integrated Assessment
of Renewable Energy
Technology Options

California Renewable Energy Center
California has a long history of aggressively
pursuing renewable energy – early adoption of RPS
and greenhouse gas reductions (AB32).
It is now clear that many instances exist in which
different renewable resources are co-located. How
best to take advantage of this opportunity?
PURPOSE: Undertake an integrated assessment of
the current state of development of each renewable
technology (Task 5) and identify opportunities for
coordinated development (Tasks 2 and 5).

California Renewable Energy Center
APPROACH:
1. Determine current in-state technology capability,
vis-à-vis state-of-the-art (Task 5)
2. Identify representative regions for resource
assessments (Tasks 2 & 5)
3. Quantify resource base, and evaluate benefits and
impacts of resource development (Tasks 2 & 5)
Because of California’s diverse resource base and
geographic characteristics, a two-part analysis was
conducted.

California Renewable Energy Center
Los Angeles Basin
(Task 2)
Alturas/SurpriseValley/Canby Region
ImperialValley Region
Geyserville/MiddletownRegion
Fresno/Kern CountyRegion
Miles
0 50 100 150 200
Statewide sites
(Task 5)

California Renewable Energy Center
Organization of this session:
• Overview of solar, wind, geothermal and
biomass technologies (Task 5).
• Assessment of four statewide sites (Task 5).
• Discussion of the Los Angeles Basin results
later (Task 2).

California Renewable Energy Center
California Wind
Energy Collaborative
Henry Shiu
Case van Dam

California Renewable Energy Center
13
Wind Power: Industry Status
• End of 2013
– Global: 318 GW
– U.S.: 61 GW
– California: 5,829 MW
• State with 2nd
most
wind capacity
• Most growth in
2013
• U.S. slow down in
2013
– 2012: +13.13 GW
– 2013: +269 MW
– Driven by policy
uncertainty – PTC
volatility
– 114.1 GW in queue
Source: LBL/DOE, GWEC

California Renewable Energy Center
14
Source: Vestas
Wind: Technology State of the Art
• 3 blade, horizontal access,
upwind rotor
• Blade pitch for power
regulation
• 1.5 – 6 MW
• 80 – 150+ m diameter
• Predominantly geared
drivetrains, some direct
drive
• DFIG or full conversion
generators (AC-DC-AC) for
partial or full variable speed
• Advanced power electronics
provide grid support:
voltage support, LVRT, ZVRT
• Steel tubular towers
• Fiberglass blades, some
carbon fiber

California Renewable Energy Center
15
Wind: Economics – 2013 Price of Energy

California Renewable Energy Center
16
Distributed Wind
• On-site or installed within
distribution networks
– Includes localized energy
resources as defined by
Governor Brown’s Clean Energy
Jobs Plan
• Small and utility-scale turbines
• End of 2013: ~65 MW in > 100
kW turbines, ~ 10 MW in ≤ 100
kW turbines
• New financing options such as
PPAs have boosted the market
• Utility-scale turbines have
sophisticated power
electronics, but distributed
interconnection requirements
are limited
Source: “2013 Distributed Wind Market Report”, DOE

California Renewable Energy Center
17
Wind: Emerging Technologies – Bigger Rotors
• Wind turbine rotors
are getting larger
• Example:
– ca. 2002: GE 1.5 – 65m,
70.m, 77m
• 452 W/m2
– Now: GE 1.6 – 100m
• 204 W/m2
• Intended for lower
wind speeds (IEC Class
III)
• Widely deployed in
higher wind sites,
presumably at lower
turbulence sites
Source: LBL/DOE
• Long term impact on fatigue
life?

California Renewable Energy Center
18
Wind: Emerging Technologies –
Advanced Towers, Turbine-Level Energy Storage
• Advanced towers
– Hybrid steel-concrete
– Spaceframes
– Resolves transportation
constraints, improves
access to complex terrain
• Manufacturer-
integrated, turbine-level
energy storage
– Marketed as lower-cost
option to plant-level
storage
Source: Bastgen
- Ramp control, power
smoothing, frequency regulation

California Renewable Energy Center
19
Wind: Emerging Technologies –
Advanced Aerodynamics
• Active flow control
– Devices/systems on
blades such as
flaps/ailerons, microtabs,
morphing trailing edges,
blowing/suction
• Passive innovations
– Blunt trailing edge
airfoils (flatbacks)
– Aeroelastic tailoring
• Sweep-twist, bend-twist
blades
Source: Siemens

California Renewable Energy Center
20
Wind: Integration Thoughts
• Small footprint
• Variable generation with
uncertainty
– Strong seasonal pattern
– Strong diurnal pattern
• High penetration into grid
– Short-term forecasting
– Grid-level strategies
• Coordinating with
neighboring balancing
authorities
• Maintaining flexible
generation portfolio
– Next steps: curtailment,
energy storage
• High penetration in
distribution networks
– Unlikely to occur in
residential and urban
environments
– More likely in rural and
industrial areas, but no
significant concentrations
in California yet
– Power electronics compliant
with grid codes, but
distribution interconnection
requirements may be less
restrictive

California Renewable Energy Center
21
Wind: Preliminary Resource Assessment
California Wind Maps
• Developed by AWS
Truepower for CEC
• Computational model
calibrated with field data
from selected sites
• Mean annual wind speed at
30, 50, 70, 100 m heights at
200 m spatial resolution
• Wind speed and direction
distribution, mean seasonal
and monthly wind speeds,
shear

California Renewable Energy Center
22
Wind Development Potential: CA IAP
• Part of IAP, studying
benefits/impacts of RPS build-
out scenarios (20%, 33%
penetration)
• Performed by AWS Truepower
• Identified 11 regions with > 10
GW of new potential wind
capacity
– Warner, Montezuma, Solano,
Altamont, Sequoia, Tehachapi,
Western & Eastern Mojave, San
Gorgonio, Jacumba, Yuma
• Factored in exclusion zones
(e.g., environmental sensitivity,
terrain, cost for transmission
and interconnection)

California Renewable Energy Center
23
Wind Development Potential: RETI
• Transmission planning
study to support
renewables growth
• CREZ’s – renewables
grouped by proximity,
development
timeframe,
transmission
constraints, economic
benefits
• Exclusion filters applied
• Phase 1B (2009): 134
wind projects, 16,465
MW capacity

California Renewable Energy Center
California Geothermal
Energy Collaborative
William Glassley
Elise Brown

California Renewable Energy Center
Geothermal Overview
• Current state-of-the-art lags behind international efforts due
to more favorable investment environment in other states
and nations.
• Rebound of technology development is occurring due to
improved economic outlooks in California
Source: GEA
2732.2
517.5
38.0 48.1 15.8 0.7 33.3 0.3 -
500
1,000
1,500
2,000
2,500
3,000
CA NV HI UT ID AK OR WY
Inst
all
ed
Ca
pa
cit
y (
MW
)
Dry Steam Flash Binary
California remains the
national leader in
geothermal generation
and, with applications
currently in process (33
for 1,000 MW), will
remain so for years.

California Renewable Energy Center
Barriers to Geothermal Development:
• A renewable procurement process that does not
recognize ancillary benefits (e.g. voltage support)
• Investment risk for resource characterization
• A renewable procurement process that penalizes
baseload renewable technologies
• Inadequate resource characterization (3,100 or
24,000 MW?)
• Initial costs hamper local development
• Perceived as baseload only resource, but can
provide flexible capacity

California Renewable Energy Center
Research needs for geothermal:
Resource Assessment
• Higher resolution geophysical and geochemical methods to
characterize and localize resources
• Integrated approaches for resource assessments
• Optimization tools to match diverse resource types with
potential applications
Technology
• More efficient use of water (heat transfer and cooling
technologies)
• More efficient resource extraction
• Detailed cost, ramp rate, market studies of flexible
geothermal (putting the duck on a diet)
California Renewable Energy Center
California Solar
Energy Collaborative
Pieter Stroeve
Ruxandra Vidu
Jan Kleissl (UCSD)
Masoud Rahman
California Renewable Energy Center
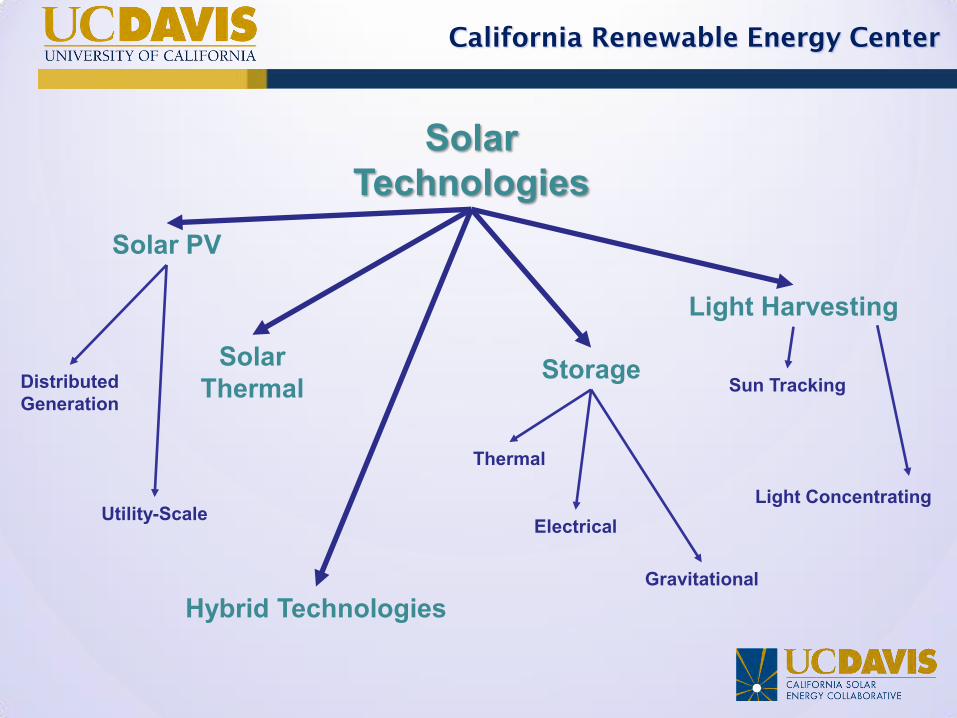
Solar Technologies
Solar PV
Solar Thermal
Storage Distributed Generation
Utility-Scale
Light Harvesting
Sun Tracking
Light Concentrating
Thermal
Electrical
Gravitational
Hybrid Technologies

California Renewable Energy Center
Technology Review: Solar Thermal
Technology Advantages Challenges and barriers
CST-Tower
(TRL 07)
1) Reaching high Temperatures,
2) Storage at high temperatures,
1) Technology is new and not completely mature, 2) It is not modular, 3) Requires high initial investment 4) annual performance, operating cost, initial investment need to be proven in large scale commercial operation 5) Two-axis tracking system is required, 6) Environmental issue of migratory birds 7) Thermal storage requires more research and development on the material storing the heat, storage tank, high temperature corrosion, etc to increase its TRL and decrease its LCOE role.
CST-Trough
(TRL 09)
1) Technology is mature, 2) Commercially proven annual net plant efficiency of around 14%, 3) Modularity, 4) Best land use factor, 5) Lowest material demand
1) Use of oil-based heat transfer media limits the operating temperature, 2) One-axis tracking is required 3) Plumbing and transfer of HTL to every unit requires energy and results in heat loss, 4) The price of the technology cannot compete with PV
CST-Dish
(TRL 05)
1) Very high conversion efficiencies –peak solar to net electric conversion over 30%, 2) Modularity
1) annual performance, operating cost, initial investment need to be proven in large scale commercial operation, 2) Low TRL level , 3) no operational unit available, 4) Require 2-axid tracking
CST-Fresnel
(TRL 06)
1) Less expensive production and installation of Fresnel mirrors
1) require one-axis sun tracking for each mirror
2) Technology for large-scale is not available
CST-Trough hybrid PV-Thermal
(TRL 07)
1) Concurrent production of electricity and heat
1) The thermal energy from capturing excess heat from PV panels is small compared to other CST technologies and is not suitable for steam generation.
Solar Chimney Power Plant (TRL 06)
1) Simple power generation mechanism
1) High initial investment and capital cost
2) Large land requirement
3) Possible environmental impact which should be studied with more detail

California Renewable Energy Center
Source: erthtechling.com, and U.S. Energy Information Administration, Annual Electric Generator Report and
Monthly Update (Forms EIA-860 and EIA-860M)
Current Status: Solar Thermal

California Renewable Energy Center
Technology Technology Readiness
Level
Crystalline Silicon TRL 9
Amorphous Silicon TRL 9
Thin Film (CdTe, CuInSe, CIGS, GaAs)
TRL 8
Multijunction cells TRL 8
Organic Solar Cells TRL 8
Nanostructured Solar Cells (Dye-sensitized, Perovskite, …)
TRL 4
G. Hodes, Science, 2013, Vol. 342, pp. 317-318
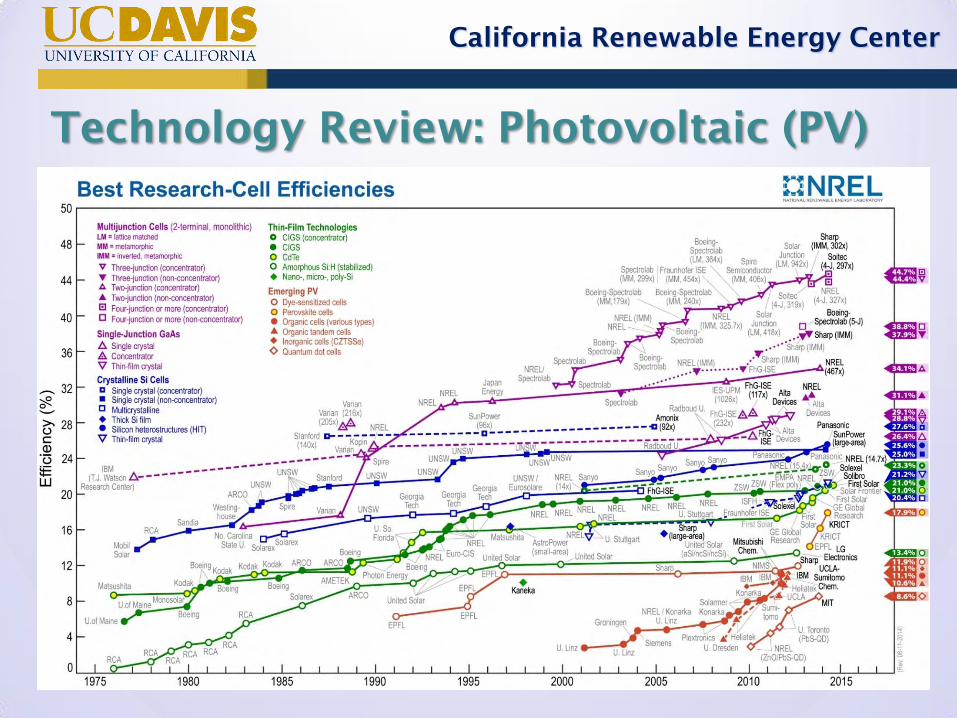
Technology Review: Photovoltaic (PV)
California Renewable Energy Center
Technology Review: Photovoltaic (PV)

California Renewable Energy Center
Source: NPD Solarbuzz PV Equipment Quarterly
2014 Solar PV Module Production by Technology
Current Status: Photovoltaic (PV)

California Renewable Energy Center
California Status
Source: U.S. Energy Information Administration, Annual Electric Generator Report and Monthly Update (Forms EIA-860 and EIA-860M)
California Renewable Energy Center
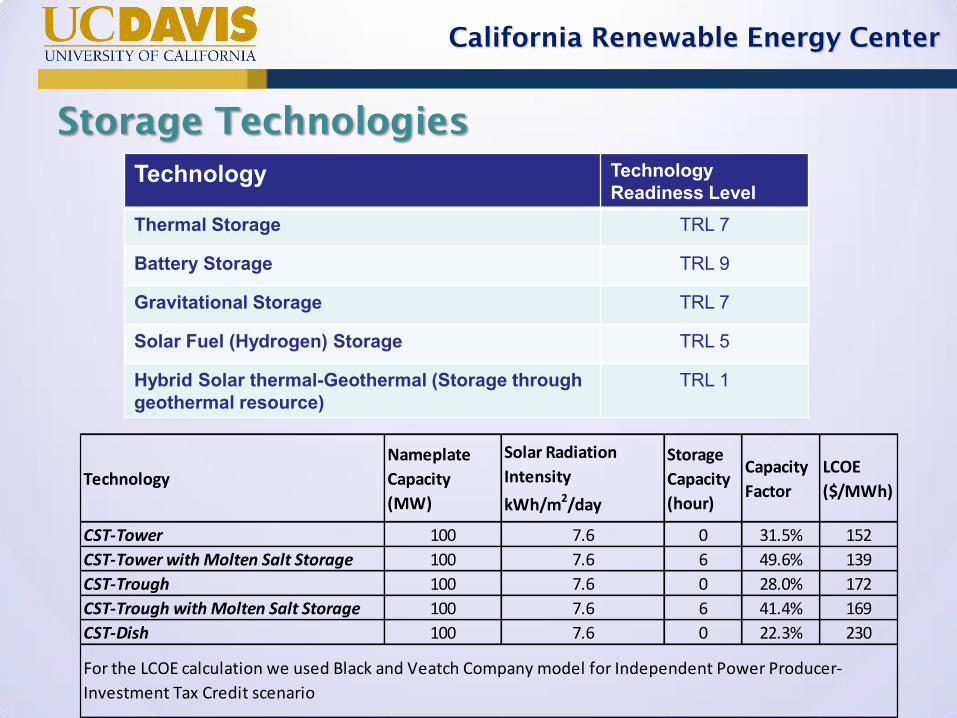
Storage Technologies
Technology Technology Readiness Level
Thermal Storage TRL 7
Battery Storage TRL 9
Gravitational Storage TRL 7
Solar Fuel (Hydrogen) Storage TRL 5
Hybrid Solar thermal-Geothermal (Storage through geothermal resource)
TRL 1
Technology
Nameplate
Capacity
(MW)
Solar Radiation
Intensity
kWh/m2/day
Storage
Capacity
(hour)
Capacity
Factor
LCOE
($/MWh)
CST-Tower 100 7.6 0 31.5% 152
CST-Tower with Molten Salt Storage 100 7.6 6 49.6% 139
CST-Trough 100 7.6 0 28.0% 172
CST-Trough with Molten Salt Storage 100 7.6 6 41.4% 169
CST-Dish 100 7.6 0 22.3% 230
For the LCOE calculation we used Black and Veatch Company model for Independent Power Producer-
Investment Tax Credit scenario

California Renewable Energy Center
TECHNOLOGY
POWER,
KW
ENERGY,
KWH
INSTALLED
CAPITAL
COST, $/
KW
INSTALLED
CAPITAL
COST, $/
KWH
INTER-
CONNECTION
COST, $/KW
FIXED
O&M, $/
KW-YR
VARIABLE
O&M,
$/KWH
Lithium ion
battery
100 400 5,500 – 6,000 1,250 – 1,750 2,000 – 2,500 20 – 25 0.0010 –
0.0015
Lithium ion
battery
1,000 4,000 4,250 – 4,750 1,000 – 1,300 1,000 – 1,250 8 – 10 0.0010 –
0.0015
Lithium ion
battery
20,000 5,000 1,000 – 1,250 4,500 – 7,000 400 – 600 6 – 8 0.0010 –
0.0015
Vanadium redox
flow battery
200 700 5,000 – 5,500 1,400 – 1,600 2,000 – 2,500 15 – 20 0.0015 –
0.0020
Vanadium redox
flow battery
1,200 4,000 3,000 – 3,500 900 – 1,100 750 – 1,000 7 – 9 0.0015 –
0.0020
Vanadium redox
flow battery
10,000 50,000 3,500 – 4,000 700 - 800 600 – 750 5 – 7 0.0010 –
0.0015
Storage Technologies (cont’d)

California Renewable Energy Center
Solar: Future Research and Development
1.) DOE SunShot set the goal of $0.06 per kWh for
2020
2.) CSP-Tower and enhanced thermal storage
3.) Development and production of both Silicon-
based and nanostructured solar cells in the US
4.) Soft Costs

California Renewable Energy Center
California Biomass
Collaborative
Steve Kaffka
Rob Williams

California Renewable Energy Center
State of Bioenergy (solid fuel and biogas power)
• ~ 400 TWh/y biopower
generated in the world
– Project Increase (IEA, 2013)
• ~ 28 TWh/y biopower US
• 6 TWh/y in California
– ~ stable for 20 years
– Some policy in place to
encourage new capacity
– Other policies tend to hinder
0
5
10
15
20
25
30
1980 1985 1990 1995 2000 2005 2010 2015
Ge
ne
rati
on
(TW
h)
Biopower Generation, US and CA
US
California
US EIA (2014), CEC Energy Almanac (2014)
IEA (2013)
Capacity (MW) Facilities
Solid Fuel (woody& ag.) 574.6 27 LFG Projects 371.3 79 WWTP Facilities 87.8 56 Farm AD 3.8 11 FoodProcess/Urban AD 0.7 2 Totals 1038 175
Solid Fuel (MSW) 63 3
Biopower Facilities in California

California Renewable Energy Center
Biomass Integrated-Gasification-
Combined-Cycle (BIGCC)
• BIGCC usually means Gas Turbine generator followed by Steam Rankine cycle
(as in figure above)
– Can be: Reciprocating Engine-Generator followed by Steam or Organic Rankine
– Or Fuel Cell- Gas Turbine combination
• Potential for higher efficiency [30-40%] & improved emissions at large scale (20-
100+ MW)
• 6 MW Biomass Pilot Scale Demonstrated in 1990’s
– A 5.5. MW Recip. Engine – steam turbine CC demonstrated in China ~ 2005
– Larege Coal IGCC operate in the US
• Cost of electricity projected $0.10 – 0.20/kWh. Competitive w/ new Solid-Fuel
Combustion Power
(Larson, 2001)
0.00
0.04
0.08
0.12
0.16
0.20
0.24
20 40 60 80 100
LCO
E ($
/kW
h)
Capacity (MW)

California Renewable Energy Center
Biomass Integrated-Gasification-
Fuel Cell (BIGFC)
• Can be single cycle or combined cycle (fuel cell-gas turbine (FC_GT) CC
shown above)
• Potential for high efficiency & low emissions at small scale: <1 - ~ 10 MW
– 20-40 % simple cycle (Fuel Cell only)
– 40-50 % combined cycle (FC-GT)
• Solid Oxide Fuel Cell most promising application
• Lab Scale developmental
• High cost of electricity projected initially
0.00
0.20
0.40
0.60
0.80
1.00
0 2 4 6 8 10
LCO
E ($
/kW
h)
Capacity (MW)
SOFC & Gas Turbine
SOFC Only
Estimates from Literature
(Kleinhappl, 2012) ηel ~ 40-50% (HHV) biomass to electricity

California Renewable Energy Center
Renewable
Synthetic
Natural Gas
(RSNG)
• Thermal gasification, clean & reform
syngas to methane, upgrade to NG
quality (remove CO2, H20)
• Thermal Efficiency ~ 65% (to SNG)
• Overall Electric energy eff. ~ 33%
(natural gas combined cycle, η= 50% )
• 20MWgas
RSNG facility commissioning
in Gothenberg Sweden
– (100 MWgas
Phase II in 2016) “GoBiGas”
– 200 MWgas
Plant in design E.ON “Bio2G”
Methanation & Upgrading
0
5
10
15
20
25
30
0 400 800 1200 1600 2000
RSN
G P
rod
uct
ion
Co
st (
$/G
J)
Biomass (1000 dry tons per year)
$50/BDT
$30/BDT
Zero Feedstock Cost
(MWth Feed In)200 400 600 800 1000

California Renewable Energy Center
Biomass Research Recommendations
• Costs generally need to be reduced across all biopower
technologies
– Research will help
– Learning through building capacity of advanced systems will help
• Reliable gas cleaning and tar reforming methods need to
be demonstrated - this will improve all biomass
gasification applications:
– Small to Large
– Power to syngas/fuels production
• For renewable natural gas via thermal gasification, H2 in
final product issue needs to be explored and solved
– Remove or reduce H2 and/or
– Adjust natural gas pipeline specifications to allow higher
concentration
• If BIG-FC systems are of interest, develop or expand basic
research programs in US and California in this area
(almost all literature is from Europe)
California Renewable Energy Center
Questions & Answers:
Integrated Assessment
of Renewable Energy
Technology Options

California Renewable Energy Center
9:00 Introduction and Overview
9:15 Integrated assessment of renewable technology options
10:15 Break
10:30 Assessment of Co-located renewable generation potential
11:00 Assessment of geothermal in under-served regions
11:30 Solar heating and cooling technology analysis
Noon Lunch
1:15 California off-shore wind technology assessment
1:45 Technical assessment of small hydro
2:15 Biomass resources and facilities database update
2:45 Break
3:00 Assessment of sustainability for new/existing biomass energy
3:30 Biomass/MSW gap assessment and tech options for biogas clean-up
4:15 Future research recommendations
4:45 Closing

California Renewable Energy Center
15 minute break
----
Program will resume
at 10:30 am
California Renewable Energy Center
9:00 Introduction and Overview
9:15 Integrated assessment of renewable technology options
10:15 Break
10:30 Assessment of Co-located renewable generation potential
11:00 Assessment of geothermal in under-served regions
11:30 Solar heating and cooling technology analysis
Noon Lunch
1:15 California off-shore wind technology assessment
1:45 Technical assessment of small hydro
2:15 Biomass resources and facilities database update
2:45 Break
3:00 Assessment of sustainability for new/existing biomass energy
3:30 Biomass/MSW gap assessment and tech options for biogas clean-up
4:15 Future research recommendations
4:45 Closing

California Renewable Energy Center
Assessment of
Co-located Renewable
Generation Potential

California Renewable Energy Center
One of the goals of these Tasks (2 & 5) was to
assess opportunities in which multiple renewable
resources could be deployed in a coordinated
fashion.
Approach:
• Identify type examples of sites (Task 2, L.A. Basin)
and regions (Task 5) with co-located resources
• Assess resource potential
• Imagine possibilities!
Selected regions:
• Alturas, Geyserville, Kern County Region, Imperial
Valley, and Los Angeles Basin

California Renewable Energy Center
Alturas/SurpriseValley/Canby Region
ImperialValley Region
Geyserville/MiddletownRegion
Fresno/Kern CountyRegion
Miles
0 50 100 150 200
Site Selection (Task 5)

California Renewable Energy Center
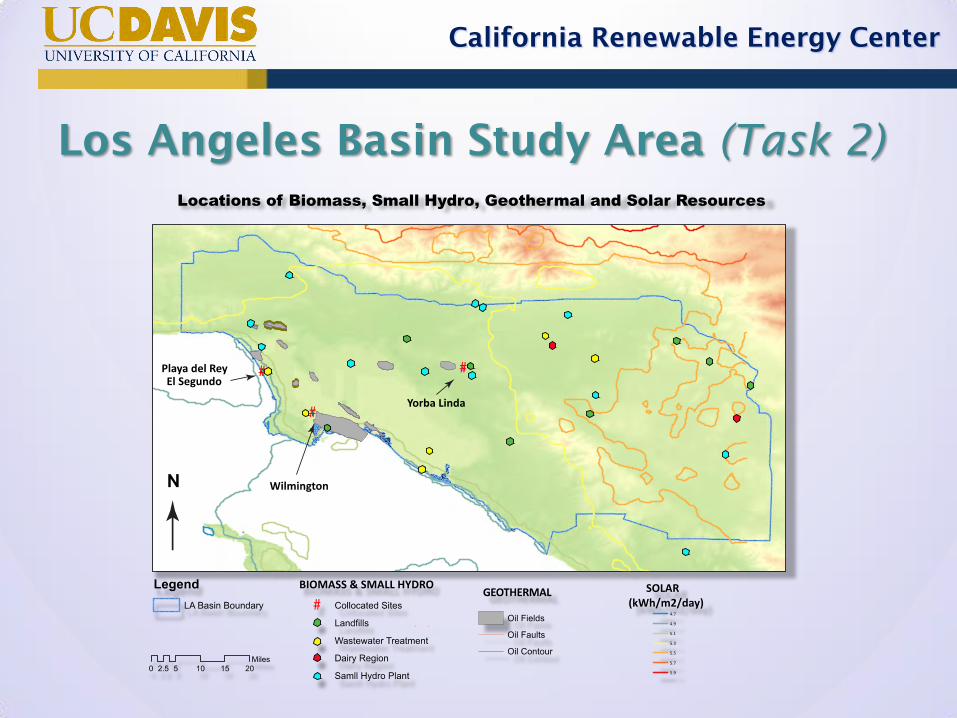
map of LA Basin
Los Angeles Basin Study Area (Task 2)

California Renewable Energy Center
Case study #1:
Alturas Alturas
(Modoc Co.)
California map: "USA California location map" by Nord NordWest - own work, using United States National Imagery and Mapping Agency data World Data Base II data U.S. Geological Survey (USGS) data. Licensed under Creative Commons Attribution 3.0 via Wikimedia Commons - http://commons.wikimedia.org/wiki/File:USA_California_location_map.svg#mediaviewer/File:USA_California_location_map.svg Surprise Valley photo: UC Davis Geothermal Collaborative

California Renewable Energy Center
Canby
Alturas
Lake City
Goose Lake
120°0'0"W121°0'0"W
41°40'0"N
Shaded Relief and Wind Resources Map
0 4 8 12 162Miles
Legend
proposed Sites
State Roads
Mean Annual Wind Speed at 100 m Height
mph m/s
< 10.1 < 5.5
12.3 - 13.4 5.5 - 6.0
13.4 - 14.5 6.0 - 6.5
14.5 - 15.7 6.5 - 7.0
15.7 - 16.8 7.0 - 7.5
16.8 - 17.9 7.5 - 8.0
17.9 - 19.0 8.0 - 8.5
19.0 - 20.1 8.5 - 9.0
20.1 - 21.3 9.0 - 9.5
> 21.3 > 9.5
Alturas – Resource Assessment
Potential
(MW)
Biomass 44
Geothermal 50
Solar* 140
Wind 1,049
*per 100 sq. miles; CF = 18.4%

California Renewable Energy Center
Technical Resource (BDT/y)
Potential Generation (MWe)
Forest Material 324,600 42.8
Agricultural Residue 8,110 1
MSW Biomass 1,400 0.2 Totals 332,710 44
Technical Biomass Resource and
Generation Potential for Modoc County*
* From the CBC Resource Update (2014)

California Renewable Energy Center
Case study #2:
Geyserville
Geyserville
California map: "USA California location map" by Nord NordWest - own work, using United States National Imagery and Mapping Agency data World Data Base II data U.S. Geological Survey (USGS) data. Licensed under Creative Commons Attribution 3.0 via Wikimedia Commons - http://commons.wikimedia.org/wiki/File:USA_California_location_map.svg#mediaviewer/File:USA_California_location_map.svg Geothermal photo: Photo 01049 courtesy of the National Renewable Energy Lab (NREL) Lake Sonoma: "LakeSonoma2" by CrabTree13 - Own work. Licensed under Creative Commons Attribution-Share Alike 3.0 via Wikimedia Commons - http://commons.wikimedia.org/wiki/File:LakeSonoma2.jpg#mediaviewer/File:LakeSonoma2.jpg

California Renewable Energy Center
Geyserville – Resource Assessment
MW
Biomass 101
Geothermal 1,610
Solar* 140
Wind 30
* per 100 sq. miles; CF = 18.9%
** Focused on Geysers geothermal fields

California Renewable Energy Center
58
Wind: Development Potential – Geyserville
• Potential to collocate wind with existing Geysers
geothermal plants
• Existing infrastructure: geothermal plants, roads,
work/staging areas coincide with windiest areas
• Conservatively, 13 turbines, 29.9 MW in 7.0-7.6
m/s wind

California Renewable Energy Center
Case study #3:
Kern – San Joaquin Valley
Oil wells: "MidwaySunsetWells" by User:Antandrus. Original uploader was Antandrus at en.wikipedia - Transferred from en.wikipedia(Original text : User:Antandrus). Licensed
under Creative Commons Attribution-Share Alike 3.0 via Wikimedia Commons -
http://commons.wikimedia.org/wiki/File:MidwaySunsetWells.jpg#mediaviewer/File:MidwaySunsetWells.jpg
San Joaquin Valley: "California's Central Valley" by Amadscientist - Own
work. Licensed under Creative Commons Zero, Public Domain Dedication via
Wikimedia Commons -
http://commons.wikimedia.org/wiki/File:California%27s_Central_Valley.JPG#
mediaviewer/File:California%27s_Central_Valley.JPG
Map of California: "USA California location map" by NordNordWest - own
work, usingUnited States National Imagery and Mapping Agency dataWorld
Data Base II dataU.S. Geological Survey (USGS) data. Licensed under Creative
Commons Attribution 3.0 via Wikimedia Commons -
http://commons.wikimedia.org/wiki/File:USA_California_location_map.svg#
mediaviewer/File:USA_California_location_map.svg
Kern
California Renewable Energy Center
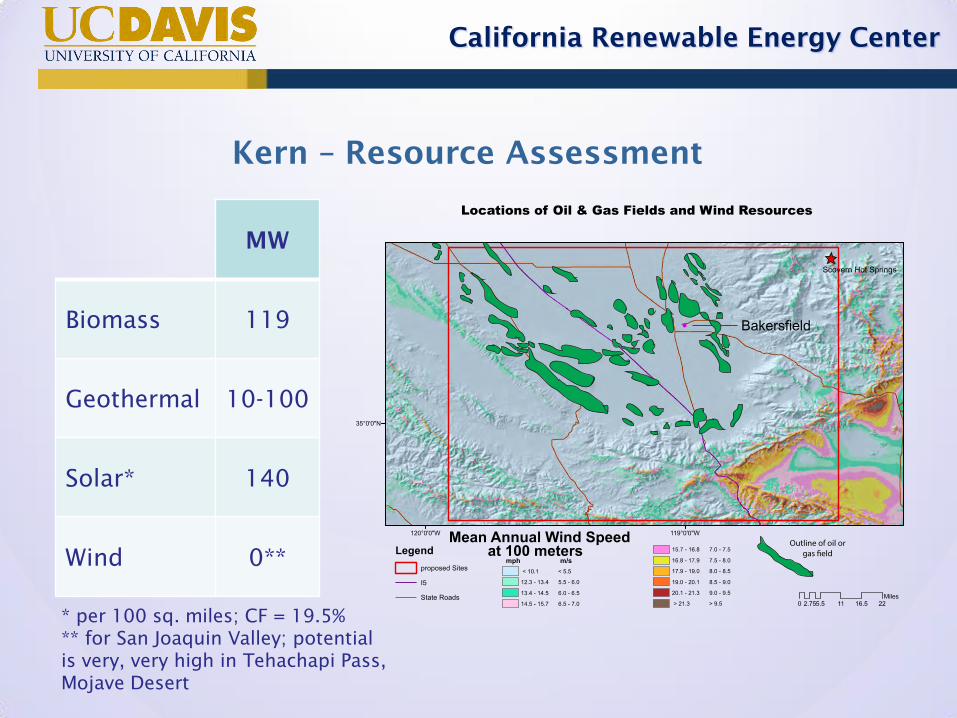
Kern – Resource Assessment
MW
Biomass 119
Geothermal 10-100
Solar* 140
Wind 0**
* per 100 sq. miles; CF = 19.5%
** for San Joaquin Valley; potential
is very, very high in Tehachapi Pass,
Mojave Desert

California Renewable Energy Center
Case study #4:
Imperial
Salton Sea: "Salton Sea from Space". Licensed under Public domain via Wikimedia Commons http://commons.wikimedia.org/wiki/File:Salton_Sea_from_Space.jpg#mediaviewer/File:Salton_Sea_from_Space.jpg
Irrigated fields: "Imperial valley fields" by Spacenut525 at English Wikipedia - Own workTransferred from en.wikipedia to Commons by MathewTownsend.. Licensed under Public domain via Wikimedia Commons - http://commons.wikimedia.org/wiki/File:Imperial_valley_fields.jpg#mediaviewer/File:Imperial_valley_fields.jpg
Desert Vista: "Vista of Anza Borrego". Licensed under Creative Commons Attribution-Share Alike 2.5 via Wikimedia Commons - http://commons.wikimedia.org/wiki/File:Vista_of_Anza_Borrego.jpg#mediaviewer/File:Vista_of_Anza_Borrego.jpg
California Map: See citation on previous slides.

California Renewable Energy Center
Imperial – Resource Assessment
MW
Biomass 20
Geothermal 2,900
Solar* 140
Wind 1,051
* per 100 sq. miles; CF= 21.3%

California Renewable Energy Center
Biomass
(MWe)
Geothermal
(MWe)
Solar (PV)
(kWh/m^2/day)
Wind
(MWe)
Alturas 44 50 5.0 - 5.5 1,049
Geyserville 101 1,610 5.0 – 5.5 30
Kern 119 10-100 5.7 0*
Imperial 20 2,900 6.6 1,051
Observations:
• In all cases, coordinate generation is possible, but base
resources differ
• Overall capacity in these limited areas would double current
renewable generation capacity
Summary Table: Energy Potential by Region
California Renewable Energy Center
map of LA Basin
Los Angeles Basin Study Area (Task 2)

California Renewable Energy Center
Playa del Rey
Source: Google
California Renewable Energy Center
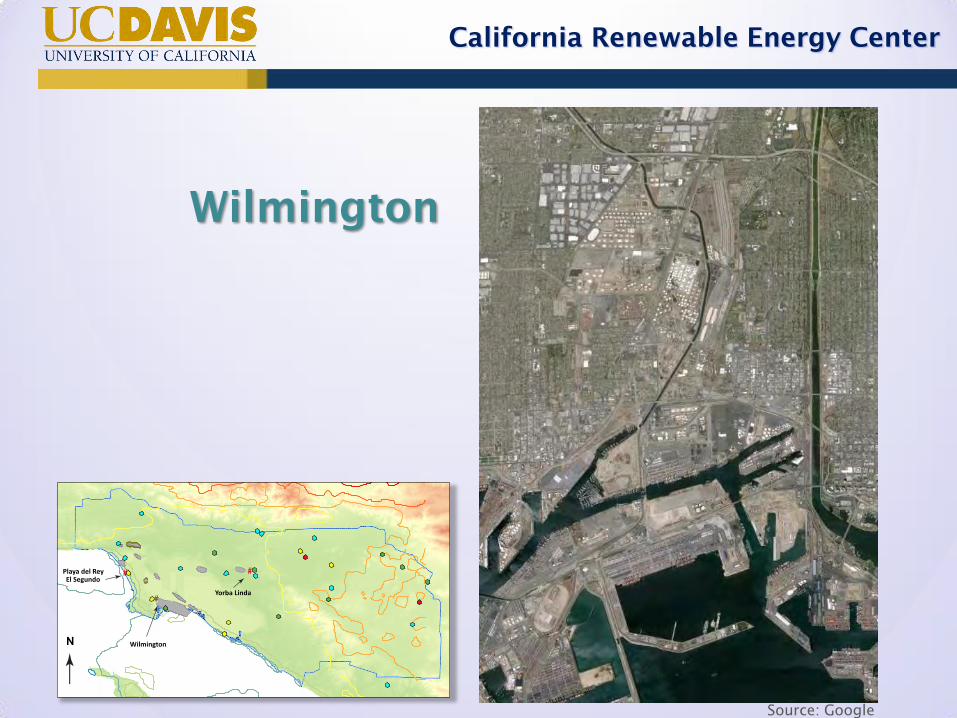
Wilmington
Source: Google

California Renewable Energy Center
Yorba Linda
Source: Google

California Renewable Energy Center
68
Wind: Development Potential – LA Basin

California Renewable Energy Center
69
Wind Power Production at Olinda Alpha Landfill
Capacity Factor: 28%

California Renewable Energy Center
Solar Technical Potential in the LA Basin
• Estimated Solar Potential (12
months x 24 hours)
• Warehouse rooftop
• Vacant land
• PV performance model
• SolarAnywhere resource data
• 20o tilt, 60% roof availability, power
density: 122 W m2

California Renewable Energy Center
Areas surveyed
• Proximity to geothermal sources:
El Segundo
Wilmington
Yorba Linda

California Renewable Energy Center
Technical Solar Generation Potential
El S
egu
nd
o
Wilm
ing
ton
Y
orb
a L
ind
a
• Installed Capacity
• El Segundo: 10.1 MW
• Wilmington: 334 MW
• Yorba Linda: 603 MW
• Similar solar resource
• Winter low:
4.5 MWh / MW / day
• Summer high:
7.8 MWh / MW / day
hour of day
Mo
nth
of
year
MWh
California Renewable Energy Center
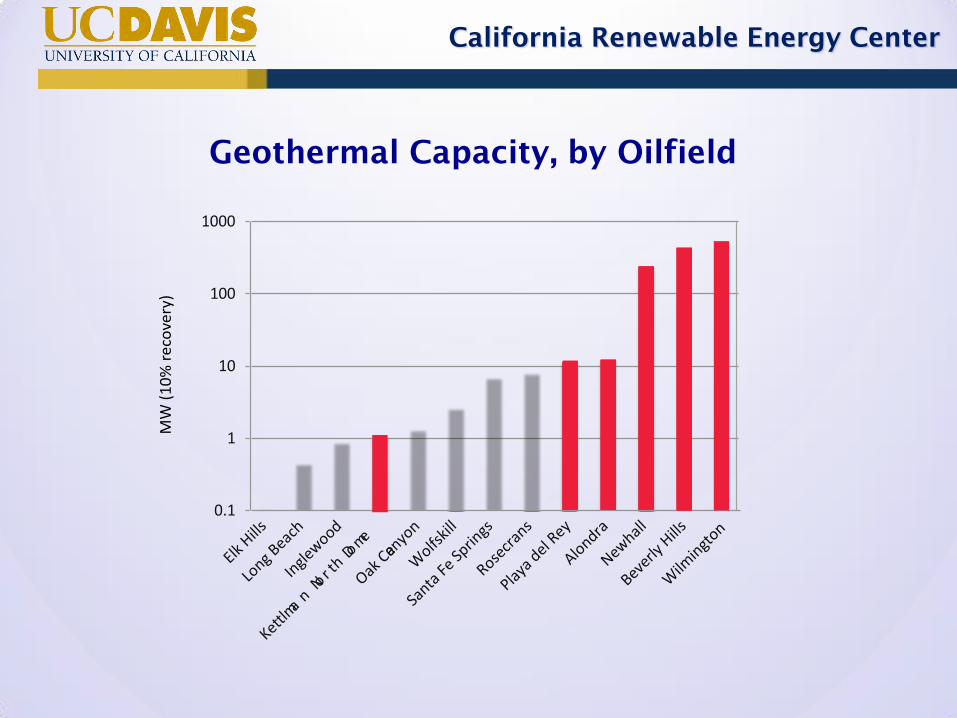
Geothermal Capacity, by Oilfield
0.1
Elk Hills
100
10
1
Playa
del R
ey
Rosecr
ans
Santa
Fe Sp
rings
Wolfs
kill
Oak Canyo
n
Kettl
e
man No
r th Do
me
Ingle
wood
Long B
each
Beverly
Hills
Newhall
Alondra
1000
MW
(1
0%
re
cove
ry)
Wilm
ingt
on

California Renewable Energy Center

California Renewable Energy Center
Playa del Rey / El Segundo (Hyperion WWTP)
Capacity (MW) Energy (GWh/y @ 0.9 capacity
factor)
Natural Gas Diplacement
(MMscf/y)
CO2 Offset (Tonnes/y)
21 165.6 1,733 97,833
Wilmington Study (JWPCP Waste Water Plant)
Capacity (MW)
Energy (GWh/y @ 0.9
capacity factor)
Natural Gas Diplacement
(MMscf/y)
CO2 Offset (Tonnes/y)
21 165.6 1,733 97,833
Bioenergy Potential in L.A. Basin
Capacity
(MW)
Energy (GWh/y @ 0.9 capacity
factor)
Natural Gas Diplacement
(MMscf/y)
CO2 Offset (Tonnes/y)
Current LFG power
37 291.7 3,053 172,373 Potential Energy
from Waste Conversion 89 704.7 7,374 416,418
Yorba Linda Study Area (Olinda Alpha Landfill)

California Renewable Energy Center
MW
Natural gas
Displaced
(MMSCF/yr)
CO2 Offset
(Tonnes/yr)
Playa del Rey
41.1 2,674 153,978
Wilmington 855 45,304 2,556,400
Yorba Linda 731.3 22,891 1,292,635
Total 1,627.4 70,869 4,003,013
L.A. Basin: Combined Benefits

California Renewable Energy Center
77
Potential Renewable Combinations
• Always site specific
• Coordinate and encourage generation to optimize for local
resources
• Utilize flexible biomass and geothermal to support expansion
of solar/wind systems
• Use solar and geothermal heat to supply thermal energy for
biomass processes
• Power electronics on wind turbines can provide voltage
support
• Wind and biomass are very compatible in terms of land use
• Wind and geothermal can coincide in complex topography
• Store solar by enhancing geothermal injection
California Renewable Energy Center
78
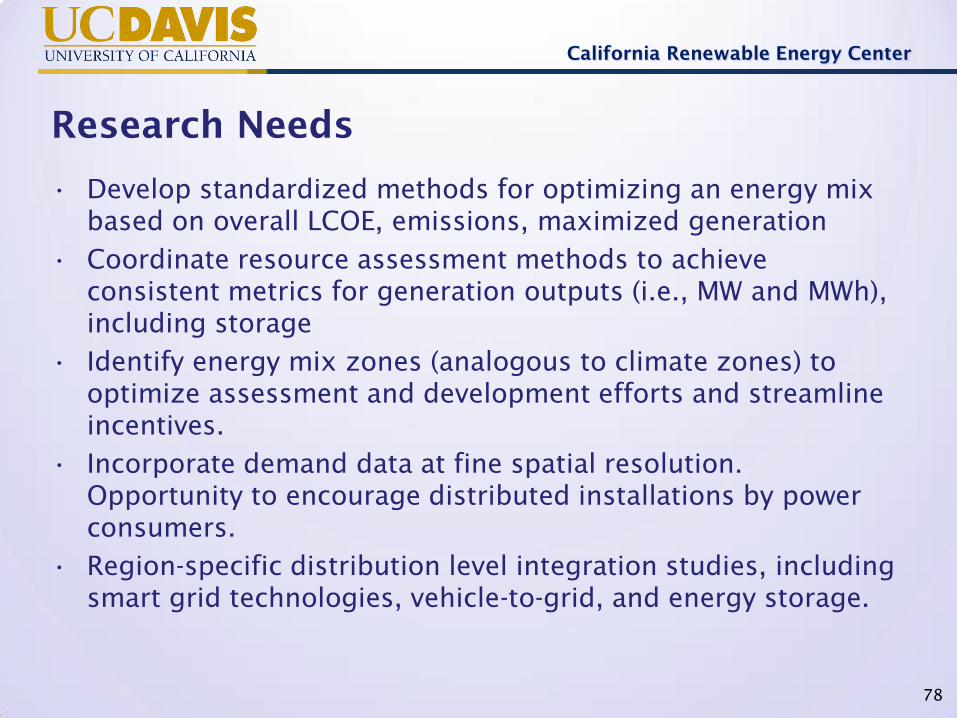
Research Needs
• Develop standardized methods for optimizing an energy mix
based on overall LCOE, emissions, maximized generation
• Coordinate resource assessment methods to achieve
consistent metrics for generation outputs (i.e., MW and MWh),
including storage
• Identify energy mix zones (analogous to climate zones) to
optimize assessment and development efforts and streamline
incentives.
• Incorporate demand data at fine spatial resolution.
Opportunity to encourage distributed installations by power
consumers.
• Region-specific distribution level integration studies, including
smart grid technologies, vehicle-to-grid, and energy storage.

California Renewable Energy Center
9:00 Introduction and Overview
9:15 Integrated assessment of renewable technology options
10:15 Break
10:30 Assessment of Co-located renewable generation potential
11:00 Assessment of geothermal in under-served regions
11:30 Solar heating and cooling technology analysis
Noon Lunch
1:15 California off-shore wind technology assessment
1:45 Technical assessment of small hydro
2:15 Biomass resources and facilities database update
2:45 Break
3:00 Assessment of sustainability for new/existing biomass energy
3:30 Biomass/MSW gap assessment and tech options for biogas clean-up
4:15 Future research recommendations
4:45 Closing

California Renewable Energy Center
Assessment of
Geothermal Resources
In Under-served
Regions
California Renewable Energy Center
The goal of this task is to develop a methodology for
assessing geothermal resources in regions that
possess inadequate expert capability to undertake
such assessments.
Many counties in California possess modest
geothermal resources that, if developed, could
significantly improve local and regional economic
conditions. However, such locations commonly lack
sufficient funds, indigenous knowledge and skills to
plan, execute and analyze resource capacity and
potential applications.

California Renewable Energy Center
Selected site:
Surprise Valley (Alturas)

California Renewable Energy Center
Magnetotelluric results, Samuel Hawkes

California Renewable Energy Center
Geochemistry results,
Carolyn Cantwell & Andrew Fowler
180 °C (355 F)

California Renewable Energy Center
Presentation at Alturas City Hall, August 17, 2013
“The big highlight for us was the community meeting UC Davis held . . .
It was standing room only . . . With that added confidence, two of our
communities in Modoc County became proactive and answered a grant
solicitation by the CEC. Both entries were awarded. “
- Curt Rose (resident)
“This project was a great opportunity to . . . show me how I might tailor
my research approach to produce a product that is useful to people
outside of the academic realm.”
- Carolyn Cantwell (M.Sc. candidate)
“I strongly believe the ability to communicate science research to non-
experts is a key . . . The Surprise Valley project has provided a unique
forum to integrate these . . . important ideas.”
- Andrew Fowler (Ph.D. candidate)

California Renewable Energy Center
9:00 Introduction and Overview
9:15 Integrated assessment of renewable technology options
10:15 Break
10:30 Assessment of Co-located renewable generation potential
11:00 Assessment of geothermal in under-served regions
11:30 Solar heating and cooling technology analysis
Noon Lunch
1:15 California off-shore wind technology assessment
1:45 Technical assessment of small hydro
2:15 Biomass resources and facilities database update
2:45 Break
3:00 Assessment of sustainability for new/existing biomass energy
3:30 Biomass/MSW gap assessment and tech options for biogas clean-up
4:15 Future research recommendations
4:45 Closing

California Renewable Energy Center
Solar Heating and Cooling
Technology Analysis
California Renewable Energy Center
Agenda for this session:
1. Market Analysis
2. Solar Thermal (ST) Technologies
3. Industry Scenarios
4. Challenges and Opportunities
5. Q/A

California Renewable Energy Center
Market Analysis

California Renewable Energy Center
California Energy Efficiency and GHG Goals
• Integrated previous finding from Navigant
and McCollum et al. (2012)
Navigant Consulting Inc. Nov. 2011, Analysis to Update Energy Efficiency Potential, Goals and Targets for 2013 and Beyond.
http://www.cpuc.ca.gov/PUC/Energy+Efficiency/Energy+Goals+and+Potential+Studies.htm
David McCollum, Christopher Yang, Sonia Yeh, Deep Greenhouse Gas Reduction Scenarios for California — Strategic implication from the CA-
TIMES energy-economic systems model. Energy Strategy Reviews, Vol 1, Issue 1, March 2012, Page 19-32
CA GHG Emission Reduction Goals by Sector

California Renewable Energy Center
California Natural Gas
Demand by Sector in 2012
Ref: Energyalmanac.ca.gov
Utility NameCommercial
BuildingIndustry
Mining &
ConstructionTotal Usage
Pacific Gas & Electric
Company (PG&G) 867.85 1746.38 25.03 2639.26
San Diego Gas and
Electric Company 155.82 22.16 3.78 181.76
Southern California Gas
Company 919.46 1592.65 209.41 2721.53
Southwest Gas
Corporation 41.69 4.43 0.82 46.94
Gas Producer 0.00 0.00 2047.43 2047.43
City of Palo Alto,
Resource Mgmt 13.94 2.90 0.24 17.08
Long Beach Gas
Department 26.07 5.36 0.00 31.43
Gas Consuption (in Millions of Therms) of Non-Residential Sections in
California in 2012 (Source: ECDMS.Energy.Ca.Gov)

California Renewable Energy Center
Natural Gas Price in California
Sources of Data: 1) EIA.Gov, 2) 2013 Natural Gas Issues, Trends, and Outlook Final Staff Report.
California Energy Commission. CEC‐200‐2014‐001‐SF.
End-User Sector 2010 2011 2012 2013 2015 2020 2025
Residential $9.92 $9.93 $9.14 $10.94 $9.43 $10.04 $10.67
Commercial $8.30 $8.29 $7.05 $8.05 $7.25 $7.87 $8.49
Industrial $7.02 $7.04 $5.77 $6.61 $5.11 $5.73 $6.35
Power Generation --- --- --- $4.13 $4.53 $5.13 $5.73
Enhanced Oil
Recovery/Cogeneration --- --- --- --- $4.65 $5.62 $5.87
California Nautual Gas End-User Prices (per Thousand Cubic Feet) by Sector and
Estimates for 2015, 2020, and 2025
California Renewable Energy Center
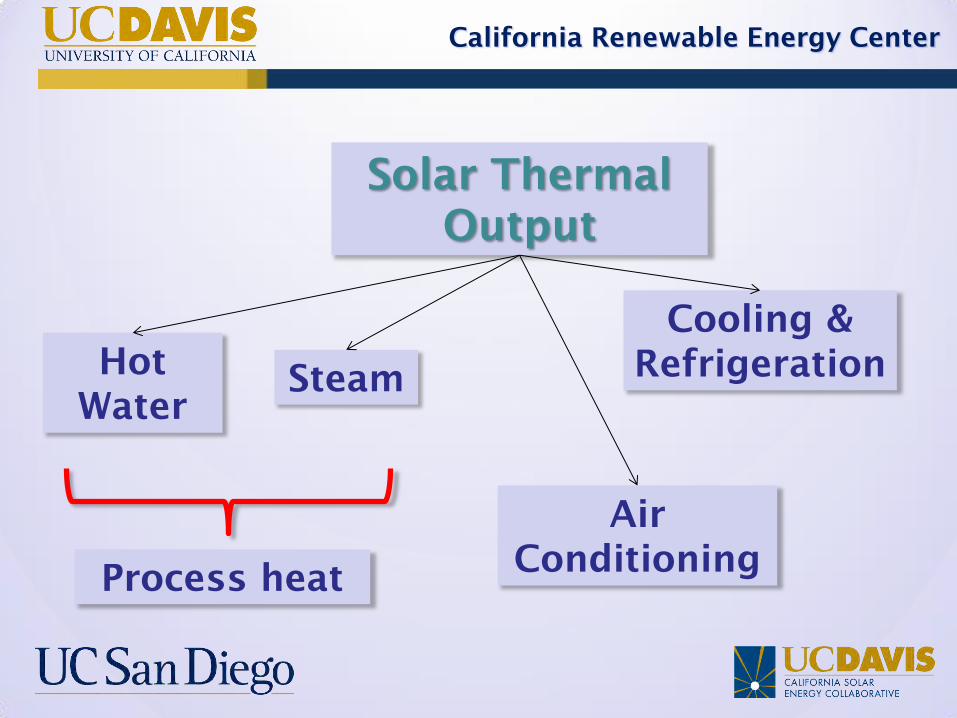
Solar Thermal
Output
Hot
Water
Steam
Air
Conditioning
Cooling &
Refrigeration
Process heat

California Renewable Energy Center
Process Heat in the Industrial Sectors
Industrial ProcessTemperature
(oC)Industrial Sectors
Washing and Cleaning 40-90
Food and Beverages, Meat, Wine, Brewery,
Textile, Pharmaceutical, Galvanizing and
Electroplating
Sterilization 100-150Food and Beverages, Pharmaceutical, Dairy, Tinned
Food, Meat
Pasteurising 80-110Food and Beverages, Pharmaceutical and
Biochemical, Tinned Food
Drying, Concentrates, and
Evaporation30-180
Food and Beverages, Textile, Pharmaceutical,
Wood, Dairy, Creamary, Plastics
Cooking 60-100 Food and Beverages, Tinned Food, Paper, Meat
Boiling 95-105 Food and Beverages, Chemical Industry
Boiler Feed Water Preheating 30-100Food and Beverages, Chemical Industry, Textile,
Dairy, Paper, Wood
Bleaching 60-150 Textile, Paper
Dyeing 100-160 Textile
General Process Heat 120-180 Chemical Industry, Plastic
Industrial Processes Requiring Process Heat
Sources: 1) iea.org, 2) S. Mekhilef, et al, Renew. & Sust. Energy Rev. (2011),
3) Large Scale Solar Thermal Systems Design Handbook

California Renewable Energy Center
Resources: 1) Technology Roadmap: Energy Efficiency in California's Food
Industry CEC-500-2006-073 2) Brewers Association Energy Usage, GHG
Reduction, Efficiency and Load Management Manual
Industry
Annual Average Gas
Consuption (Million
Therm)
Annual Average
Electricity Consuption
(Million kWh)
Food and Vegetable Food Processors in
California350 700
Cheese Producers in California 43 583
Milk Powder/Butter Producers in
California33 130
Meet (Beef) Sector in California 5 88
Meet (Poultry) Sector in California 40 360
Wineries in California 23 406
Rice Sector in California 41 316
Breweries 1.5 Therms/barrel 22 kWh/barrel
Energy Consumption in Different Industry Sectors
Energy Consumption by Food Industry Sector

California Renewable Energy Center
Agenda for this session:
1. Market Analysis
2. Solar Thermal (ST) Technologies
3. Industry Scenarios
4. Challenges and Opportunities
5. Q/A

California Renewable Energy Center
Solar Thermal
Technologies

California Renewable Energy Center
How to choose the proper technology?
a) Required Temperature, b) Available land or rooftop space, c) Electricity and
Natural Gas Consumption, d) Capital Cost, e) Volume of hot water/steam demand,
f) Maintenance, g) Direct vs diffuse sun radiation

California Renewable Energy Center
Non-Concentrating Technologies
Hk-phy.org
Homepower.com
Energy.gov
1. Lower Temperatures
2. Easy to install
3. Less Maintenance due to no tracking
mechanism

California Renewable Energy Center
Concentrating Technologies
Energy.gov Energy.gov
Energy.gov
Fossilfreedom.com 1. Suitable for Steam
production
2. Higher capital cost and
O&M Cost
3. Land Requirement
4. Require Direct Sun
Radiation

California Renewable Energy Center
Hybrid
Technologies
NewFormEnergy.com
Cogenra
REhnu
1. Combined Production of
electricity and Thermal Energy
2. Still young technologies
3. Capital cost and maintenance
costs are higher

California Renewable Energy Center
Agenda for this session:
1. Market Analysis
2. Solar Thermal (ST) Technologies
3. Industry Scenarios
4. Challenges and Opportunities
5. Q/A

California Renewable Energy Center
Industry Scenarios

California Renewable Energy Center
Scenarios for Currently Available Industries
• Self-assessment: Each company can use
some guidelines to have a rough estimate
for employing Solar Thermal Technologies
Evaluation of
monthly Natural Gas
and Electricity
Consumption
Required
Temperatures
Selection of
Compatible
Solar Thermal
Technologies
System
technical and
economic
analysis
More detailed
analysis by
contacting
solar thermal
companies
Strategies for
integration to
the currently
available
processes and
equipment

California Renewable Energy Center
Scenarios for Plants “Under Design”
1.) Increasing the awareness of the companies
in charge of engineering design of plants and
processes, on the advantages of integration of
Solar Thermal technologies the plant.
2.) Additional incentives for newly-built plants
to incorporate Solar Thermal technologies.
3.) Formation of a community of solar thermal
companies, engineering companies, and
boiler companies (i.e., more integrated
engineering designs).

California Renewable Energy Center
Case Study: Design for a
Creamery in North California • Balancing Plant Creamery: Converting extra milk to
cream, butter, concentrated milk, and dry powder milk.

California Renewable Energy Center
1) Photovoltaic (PV) panels for production of
the electricity
2) Evacuated Tube Solar Thermal panels for
production of hot water
3) Photovoltaic-Thermal (PV/T) panels for
production of both electricity and hot water
We considered the installation of 10 panels
for each scenario
Case Study: Design for a Creamery in North
California – Different Scenarios

California Renewable Energy Center
Case Study: Design for a Creamery in North
California – PV Scenario

California Renewable Energy Center
Case Study: Design for a Creamery in North
California – Evacuated Tube Scenario

California Renewable Energy Center
Case Study: Design for a Creamery in North
California – PV/T Scenario

California Renewable Energy Center
Case Study: Design for a Creamery in North
California – PV/T Scenario (cont’d)

California Renewable Energy Center
Case Study: White Labs Brewery - Model
• 176˚F in the mash tank, 180˚F for dish/bottle washing.
• 70% target solar fraction
• TRNSYS model

California Renewable Energy Center
Case Study: White Labs Brewery - Results
• Propylene glycol
• 1280 sqft solar system at $100/sf
• 2-wall heat exchanger on collector loop
• Solar and storage tanks separate
Install Cost $128,000 CSI Thermal Incentive ($72,432) Federal ITC ($38,400) Net Cost of System $17,168 Annual Savings $4,985 Simple Payback 3.4 Years Payback w/o CSI, ITC 26 Years

California Renewable Energy Center
Case Study: Navy Fleet Readiness Center - Model
• Cleaning and plating for aircraft refurbishment
California Renewable Energy Center
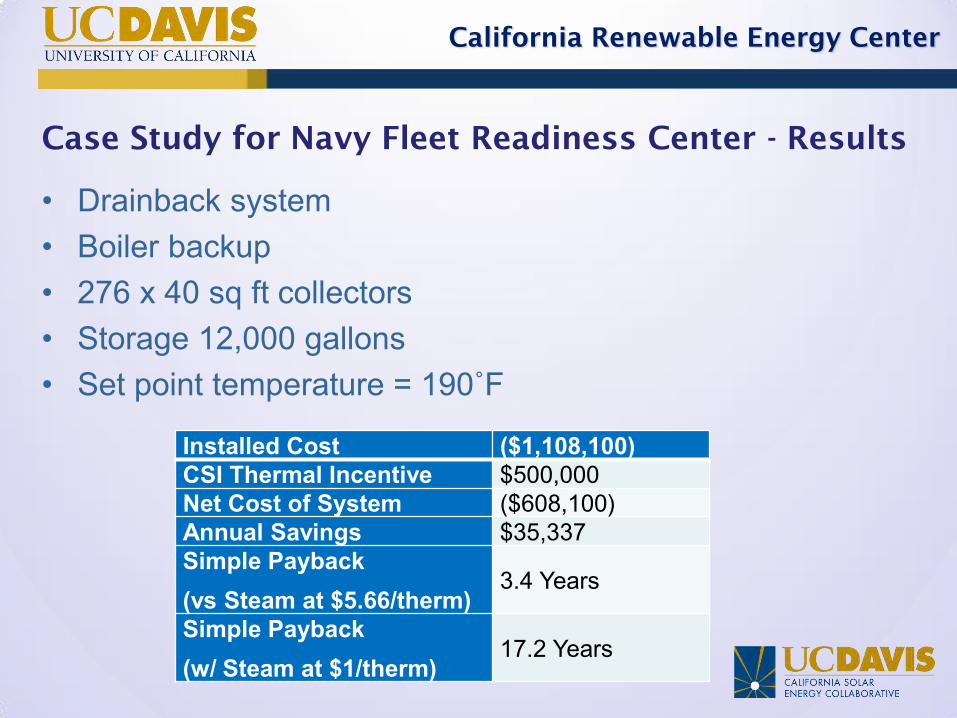
Case Study for Navy Fleet Readiness Center - Results
• Drainback system
• Boiler backup
• 276 x 40 sq ft collectors
• Storage 12,000 gallons
• Set point temperature = 190˚F
Installed Cost ($1,108,100) CSI Thermal Incentive $500,000 Net Cost of System ($608,100) Annual Savings $35,337 Simple Payback
(vs Steam at $5.66/therm) 3.4 Years
Simple Payback
(w/ Steam at $1/therm) 17.2 Years

California Renewable Energy Center
Non-DHW Solar Thermal Potentials

California Renewable Energy Center
Agenda for this session:
1. Market Analysis
2. Solar Thermal (ST) Technologies
3. Industry Scenarios
4. Challenges and Opportunities
5. Q/A

California Renewable Energy Center
Challenges and
Opportunities

California Renewable Energy Center
Challenges and Opportunities
• Cheap price of natural gas and low
motivation for decreasing natural gas
consumption
• Payback time Soft costs
• Integration of solar technologies to the
current processes
• Incentives for newly built plants
• More interaction with the plant EPC
• Incentives for decreasing carbon foot print

California Renewable Energy Center
Questions & Answers:
Solar Heating and Cooling
Technology Analysis

California Renewable Energy Center
9:00 Introduction and Overview
9:15 Integrated assessment of renewable technology options
10:15 Break
10:30 Assessment of Co-located renewable generation potential
11:00 Assessment of geothermal in under-served regions
11:30 Solar heating and cooling technology analysis
Noon Lunch
1:15 California off-shore wind technology assessment
1:45 Technical assessment of small hydro
2:15 Biomass resources and facilities database update
2:45 Break
3:00 Assessment of sustainability for new/existing biomass energy
3:30 Biomass/MSW gap assessment and tech options for biogas clean-up
4:15 Future research recommendations
4:45 Closing

California Renewable Energy Center
Lunch break
----
Program will resume
at 1:15 pm

California Renewable Energy Center
9:00 Introduction and Overview
9:15 Integrated assessment of renewable technology options
10:15 Break
10:30 Assessment of Co-located renewable generation potential
11:00 Assessment of geothermal in under-served regions
11:30 Solar heating and cooling technology analysis
Noon Lunch
1:15 California off-shore wind technology assessment
1:45 Technical assessment of small hydro
2:15 Biomass resources and facilities database update
2:45 Break
3:00 Assessment of sustainability for new/existing biomass energy
3:30 Biomass/MSW gap assessment and tech options for biogas clean-up
4:15 Future research recommendations
4:45 Closing
California Renewable Energy Center
California Off-shore Wind
Technology Assessment

California Renewable Energy Center
Why Offshore Wind?
• Terrestrial wind power sites saturated
• Excellent wind resource
– High wind speeds
– Low turbulence
– Near load centers
• Remotely located
• No road transportation constraints
– Larger turbines
• Local economic benefits
– Jobs
– Infrastructure
– Taxes

California Renewable Energy Center
2 - 126
U.S. Onshore & Offshore Wind Resource

California Renewable Energy Center
U.S. Offshore Bathymetry Source: Schwartz et al., 2010

California Renewable Energy Center
U.S. Raw Wind Potential Source: Elliott et al., 2011
GW by Depth (m)
Region 0-30m 30-60m >60m Total
New England 100.2 136.2 250.4 486.8
Mid-Atlantic 298.1 179.1 92.5 569.7
South Atlantic Bight 134.1 48.8 7.7 190.7
California 4.4 10.5 573.0 587.8
Pacific Northwest 15.1 21.3 305.3 341.7
Great Lakes 176.7 106.4 459.4 742.5
Gulf of Mexico 340.3 120.1 133.3 593.7
Hawaii 2.3 5.5 629.6 637.4
Total 1,071.2 627.9 2,451.2 4,150.3

California Renewable Energy Center
2 - 129
Offshore Wind Operating Environment
Source: NREL
California Renewable Energy Center
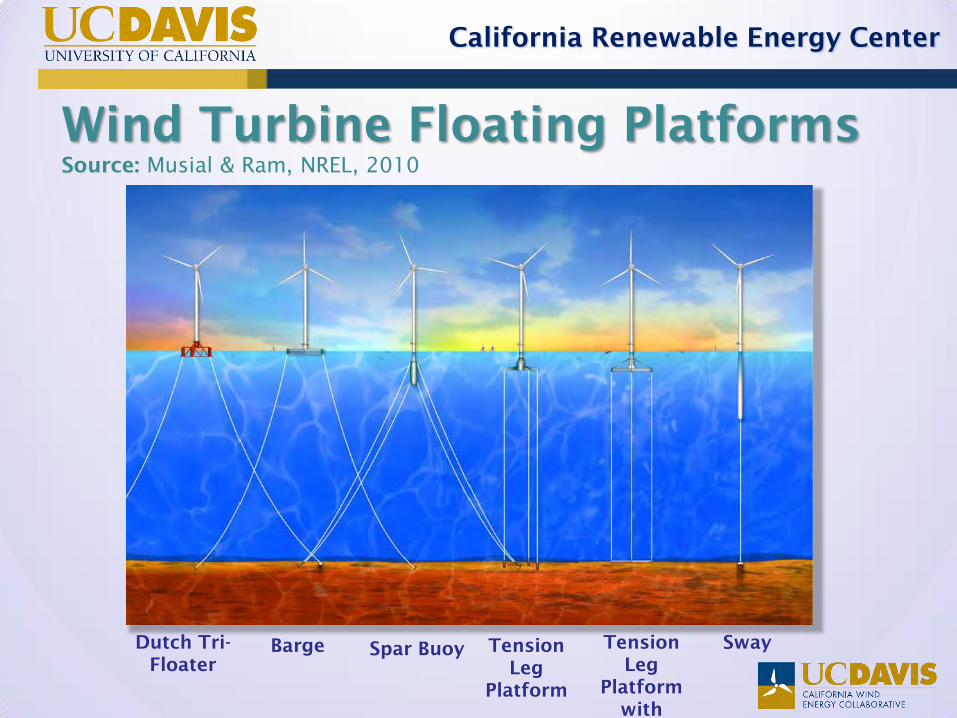
Wind Turbine Floating Platforms Source: Musial & Ram, NREL, 2010
Dutch Tri-
Floater
Barge Tension
Leg
Platform
Tension
Leg
Platform
with
Gravity
Foundation
Sway Spar Buoy
California Renewable Energy Center
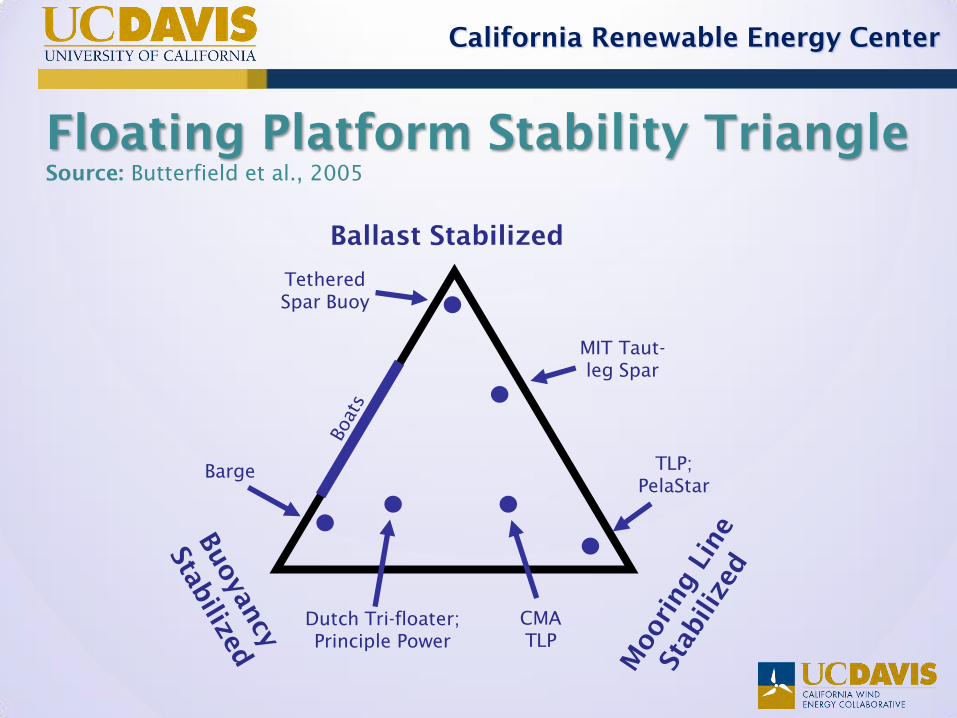
Floating Platform Stability Triangle Source: Butterfield et al., 2005
Ballast Stabilized
Tethered
Spar Buoy
MIT Taut-
leg Spar
Dutch Tri-floater;
Principle Power
Barge
CMA
TLP
TLP;
PelaStar

California Renewable Energy Center
Statoil Hywind
Turbine rated
capacity 2.3 MW
Turbine weight 138 tons
Draft hull 100 m
Nacelle height 65 m
Rotor diameter 82.4 m
Water depth 200 - 220 m
Displacement 5300 m3
Mooring 3 lines
Diameter at
water line 6 m
Diameter of
submerged
body
8.3 m
Nov 2013: The Crown Estate
approved lease for 30MW Hywind
project 20-30 km off Scotland
California Renewable Energy Center
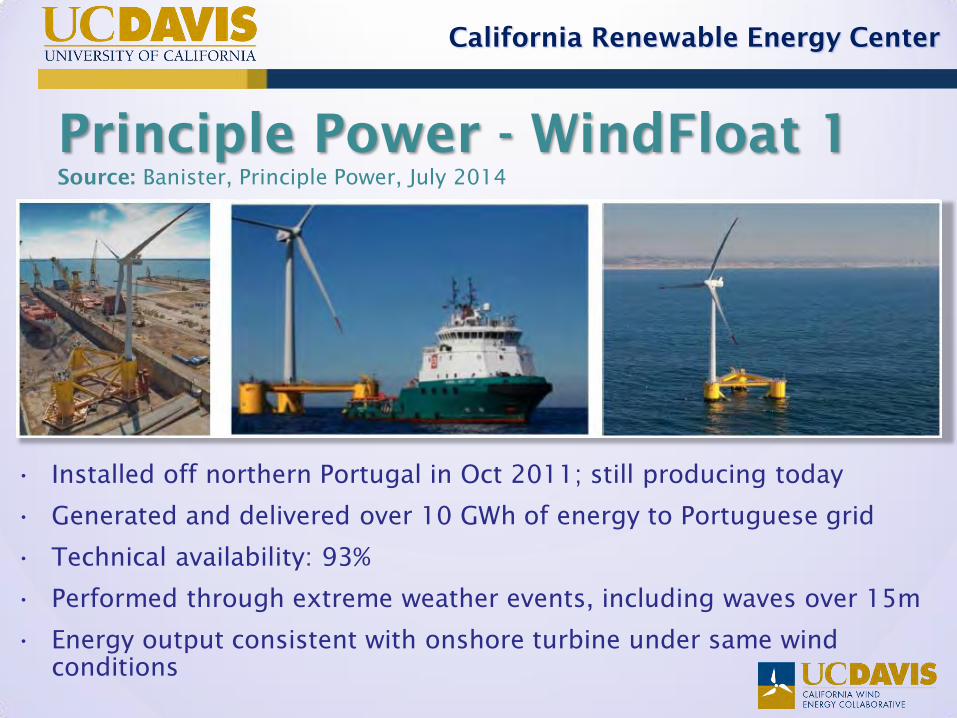
Principle Power - WindFloat 1 Source: Banister, Principle Power, July 2014
• Installed off northern Portugal in Oct 2011; still producing today
• Generated and delivered over 10 GWh of energy to Portuguese grid
• Technical availability: 93%
• Performed through extreme weather events, including waves over 15m
• Energy output consistent with onshore turbine under same wind
conditions

California Renewable Energy Center
Comparison WF-1 and WF-2 Source: Banister, Principle Power, July 2014

California Renewable Energy Center
Principle Power Project Site Source: Banister, Principle Power, July 2014
• Lease application filed
with BOEM on 14 May
2013
• Lease issuance target
Q2 2015
• Commissioning target
before end 2017
• Approx. 18 miles
offshore
• Project will be in about
350+ meters (1,200 ft)
of water
• Generally sandy/silly
bottom

California Renewable Energy Center
California Offshore Wind
Power Forum 2013
June 11 & 12, 2013
University of California - Davis
Davis, California
The University of California, Davis and the California Energy Commission
hosted a two day symposium to explore the future of offshore wind power
off the coast of California. The Forum featured four panels of expert
speakers discussing regulatory, environmental, technical, and economic
challenges and opportunities. Drawing upon experience from overseas,
other states, and other industries, they looked at how California can
effectively and responsibly proceed to harness the abundant winds off its
shores.
The proceedings of the Forum, including presentations are available at:
http://cwec.ucdavis.edu/presentation/california-offshore-wind-power-
forum/

California Renewable Energy Center
California Offshore Wind Power Forum Takeaways - General • Internationally, offshore wind power is growing fast with
roughly 5 GW capacity installed, almost all in shallow water.
• The Department of Energy (DOE) and Department of Interior’s
National Offshore Wind Strategy includes the following goals:
– 10 GW deployed by 2020 at $0.10 per kWh
– 54 GW deployed by 2030 at $0.07 per kWh
• First commercial projects in the United States are moving
forward on the East Coast. Cape Wind is approaching
construction.
• California contains a sizable offshore wind resource which
could provide 661 TWh annually.

California Renewable Energy Center
California Offshore Wind Power
Forum Takeaways - Regulatory Issues
• California’s regulatory process is complex and lengthy, involving numerous
federal, state, and local agencies and a wide array of stakeholders.
• The Bureau of Ocean Energy Management (BOEM), a federal agency, is the lead
for offshore leasing in federal waters (in general, more than three nmi beyond
shore).
• At the state level, a number of agencies would be involved including the State
Lands Commission, the Ocean Protection Council, and Fish and Wildlife.
• As part of their “Smart from the Start” initiative, BOEM facilitates working with
state and local agencies by establishing interagency state task forces.
– Twelve state task forces have been established so far, including Oregon and Hawaii,
but not California.
– To establish a task force, the state governor’s office must initiate contact with BOEM.
– Experience from past efforts with marine protected areas in California can be applied
to marine spatial planning today.
• Regulatory and permitting lessons and best practices can be gleaned from
Europe and the East Coast.

California Renewable Energy Center
California Offshore Wind Power Forum
Takeaways - Technology Issues
• California’s deep waters will require floating
platforms for wind turbines. This technology is still in
the prototype stage.
• Floating platforms have converged upon three
primary configurations.
• Two full-scale wind turbines have been deployed on
floating platforms. A number of reduced-scale
floating turbines have also been demonstrated.
• Principle Power has received DOE funding toward
development of a floating wind power demonstration
project off the Oregon coast.

California Renewable Energy Center
California Offshore Wind Power Forum
Takeaways - Environmental Issues
• Environmental baseline data is needed for potential
offshore wind energy development areas, including
information on coastal processes, birds, fish, marine
mammals, noise, and electromagnetic fields.
• Pacific Northwest National Laboratory maintains
TETHYS, a database of potential environmental impacts
from offshore wind development.
• Studies are ongoing to address information gaps; many
opportunities for collaboration.
• California can leverage experience from the state’s
earlier efforts with assessing wave energy.

California Renewable Energy Center
Environmental Impacts: Construction Source: Van der Wal et al., WindSpeed, 2009

California Renewable Energy Center
Environmental Impacts: Operation Source: Van der Wal et al., WindSpeed, 2009

California Renewable Energy Center
Marine Development Parties in CA
(Selected agencies)
• Bureau of Ocean Energy
Management
• California Governor’s Office
• California Energy Commission
• California Public Utilities
Commission
• California Fish and Wildlife
• U.S. Fish and Wildlife
• National Oceanic and
Atmospheric Administration
– National Marine Fisheries
Services
– National Marine Sanctuaries
– Office of Ocean and Coastal
Resource Management
• California State Lands
Commission
• California State Parks
• National Park Service
• U.S. Defense Department
– Army
– Navy
– Air Force
– Coast Guard
• Ocean Protection Council
• California Coastal Commission
• Federal Energy Regulatory
Commission
• County agencies

California Renewable Energy Center
Final Observations: Offshore Wind
• Great Opportunity:
– Bountiful energy resource
– Near load centers
– Benefits from extensive
onshore technical and
regulatory experience
– Leverage experience from
other industries
• Oil and gas industry
• Great Challenge:
– Young industry
– Costs are currently high
– Lack of established
infrastructure
• Coastal facilities
• Ships
– Cost challenges
• Larger turbines
• Deep water /floating platforms
• Maintenance
– New environmental
considerations
– Complex regulatory process
with limited experience

California Renewable Energy Center
Final Observations: CA Offshore Wind
• Future of California offshore wind power
depends on:
– California’s Renewables Portfolio Standard
beyond 2020: 50% RPS?
– Willingness of industry to deal with many
regulatory hurdles facing offshore renewable
power development in California
– Cost of offshore renewable energy compared to
land-based renewables; particularly solar PV

California Renewable Energy Center
9:00 Introduction and Overview
9:15 Integrated assessment of renewable technology options
10:15 Break
10:30 Assessment of Co-located renewable generation potential
11:00 Assessment of geothermal in under-served regions
11:30 Solar heating and cooling technology analysis
Noon Lunch
1:15 California off-shore wind technology assessment
1:45 Technical assessment of small hydro
2:15 Biomass resources and facilities database update
2:45 Break
3:00 Assessment of sustainability for new/existing biomass energy
3:30 Biomass/MSW gap assessment and tech options for biogas clean-up
4:15 Future research recommendations
4:45 Closing
California Renewable Energy Center
Technical Assessment of Small
Hydro Power Technologies

California Renewable Energy Center
Technical Assessment of In-conduit Small Hydro Power Technologies
The goal of this study is to investigate and assess available
small hydro power generation technologies and associated
operating and performance parameters.
Objectives:
• Small Hydro Technology Inventory
• Simulation Needs for Quantitative Evaluation of In–Conduit Small
Hydropower
• Evaluation Criteria to Assess Likely Viability and Usefulness of
New Generation Technologies
• Status and Challenges of In-Conduit Small Hydro Deployment in
California

California Renewable Energy Center
Scope of Small Hydro Technologies
• Small Hydro
(100kW to
30 MW)
• In-Conduit
focus
• Turbine
Technology

California Renewable Energy Center
Survey
• Sample Size: 181 water
agencies
• Responses: 45 water
agencies (~25% response
rate)
• Statistical accuracy
• Survey provided useful
information regarding in-
conduit hydropower
deployment, simulation
needs, incentives, etc.

California Renewable Energy Center
Small Hydro Technology Inventory
• Inventory includes more than 40 small hydropower generation
technologies, most newly developed
• The inventory list contains the following entries:
– Turbine Manufacturers’ Name, Location and Website
– Small icons used to indicate the turbine type
– A head/flow diagram for each turbine (except hydrokinetic devices), as
well as a list of existing projects, if applicable.

California Renewable Energy Center
Pump as Turbine
24
PUMPS-AS-TURBINES
Cornell Pump
Clackamas, OR
http://cornellpump.com/
Cornell pumps are a common choice for small in-conduit hydro in California as well as other states. The company’s primary products are pumps for a variety of applications including municipal water systems. When operated in reverse, the centrifugal pumps are marketed as reaction turbines.
Selected Projects
Cox Avenue, Saratoga, CA (2011) – 110 kW – two PATs
Burbank, CA (2002) – 300 kW – two PATs replacing a pressure release valve at a pumping station
A lameda, CA (1993) – 1,250 kW – six PATs in supply l ine to a water treatment plant
Planned Projects
Rialto, CA – 310 kW – two PATs on pipeline entering water treatment plant
University Mound, San Francisco, CA – 240 kW – three PATs in water delivery pipeline
DIFGEN
Zeropex
Stavanger, Norway
http://www.zeropex.com
The Difgen system includes a turbine, generator, and control system for installation in water delivery systems. The turbine is a positive displacement rotary lobe pump operating in reverse. The Difgen received ANSI/NSF 61 certification for use in drinking water systems.
Installed Projects
Denny, Scotland (2013) – 400 kW – Difgen system along water main
Devon, England (2012) – 120 kW – turbine at water treatment plant
Pen y Cefn, Wales (2012) – 17 kW – turbine at water treatment plant
Planned Projects
Avenal, CA – 110 kW – Difgen system replacing storage tank in water distribution system
Surveyed Water
Agencies

California Renewable Energy Center
Simulation Needs for Quantitative Evaluation
of In–Conduit Small Hydropower
Do you use any software tools to
simulate your water distribution system?

California Renewable Energy Center
Simulation Needs for Quantitative Evaluation
of In–Conduit Small Hydropower
Simulating Water Distribution Networks (e.g. as InfoWater, H2ONet, H2OMap, EPANET, etc. )
• EPANET is a free software tool
from the EPA, designed to
model water distribution
networks
• Outputs include flow, head,
pressure, velocity, chemical
concentration…
• Further developments for in-
conduit small hydro simulation
needs (ex: Cavitation)

California Renewable Energy Center
Simulation Needs for Quantitative Evaluation
of In-Conduit Small Hydropower
• Cavitation in hydroturbines
– Nucleation
– Cavitation in Steady Flow
– Types of Cavitation
– Effects of Cavitation
– Cavitation Modeling
– Numerical Modeling
– Choosing a Numerical Model
• Scaling issues
• Noise and material damage
• Effect on water quality
Cavitating vortex in the draft
tube of a Francis turbine.
[P.Henry, Institut de Machines Hydrauliques et de Mecanique de Fluides, Ecole Polytechnique Federal de Lausanne, Switzerland, reproduced in Brennan, 1995.]

California Renewable Energy Center
Turbine Performance Metrics
• Non-dimensional parameters
1) Efficiency
2) Cavitation or Thoma number
3) Specific speed
• Usefulness (Measurements:
ASME PTC 18-2011)
1) Head
2) Flow (discharge)
3) Power output
4) Size
5) Reaction Ratio
Efficiency curves for common
turbine types at partial flow rates.
(Kumar et al., 2011)

California Renewable Energy Center
Turbine Performance Metrics
(F.M. White, Fluid Mechanics, 7th Ed, McGrawHill 2011)
gH = f1(bhp,D,n,r,m,e) Q = f2(bhp,D,n,r,m,e)
Quantities of Interest
Q
nD3= g2
bhp
rn3D5,rnD2
m,e
D
æ
èç
ö
ø÷
gH
n2D2= g1
bhp
rn3D5,rnD2
m,e
D
æ
èç
ö
ø÷
CH » g1 CP( ) CQ » g2 CP( )
Efficiency and Power Specific Speed
h =
bhp
rgQH=h(CP ) N 'sp =
n bhp
r gH( )5/4

California Renewable Energy Center
Standards
• Performance
• Implementation
• Water quality
• Testing
What standards does new
hydroelectric equipment
need to meet?

California Renewable Energy Center
Deployment in California
• Map – Data sources: RPS eligible facility
list, FERC eLibrary, SGIP quarterly
reports, water agencies websites.
• 27% of surveyed water agencies have
small hydro turbines currently
installed.
closed conduits (pipes);
open conduits (canals, etc.);
installed at existing dams;
inactive projects

California Renewable Energy Center
Factors that prompt a district to install
a small hydroturbine on its network
How is the power
from existing or new
hydro turbines used?
Decision basis
to install a
hydro turbine
Deployment in California

California Renewable Energy Center
Summary
Findings:
• Hydroturbine Technologies – Goal: reduce cost or complexity for smaller
sites (Pumps-as-turbines; Wind-Turbine inspired design )
• Design standardization rather than customization
• Performance scaling issues (cavitation)
• Current deployment of in-conduit small hydro is relatively low (10-25%)
Future Research Needs:
• Independent testing facilities (e.g. improve understanding of performance of PATs)
• Adaptation of existing water distribution network simulation tools needs to
accommodate in-conduit small hydro specificity
• Investigation of generators adapted to small-hydro
• Project analysis tool adapted to in-conduit small hydro
California Renewable Energy Center
9:00 Introduction and Overview
9:15 Integrated assessment of renewable technology options
10:15 Break
10:30 Assessment of Co-located renewable generation potential
11:00 Assessment of geothermal in under-served regions
11:30 Solar heating and cooling technology analysis
Noon Lunch
1:15 California off-shore wind technology assessment
1:45 Technical assessment of small hydro
2:15 Biomass resources and facilities database update
2:45 Break
3:00 Assessment of sustainability for new/existing biomass energy
3:30 Biomass/MSW gap assessment and tech options for biogas clean-up
4:15 Future research recommendations
4:45 Closing
California Renewable Energy Center
Resources and Facilities
Database Update
Steve Kaffka
Rob Williams

Biomass Resource Update • 2014 Update (2012 data) completed in March
• Will produce a 2015 update (2013 data) in Fall
• Estimates Annual Gross and Technical Biomass Resource – Bone-dry tons per year (BDT/Y)
– Electric capacity and energy generation potential (MW, TWh/y)
– Statewide biogas potential
• Resource Categories: Urban, Agriculture & Food Processing, Forest / Forest Products
• Residues and forest “over growth” – energy crops not modeled here
• Aggregated at County Level

Gross vs. Technical Resource • Gross Resource
– Total mass of residue/forest biomass estimated for each category
• Technical Resource – Practical to recover and in a
– “Sustainable” manner • Excludes steep slope & riparian zones in forest
• Portion of agricultural residue left in field for organic matter in soil, erosion mitigation,
• etc.
• No economic filter applied • Amount that can be recovered economically is less than the
technical resource (much less for forest based material)
• Depends on use and markets

Results
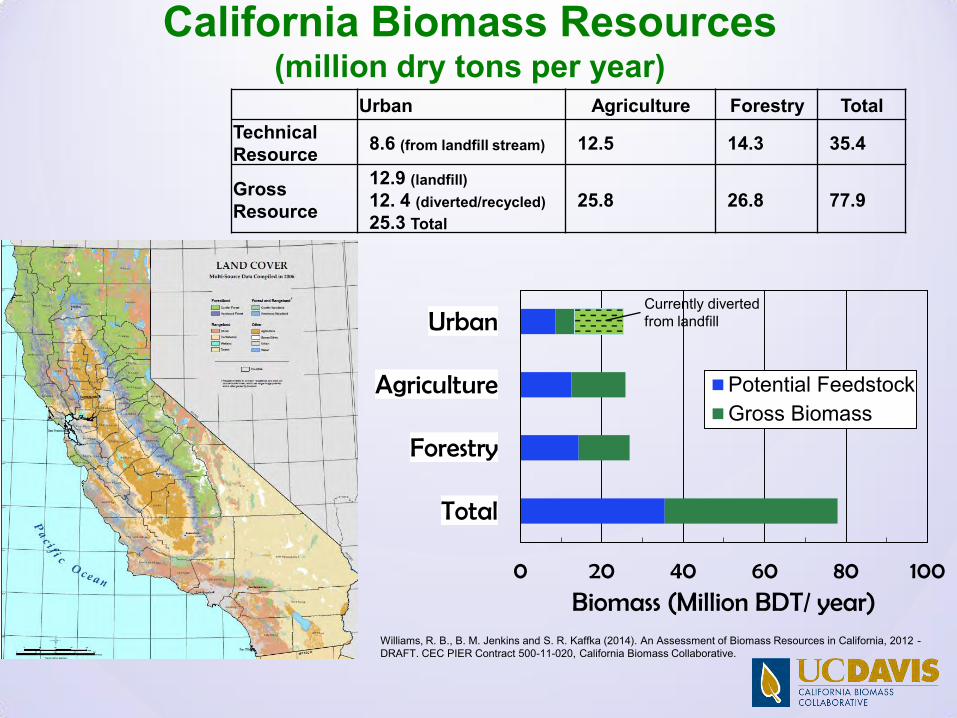
California Biomass Resources (million dry tons per year)
Urban Agriculture Forestry Total
Technical Resource
8.6 (from landfill stream) 12.5 14.3 35.4
Gross Resource
12.9 (landfill) 12. 4 (diverted/recycled)
25.3 Total
25.8 26.8 77.9
Williams, R. B., B. M. Jenkins and S. R. Kaffka (2014). An Assessment of Biomass Resources in California, 2012 - DRAFT. CEC PIER Contract 500-11-020, California Biomass Collaborative.
0 20 40 60 80 100
Total
Forestry
Agriculture
Urban
Biomass (Million BDT/ year)
Potential FeedstockGross Biomass
Currently diverted from landfill

California Biomass Resources (Technical Electric Energy Potential)
0 10 20 30 40
Total
Forestry
Urban
Agriculture
(TWh/y)
Technical ElectricalEnergy (TWh)
0 1,000 2,000 3,000 4,000 5,000
Total
Forestry
Urban
Agriculture
(MW)
Technical ElectricalCapacity (MWe)
Feedstock
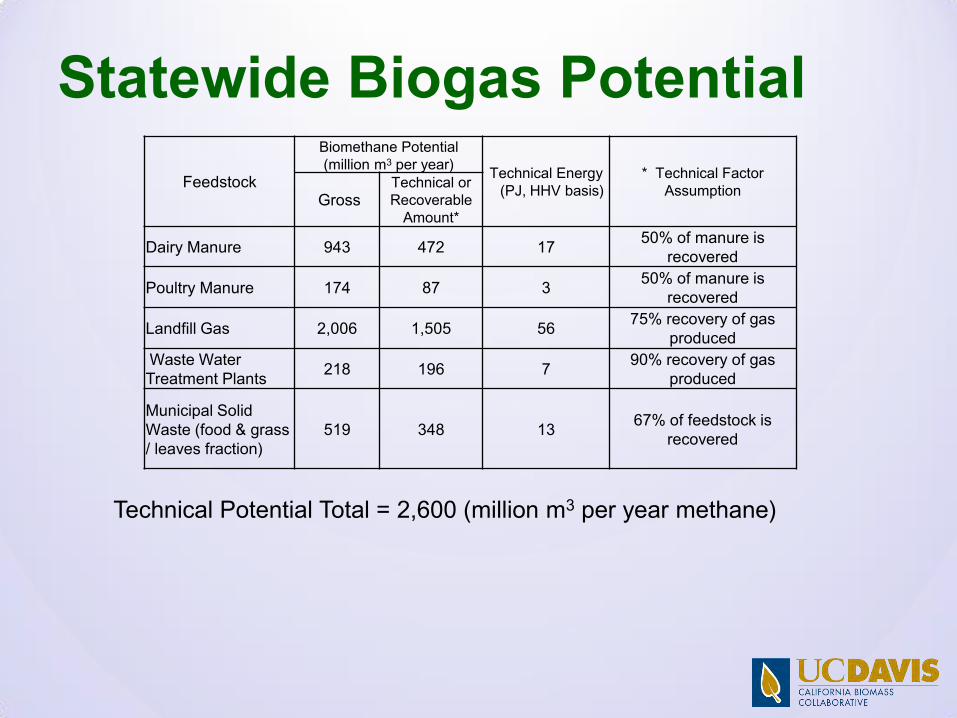
Biomethane Potential (million m3 per year)
Technical Energy (PJ, HHV basis)
* Technical Factor Assumption
Gross Technical or Recoverable
Amount*
Dairy Manure 943 472 17 50% of manure is
recovered
Poultry Manure 174 87 3 50% of manure is
recovered
Landfill Gas 2,006 1,505 56 75% recovery of gas
produced
Waste Water Treatment Plants
218 196 7 90% recovery of gas
produced
Municipal Solid Waste (food & grass / leaves fraction)
519 348 13 67% of feedstock is
recovered
Technical Potential Total = 2,600 (million m3 per year methane)
Statewide Biogas Potential

PJ
(LHV basis)§
Agricultural
Residue
(Lignocellulosic)
5.4 M BDT a - 272 h 32.7
Animal Manure 3.4 M BDT a 11.8 a 102 i 12.3
Fats, Oils and
Greases 207,000 tons b(assume
conversion to biodiesel)
56 j 6.7
Forestry and Forest
Product Residue14.2 M BDT a - 710 h 85.4
Landfill Gas 106 BCF a 53 f
457 i 55
Municipal Solid
Waste (food waste
fraction)
0.94 M BDT c 10 g 86 i 10.3
Municipal Solid
Waste
(lignocellulosic
fraction)
7.0 M BDT d - 350 h 42.1
Waste Water
Treatment Plants11.8 BCF (gas) e 7.7 k 66 i 7.9
Total 2,100 252.5
Amount
Technically
Available
Biomethane Potential (billion
cubic feet)
Biofuel Potential
(million gge)
Feedstock
* Diesel gallon equivalents can be estimated by multiplying gge by 0.89; Notes and Sources for Table 58:M BDT = million bone dry (short) tonsBCF = billion cubic feet a. Williams, R. B., B. M. Jenkins and S. Kaffka (California Biomass Collaborative). 2014. An Assessment of Biomass Resources in California, 2012 – DRAFT. Contractor Report to the California Energy Commission. PIER Contract 500-11-020. b. From: Wiltsee, G. (1999). Urban Waste Grease Resource Assessment: NREL/SR-570-26141. Appel Consultants, Inc. 11.2 lbs./ca-y FOG and California population of 36.96 million. Biodiesel has ~9% less energy per gallon than petroleum diesel. c. Technical potential assumed to be 67% of amount disposed in landfill (2012). Reference (a) uses a 50% technical recovery factor for MSW stream going to landfill, however it is not unreasonable to assume higher recovery factors as market value of bioenergy product increases or for cases where biomass does not need to be separated before conversion. (waste characterization and disposal amounts are from: http://www.calrecycle.ca.gov/Publications/General/2009023.pdf) d. 67% of mixed paper, woody and green waste and other non-food organics disposed in landfill (2012). Note (c) discusses rational for using a higher technical recovery factor than that assumed for MSW in reference (a). (waste characterization and disposal amounts are from: http://www.calrecycle.ca.gov/Publications/General/2009023.pdf) e. From EPA Region 9; Database for Waste Treatment Plants f. Assumes 50% methane in gas g. Assumes VS/TS= 0.83 and biomethane potential of 0.29g CH4/g VS h. Using 50 gge per dry ton (75 gallons EtOH per dry ton) yield. See, for example: Anex, R. P., et al. (2010). Techno-economic comparison of biomass-to-transportation fuels via pyrolysis, gasification, and biochemical pathways. [Article]. Fuel, 89, S29-S35. doi: 10.1016/j.fuel.2010.07.015 i. ~116 ft^3 methane is equivalent to 1 gge (983 Btu/scf methane and 114,000 Btu/gallon gasoline, lower heating value basis) j. 7.5 lbs FOG/ gallon biodiesel. Biodiesel has ~9% less energy per gallon than petroleum diesel, gives 50 M gallons diesel equivalent. 1 dge = 1.12 gge Compiled by Rob Williams, University of California, Davis. April 2014 (revised 19 May 2014)
Biofuel Potential (all technical resource)

Methods and Sources – Urban Residues • Uses Disposal Reporting System Database for MSW
(CalRecycle)
• Landfill stream waste characterization (Cascadia – 2008) (about 60% mass of waste stream is/was biomass)
• 2012 landfill disposal amount: Gross Resource
• Technical Recovery Factor: 0.67 (for biomass material in current landfill disposal stream)
• Energy content for each component of waste stream from literature (MJ/kg)

a) California waste stream composite data (http://www.calrecycle.ca.gov/Publications/Detail.aspx?PublicationID=1346), & California Solid Waste Generation and Diversion (http://www.calrecycle.ca.gov/LGCentral/GoalMeasure/DisposalRate/Graphs/Disposal.htm) Accessed April, 2013 b) Adapted from Tchobanalglous, G., Theisen, H. and Vigil, S.(1993),"Integrated Solid Waste Management", Chapter 4, McGraw-Hill, New York & Themelis, N. J., Kim, Y. H., and Brady, M. H. (2002). "Energy recovery from New York City municipal solid wastes." Waste Management & Research, 20(3), 223-233. c) EJ = 10^18 J (exajoule) ) EJ = 10^18 J (exajoule) and is approximately equal to 1 Quad (1 Q = 1.055 EJ) d) Electricity generation calculations assume thermal conversion means for low moisture stream (paper/cardboard, other organics, C&D Lumber, all plastics and textiles) and biological means (anaerobic digestion) for the high moisture components (food and green waste). Energy efficiency of conversion of matter to electricity by thermal means is assumed to be 20%. Biomethane potentials of 0.29 and 0.14 g CH4/g VS for food and leaves/grass mixure respectively are assumed for biogas production which is converted at 30% thermal efficiency in reciprocating engines. Capacity factor of 1 is used. e) Note: updated to show 2012 disposal amount of 29.3 million tons + 1.6 Mtons of green ADC.- http://www.ciwmb.ca.gov/lgcentral/DRS/Reports/Statewide/ADCMatlTyp.asp
Solid Waste Landfill Stream: Components and Energy Table (MSW Gross Resource)
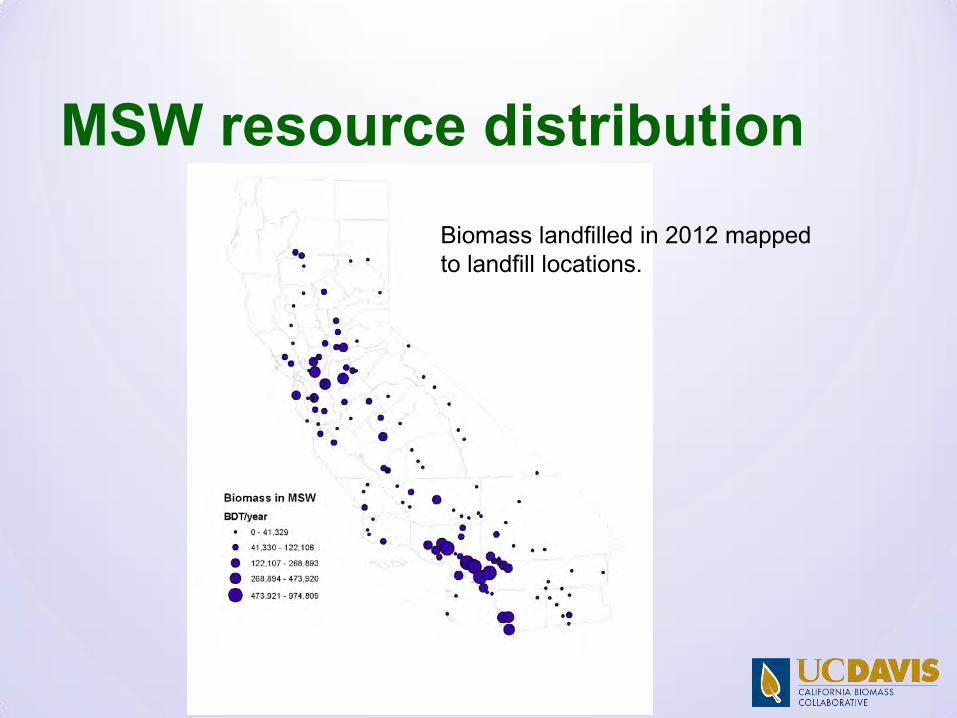
MSW resource distribution
Biomass landfilled in 2012 mapped to landfill locations.

Methods and Sources – Urban Residues: Landfill and Wastewater Treatment Biogas
• Landfill gas production is estimated based on existing waste-in-place (WIP) using a first order waste decay model (similar to USEPA LandGEM) – Gross Resource: gas production from annual disposal since 1970 or 1.2
billion tons WIP (some data show1.4 billion tons WIP since 1940)
– Technical recovery factor = 0.75
• Wastewater Treatment Biogas – Based on average daily flow to facilities with digesters
• Flow data from Greg Kester, California Association of Sanitation Agencies (CASA)
– 1.15 cubic feet biogas / 100 gallons wastewater inflow (a USEPA factor)
– Technical recovery factor = 0.90 (maybe too conservative)

Methods and Sources – Agricultural Residues

Methods and Sources – Agricultural Residues • Crop residues
– Straw, stover, orchard & vineyard prunings, etc.
• Animal manures
• Food & fiber processing residue – Primarily nut shells and hulls
– Meat processing, other pits and hulls
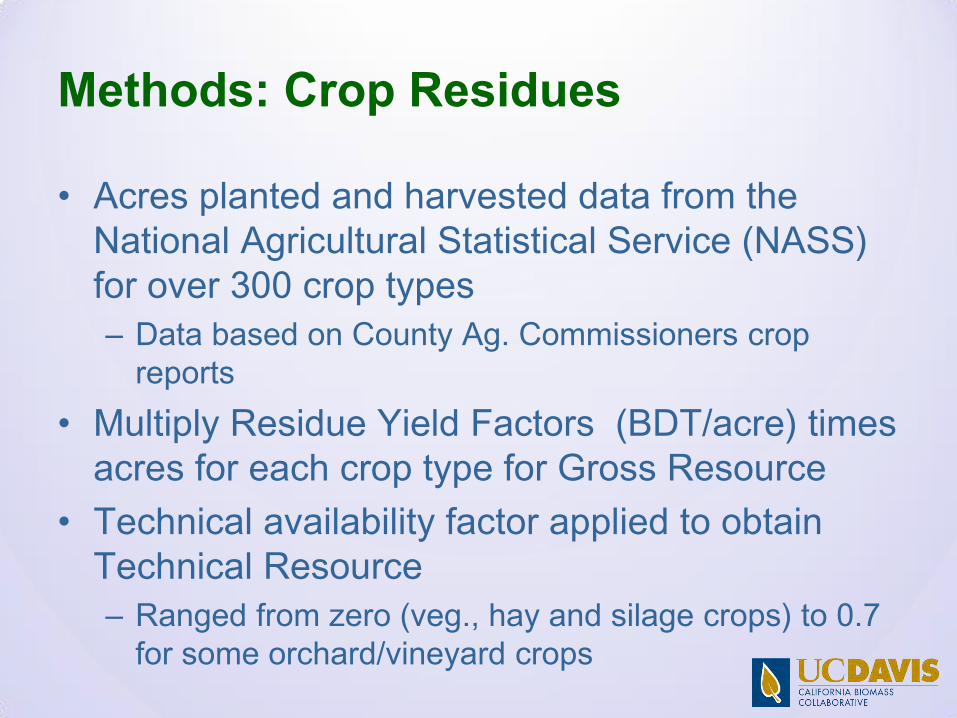
Methods: Crop Residues
• Acres planted and harvested data from the National Agricultural Statistical Service (NASS) for over 300 crop types – Data based on County Ag. Commissioners crop
reports
• Multiply Residue Yield Factors (BDT/acre) times acres for each crop type for Gross Resource
• Technical availability factor applied to obtain Technical Resource – Ranged from zero (veg., hay and silage crops) to 0.7
for some orchard/vineyard crops

Methods: Food and Fiber Processing Residues
• Apply residue yield factors based on food/fiber production amount (rather than acres harvested) – ie., Almond Shell yield factor =0.6 lbs./lb.
almond meat (gross resource)
• Technical yield factors generally 80% for this class

Methods: Animal Manures
• Daily animal manure production and number of animals used to determine gross resource – ASAE D384.2 MAR2005 (R2010), Manure Production
Characteristics (ASABE).
• Technical recovery factors ranged from 0.2 (beef and other cattle) to 0.5 (dairy and poultry) [dairy/poultry are conservative]
(lb/animal-
day)
(lb/animal-year)
Statewide (BDT/y)
(lb/animal-day)
(lb/animal-year)
Dairy Cows - Lactating & Dry
1,779,710 140 87 18.7 6,807 6,057,465 15.83 5,778
Beef Cows 620,000 125 88 15.0 5,475 1,697,250 13.00 4,745Other Cattle (cow replacements & heifers)
3,054,680 50 88 6.0 2,190 3,344,875 5.00 1,825
Swine -growing/finishing 105,000 10 91 1.0 365 19,163 0.85 310Poultry (Layer Chickens) 19,717,000 0.20 75 0.05 17.9 176,319 0.04 13
Poultry (Broiler Chickens) 37,978,429 0.22 74 0.06 21.3 404,312 0.04 16
Poultry (Turkeys) 5,839,465 0.58 74 0.15 55 160,256 0.12 44Total 69,094,284 11,860,000
Animal type
Total Solids (TS) Volatile Solids (VS)Number in California Inventory
Total Wet Manure
(lb/animal-day)
Moisture Content (% wb)

Agricultural Residues, Technical Resource • Distribution by category – 12.5 million dry tons per year

Methods and Sources – Forest & Forest Product Residues
• Using same forest biomass resource data used in all previous CBC Resource Updates – 2005 CDFFP Fire and Resource Assessment
Program (FRAP)*
– Inventory of non merchantable forest biomass and shrubland with 70 or 100 year turn-over assumptions (1/70, 1/100 of inventory available annually – Gross Resource)
– Technical Resource • Excludes steep slope & riparian zones
• Wilderness and National Park areas
• Other administrative or regulatory constraints
*Rosenberg, M., J. Spero, and D. Cromwell, (2005). Biomass potentials from California forest and shrublands including fuel reduction potentials to lessen wildfire threat; Draft PIER Consultant Report, Contract 500-04-004. California Department of Forestry and Fire Protection

Methods and Sources – Energy Generation Potential
• Relatively dry material is assumed to be converted via thermal means (combustion / gasification) – Overall conversion efficiency of 20% (HHV basis) is assumed (electric
energy / feedstock energy)
• Typically wet or moist feedstocks (animal manures, food and some green waste components) are assumed converted via anaerobic digestion – Biomethane potential and/or volatile solids content are used from
literature sources for biogas production
– Biogas converted to electricity at 30% (HHV) efficiency

California Biomass Resources (Electric Energy Potential)
0 10 20 30 40
Total
Forestry
Urban
Agriculture
(TWh/y)
Technical ElectricalEnergy (TWh)
0 1,000 2,000 3,000 4,000 5,000
Total
Forestry
Urban
Agriculture
(MW)
Technical ElectricalCapacity (MWe)
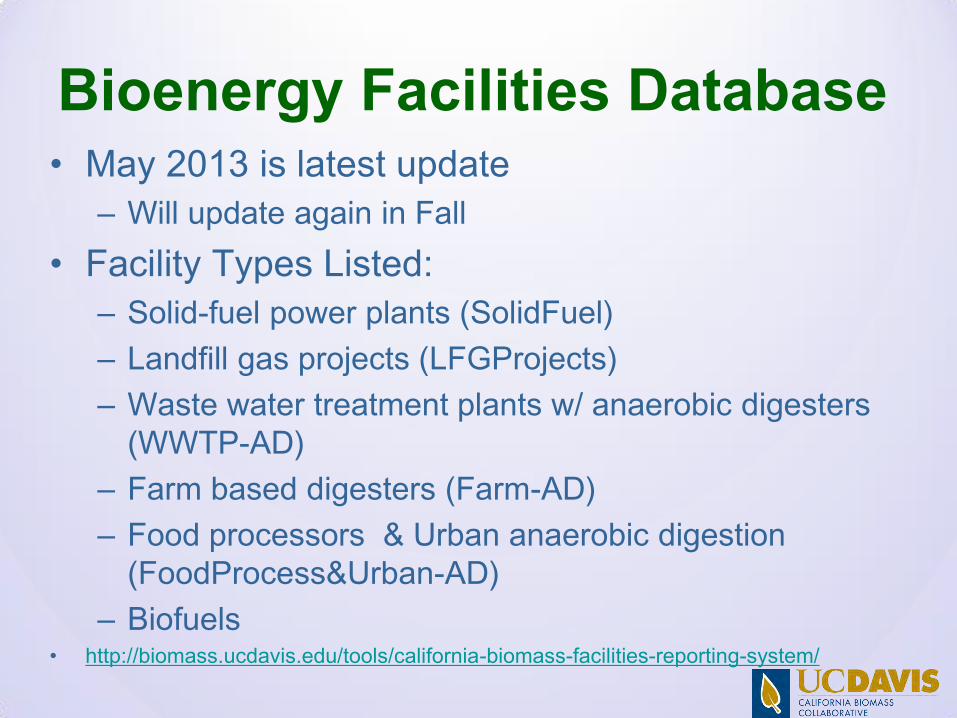
Bioenergy Facilities Database • May 2013 is latest update
– Will update again in Fall
• Facility Types Listed: – Solid-fuel power plants (SolidFuel)
– Landfill gas projects (LFGProjects)
– Waste water treatment plants w/ anaerobic digesters (WWTP-AD)
– Farm based digesters (Farm-AD)
– Food processors & Urban anaerobic digestion (FoodProcess&Urban-AD)
– Biofuels • http://biomass.ucdavis.edu/tools/california-biomass-facilities-reporting-system/

Bioenergy Facilities Database
Category Foundation dataset
SolidFuel Woody Biomass Utilization, UC Berkeley, California , Sierra Nevada Conservancy (community scale bioenergy updates)
LFGProjects Scott Walker, CalRecycle and Solid Waste Information System (SWIS), US EPA, Landfill Methane Outreach Program (LMOP)
WWTP-AD U.S. Environmental Protection Agency, Region 9
Farm-AD California Air Resources Board (CARB), US EPA, AgSTAR Program
FoodProcess&Urban-AD
Ricardo Amon, et al. CBC 2011, Jacques Franco, CalRecycle
Biofuels Renewable Fuels Association, Industry ethanol facilities National Biodiesel Board, biodiesel facilities
Primary Data Sources

CGEC
Bioenergy Facilities Database Net (MW) Facilities
574.6 27371.3 7987.8 563.8 110.7 2
1038 175
63 3
Direct-use (MMscfd)
LNG/CNG (gpd)
Facilities
LFG Projects 24.7 11LFG Projects 18,000 2WWTP Facilities 26.8 3Farm AD Capacity ?? 1FoodProcess/Urban AD 20.4 7FoodProcess/Urban AD Capacity ?? 1Total 25
(MGY) Facilities179 4
62.1 13241.1 17
Solid Fuel (woody& ag.)
Bio
po
wer
EtOHBiodiesel
TotalsBio
fuel
sB
iog
as:
Dir
ect-
use
or
CN
G/L
NG
LFG ProjectsWWTP FacilitiesFarm ADFoodProcess/Urban ADTotals
Solid Fuel (MSW)

CGEC
Bioenergy Facilities Database

California Renewable Energy Center
Assessment of Sustainability
for Existing/New Biomass
Steve Kaffka
Rob Williams

California Renewable Energy Center
Biomass-Task 4 Contract #500-11-020

California Renewable Energy Center
Category Units Agriculture ForestryMunicipal
WastesTotal
Gross Resource Million BDT/y 25.8 27 25 78
Technical Resource Million BDT/y 12.5 14.3 8.6 35
Gross Electrical Capacity MWe 2440 3580 3860 9,880
Technical Electrical Capacity MWe 1015 1907 1712 4,630
Gross Electrical Energy TWh 16 27 29 71
Technical Electrical Energy TWh 8 14 13 35
• Total or gross estimated biomass is 78 million bone dry tons (BDT) per year. Technical (recoverable) resource is estimated at 35 million BDT/y.
• Roughly 45% of the gross biomass resource is considered to be technically available for conversion or other uses. The remainder occur in sensitive habitat areas, on steep slopes not suitable for harvesting, are needed to maintain soil OM and fertility, or are unrecoverable by harvesting and recovery equipment.
• The 35 million BDT/y technical biomass resource, coupled with biogas generation from organic wastes already in place in landfills and biogas from existing anaerobic digestion facilities represents more than 4,630 MW and 35 TWh of electrical capacity.
• Technical resources includes material currently used in existing bioenergy (~I GW capacity*), feed, mulch, compost, bedding and other markets.
• Availability for energy purposes depends on economic factors such as recovery and transportation costs, conversion technology and permitting/regulatory costs and competition with other end use markets.
*including solid-fuel biomass, landfill gas-to-energy, and digester gas-to-energy. See CBC bioenergy facilities database: http://biomass.ucdavis.edu/files/2013/09/11-20-2013-cbc-facilities-database_1May_2013_update.xlsx. Williams et al., 2014, DRAFT report
Resources and generation potential from biomass in California, 2012 California is biomass –rich: there are large amounts of biomass from urban, forest and agricultural sectors.

California Renewable Energy Center
Table 1: Estimated annual biomass residue amounts and fuel potential for California.
* Diesel gallon equivalents can be estimated by multiplying gge by 0.89
Notes and Sources for Table 56:
M BDT = million bone dry (short) tons
BCF = billion cubic feet
a. Williams, R. B., B. M. Jenkins and S. Kaffka (California Biomass Collaborative). 2014. An Assessment of Biomass Resources in
California, 2012 – DRAFT. Contractor Report to the California Energy Commission. PIER Contract 500-11-020.
b. From: Wiltsee, G. (1999). Urban Waste Grease Resource Assessment: NREL/SR-570-26141. Appel Consultants, Inc. 11.2 lbs./ca-y
FOG and California population of 36.96 million. Biodiesel has ~9% less energy per gallon than petroleum diesel.
c. Technical potential assumed to be 67% of amount disposed in landfill (2012). Reference (a) uses a 50% technical recovery factor for
MSW stream going to landfill, however it is not unreasonable to assume higher recovery factors as market value of bioenergy
product increases or for cases where biomass does not need to be separated before conversion. (waste characterization and disposal
amounts are from: http://www.calrecycle.ca.gov/Publications/General/2009023.pdf)
PJ
(LHV basis)§
Agricultural
Residue
(Lignocellulosic)
5.4 M BDT a - 272 h 32.7
Animal Manure 3.4 M BDT a 11.8 a 102 i 12.3
Fats, Oils and
Greases 207,000 tons b(assume
conversion to biodiesel)
56 j 6.7
Forestry and Forest
Product Residue14.2 M BDT a - 710 h 85.4
Landfill Gas 106 BCF a 53 f
457 i 55
Municipal Solid
Waste (food waste
fraction)
0.94 M BDT c 10 g 86 i 10.3
Municipal Solid
Waste
(lignocellulosic
fraction)
7.0 M BDT d - 350 h 42.1
Waste Water
Treatment Plants11.8 BCF (gas) e 7.7 k 66 i 7.9
Total 2,100 252.5
Amount
Technically
Available
Biomethane Potential (billion
cubic feet)
Biofuel Potential
(million gge)
Feedstock
Source:
Williams et al., 2014
Estimates based on methods used in Task 3: No economic filters, no
purpose-grown crops

California Renewable Energy Center
Task 4 -- Integrated Assessment of Biomass Resources for Power and Fuels: 1. Purpose of integrated assessment (IA); why is it useful?
necessary? 2. Analytical tools and methods; 3. Results for agricultural biomass 4. Forthcoming: (i) biomass from marginal lands (salt-affected areas,
dry farmed regions, other);(ii) biopower from manure-based AD systems and groundwater protection (iii) geospatial assessments of forest biomass and sustainable economic potentials (bio-power focused).
(Results from Task 4 will add to Task 3 value (Biomass data base).

California Renewable Energy Center
Biomass is complicated. There are many possible feedstocks and biomass conversion pathways. Policy and markets influence the pathways and products developed.
• Thermochemical Conversion – Combustion
– Gasification
– Pyrolysis
• Bioconversion – Anaerobic/Fermentation
– Aerobic Processing
– Biophotolysis
• Physicochemical – Heat/Pressure/Catalysts
– Refining
– Makes e.g. Esters (Biodiesel), Alkanes
• Energy – Heat – Electricity
• Fuels – Solids – Liquids – Gases
• Products – Chemicals – Materials
• Production
• Collection
• Processing
• Storage
• Transportation
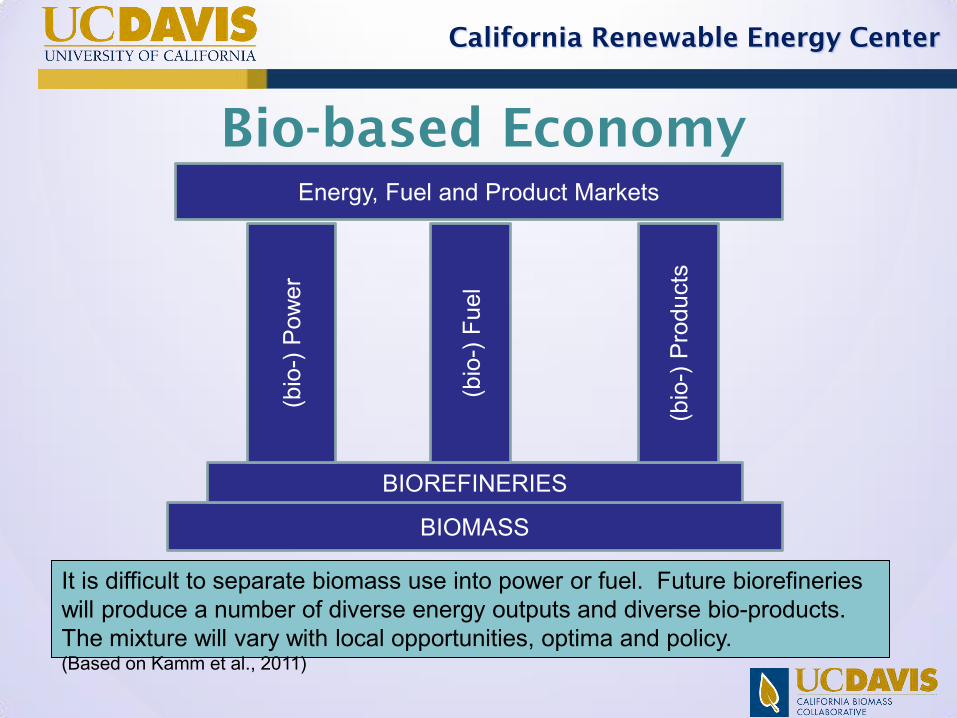
California Renewable Energy Center
BIOMASS
BIOREFINERIES
(bio
-) P
ower
(bio
-) F
uel
(bio
-) P
rodu
cts
Energy, Fuel and Product Markets
Bio-based Economy
It is difficult to separate biomass use into power or fuel. Future biorefineries will produce a number of diverse energy outputs and diverse bio-products. The mixture will vary with local opportunities, optima and policy. (Based on Kamm et al., 2011)
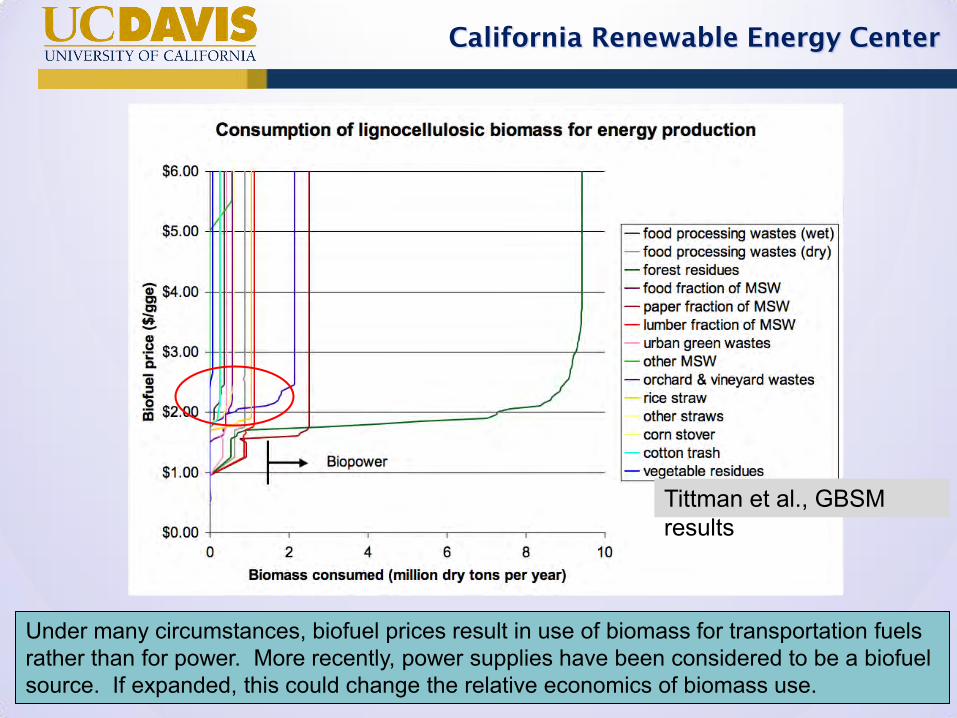
California Renewable Energy Center
Under many circumstances, biofuel prices result in use of biomass for transportation fuels rather than for power. More recently, power supplies have been considered to be a biofuel source. If expanded, this could change the relative economics of biomass use.
Tittman et al., GBSM results

California Renewable Energy Center
“Rising living standards and life expectancy require that some environmental resources are sacrificed in order to create the material well-being that may then enable people to place a higher value on the remaining stock of ecological assets.” Page 254 in Pennington, M. (2011). Robust Political Economy “[Government planning of an economy] always involves a sacrifice of some ends in favour of others, a balancing of costs and results, and this presupposes a complete ranging of the different ends in the order of their importance...” Hayek, F. (1938). Freedom and the Economic System.
Why Integrated Assessments are needed: The use of biomass for energy is commonly linked to significant effects on landscapes and existing economic and social arrangements. New uses may be disruptive and result in emissions or other unanticipated effects. This requires a broad consideration of the potential effects of biomass use. Challenges to governance and management of a broad-scale energy transition are unprecedented, complicated and susceptible to error. Tradeoffs are inevitable and unavoidable. IA provides a broader set of information with respect to new bioenergy systems and policies.
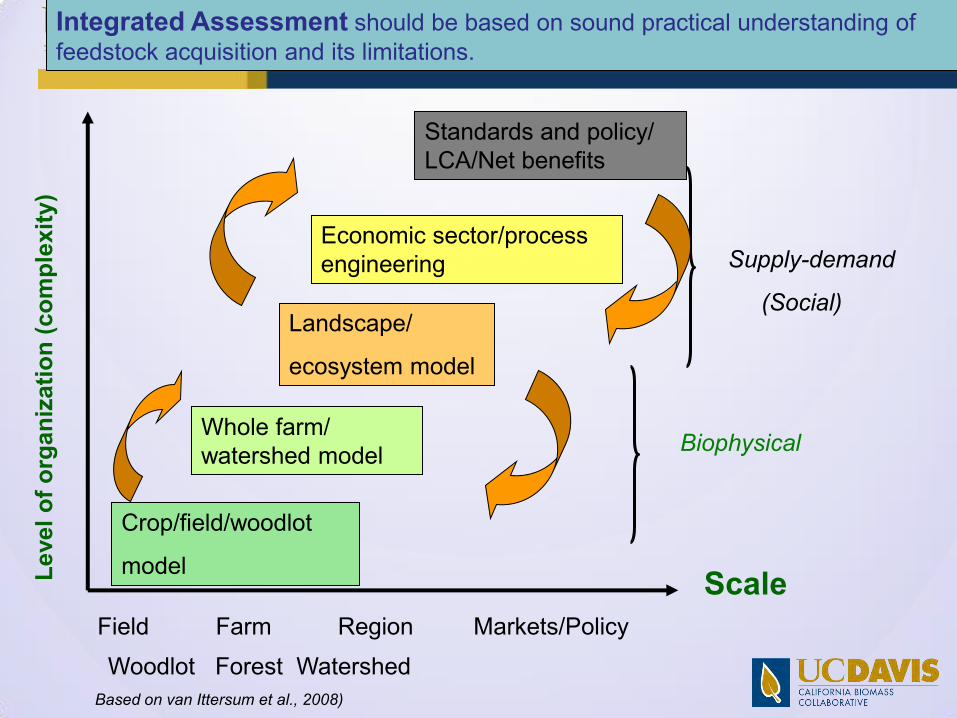
California Renewable Energy Center
Based on van Ittersum et al., 2008)
Biophysical
Supply-demand
(Social)
Lev
el o
f o
rgan
izat
ion
(co
mp
lexi
ty)
Scale
Crop/field/woodlot
model
Whole farm/ watershed model
Field Farm Region Markets/Policy
Economic sector/process engineering
Landscape/
ecosystem model
Standards and policy/ LCA/Net benefits
Woodlot Forest Watershed
Integrated Assessment should be based on sound practical understanding of feedstock acquisition and its limitations.
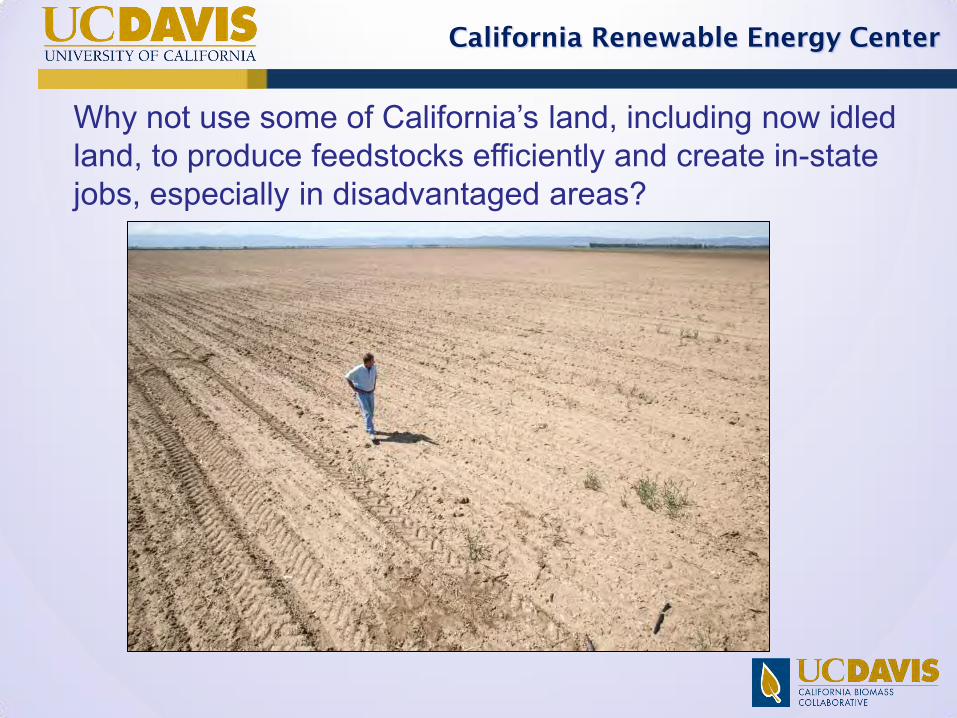
California Renewable Energy Center
Why not use some of California’s land, including now idled land, to produce feedstocks efficiently and create in-state jobs, especially in disadvantaged areas?
California Renewable Energy Center
TASK 4: Can we have in-state agricultural feedstock production for bioenergy in California?
• Stephen Kaffka, Boon-Ling Yeo, Taiying Zhang, Mark Jenner,
• University of California, Davis & California Biomass Collaborative
The approach and methods developed for crop-based energy systems apply to forestry and other biomass feedstock sources.

California Renewable Energy Center
TASK 4: Integrated Assessment- analyses included
• Identification of most likely opportunities in California for bioenergy/biofuel from agriculture (crops, marginal lands, residues)
• Economic analysis and land use (crop adoption and substitution) and location
• GHG emissions • Likely biorefinery technology • Jobs, regional economic impact • Water use, wildlife and soil erosion effects • Compliance with sustainability concepts • Role(s) in remediation

California Renewable Energy Center
Most biofuel facilities are biodiesel manufacturers using FOG and vegetable oil; there are 4 larger ethanol facilities using imported corn grain

California Renewable Energy Center
Applicant Project Title Grant Feedstocks Location Fuel Type/Size Size Status
Mendota Advanced Bioenergy Beet Cooperative Advanced Bioenergy Center Mendota PON-09-604 Sugar Beets Mendota Biofuel ethanol 285,000 gal/year Awardee
Great Valley Energy, LLC Feasibility of Fractioned Sweet Sorghum to Ethanol and Products PON-09-604 Sweet Sorghum San Joaquin Valley Biofuel ethanol 3.15 M gal/year Awardee
EdeniQ Inc. California Cellulosic Ethanol Biorefinery Utilizing California Waste Products and Feedstocks PON-09-604 Corn stover, switchgrass, and wood chips Visalia Cellulosic ethanol 50,000 gal/year Not Funded
Alt Air Fuels, LLC Feasibility Study for Renewable Jet and Diesel Fuels Biorefinery PON-09-604 Camelina Oil Seattle Biofuel diesel 30 M gal/year Not Funded
California Ethanol & Power, LLC Sugarcane-to-Ethanol and Electricity Production Facility PON-09-604 Sugarcane Imperial Valley Ethanol and Electricity Not Funded
Amyris Biotechnologies, Inc Renewable Hydrocarbon Diesel Production from Sweet Sorghum and Sugar Cane PON-09-604 Sweet Sorghum Thousand Oaks Biofuel diesel Did Not Pass
Pacific Ethanol Inc. Madera Combined Heat and Power PON-09-604 Grain Sorghum Madera Cellulosic ethanol 40 M gal/year Did Not Pass
Pacific Ethanol Inc. Incorporation of Cellulosic Ethanol Technology into Pacific Ethanol's Stockton Facility PON-09-604 Grain Sorghum Stockton Cellulosic ethanol Did Not Pass
California Biofuels, LLC Sweet Sorghum & Agriculture Waste Project PON-09-604 Sweet Sorghum Did Not Pass
Mendota Bioenergy, LLC (MBLLC) Advanced Biorefinery Center-Mendota Integrated Demonstration Plant PON-11-601 Sugar Beets Mendota Biofuel ethanol 285,000 gal/year Awardee
ZeaChem Inc. Pilot Plant and Commercial Feasibility Study for Biobased Gasoline Blendstocks PON-11-601 Awardee
EdeniQ Inc. California Cellulosic Ethanol Biorefinery PON-11-601 Corn stover, switchgrass, and wood chips Visalia Cellulosic ethanol 50,000 gal/year Awardee
Canergy, LLC Pre-Work Low-Carbon Ethanol Production from Sugarcane and Sweet Sorghum PON-11-601 Sugarcane and Sweet Sorghum Imperial Valley Cellulosic ethanol Not Funded
Pacific Ethanol Development, LLC Madera Biomass Refinery PON-11-601 Not Funded
California Ethanol & Power, LLC (CE&P) Permitting for California Sugarcane Ethanol Plant PON-11-601 Sugarcane Imperial Valley Ethanol and Electricity Did Not Pass
Partnership for Environmental Progress, Inc. Agave Biofuel Feasibility Study PON-11-601 Did Not Pass
Recent applications to the AFRVTP (AB 118) program (agricultural feedstocks)
California Renewable Energy Center
TASK 4: Integrated Assessment- analyses included
• Identification of most likely opportunities in California for bioenergy/biofuel from agriculture (crops, marginal lands, residues)
• Economic analysis and land use (crop adoption and substitution) and location
• GHG emissions • Likely biorefinery technology • Jobs, regional economic impact • Water use, wildlife and soil erosion effects • Compliance with sustainability concepts • Role(s) in remediation

California Renewable Energy Center
2010 USDA Biofuels Roadmap Estimates Advanced Biofuel Production from New Capacity (billion gallons)
% of Total Total TotalAdvanced Advanced Advanced
Region Volume Ethanol Biodiesel Volume RFS2 Basis (1)Southeast (2) 49.8 10.45 0.01 10.46 10.47Central East (3) 43.3 8.83 0.26 9.09 9.22Northeast (4) 2.0 0.42 0.01 0.42 0.43Northwest (5) 4.6 0.79 0.18 0.96 1.05West (6) <0.3 0.06 0.00 0.06 0.06
United States 20.55 0.45 21.00 21.23
(1) RFS2 Basis - higher density fuels receive higher weighting relative to ethanol. Biodiesel is 1.5(2) Feedstocks: Perennial grasses, soyoil, energy cane, biomass (sweet) sorghum, logging residues(3) Feedstocks: Perennial grasses, canola, soyoil, biomass (sweet) sorghum, corn stover, logging residues(4) Feedstocks: Perennial grasses, soyoil, biomass (sweet) sorghum, corn stover, logging residues(5) Feedstocks: Canola,straw, logging residues(6) Feedstocks: Biomass (sweet) sorghum, logging residues
Advanced Biofuels
USDA (from Washington) predicted little bioenergy production from crops in California or elsewhere in the western US.

California Renewable Energy Center
0
2,000
4,000
6,000
8,000
10,000
12,000
1982 1987 1992 1997 2002 2007
1,000 acres
Cultivated Cropland Non-Cultivated Cropland Total Cropland
Changes in California cultivated and non-cultivated cropland, 1982-2007 (USDA, NRCS, 2009). Non-cultivated cropland = tree and vine crops predominantly

California Renewable Energy Center
On an agro-ecological basis, there are many feedstock crop
possibilities in California due to high yields and RUE and unusual
cropping systems.

California Renewable Energy Center
http://www.theicct.org/sites/default/files/publications/ICCTupdate_EU_ILUC_july2014.pdf
Source: ICCT, 2014.
Potential GHG savings estimates from alternative feedstocks based on ALCA; (European values).

California Renewable Energy Center
Cor
n (U
SA)
Sugar
bee
t
(EU
) C6
suga
r
Sugar
bee
t (CA
)
Sugar
cane
(Bra
zil)
Misca
nthu
s
(ave
rage
in E
U)
Misca
nthu
s
(IL U
SA)
Aga
ve sp
p.
Popla
r
Switc
hgra
ss
0
2000
4000
6000
8000
10000
12000
14000E
than
ol
yie
ld (
lite
rs h
a-1
)
Theoretical EtOH yield
from lignocellulose
from sugar/starch
Potential ethanol yields from selected feedstocks. Crops like beets can be produced with high yields and efficiency using current or near–term technology. Cellulosic or low quality feedstock sources have been slow to enter the market, and are less likely to be produced in California. Converting them involves significant capital costs. Light blue, current or simple technology, mid-blue (new of pilot-scale technology) and dark blue (no current technology available-the theoretical conversion limit). Data from diverse sources.

California Renewable Energy Center
Imperial Valley: Variety tests, late harvest (October to July)
Year
1980 1985 1990 1995 2000 2005 2010 2015
Gro
ss s
ug
ar y
ield
s (l
bs/
ac)
5000
10000
15000
20000
25000
30000
Ro
ot
yiel
d (
t/ac
)
20
30
40
50
60
70
80
90
gross sugarroot yield
Increasing yields and returns to total factor productivity over time support the use of some crops for bioenergy. Here sugar beets.

California Renewable Energy Center
Soil age:
oldest 100K 30-80K 10K youngest
Hardpans, thick clay
layers, (vernal pools) Soils with structured
horizons
A: Bt: C
High clay content,
drainage
limitations, salinity ,
alkalinity
Silts, loams low OM,
crusting
Oak-savanna/rangelands
rangeland/pasture, some perennials
perennials, annuals mostly annuals
Soil use
Basin rim Natural
levees
350K
Diverse soils and landscapes lead to differing cropping systems in CA

California Renewable Energy Center
Per Acre Profit for 45 Regional Farming Systems (2000-10 PUR data)
NCA: Sacramento Valley; CEN: Delta and northern SJV; SCA: Tulare, Kings, Kern; SCA: Imperial Valley, Palo Verde, San Diego; COA: Salinas Valley, Santa Maria, Ventura; PUR = CA DPR Pesticide Use Data

California Renewable Energy Center
Information transfer/ systems analysis /LCA/ and sustainability. BCAM provides basis for quantifying positive and negative cropping system interactions.
The complementarity among models and the integration with the state’s LCFS is discussed in the report in detail. At some point, power systems should be compared on a performance-standard basis as well.

California Renewable Energy Center
California Bioenergy Crop Adoption Model (BCAM). BCAM is a crop rotation optimization model that estimates prices needed for new crops and crop displacement. It can work at the regional or farm level, and tests new crops against longer term cropping patterns in diverse areas of the state.
AX jgi e
jeig ,,,,Subject to: j= {acres, ac-ft of water}
PMP function
Energy crop function
g j
ejgejgejgejge
ijigjigjigjigjigjig
XCYP
XCXPMax
X jige ,,,,,,,,
,,,,,,,,,,,,
,,,
Production function
P e,g,i,j = farm price of crop i, and energy crop e, in region g, and resource, j. C e,g,i,j = farm cost of crop i, and energy crop e, in region g, and resource, j. Y e,g,i,j = yield of crop, i, and energy crop e, in region, g, and resource, j. X e,g,i,j = level of hectares r applied to energy crop e, in region g for crop i. Ᾱg,j = constrained hectares of crop j in region g. β g,i,j = intercept of the quadratic (marginal) curve of crop, i, in region, g, resource, j. ω g,i,j = slope of quadratic (marginal) curve of crop, i, in region, g, and resource, j.
A

Regionmodel code
Crop Acres (Census of Ag)
Annual Crop Acres
Total Counties
DPR Counties
Crop/Farm Clusters
Northern CA NCA 3,190,441 1,538,971 29 14 9Central CA CEN 2,314,332 1,179,789 9 5 9South SJV SSJ 2,094,486 1,193,752 3 3 8Southern CA (IV) SCA 818,787 599,237 6 2 6Coastal CA COA 1,038,340 395,633 11 6 13
9,456,386 4,907,383 45
0.0%
0.5%
1.0%
1.5%
2.0%
2.5%
3.0%
3.5%
4.0%
4.5%
5.0%
Canola SweetSorghum
Sugarbeet Safflower Bermudagrass
NCA CEN SSJ SCA
Feedstocks evaluated: winter annual oilseeds, energy beets, sugar cane, energy cane, grain and sweet sorghum, Bermuda grass, Jose tall wheat grass, (poplars).
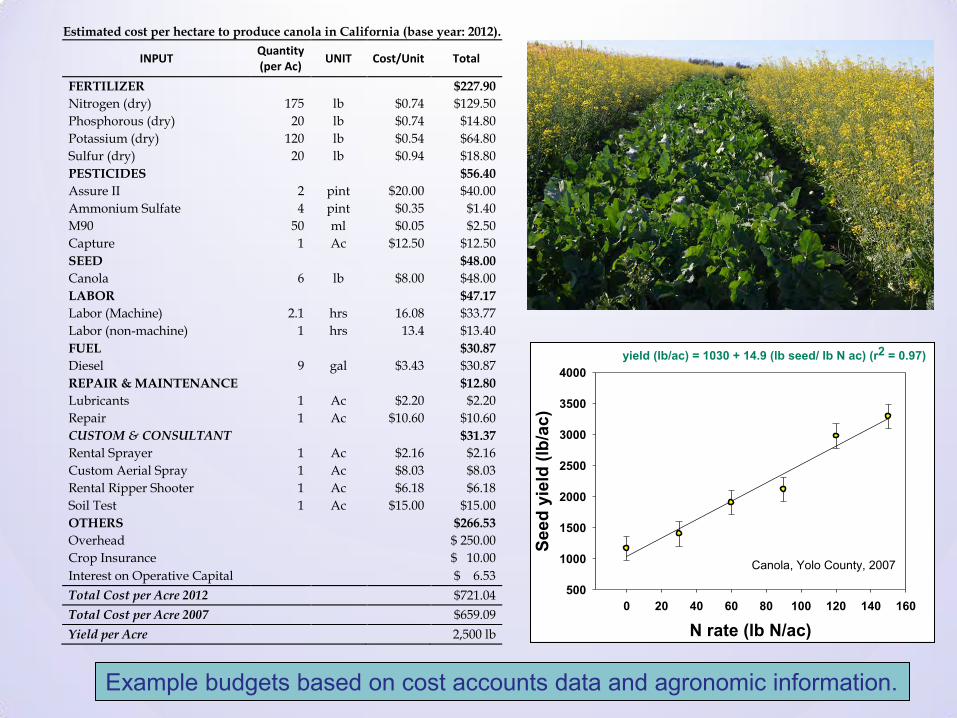
Estimated cost per hectare to produce canola in California (base year: 2012).
INPUT Quantity (per Ac)
UNIT Cost/Unit Total
FERTILIZER
$227.90
Nitrogen (dry) 175 lb $0.74 $129.50
Phosphorous (dry) 20 lb $0.74 $14.80
Potassium (dry) 120 lb $0.54 $64.80
Sulfur (dry) 20 lb $0.94 $18.80
PESTICIDES
$56.40
Assure II 2 pint $20.00 $40.00
Ammonium Sulfate 4 pint $0.35 $1.40
M90 50 ml $0.05 $2.50
Capture 1 Ac $12.50 $12.50
SEED
$48.00
Canola 6 lb $8.00 $48.00
LABOR
$47.17
Labor (Machine) 2.1 hrs 16.08 $33.77
Labor (non-machine) 1 hrs 13.4 $13.40
FUEL
$30.87
Diesel 9 gal $3.43 $30.87
REPAIR & MAINTENANCE
$12.80
Lubricants 1 Ac $2.20 $2.20
Repair 1 Ac $10.60 $10.60
CUSTOM & CONSULTANT
$31.37
Rental Sprayer 1 Ac $2.16 $2.16
Custom Aerial Spray 1 Ac $8.03 $8.03
Rental Ripper Shooter 1 Ac $6.18 $6.18
Soil Test 1 Ac $15.00 $15.00
OTHERS
$266.53
Overhead
$ 250.00
Crop Insurance
$ 10.00
Interest on Operative Capital $ 6.53
Total Cost per Acre 2012 $721.04
Total Cost per Acre 2007 $659.09
Yield per Acre 2,500 lb
Canola, Yolo County, 2007
N rate (lb N/ac)
0 20 40 60 80 100 120 140 160
See
d y
ield
(lb
/ac)
500
1000
1500
2000
2500
3000
3500
4000
yield (lb/ac) = 1030 + 14.9 (lb seed/ lb N ac) (r2 = 0.97)
Example budgets based on cost accounts data and agronomic information.

California Renewable Energy Center
Regional entry prices for canola at different adoption levels (i.e. number of acres) measured in dollars per ton.
Number of Acres
Sacramento Valley
Northern San Joaquin
Valley
Southern San Joaquin
Valley
Southern California
Coastal
5,000 $ 313.02 $ 350.18 $ 307.20 $ 358.92 $ 569.08
25,000 $ 336.44 $ 355.48 $ 310.74 $ 558.96 $ 569.86
50,000 $ 360.47 $ 362.11 $ 315.16 $ 593.25 $ 570.83
100,000 $ 430.21 $ 395.59 $ 324.01 $ 608.02 $ 572.78
Crop displacement in the five California regions because of introduction of 100,000 acres of Canola.
Sacramento Valley Northern San Joaquin Valley Southern San Joaquin Valley
Wheat 34,571 Cotton 83,266 Cotton 34,485
Oath 15,426 Wheat 7,327 Wheat 20,462
Corn 14,259 Lettuce 2,985 Oath 14,241
Alfalfa 10,127 Corn 2,667 Corn 13,390
Safflower 7,355 Beans 2,294 Beans 13,187
Outputs from BCAM modeling

http://cestanislaus.ucanr.edu/files/111327.pdf
There are also opportunities to use vineyards and orchards for feedstock production. (no ILUC)

Mendota Bioenergy LLC, Advanced Biorefinery Center (15 mg/y (170.3mL/y) ethanol facility); one of two proposed in California. Mendota is located in the San Joaquin Valley region. The sugar factory there was closed in 2008.
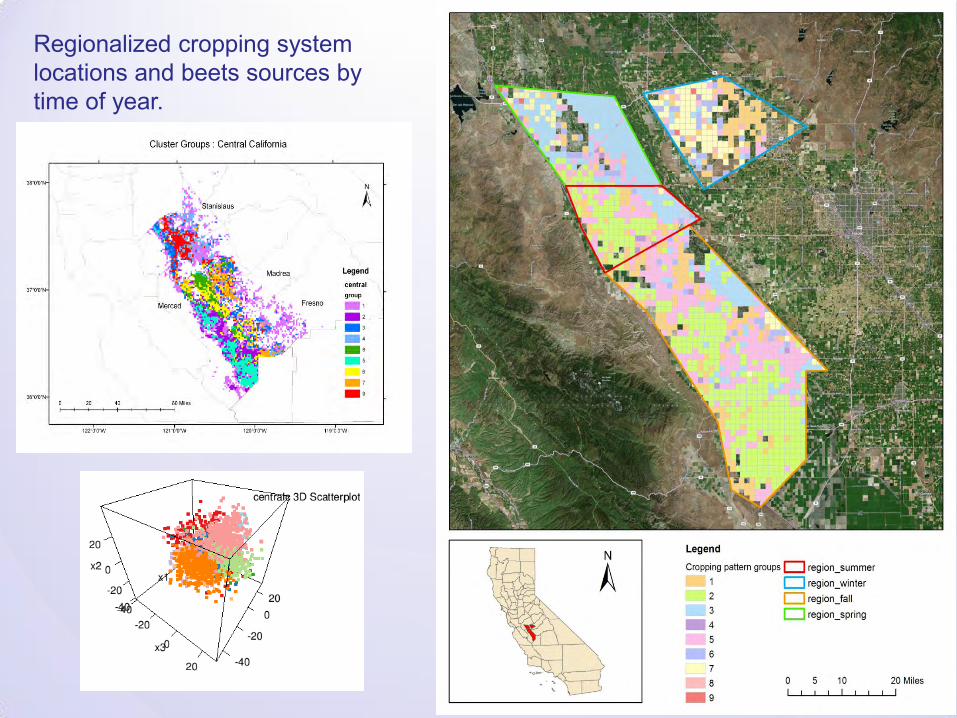
Regionalized cropping system locations and beets sources by time of year.

California Renewable Energy Center
Cotton -68.54% 160,474 Sudan hay -100.00% 16,876 Bean -100.00% 17,932
Corn silage -60.91% 102,314 Bean -28.73% 11,990 Cotton -3.48% 5,158
Oat hay -11.08% 10,302 Corn -6.58% 9,913 Oat hay -6.72% 2,013
Rice -11.07% 1,985 Rice -0.19% 743 Corn silage -0.26% 239
Bean -1.62% 862 Wheat -0.80% 691 Barley -1.23% 92
Broccoli 0.19% 21 Oat hay 4.07% 3,755
Wheat 2.07% 1,288
Sacramento Valley Northern San Joaquin Valley Southern San Joaquin Valley
An increase in crop production due to the adoption of sugarbeet (acres)
BCAM Results for Energy Beet Adoption: Entry Prices and Crop Displacement by Region (2007 prices)

California Renewable Energy Center
Estimated likely new near-term bioenergy production (fuels) from diverse agricultural feedstocks in California.
$/ton $/ton $/ton gal/ton $/gge gge/ac gge/ton Mgge/y lb/ac t/ac Quality
Canola seed 475 385 SAC, SJV 100 Biodiesel 129.15 2.85 169 135.22 16.9 2500 1.25 43% oil
meal
Camelina seed 340* 525 SAC, SJV 0 Biodiesel 96.11 5.22 100.63 0 1600 0.8 32% oil
meal
Sorghum grain 134-139 SAC, SJV 100 Ethanol 110.95 1.81-1.88 296 73.97 29.59 8000 4
Sorghum sugar* 23.75 SJV, IV 15 Ethanol 21.54 1.65 14.36 8.62 40 13% brix
livestock feed
biogas CNG
Beets sugar** 65 40 NSJV, SAC 60 Ethanol 25.2 2.38 672 16.8 40.32 40 16% sucrose
livestock feed
biogas CNG
Sugarcane sugar*** 65 45 IV 60 Ethanol 21.54 3.13 646 14.36 38.78 45 13% brix
bagasse Electricity 50 MW
biogas CNG 930 MSCF
Energy cane ## bagasse 45 IV 40 Ethanol 63-79.2 0.85-1.07 622-781 42-52.8 31.9-40.1 45###
biogas Electricity
Total 84.45
Assumptions#Fuel typeYield (as
harvested)
Feedstock
costIn-state potentialCrop Commodity
Current Price
(2013-14)
BCAM entry
price (2007)
Location with most
likely adoption
Estimated
acres
142.3

California Renewable Energy Center
TASK 4: Integrated Assessment- analyses included
• Identification of most likely opportunities in California for bioenergy/biofuel from agriculture (crops, marginal lands, residues)
• Economic analysis and land use (crop adoption and substitution) and location
• GHG emissions • Likely biorefinery technology • Jobs, regional economic impact • Water use, wildlife and soil erosion effects • Compliance with sustainability concepts • Role(s) in remediation
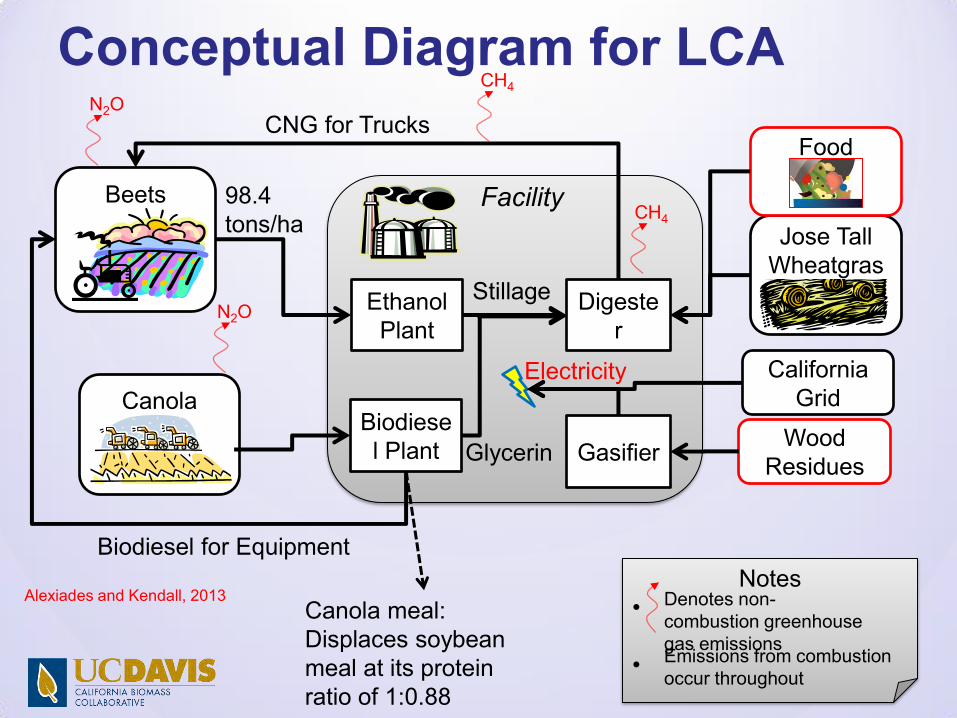
Beets
Canola
Jose Tall Wheatgras
s Ethanol Plant
Digester
Biodiesel Plant Gasifier
Wood Residues
CNG for Trucks
Biodiesel for Equipment
Glycerin
Stillage
Canola meal: Displaces soybean meal at its protein ratio of 1:0.88
Food Waste
CH4
CH4
Electricity California Grid
98.4 tons/ha
N2O
N2O
Conceptual Diagram for LCA
Notes •
•
Denotes non-combustion greenhouse gas emissions Emissions from combustion occur throughout
Facility
Alexiades and Kendall, 2013

California Renewable Energy Center
A. Alexiades and A. Kendall, 2013
California Renewable Energy Center
15 minute break
----
Program will resume
at 3:00 pm

California Renewable Energy Center
TASK 4: Integrated Assessment- analyses included
• Identification of most likely opportunities in California for bioenergy/biofuel from agriculture (crops, marginal lands, residues)
• Economic analysis and land use (crop adoption and substitution) and location
• GHG emissions • Likely biorefinery technology • Jobs, regional economic impact • Water use, wildlife and soil erosion effects • Compliance with sustainability concepts • Role(s) in remediation

In California, self-reported direct employment at corn grain ethanol facilities ranges from 35 to 45 people per plant. Normally, ethanol plants operate 24/7/7 with 4 shift teams. More people are on the Daylight Shift when incoming and outgoing materials are handled and when routine maintenance and QC are done. Each work shift is typically 9 hours, with ~1/2 hour overlap for hand-off between shifts. The 4th shift team fills-in as needed for absent members of the other teams, for employee training, to cover vacations/holidays, and for emergencies. This does not include non-plant employees or contractors such as crop farming and product truck drivers, security, on-farm people, specialized construction, repair and maintenance people, suppliers, waste disposal/recycle services, public relations, or regulatory compliance. Also not included are secondary or tertiary jobs created in the nearby communities such as hospitality and food service providers, insurance, utility providers, housing and family related employment in the schools, hospitals and other public sector jobs. For free-standing corn ethanol plants in the Midwest, the overall indirect job count has been projected to be 5X to10X the direct job count.
James Latty (Mendota Beet Energy LLC)
How many jobs in a typical ethanol facility?

Energy-beet- to-ethanol plants in California will have a few more employees than conventional corn-ethanol plants. For each plant of the size that Mendota Bioenergy currently envisions the Daylight Shift team's employee requirements will be: • 4 operating technicians/operators • 1 mechanical technician • 2 laboratory technicians • 1 clerk • 1 shift manager • 3 office staff including a bookkeeper, a shipping/receiving clerk and a plant/personnel
manager The three non-Daylight Shift team's employee requirements will be: • 2 operating technicians/operators • 1 laboratory technician • 1 clerk • 1 shift manager All team members will be sufficiently cross-job trained to fill-in for other operating members when needed. The total in-plant head count would be 27 people per plant. For free-standing corn ethanol plants in the Midwest, the overall indirect job count has been projected to be 5X to10X the direct job count, or more. Therefore, it is realistic to project that the Mendota Bioenergy whole-beet-to-ethanol business could create a total of 135 to 270 direct and indirect jobs in California's San Joaquin Valley per facility.
James Latty (Mendota Beet Energy LLC)
Potential jobs at an energy beet to ethanol facility (size: 10-15 mg/y)

New POET cellulosic ethanol facility, Emmetsburg, Iowa-July 25, 2014. 25 mg/y; $250m Capex. 60 FTE in cellulosic facility, 40 FTE in adjacent starch facility. POET system recovers lignin and uses it in a boiler to make steam for both the starch and cellulosic ethanol distillation processes. An AD system is used to provide biogas to dry DDGS from the starch unit.
Fuel plus power, estimated jobs:

Estimated jobs and employment effects for diverse biorefineries

Task 4: Economic effects: INPUT-OUTPUT Analyses to estimate jobs and economic benefits from new biorefineries in rural areas of California. IMPLAN software consists of (1) an input-output data base; (2) several program modules for constructing inter-industry models for the user designated impact region; and (3) a model that calculates the direct, indirect, and induced effects of changes in final demand. The IMPLAN input-output data is composed of a national-level technology matrix and county-level estimates of final demand, final payments, gross output, and employment for economic sectors” Bergstrom et al. (1990) Models’ are the term in IMPLAN that identifies the analysis study area. Economic data enters the software in geographic units such as states and counties. The “Model” refers to the geographic boundaries in specific models. The economic impact is influenced by the size and economic footprint of each geographic boundary. The models are developed to measure the economic impact of each of these biorefineries within each county, i.e. in Fresno, Imperial, and San Joaquin Counties in California. IMPLAN is widely used for estimating economic effects of new industries

California Renewable Energy Center
Type of biorefinery
facility Location Feedstock
Level of
feedstock (tons)
Value of
Feedstock
Level of
biofuel
produced
Value of fuel Co-product YieldValue of co-
product
Construction
cost (CAPEX)
Operation
cost (OPEX)
Ethanol plant Fresno, CA Sugar beet 1,140,000 $48,279,000 30,000,000 $81,000,000 biogas 48,000 ton $6,816,000 $38,000,000 $20,121,000
Biodiesel plant San Joaquin, CA Canola seed 125,000 $59,375,000 16,143,750 $65,382,188 glycerin 3,549,688 gal $4,472,607.00 $28,628,882 $3,228,750
Ethanol plant Imperial, CA Sugarcane 2,700,000 $121,500,000 71,300,000 $192,510,000 $86,706,741 $1,322,508
Crop Fuel typeYield (as
harvested)Total CAPEX CAPEX CAPEX
Total
OPEXOPEX OPEX Total Total
Feedstock
of total
gal/t gge/ton $ $/gal $/gge $ $/gal $/gge $/gal $/gge %
Canola biodiesel 129.15 135.22 1791631 3.41 3.26 105000 0.2 0.19 3.61 3.45 82.5
Beets ethanol 25.2 16.8 38000000 1.27 1.9 34440000 1.15 1.72 2.41 3.62 65.8
Sugarcane ethanol 21.54 14.36 86706741 1.22 1.82 1322508 2.09* 3.13* *3.30 *4.95 63.2*
Task 4: Economic effects: Assumptions for the use of IMPLAN model for estimation of economic benefits from new biorefinery facilities that could be developed in California.

Sector Description Employment Labor Income Value Added Total Output
9Sugarcane and
sugar beet farming2,184.90 $30,923,115 $80,581,612 $162,732,753
36
Construction of
other new
nonresidential
structures
505.1 $28,220,833 $37,308,853 $86,706,471
49Beet sugar
manufacturing356.1 $22,095,605 $30,989,287 $193,625,962
19
Support activities
for agriculture and
forestry
142 $3,878,683 $3,780,902 $4,769,709
335 Transport by truck 80 $6,043,866 $6,987,121 $11,825,880
413Food services and
drinking places74.3 $1,474,588 $2,451,413 $4,616,577
360Real estate
establishments49.4 $656,627 $8,262,129 $9,832,676
369
Architectural,
engineering, and
related services
43.8 $2,209,986 $2,274,210 $4,686,317
388
Services to
buildings and
dwellings
43.4 $923,796 $1,321,075 $2,774,715
319Wholesale trade
businesses31.1 $1,997,424 $3,995,887 $4,589,156
Imperial County* economic effects on principal industries affected and employment estimates for a sugarcane biorefinery
*21% unemployment
Modern sugarcane biorefinery
Proesa technology potentially used for energy cane

County San Joaquin Fresno Imperial
Model Year 2010 2010 2010
GRP $21,965,310,701 $33,014,011,739 $5,320,928,974
Total Personal Income $20,823,880,000 $28,138,740,000 $4,874,060,000
Total Employment 266,208 421,173 71,794
Number of Industries 290 296 183
Land Area (Sq. Miles) 1,399 5,963 4,175
Population 683,494 924,691 169,354
Total Households 219,157 291,553 46,678
Average Household Income $95,018 $96,513 $104,419
Population per Square Mile 489 155 41
GRP per Square Mile $15,700,722.45 $5,536,476.90 $1,274,474.01
Personal Income per Square Mile $14,884,832.02 $4,718,889.82 $1,167,439.52
Households per Square Mile 157 49 11
Employee Compensation $10,939,091,842 $16,480,820,749 $2,816,405,239
Proprietor Income $2,111,388,341 $3,751,052,480 $547,103,748
Other Property Type Income $7,230,323,165 $10,345,651,002 $1,557,092,029
Tax on Production and Import $1,684,507,354 $2,436,487,508 $400,327,959
Total Value Added $21,965,310,701 $33,014,011,739 $5,320,928,974
Households 18,148,120,306 24,910,486,261 4,107,941,436
State/Local Government $2,854,922,129 $4,584,847,607 $1,733,218,877
Federal Government $1,084,032,055 $2,567,643,343 $1,016,424,422
Capital $1,949,183,368 $4,121,478,294 $313,673,963
Exports $14,922,949,732 $22,528,607,406 $4,062,878,606
Imports ($16,103,609,193) ($24,431,058,153) ($5,624,916,853)
Institutional Sales ($890,287,721) ($1,267,993,069) ($288,291,428)
Total Final Demand $21,965,310,675 $33,014,011,690 $5,320,929,022
Value Added
Final Demand
IMPLAN model estimates for biorefinery facilities in rural California areas

California Renewable Energy Center
TASK 4: Integrated Assessment- analyses included
• Identification of most likely opportunities in California for bioenergy/biofuel from agriculture (crops, marginal lands, residues)
• Economic analysis and land use (crop adoption and substitution) and location
• GHG emissions • Likely biorefinery technology • Jobs, regional economic impact • Water use, wildlife and soil erosion effects • Compliance with sustainability concepts • Role(s) in remediation

Paso
RoblesWSREC
Western
Kansas
Canola 2 2.1 0.021 0.23
Camelina 2 2.7 0.027 0.29
Sweet
sorghum1 - 0.066 0.48
Bermudagrass 1 - 0.0024 0.22
Sugarcane 5 - 0.0073 0.08
Orchard row
middles -
canola
2 7.55* 0.081* 0.41*
Barley (alt.) 2 3.3 0.031 0.25
Wheat (alt.) 2 2.8 0.024 0.2
Bare soil (alt.) 1 13 0.14 0.59
Crop
Scenario
Crop
Rotation
Length
(yrs)
Annual Soil Loss
(tons/acre/year)Soil erosion modeling (RUSLE2): a = r*k*l*S*c*p where: a = net detachment (mass/unit area), r = erosivity factor, k = soil erodibility factor, l = slope length factor, S = slope steepness factor, c = cover-management factor, and p = supporting practices factor (USDA-ARS 2013).
Field Average Soil Type Path Slope
14
(Paso
Robles, CA)
7
(Five Points,
CA)
19
(Garden City,
KS)
Richfield silt
loam1,000 0.18
Lynne
Channery clay
loam
215 14
WSRECPanoche clay
loam1,000 0.19
Paso
Robles
Western
Kansas
In most cases, erosion from crop production is not a significant risk in CA, but where it occurs, it adversely affects water quality with respect to sediment, pesticides and nutrients. There is no additional risk for erosion from bioenergy crop production at the scale estimated.
Task 4: Environmental issues: soil erosion_several scenarios evaluated, literature for CA reviewed

Stoms et al., a&b (2012). At the scale of biorefinery development estimated, there are no significant effects on wildlife anticipated. Invasive species and invasiveness are also discussed in the report.
Task 4: Environmental effects: wildlife/invasiveness. Many species of birds and animals rely on or use crop land for all or part of their life-cycles.

California Renewable Energy Center
Task 4: water and land use: Under current policy and the operation of normal agricultural markets and prices, bioenergy feedstock crop production may occur in a few regions, on relatively small amounts of land and in cropping systems where the feedstock crops result in greater overall RUE, including land and water use, or provide some additional benefits to farmers not readily captured in an economic model. The scale of crop adoption for biofuel production or bioenergy is unlikely to be large in California. Realistic economic models like BCAM reflect the reality that higher value crop alternatives than most biofuel feedstocks are both numerous and preferred in most instances economically. There are no future scenarios likely in California where biofuel feedstock crops will displace food crop production in any but small amounts. No new water use for biomass production is predicted, rather, existing water supplies are used more efficiently within cropping systems that may include small amounts of biomass for energy/bioproduct production. Concerns that bioenergy production will consume large amounts of water and displace most crops or use a significant amount of land are not meaningful in California, because they are not grounded in a realistic view of the character of agriculture in the state. Unless public policies change in ways that artificially price fuels above food, there is no reasonable scenario that results in widespread crop displacement for bioenergy crops in California or associated water use.

Task 4: Agricultural feedstocks_Conclusions/Sustainabilty • There are limited but real opportunities for the development of new biorefineries for fuel and power
production, and for the expansion of some existing ones. • In-state production at best will contribute to, but not be sufficient for the state’s needs for alternative fuels. • For the most part, new biorefineries could develop in the San Joaquin and Imperial Valley regions,
benefitting rural areas and underserved groups.
• There will be few, if any special, adverse effects on the state’s landscape from the development of crop-based biofuels in the state, but important social benefits. California has the most advanced regulatory programs in the world focused on landscape protection. These statues, regulations, public advisory processes, incentive and enforcement programs reflect the state’s consensus on what is important to protect in environmental and social areas and are characterized by political legitimacy. Nevertheless, the production of bioenergy feedstocks is anticipated to meet or exceed the general descriptions of sustainable activities found in most independent sustainabilty standards.
• Risks to climate through indirect effects on land use elsewhere are potentially small if not positive
(protective). • Based on this analysis, policies that promote in-state development of innovative bioenergy production from
agricultural sources are consistent with the state’s GHG reduction goals and the public’s interest in the development of a green economy.

California Renewable Energy Center
TASK 4: Integrated Assessment- analyses included
• Identification of most likely opportunities in California for bioenergy/biofuel from agriculture (crops, marginal lands, residues)
• Economic analysis and land use (crop adoption and substitution) and location
• GHG emissions • Likely biorefinery technology • Jobs, regional economic impact • Water use, wildlife and soil erosion effects • Compliance with sustainability concepts • Role(s) in remediation

Other Task 4 (Integrated assessment) related projects are focused on landscape problems with well-defined and widely agreed upon needs:
1. Use of marginal land for power and fuel production in California. Can bioenergy production facilitate ultimate management of trace elements and salts in the western San Joaquin Valley and the Imperial Valley?
2. Bioenergy from anaerobic digestion of manure: Can bioenergy production help protect groundwater in regions with large numbers of dairy farms?
3. Bioenergy from woody biomass: Can the use of woody biomass for bioenergy help maintain forest health and reduce risk and losses from wildfire, and protect watersheds?

California Renewable Energy Center
Task 4: Integrating salinity management with bioenergy production on marginal land in the western San joaquin Valley and Imperial Valley using perennial, salt-tolerant grasses as feedstocks
Taiying Zhang, Lucy Levers, Stephen Kaffka

+
Drainage from saline, perched water tables, was a significant issue in the western San Joaquin Valley

Evaporation pond in the San Joaquin Valley
•Land-retirement (chosen for 16+K ha)
•Large-scale waste water treatment (rejected)
•Evaporation ponds (very few, rejected)
•Modification of irrigation and drainage practices (adoption of drip and center pivot systems, crop shifting-occurring, adopted)
•Reduction of water deliveries (by default)
•Reuse of drainage water (used for runoff, less for tile drainage).
Within-valley (mid-term) solutions to the salinity/drainage problem: ultimate disposal of trace elments and salt must be solved

Integration Approaches
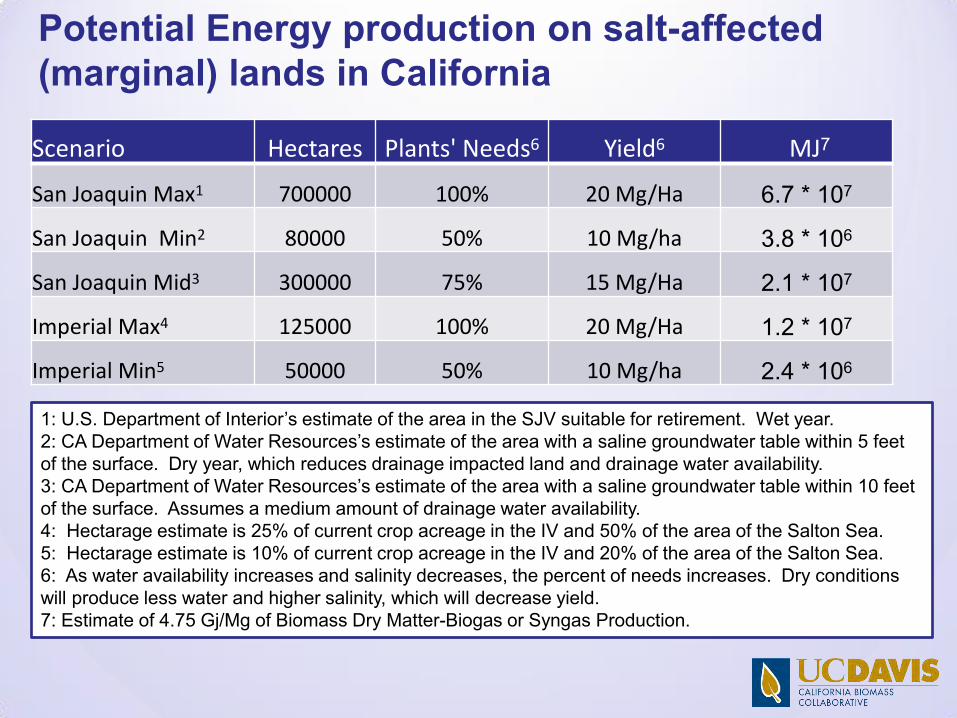
Potential Energy production on salt-affected (marginal) lands in California
Scenario Hectares Plants' Needs6 Yield6 MJ7
San Joaquin Max1 700000 100% 20 Mg/Ha 6.7 * 107
San Joaquin Min2 80000 50% 10 Mg/ha 3.8 * 106
San Joaquin Mid3 300000 75% 15 Mg/Ha 2.1 * 107
Imperial Max4 125000 100% 20 Mg/Ha 1.2 * 107
Imperial Min5 50000 50% 10 Mg/ha 2.4 * 106
1: U.S. Department of Interior’s estimate of the area in the SJV suitable for retirement. Wet year. 2: CA Department of Water Resources’s estimate of the area with a saline groundwater table within 5 feet of the surface. Dry year, which reduces drainage impacted land and drainage water availability. 3: CA Department of Water Resources’s estimate of the area with a saline groundwater table within 10 feet of the surface. Assumes a medium amount of drainage water availability. 4: Hectarage estimate is 25% of current crop acreage in the IV and 50% of the area of the Salton Sea. 5: Hectarage estimate is 10% of current crop acreage in the IV and 20% of the area of the Salton Sea. 6: As water availability increases and salinity decreases, the percent of needs increases. Dry conditions will produce less water and higher salinity, which will decrease yield. 7: Estimate of 4.75 Gj/Mg of Biomass Dry Matter-Biogas or Syngas Production.

Gasification---Mass & Energy Balance
• Assumption: Grass hay = 14.0 dry MT/ha, moisture content 7.3%, ash content 12.7%.
• Gasifier: 1.0+ dry metric ton/day, 350 day/year, requiring (~350 dry MT biomass; equivalent to ~ 20 ha)
• Carbon conversion efficiency is 94.4%

• Feedstock: 350 dry MT/year, 10% dry matter
• Total biogas: 37550 m3 /year (65% methane)
• Total combustion heat: 4,441,240 MJ (~42kW)
Anaerobic Digestion---Mass & Energy Balance

Summary Different solution
Cost (2008 dollar) Environmental impact
Energy sufficiency
Salt products
Evaporation pond
+ Toxic to wild life (?)
Energy to pump water
In the pond
Reverse osmosis
+++++*Typical 120,000 m3/day Plant- cap $160 million Capex, high opex and maintenance.
Energy + membrane replacement
Energy intensive
Brine to be disposed
Cellulosic ethanol
++++ 2,000 dry metric tons feedstock per day according to NREL with total capital cost of $515,840,000
Requires large amount additional water
Requires larger scale system
Salts and ash
Gasification +(++) (scale and efficiency dependent; some feedstock conditioning
Compact, but air & liquid emission regulations
(From feedstock) Self-sufficient
ash
Anaerobic digestion
++(+) Requires additional water
Self-sufficient
Salts or brine
*http://www.energyrecovery.com/swro-cost-estimator

Other Task 4 (Integrated assessment) related projects are focused on landscape problems with well-defined and widely agreed upon needs:
1. Use of marginal land for power and fuel production in California. Can bioenergy production facilitate ultimate management of trace elements and salts in the western San Joaquin Valley and the Imperial Valley?
2. Bioenergy from anaerobic digestion of manure: Can bioenergy production help protect groundwater in regions with large numbers of dairy farms?
3. Bioenergy from woody biomass: Can the use of woody biomass for bioenergy help maintain forest health and reduce risk and losses from wildfire, and protect watersheds?

California Renewable Energy Center
Can we link improved groundwater protection with alternative energy production and green house gas reduction?

Regional Water Quality Control Boards(WQCB)
Dairy Location and Herd Size • Central Valley
– 1.61 million dairy cows (milking & dry)
– ~1350 dairies (primarily concentrated in San Joaquin Valley, or south of Sacramento)
– ~ 91% of State’s dairy cows
– 80% of State’s dairies
California has • ~ 1.78 million dairy
cows • ~ 1650 active dairies
• Santa Ana RWQCB
(essentially Inland Empire) – 93,500 dairy cows (milking &
dry)
– ~125 dairies
– ~ 4% of State’s dairy cows
– 8% of State’s dairies
Task 3. Biomass Resources & Facilities Database Update

California Renewable Energy Center
Assessing Nitrate in California’s Drinking Water, With a Focus on Tulare Lake Basin and Salinas Valley Groundwater T. Harter and J. Lund, et al., 2012. Center for Watershed Sciences, UC Davis http://groundwaternitrate.ucdavis.edu

Agricultural Sources
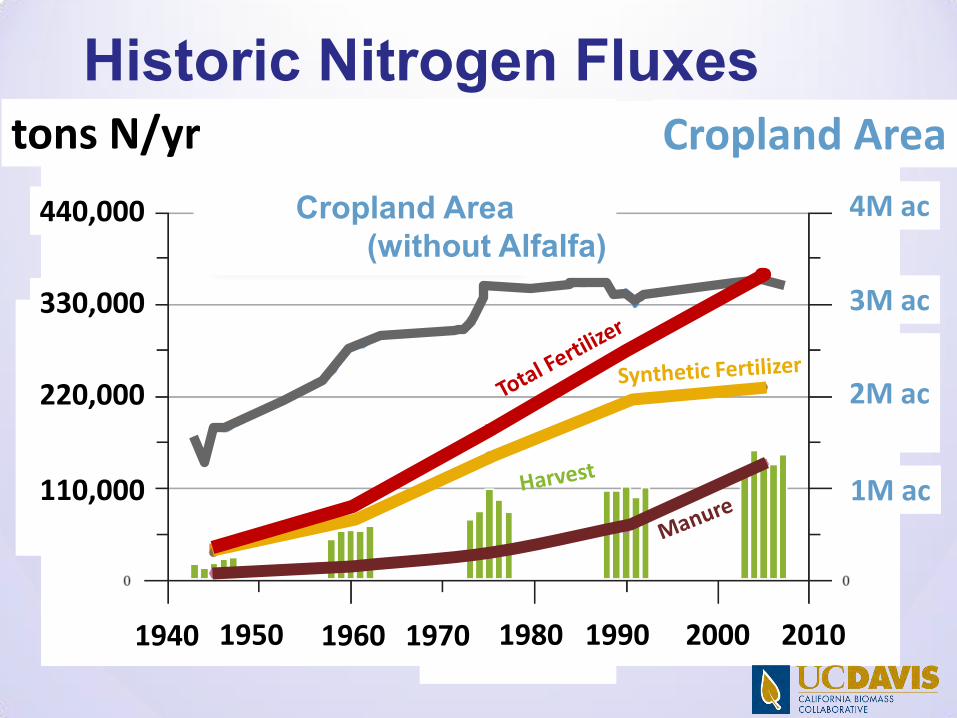
Historic Nitrogen Fluxes
1940 1950 1960 1970 1980 1990 2000 2010
1M ac
2M ac
3M ac
4M ac
110,000
220,000
330,000
440,000
Cropland Area
Cropland Area (without Alfalfa)
tons N/yr

California Renewable Energy Center
Dairy manure: low solids/high water content, large volume of water must be managed. But it is a consistent, year-round large supply of potential energy and nutrients (11.5 m dry t/y)
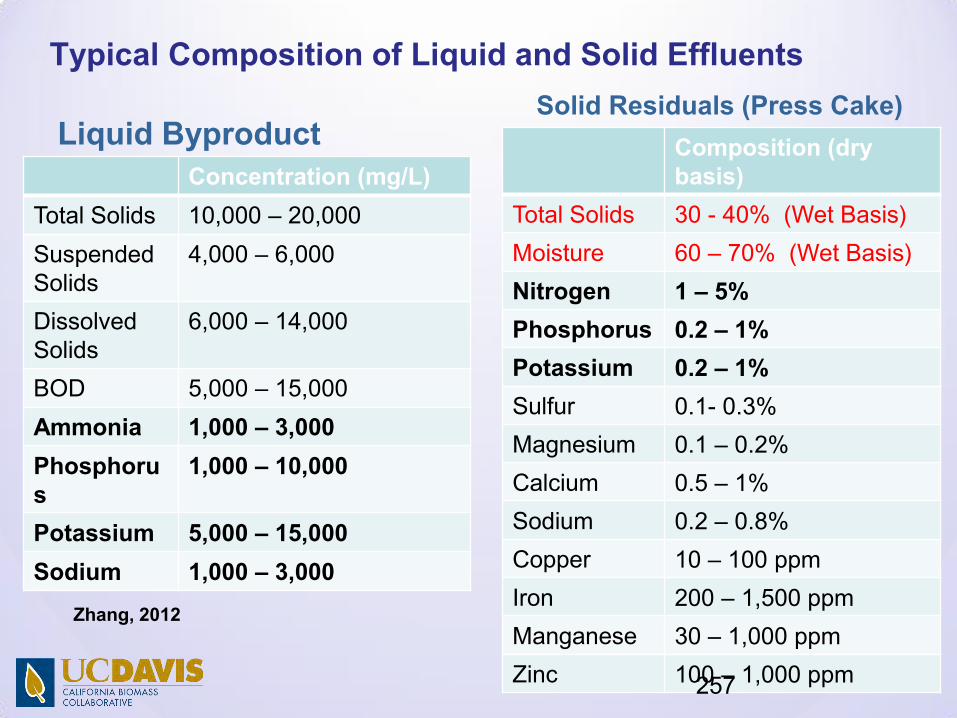
Typical Composition of Liquid and Solid Effluents
Liquid Byproduct Concentration (mg/L)
Total Solids 10,000 – 20,000
Suspended Solids
4,000 – 6,000
Dissolved Solids
6,000 – 14,000
BOD 5,000 – 15,000
Ammonia 1,000 – 3,000
Phosphorus
1,000 – 10,000
Potassium 5,000 – 15,000
Sodium 1,000 – 3,000
Solid Residuals (Press Cake)
Composition (dry basis)
Total Solids 30 - 40% (Wet Basis)
Moisture 60 – 70% (Wet Basis)
Nitrogen 1 – 5%
Phosphorus 0.2 – 1%
Potassium 0.2 – 1%
Sulfur 0.1- 0.3%
Magnesium 0.1 – 0.2%
Calcium 0.5 – 1%
Sodium 0.2 – 0.8%
Copper 10 – 100 ppm
Iron 200 – 1,500 ppm
Manganese 30 – 1,000 ppm
Zinc 100 – 1,000 ppm 257
Zhang, 2012

California Renewable Energy Center
Different manure handling systems, and digester designs, result in different effluent characteristics and lend themselves to different post-digester effluent processing systems. But AD systems do not affect the amount of nutrients that must be managed.
Anaerobic Digesters
Also, it is more difficult to manage organic N precisely than fertilizer N.

Energy production via anaerobic digestion: Solid-liquid separation to produce fibrous solids for animal bedding, soil amendments (compost) or other fiber products, plus Nutrient separation and concentration to produce effective fertilizer products that can be economically used and transported.

Biogas/CH&P
4700 cows System Design: DVO, Inc. Man. & Installation: Andgar Corp. Developed by AgPower Partners Biogas Used for Electricity Co-digestion
1. Coarse solids removal
Plug flow digester
2. Medium size particles
3. Chemical flocculation and press for fine particles

California Renewable Energy Center
C. Frear (Washington State University); EPA Technology Market Summit, Washington DC, May 14, 2012
Schematic of one possible set of pathways for nutrient removal from a Washington State Dairy (Nutrient recovery targets: 70% NH3, 80% P, 20% K).
.

Other Task 4 (Integrated assessment) related projects are focused on landscape problems with well-defined and widely agreed upon needs:
1. Use of marginal land for power and fuel production in California. Can bioenergy production facilitate ultimate management of trace elements and salts in the western San Joaquin Valley and the Imperial Valley?
2. Bioenergy from anaerobic digestion of manure: Can bioenergy production help protect groundwater in regions with large numbers of dairy farms?
3. Bioenergy from woody biomass: Can the use of woody biomass for bioenergy help maintain forest health and reduce risk and losses from wildfire, and protect watersheds?

Warming and Earlier Spring Increases Western U.S. Forest Wildfire Activity A. L.Westerling,1,2* H. G. Hidalgo,1 D. R. Cayan, 1,3 T. W. Swetnam4 1Scripps Institution of Oceanography, La Jolla, CA 92093, USA. 2University of California, Merced, CA 95344, USA. 3US Geological Survey, La Jolla, CA 92093, USA. 4Laboratory of Tree-Ring Research, University of Arizona, Tucson, AZ 85721,USA. Science Express, July, 2006
TASK 4/(3): Woody Biomass for Energy in California
The objective is primarily to create 'sustainably managed woodsheds and other biomass production regions' that will support the sustainable management of urban interface woodlands and forested lands to reduce fuel loading and the potential of uncontrolled wildfire. The use of biomass and residues from forest management/products to produce bio-energy and bio-products and to stimulate local economic activity and long-term stability is a means to that larger end.

California Renewable Energy Center
.
Bioenergy from Forest Woody Biomass What is the effect of forest management and policy on woody biomass availability for the bioenergy industry in California? What are the optimal locations and size of potential biorefineries based on forest biomass feedstock supply chain optimization?
A spatially explicit modeling approach: 1. Potential forest residuals resource assessment using BioSUM 5.2 model developed by USDA Forest Inventory Analysis (FIA) unit and co-developed for California by UC Berkeley. 2. Optimal siting and size of biorefineries in CA using the Geospatial Biorefinery Siting Model (GBSM) developed by UC Davis.
USDA FIA
BioSUM 5.2 UC Davis
GBSM

California Renewable Energy Center
.
BioSUM 5.2 BioSUM 5.2 is a spatially explicit dynamic forest modelling framework based on USDA FIA stand-level data that
– simulates forest growth, wildfire disturbance regimes, and the harvest of timber and residual woody biomass
– applies multiple management prescriptions – optimizes for chosen policy scenarios
Example of management prescriptions (courtesy UCB, B. Sharma, W.Stewart)
PGK_1
Thin on Year 0 and 20 to a target residual basal area of 75 sq. ft. Prefer WF for removal. Thinning is limited to trees of size 4 -36 inch. Thinning occurs uniformly across DBH range. Merch. limit is 7" default. Surface fuel treatment (prescribed burn) occurs in the year of thinning.
PKG_2
Thin on Year 10 and 30 to a target residual basal area of 75 sq. ft. Prefer WF for removal. Thinning is limited to trees of size 4 -36 inch. Thinning occurs uniformly across DBH range. Merch limit is 7" default. Surface fuel treatment (prescribed burn) occurs in the year of thinning.
Untreated Plot
After Canopy Density Reduction Treatment Residual BA=125 sq ft/ac

California Renewable Energy Center
BioSUM 5.2 Example of policy scenarios
Each scenario provides output datasets of woody biomass quantity and distribution for input to the GBSM model.
1. No treatment (reference case): establish a comparison of the extent of forest growth without management and the extent and severity of fires without treatments.
2. Maximize woody biomass production: a hypothetical scenario in which forests are managed prioritizing residual biomass and bioenergy. 3. Minimize stand-replacing wildfire risk: a realistic scenario in which hazardous fuel reduction is prioritized as a forest management goal. 4. Minimize merchantable timber removal: a “conservative” scenario in which medium and large trees are left in place.

GBSM Modeling Approach The Geospatial Biorefinery Siting Model (GBSM) is a supply chain optimization model that determines optimal locations and size of potential biorefineries.
Resource Assessmen
t from BioSUM
Biorefinery Cost and
Performance
TransportatioCost Model
Fuel Demand Model
Supply Chain Optimization Mixed
Integer Linear Programming Model
Results Visualization and Analysis

Example of optimal biorefinery locations
Breakdown of costs for optimally sited biorefineries
Breakdown of Nox emissions for optimally sited biorefineries
Sample Results BioSUM and GBSM
What are the optimal locations and size of potential biorefineries based on forest biomass feedstock supply chain optimization?

Biophysical Supply
Cultural Demand
Technology/Engineering Economics/Policy
Field
Woodland
Watershed
Region
On-site
Community
Distributed
Regional
An Integrated Biomass Assessment Model: Balancing Biomass and Carbon Resources
Crops, Forestry, HM and LM
urban residuals
Food, Fuels/Power, Fiber, Sequestration,
Reclamation

Biomass/MSW Gap Assessment
and Technology Options for
Biogas Clean-up
Steve Kaffka
Rob Williams

Task 6. Biomass/Municipal Solid Waste Technology Gap Assessment
Draft Report Fall, 2013

Biomass Conversion Pathways • Thermochemical Conversion
– Combustion
– Gasification
– Pyrolysis
• Biochemical – Anaerobic / Fermentation (anaerobic digestion)
– Aerobic Processing (composting)
• Physicochemical – Heat/pressure/catalysts
• Hydrotreating/Cracking/Refining

CGEC Survey of MSW Conversion Options
Combustion Systems
• Some 800 solid fuel MSW combustion systems worldwide (3 in CA)
• 195 million tons per year combined capacity
• Vast majority are solid-fuel grate-fired technology

CGEC Survey of MSW Conversion Options
Gasification of MSW
• ~ 100 gasification facilities worldwide consuming some kind of waste or MSW material – Most operate as close-coupled combustion (“two-step
oxidation”) but
– advanced systems in development
Bill Partanen, Metso (2013)
Shredded Waste
LahtiStreams, Finland

CGEC Survey of MSW Conversion Options
Enerkem MSW Gasification-to-Ethanol
• Commissioning - Edmonton, Canada
• 110,000 t/y refuse derived feedstock
• 10 million gallons/y ethanol capacity

CGEC Survey of MSW Conversion Options
Anaerobic Digestion of MSW (or components)
• Installed capacity > 6 million tons/year (mostly in Europe)
• 5-10 operating / commissioning / design stage in California
de Baere & McDonald, 2012
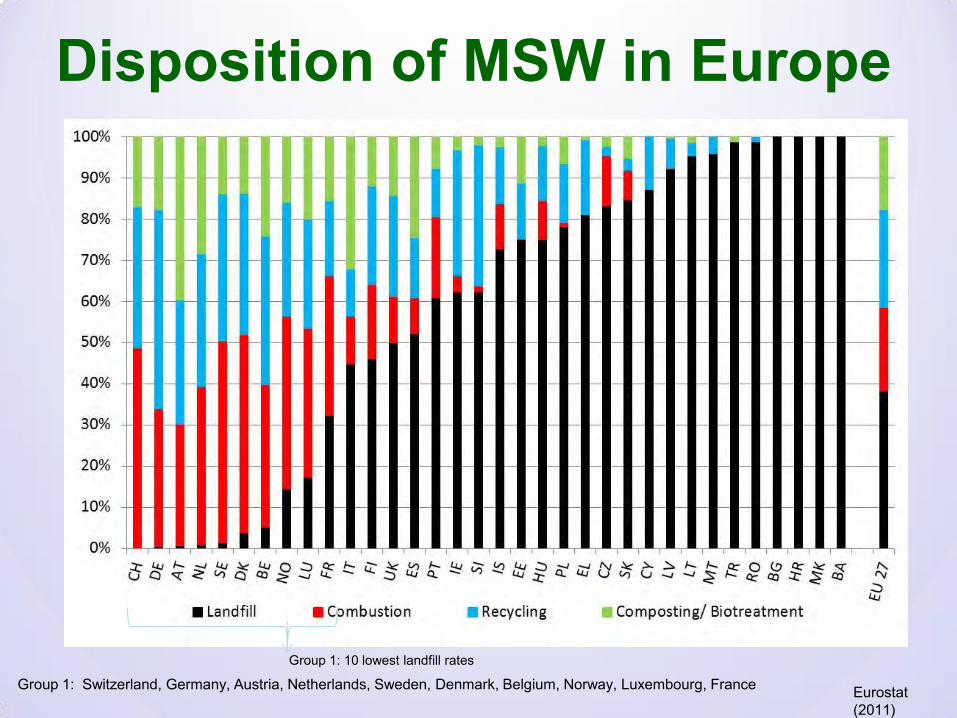
Disposition of MSW in Europe
Eurostat (2011)
Group 1: 10 lowest landfill rates
Group 1: Switzerland, Germany, Austria, Netherlands, Sweden, Denmark, Belgium, Norway, Luxembourg, France

MSW Treatment trend; Group 1 countries in Europe*
Eurostat (2011)
* Group 1: Switzerland, Germany, Austria, Netherlands, Sweden, Denmark, Belgium, Norway, Luxembourg, France

CGEC
Task 6 Conclusion
• Combustion, anaerobic digestion, and to some extent gasification, are solid waste treatment methods used throughout the world, especially Europe where – Landfill bans exist or land is scarce
– Disposal Costs are high (> $100 / ton)
• Technologies meet stringent local environmental regulations in Europe and Japan
• EU countries with high recycling rates burn non-recyclable material for energy rather than landfill
• Waste management policy in California prioritizes source reduction and recycling/reuse as does the US EPA and the European Union
• Unlike the EU or the EPA, California policy does not recognize energy recovery from MSW conversion (thermal methods) – Thermal Conversion with Energy Recovery is the same as landfilling with respect to diversion accounting / RECs

CGEC Task 7. Biomass Gasification Technology Assessment • Task is still in progress
• Update of current activities – Including work on advanced gasification
scenarios (Task 5 and other CEC projects)

List of instate gasifier activities (partial list shown)
CGEC
Name Location Type Application Comments
Phoenix Energy Merced DowndraftElectricity (Engine)
Not sure if operating! Ankur design gasifier. ~ 500 kW (4000+ $/kW estimated capital cost) Loan gurantee from CA Waste Board
Phoenix Energy Oakdale DowndraftElectricity (Engine)
Commissioning/ Not Operating?! . Ankur design gasifier. ~ 1 MW (Central Valley Ag. Grinding)
Community Power Corp. Winters, CA DowndraftElectricity (Engine)
Demo at Dixon Ridge Farms (walnut shell fuel) 50 KW unit has several thousand hours of operation. 100 kW unit installed Fall 2012 (50 kW unit idle)
Pro-Grow Nursery Etna, CA DowndraftBurner fuel (+
engine generator)
Development project. 1000 + hours operation. Now developing a "linear hearth" downdraft gasifier for increased capacity (maintaining 'low-tar' geometry). Replace propane for greenhouse heating. Fluidyne gasifier (Doug Williams, New Zealand) ~ 100 kWe
Cabin Creek Truckee, CA not specified CHPPlacer County ~ 2MW biomass project. Phoenix Energy is developer. Believe searching for technology othr than Ankur.
North Fork North Fork, CA not specified CHP Phoenix Energy is developer. Believe searching for technology othr than Ankur.
Sierra Energy McClellan, CA UpdraftElectricity &
FuelsHad PDU at McCllelan. Large grant from CEC for Port of Sac. Federal project at Hunter Liggett
West Biofuels Woodland, CADual Fluidized Bed (indirect
gasifier)
Syngas to liquid + engine generator
5 ton/day, Research and Demo (UC San Diego, Davis, Berkeley). Several Grants supporting work. Adapting the Gussing Austria gasifier system. Building INSER "Circle Draft" gasifier
Adaptive ArcDowndraft /
Plasma assistCHP Demo facility at UC Riverside
Humboldt State Eureka, CA not specifiedHydrogen to fuel
cell / mobile systems
Biomass gasifier to fuel cell application w/ Blue Lake Rancheria. Also, large DOE grant to look at mobile conversion systems for in forest material
UC Davis Davis, CA Lab Fluid BedFeedstock /
syngas researchProfessor Jenkins' Lab. Collaboration with West Biofuels/ UC San Diego
UC Riverside Hydrogasification CEC funding
Task 7. Biomass Gasification Technology Assessment
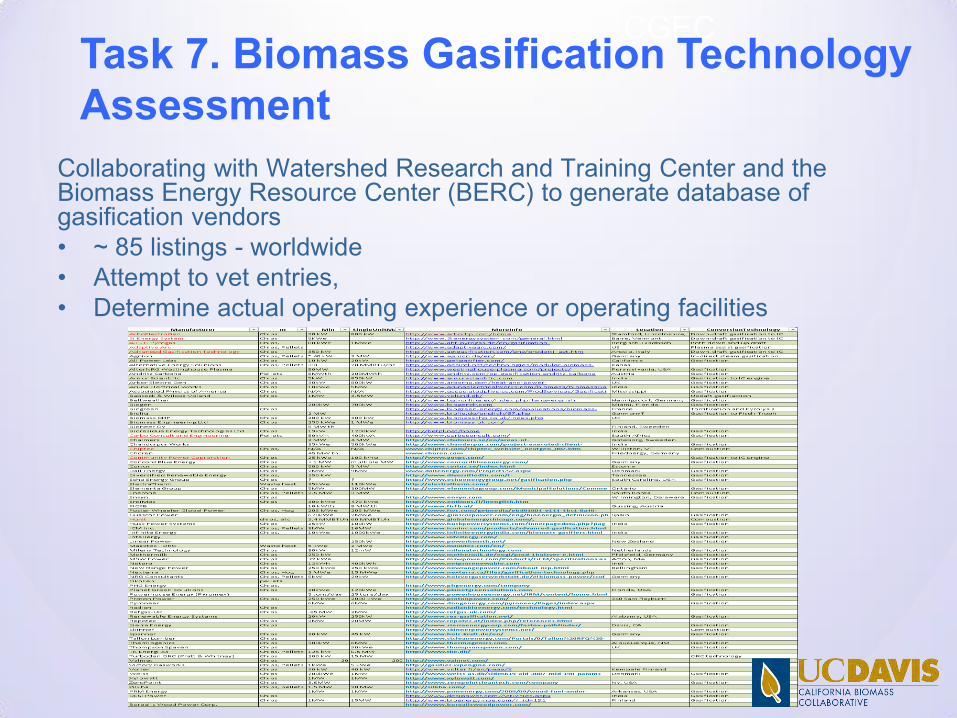
Collaborating with Watershed Research and Training Center and the Biomass Energy Resource Center (BERC) to generate database of gasification vendors • ~ 85 listings - worldwide • Attempt to vet entries, • Determine actual operating experience or operating facilities
CGEC Task 7. Biomass Gasification Technology Assessment

Bay Area Biosolids to Energy Coalition (BAB2E)
Coalition of Nineteen Bay Area water treatment agencies looking at local sustainable biosolids management including energy utilization.
• Commercial Proposals Being Considered:
–MaxWest
–SCFI
• Technology Research and Demonstration Projects:
–Chemergy
–City of San José

BAB2E Commercial Proposals Being Considered:
MaxWest:
• Fluid bed gasifier-close-coupled-combustion
• Combustion heat used to dry feedstock (biosolids) to about 10% moisture
• Zero net energy disposal of biosolids (claim)
SCFI (Cork, Ireland)
• Super Critical Water Oxidation Process- -“AquaCritox”
• Heat or steam product,CO2 and inert solid
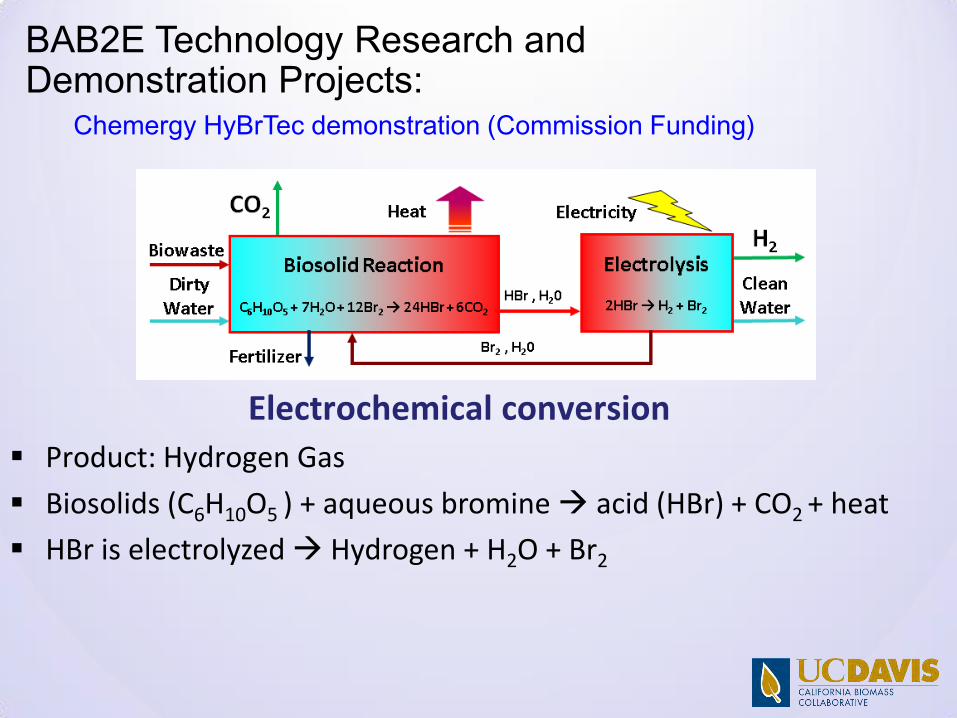
BAB2E Technology Research and Demonstration Projects:
Chemergy HyBrTec demonstration (Commission Funding)
Electrochemical conversion
Product: Hydrogen Gas
Biosolids (C6H10O5 ) + aqueous bromine acid (HBr) + CO2 + heat
HBr is electrolyzed Hydrogen + H2O + Br2

BAB2E Technology Research and Demonstration Projects:
City of San José (Commission Funding)
• Gasification to demonstrate production of fuel-quality syngas from mixtures of:
• Clean urban wood residue & • Biosolids
• Concord Blue Energy (Blue Tower) Technology • Indirect heat steam gasification
Blue Tower Pilot Plant, Herten, Germany

State of Bioenergy (solid fuel and biogas power)
• ~ 400 TWh/y biopower generated in the world
– Project Increase (IEA, 2013)
• ~ 28 TWh/y biopower US
• 6 TWh/y in California – ~ stable for 20 years
– Some policy in place to encourage new capacity
– Other policies tend to hinder
0
5
10
15
20
25
30
1980 1985 1990 1995 2000 2005 2010 2015
Ge
ne
rati
on
(TW
h)
Biopower Generation, US and CA
US
California
US EIA (2014), CEC Energy Almanac (2014)
IEA (2013)
Capacity (MW) Facilities
Solid Fuel (woody& ag.) 574.6 27 LFG Projects 371.3 79 WWTP Facilities 87.8 56 Farm AD 3.8 11 FoodProcess/Urban AD 0.7 2 Totals 1038 175
Solid Fuel (MSW) 63 3
Biopower Facilities in California

Biomass Integrated-Gasification- Combined-Cycle (BIGCC)
• Here, BIGCC refers to Gasifier integrated with Gas Turbine generator followed by Steam Rankine cycle (as in figure)
• Other configurations include gasifier integrated with: – Reciprocating Engine-Generator followed by Steam or Organic Rankine
– Fuel Cell in combination with Gas Turbine (burning fuel cell “tail gas”)
– Fuel Cell followed with Steam / Organic Rankine
(Larson, 2001)

Biomass Integrated-Gasification- Combined-Cycle (BIGCC)
• Potential for higher efficiency [30-40%] at 20-100+ MW scale – Conventional solid-fuel combustion efficiencies are in 12-
25% (5- 50 MW)
• Improved emissions – Permitted NOx limits for existing solid fuel
biomass facilities range from ~1 to 5 lb./MWh (weighted average is 2.3 lb./MWh)
– Doepending on gasifier configuration, BIGCC NOx could approach “central station power plant emission standards” (0.07 lb./MWh for NG CC)

Biomass Integrated-Gasification- Combined-Cycle (BIGCC)
• IGCC fueled by coal, petcoke and other petroleum co-products operate in the US and worldwide
• Emerging for biomass – 6 MW Pilot Scale Demonstrated using biomass in 1990’s (Värnamo, Sweden)
– A 5.5. MW Recip. Engine – steam turbine CC demonstrated in China ~ 2005
• Cost of electricity projected $0.10 – 0.20/kWh. Competitive w/ new Solid-Fuel Combustion Power

Biomass Integrated-Gasification- Combined-Cycle (BIGCC)
Installed cost estimates from techno-economic modeling literature*
0
1,000
2,000
3,000
4,000
5,000
6,000
7,000
0 20 40 60 80 100
Inst
alle
d C
ost
($
/kW
)
Capacity (MW)
Brown (2009)
Kalina (2012)
Tsakomakas (2012)
Upadhyay (2012)
Klimantos (2009)
KEMA (2009)
BIGCC Studies
* Yr. 2014 $ using CPI inflation and $1.4 per Euro

Biomass Integrated-Gasification- Combined-Cycle (BIGCC)
• Develop a cost curve from the BIGCC literature including a 20% California “adder”*
• Also shown is conventional biomass combustion installed costs (Black and Veatch estimates and CEC cost of generation model)
• Suggests BIGCC would be competitive with new-build conventional combustion simple cycle systems
* 20% California cost premium is consistent with engineering design and consulting firm observations
y = 14629x-0.31
R² = 0.7542
0
1,000
2,000
3,000
4,000
5,000
6,000
7,000
8,000
9,000
0 20 40 60 80 100
Inst
alle
d C
ost
($
/kW
)
Capacity (MW)
BIGCC Lit. w/ 20% Adder
Solid Fuel Combustion (B&V, CEC COG)

Biomass Integrated-Gasification- Combined-Cycle (BIGCC)
• Cost of electricity projected $0.10 – 0.20/kWh. Competitive w/ new Solid-Fuel Combustion Power
0.00
0.04
0.08
0.12
0.16
0.20
0.24
20 30 40 50 60 70 80 90 100
LCO
E ($
/kW
h)
Capacity (MW)
Conventional ($75/t)
Conventional ($20/t)
BIGCC ($75/t)
BIGCC ($20/t)
LCOE, Conventional & BIGCC for two fuel costs ($20/BDT and $75/BDT)

Biomass Integrated-Gasification- Fuel Cell (BIGFC)
Basic Components (simple cycle)
• Gasifier
• Appropriate gas cleaning components
• Fuel cell (internal reforming) for power
• Burner to consume unused gas, produce heat
(Kleinhappl, 2012)
Burner

Biomass Integrated-Gasification- Fuel Cell (BIGFC)
Combined Cycle Concept (BIGFC- Gas Turbine)
• Insert gas turbine (microturbine) in place of burner in the simple cycle configuration
(Kleinhappl, 2012) ηel ~ 40-50% (HHV) biomass to electricity
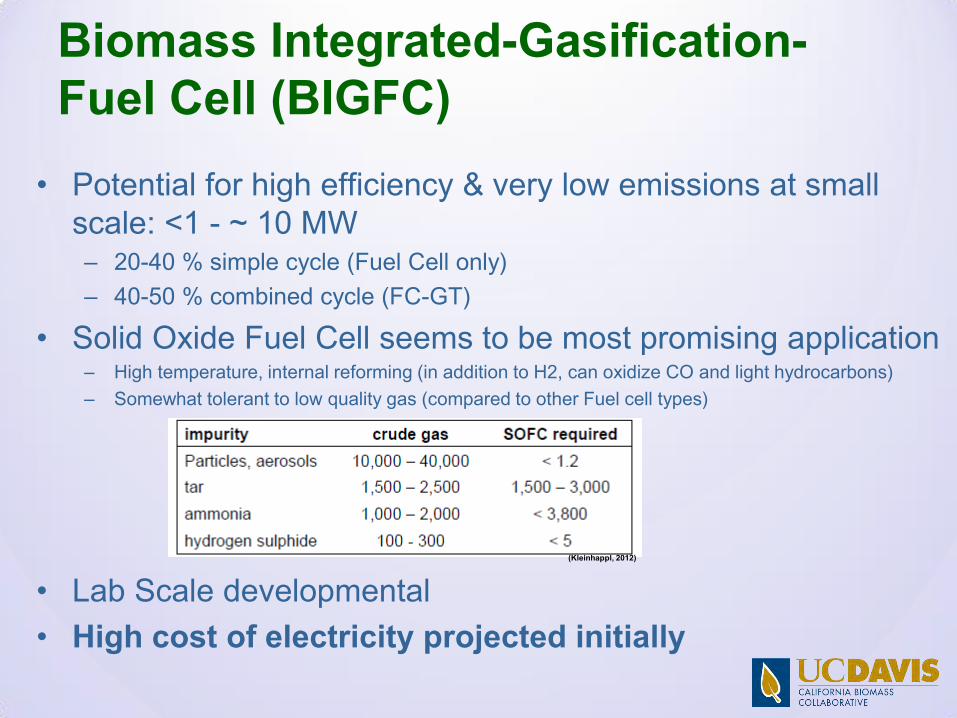
Biomass Integrated-Gasification- Fuel Cell (BIGFC)
• Potential for high efficiency & very low emissions at small scale: <1 - ~ 10 MW – 20-40 % simple cycle (Fuel Cell only)
– 40-50 % combined cycle (FC-GT)
• Solid Oxide Fuel Cell seems to be most promising application – High temperature, internal reforming (in addition to H2, can oxidize CO and light hydrocarbons)
– Somewhat tolerant to low quality gas (compared to other Fuel cell types)
• Lab Scale developmental
• High cost of electricity projected initially
(Kleinhappl, 2012)
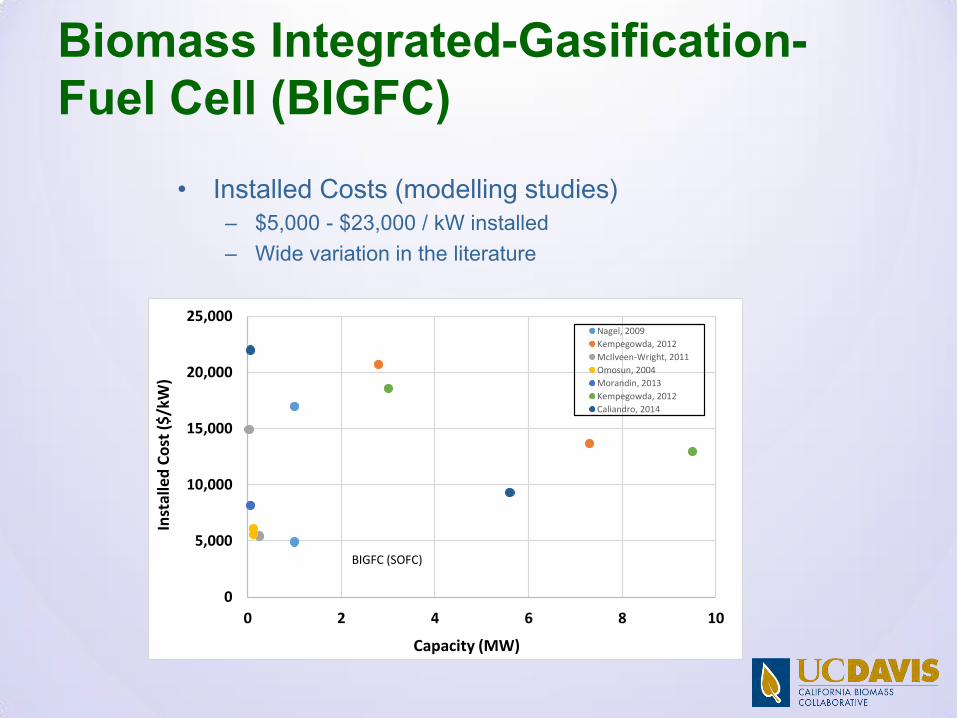
Biomass Integrated-Gasification- Fuel Cell (BIGFC)
• Installed Costs (modelling studies) – $5,000 - $23,000 / kW installed
– Wide variation in the literature
0
5,000
10,000
15,000
20,000
25,000
0 2 4 6 8 10
Inst
alle
d C
ost
($
/kW
)
Capacity (MW)
Nagel, 2009
Kempegowda, 2012
McIlveen-Wright, 2011
Omosun, 2004
Morandin, 2013
Kempegowda, 2012
Caliandro, 2014
BIGFC (SOFC)

Biomass Integrated-Gasification- Fuel Cell (BIGFC)
• High cost of electricity projected, at least initially – $0.20 -1.00/ kWh LCOE
– Maybe economy of scale, weak trend in these data.
• Natural gas fueled SOFC stationary power not yet commercial – NETL estimates that 25 x 1 MW SOFC natural gas installations are needed in order for
“learning” to lower costs to commercial range
0.00
0.20
0.40
0.60
0.80
1.00
0 2 4 6 8 10
LCO
E (
$/k
Wh
)
Capacity (MW)
SOFC & Gas Turbine
SOFC Only
BIGFC Estimates from Literature

Renewable Synthetic Natural Gas (RSNG) Biomethane via thermal gasification pathway • Thermal gasification,
• Appropriate gas cleaning
• Reform to methane, 𝐶𝑂 + 3𝐻2 <=> 𝐶𝐻4 + 𝐻2𝑂 𝐶𝑂2 + 4𝐻2 <=> 𝐶𝐻4 + 2𝐻2𝑂 𝐶𝑂 + 𝐻2𝑂 <=> 𝐻2 + 𝐶𝑂2
• Upgrade to NG quality (remove CO2, H20)
Methanation & Upgrading

Renewable Synthetic Natural Gas (RSNG)
• Thermal Efficiency ~ 65% (biomass to SNG)
• Improved efficiency and emissions for biopower applications – Overall biomass-to-electric energy eff. would be ~30- 33% ( in a
natural gas combined cycle plant, η= 50% )
– Emissions equivalent to natural gas power plant
• Some hydrogen remains in gas after methanation process – Up to 5% H2 in SNG has been reported in literature
– Natural gas pipeline standards in North America have low limits for H2 (typically < 0.1%)

Renewable Synthetic Natural Gas (RSNG)
• 20MWgas RSNG facility commissioning in Gothenberg Sweden “GoBiGas”
– Uses the “Güssing” gasifier technology (FICFB, indirect steam gasification)
• 100 MWgas Phase II planned for 2016
• 200 MWgas Plant in design stage by E.ON called “Bio2G”

Renewable Synthetic Natural Gas (RSNG)
Renewable Gas Production Costs ($/GJ) (1 GJ ≈ 0.95 MMBtu)
• Derive from techno-economic studies in literature
• Convert to 2014 $
Estimate here is
• $10 / MMBtu at very large scale (2 million dry-tons per year input, ~ 650 MW gas production)
• $20 / MMBtu @ 200,000 t/y biomass (65 MW gas production)
Natural gas: ~5 – 7 $/MMBtu 0
5
10
15
20
25
30
0 400 800 1200 1600 2000
RSN
G P
rod
uct
ion
Co
st (
$/G
J)
Biomass (1000 dry tons per year)
$50/BDT
$30/BDT
Zero Feedstock Cost
(MWth Feed In)200 400 600 800 1000
0
5
10
15
20
25
30
35
40
45
50
0 200 400 600 800 1000 1200 1400 1600 1800
SN
G c
ost
($/
GJ)
Biomass (1000 dry tons per year)
Gassner&Marechal (2009)
Zwart et al., (2006)
Mensinger et al., (2011)
Hacatoglu et al., (2010)
Cozens & Manson (2010)
B&V SMUD (2013)

Renewable Synthetic Natural Gas (RSNG)
• LCOE: 150 – 250 $/MWh in a combined cycle natural gas power plant (assuming $77/MWh non-fuel cost at NG CC plant)
100
150
200
250
300
0 400 800 1200 1600 2000
LCO
E o
f R
SNG
at
CC
Po
we
r P
lan
t ($
/MW
h)
Biomass (1000 dry tons per year)
$75/BDT
$50/BDT
$30/BDT
Based on non-fuel LCOE of CC gas plant of $77/MWh (CEC COG Report, May 2014)
(MWth Feed In)200 400 600 800 1000

LCOE Summary
• LCOE Summary: – RED bars : Advanced systems reviewed in project
– BLUE bars: Conventional systems
0
50
100
150
200
250
300
350
BIGCC (20-100MW)
MSW AD (~3MW)
Solid FuelCombustion(20-50 MW)
Renwable Gas(25 - 300 MW)
Gasification,wood (3 MW)
Dairy Digester(1 MW)
BIGFC (< 1 - 10MW)
LCO
E ($
/MW
h)
To $1000 /MWh)
$147/MWh, LCOE NG-CC (CEC 2014)

Research Recommendations
• Costs generally need to be reduced across all biopower technologies
– Research will help
– Learning through building capacity of advanced systems will help
• Reliable gas cleaning and tar reforming methods need to be demonstrated: this will improve all biomass gasification applications
– Small to Large
– Power or syngas/fuels production
• For renewable natural gas via thermal gasification, H2 in final product issue needs to be explored and solved
– Remove or reduce H2 and/or
– Adjust natural gas pipeline specifications to allow higher concentration
• If BIG-FC systems are of interest, develop or expand basic research programs in US and California in this area (almost all literature is from Europe)
Task 8: Comparative Assessment
of Technology Options for Biogas Clean-up
Matthew Ong
California Biomass Collaborative
University of California, Davis
Research Results Forum for Renewable Energy Technology and Resource Assessments
September 3, 2014
306
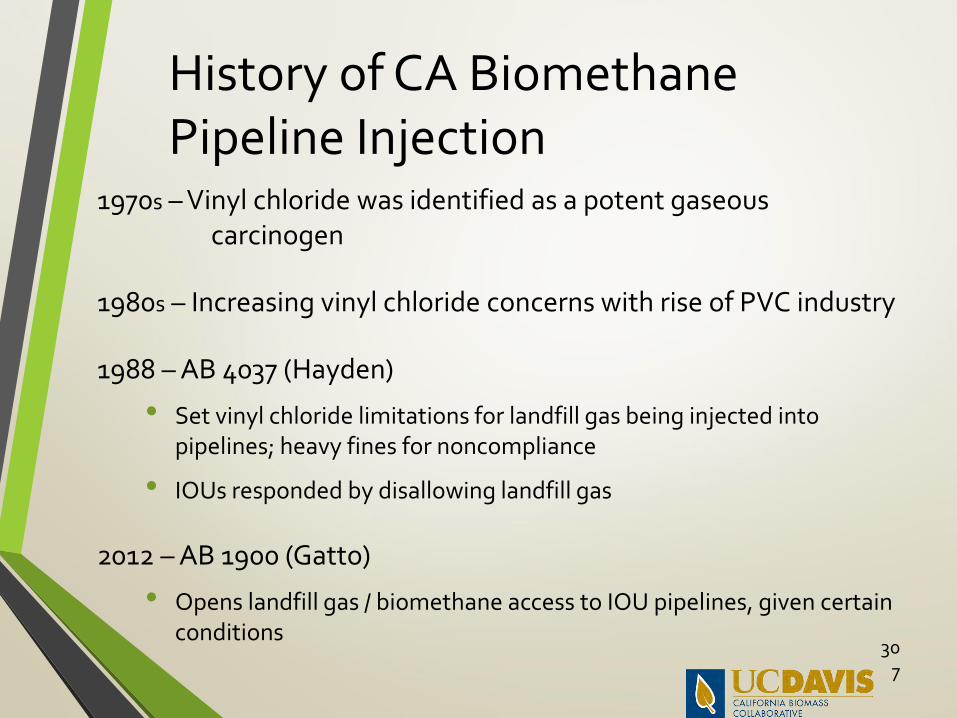
History of CA Biomethane Pipeline Injection
1970s – Vinyl chloride was identified as a potent gaseous carcinogen
1980s – Increasing vinyl chloride concerns with rise of PVC industry
1988 – AB 4037 (Hayden)
• Set vinyl chloride limitations for landfill gas being injected into pipelines; heavy fines for noncompliance
• IOUs responded by disallowing landfill gas
2012 – AB 1900 (Gatto)
• Opens landfill gas / biomethane access to IOU pipelines, given certain conditions
307

AB 1900 (Gatto)
• Investigate biogas constituents of concern
• Develop biomethane standards
• Establish monitoring and testing requirements
• Require CPUC to adopt pipeline access rules to ensure nondiscriminatory open access to IOU gas pipeline systems
• Require IOUs to comply with standards and requirements, and provide access to common carrier pipelines.
308

Biogas is comprised of methane and carbon dioxide, but also can contain various impurities
• Sulfur compounds (H2S, Mercaptans, COS, …)
• Siloxanes
• Nitrogen & Oxygen
• Volatile organic compounds
• Halocarbons
• Moisture
• Particulates 309

Biogas characteristics vary depending upon the source
Landfill Wastewater Treatment Plant
Agricultural Digester
MSW Digester
Gasifier
Higher Heating Value (Btu/cf)
208 – 644 550 – 650 550 – 646 N.A. 94 – 456
Temperature (°C) 10 – 30 30 – 40 40 – 60 N.A. N.A.
Methane (%) 20 – 70 55 – 77 30 – 75 50 – 60 1 – 20
Carbon Dioxide (%) 15 – 60 19 – 45 15 – 50 34 – 38 10 – 30
Hydrogen Sulfide (ppm)
0 – 20,000 1 – 8,000 10 – 15,800 70 – 650 80 – 800
Nitrogen (%) 0 – 50 < 8.1 0 – 5 0 – 5 40 – 70
Oxygen (%) 0 – 10 0 – 2.1 0 – 1 0 – 1
Hydrogen (%) 0 – 5 0 0 N.A. 10 – 60
Ammonia 0 – 1% 0 – 7 ppm 0 – 150 ppm N.A. 0.1 – 0.37%
Carbon Monoxide (%) 0 – 3 0 – 0.01 N.A. 10 – 45
Siloxanes (ppm) 0.1 – 4 1.5 – 10.6 0 – 4 N.A. N.A.
310

ARB/OEHHA 12 Constituents of Concern
Constituent of Concern
Risk Management Levels (ppmv)
Source-Specific Constituents of Concern
Trigger Level Lower Action
Level Upper Action
Level Landfills POTW Dairy
Carcinogenic Constituents of Concern Arsenic 0.006 0.06 0.15
p-Dichlorobenzene 0.95 9.5 24
Ethylbenzene 6.0 60 150
n-Nitroso-di-n-propylamine
0.006 0.06 0.15
Vinyl Chloride 0.33 3.3 8.3
Non-carcinogenic Constituents of Concern Antimony 0.12 1.2 6.1
Copper 0.02 0.23 1.2
Hydrogen Sulfide 22 216 1,080
Lead 0.009 0.09 0.44
Methacrolein 0.009 3.7 18
Alkyl Thiols (Mercaptans)
12 120 610
Toluene 240 2,400 12,000
311

ARB/OEHHA 12 Constituents of Concern
• Unique to California
• Technology suppliers need to test systems for treatment of new contaminants
• Added to PG&E, SoCalGas, SDGE, and SWGas gas tariffs
• IOUs additionally hold biomethane to prior (except SWGas) natural gas quality standards
• PG&E Gas Rule No. 21
• SoCalGas Rule No. 30
• SDGE Rule 30
• SWGas Rule No. 22 (new) 312

Investor-Owned Utility Natural Gas Pipeline Injection Stds
PG&E SoCalGas SDGE SWGas Higher Heating Value (Btu/cf)
750 – 1150
(990 - 1050)*
990 - 1150 990 -1150 950 - 1150
Temperature (°F) 60 - 100 50 - 105 50 - 105 40 - 120
Carbon Dioxide (%) 1 3 3 2
Water Vapor (lb/MMscf)
7 7 7 7
Hydrogen Sulfide (ppm)
4 4 4 N.A.
Mercaptans (ppm) 8 5 5 N.A.
Total Sulfur (ppm) 17 12.6 12.6 34
Total Inerts (%) 4 4 4 4
Nitrogen (%) N.A. N.A. N.A. 3
Oxygen (%) 0.1 0.2 0.2 0.2
Hydrogen (%) 0.1 0.1 0.1 0.1
Ammonia (%) 0.001 0.001 0.001 0.001
Siloxane (mg/m³) 0.01 – 0.1 0.01 – 0.1 0.01 – 0.1 0.01 – 0.1
313

Source vs End Use Quality
Compound Landfill Wastewater Treatment Plant
Agricultural Digester
MSW Digester
Gasifier
HHV (Btu/cf) 208 – 644 550 – 650 550 – 646 N.A. 94 – 456
CO2 (%) 15 – 60 19 – 45 15 – 50 34 – 38 10 – 30
H2S (ppm) 0 – 20,000 1 – 8,000 10 – 15,800 70 – 650 80 – 800
PG&E SoCalGas SDGE SWGas HHV (Btu/cf) 750 – 1150
(990 - 1050)
990 - 1150 990 -1150 950 - 1150
CO2 (%) 1 3 3 2
H2S (ppm) 4 4 4
• Need to remove contaminants
• Need to increase HHV
• Accomplished by removing CO2
314

Source vs End Use Quality
Compound Landfill Wastewater Treatment Plant
Agricultural Digester
MSW Digester
Gasifier
HHV (Btu/cf) 208 – 644 550 – 650 550 – 646 N.A. 94 – 456
CO2 (%) 15 – 60 19 – 45 15 – 50 34 – 38 10 – 30
H2S (ppm) 0 – 20,000 1 – 8,000 10 – 15,800 70 – 650 80 – 800
PG&E SoCalGas SDGE SWGas HHV (Btu/cf) 750 – 1150
(990 - 1050)
990 - 1150 990 -1150 950 - 1150
CO2 (%) 1 3 3 2
H2S (ppm) 4 4 4
?
• Removing contaminants Cleaning
• Removing CO2 Upgrading
315

Contaminants Removal – Biogas Cleaning Techniques
• Adsorption
• H2S, (VOCs), (NH3),
(Siloxanes), (Moisture)
• Water Scrubbing
• H2S, VOCs, NH3, Siloxanes
• Biofiltration
• H2S, VOCs, (NH3), (Siloxanes)
• Refrigeration/Chilling
• Moisture
Enduro OdorClean 250/500
Robinson Group SulfrPack
Pioneer Air Systems
Willexa Energy BGAK Siloxane Reduction
316

CO2 Removal – Biogas Upgrading Technologies
• Pressure swing adsorption
• Chemical solvent scrubbing (amines)
• Pressurized water scrubbing
• Physical solvent scrubbing (organic glycols)
• Membrane separation
• Cryogenic distillation
• Supersonic separation
• Industrial/Ecological lung
Emerging
Most Applied
Commercially Applied
317

Biogas Upgrading Efficiencies
*Multiple stages required for high CH4 purity, but results in higher methane slip
Product CH₄ (%)
Product HHV (Btu/cf)
Product H2S (ppm)
Methane Loss/Slip (%)
Sulfur Pre-Treatment
Pressure Swing Adsorption
95 – 98 960 – 990 < 4 1 – 3.5 Required
Amine Absorption
99 1000 < 0.2 – 8 0.04 – 0.1 Preferred / Required
Pressurized Water Scrubbing
93 – 98 940 – 990 < 1 – 2 1 – 3 Not needed / Preferred
Physical Solvent Scrubbing
95 – 98 960 – 990 < 0.1 – 20 1.5 – 4 Not needed / Preferred
Membrane Separation
85 – 99* 860 – 1000 < 1 – 4 0.5 – 20 Preferred
Cryogenic Distillation
96 – 98 970 – 990 < 0.02 0.5 – 3 Preferred / Required
Supersonic Separation
95 960 ? 5 Not needed
318

Majority of upgrading technologies unable to achieve specified gas quality in one stage
• Amine absorption is expensive, complicated, and requires difficult/costly O2 pre-removal
• Other systems require more than one upgrading system / stages to reach 990 Btu/cf
• Single upgrading systems already expensive
319

Potential Solutions to HHV Issue
• Lower HHV standards
320

Other U.S. Natural Gas Pipeline Injection Stds
• Similar contaminant standards
Location / Region North Pacific US New Mexico Texas Southern US
Company Williams Northwest Pipeline
New Mexico Gas Company
Atmos Energy Gulf South Pipeline Company
HHV (Btu/cf) ≥ 985 950 – 1100 950 – 1100 950 – 1175
H2S (ppm) 4 4 4 16
CO2 (%) 2% 2% 2% 3%
Location / Region Kansas Michigan Midwest US New England
Company Kansas Gas Service
Westcoast Energy Inc.
Northern Natural Gas
Algonquin Gas Transmission
HHV (Btu/cf) 950 – 1100 ≥ 966 ≥ 950 967 – 1110
H2S (ppm) 4 4.3 4 8
CO2 (%) 2% 2% 2% 2%
• Lower HHV than CA IOUs
321
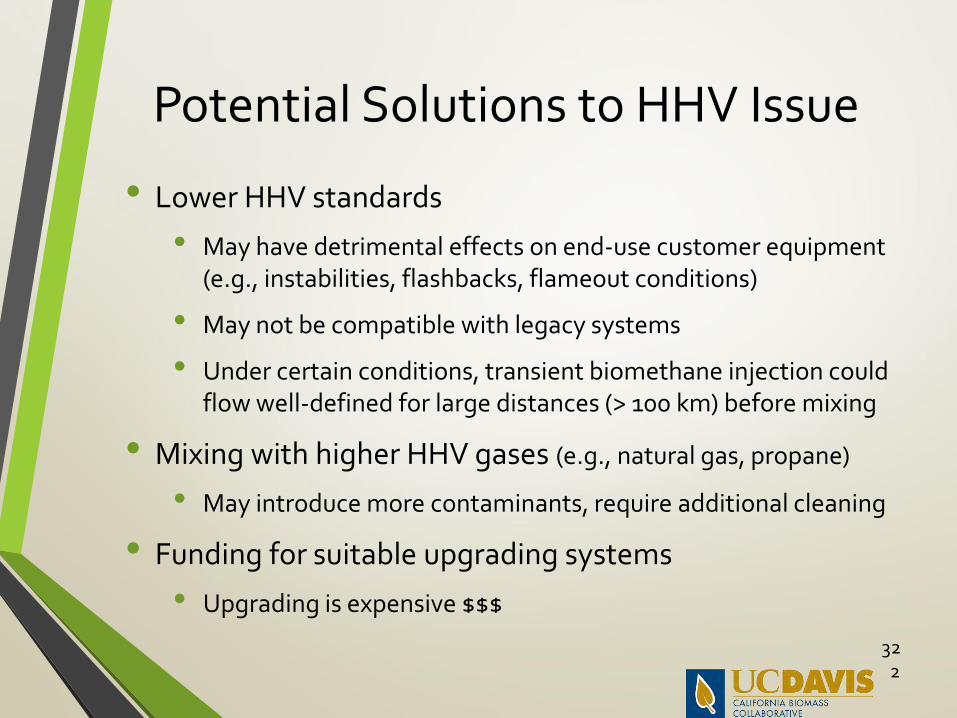
Potential Solutions to HHV Issue
• Lower HHV standards
• May have detrimental effects on end-use customer equipment (e.g., instabilities, flashbacks, flameout conditions)
• May not be compatible with legacy systems
• Under certain conditions, transient biomethane injection could flow well-defined for large distances (> 100 km) before mixing
• Mixing with higher HHV gases (e.g., natural gas, propane)
• May introduce more contaminants, require additional cleaning
• Funding for suitable upgrading systems
• Upgrading is expensive $$$
322
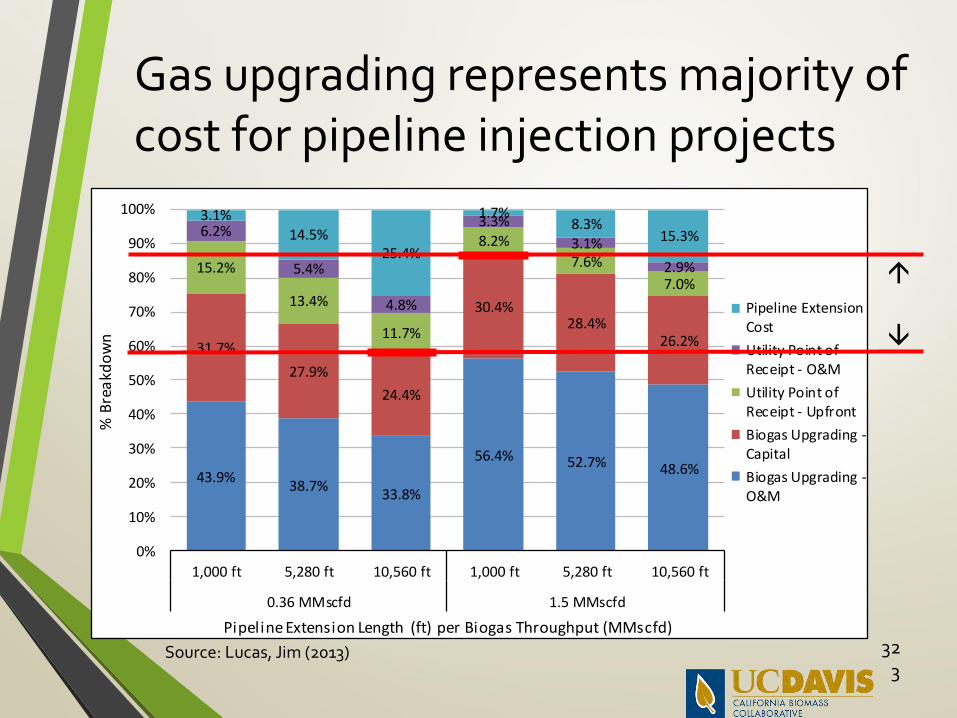
Gas upgrading represents majority of cost for pipeline injection projects
Source: Lucas, Jim (2013)
43.9%38.7%
33.8%
56.4% 52.7% 48.6%
31.7%
27.9%
24.4%
30.4%28.4%
26.2%
15.2%
13.4%
11.7%
8.2%
7.6%
7.0%
6.2%
5.4%
4.8%
3.3%
3.1%
2.9%
3.1%14.5%
25.4%
1.7%8.3%
15.3%
0%
10%
20%
30%
40%
50%
60%
70%
80%
90%
100%
1,000 ft 5,280 ft 10,560 ft 1,000 ft 5,280 ft 10,560 ft
0.36 MMscfd 1.5 MMscfd
% B
rea
kdo
wn
Pipeline Extension Length (ft) per Biogas Throughput (MMscfd)
Pipeline ExtensionCost
Utility Point ofReceipt - O&M
Utility Point ofReceipt - Upfront
Biogas Upgrading -Capital
Biogas Upgrading -O&M
323

Recommendations
• Lower HHV standards to 960 – 980 Btu/cf (?)
• Must first investigate effects of biogas mixing through pipeline system (e.g., proper dilution ratios, mixing behavior, injection rate)
• Have 12 constituents of concern apply before being mixed with natural gas, not at point of injection
• Discuss potential funding/cost-sharing options for biogas cleaning/upgrading
• Can model process from other countries (e.g., Germany)
• Ongoing second phase of AB 1900 implementation
324

Appendix
326
Many options for beneficial biogas utilization
• Boilers
• Reciprocating Engines / Internal combustion
• Microturbines
• Fuel Cells
• Vehicle Fuel
• Natural Gas Pipeline Injection
327

Technical limitations of biogas utilization equipment
*Only for alkaline fuel cells
Reciprocating Engines
Microturbines Fuel Cells CNG Vehicles
Minimum HHV (BTU/cf)
400 – 1,200 350 – 1,200 450 – 1,000 900
Methane > 60% > 35 – 60% > 88%
CO2 (%) < 0.01 – 0.05*
Hydrogen Sulfide (ppm)
< 50 – 500 < 1,000 – 70,000 < 0.1 – 10
Total S (ppm) < 542 – 1,742 < 0.01 – 50 < 16
Oxygen (%) < 3 < 4 < 1
Hydrogen (%) < 0.1
NH3 (ppm) < 25 < 200 < 0.05 – 200
CO (ppm) < 0.001 – 50 < 1,000
Chlorine (ppm) < 40 – 491 < 200 – 250 < 0.1 – 5 < 1,000
Fluorine (ppm) < 40 < 1,500 < 0.1 – 5
Siloxanes (ppm) < 2 < 0.005 < 0.01 – 100 < 1
Particle size < 3 μm < 10 μm < 10 μm
328

Source vs End Use Quality
Compound Landfill Wastewater Treatment Plant
Agricultural Digester
MSW Digester
Gasifier
HHV (Btu/cf) 208 – 644 550 – 650 550 – 646 N.A. 94 – 456
CO2 (%) 15 – 60 19 – 45 15 – 50 34 – 38 10 – 30
H2S (ppm) 0 – 20,000 1 – 8,000 10 – 15,800 70 – 650 80 – 800
Reciprocating Engines
Microturbines Fuel Cells CNG Vehicles
HHV (BTU/cf) 400 – 1,200 350 – 1,200 450 – 1,000 900
CO2 (%) < 0.01 – 0.05*
H2S (ppm) < 50 – 500 < 1,000 – 70,000 < 0.1 – 10 N.A.
PG&E SoCalGas SDGE SWGas HHV (Btu/cf) 750 – 1150
(990 - 1050)
990 - 1150 990 -1150 950 - 1150
CO2 (%) 1 3 3 2
H2S (ppm) 4 4 4
329

California Renewable Energy Center
9:00 Introduction and Overview
9:15 Integrated assessment of renewable technology options
10:15 Break
10:30 Assessment of Co-located renewable generation potential
11:00 Assessment of geothermal in under-served regions
11:30 Solar heating and cooling technology analysis
Noon Lunch
1:15 California off-shore wind technology assessment
1:45 Technical assessment of small hydro
2:15 Biomass resources and facilities database update
2:45 Break
3:00 Assessment of sustainability for new/existing biomass energy
3:30 Biomass/MSW gap assessment and tech options for biogas clean-up
4:15 Future research recommendations
4:45 Closing
California Renewable Energy Center
Future Research
Recommendations

California Renewable Energy Center
Future Research Recommendations by Technology
1. DOE SunShot set the goal of $0.06 per kWh for 2020
2. CSP-Tower and enhanced thermal storage
3. Development and production of both Silicon-based and nanostructured solar
cells in the US
4. Evaluation of reduction in soft costs
1. Costs generally need to be reduced across all biopower technologies
2. Reliable gas cleaning and tar reforming methods need to be demonstrated
3. For renewable natural gas via thermal gasification, H2 in final product issue
needs to be explored and solved
4. Develop or expand basic research programs in US and California in the area
of BIG-FC.

California Renewable Energy Center
Future Research Recommendations by Technology
1. Resource: Higher resolution geophysical and geochemical methods to
characterize and localize resources; integrated approaches for resource
assessments; optimization tools to match diverse resources with applications
2. Technology: More efficient use of water; more efficient extraction; detailed
cost, ramp rate, and market studies for flexible geothermal
1. Optimization of wind plants (rather than turbines) to minimize LCOE.
2. Plant controls to manage ramp mitigation.
3. On-site storage systems.
4. More accurate power output forecasting models.
5. Improved short-term event prediction tools.
6. Off-shore: Technical, regulatory, environmental, economic barriers
exacerbated in CA due to extreme off-shore water depths.
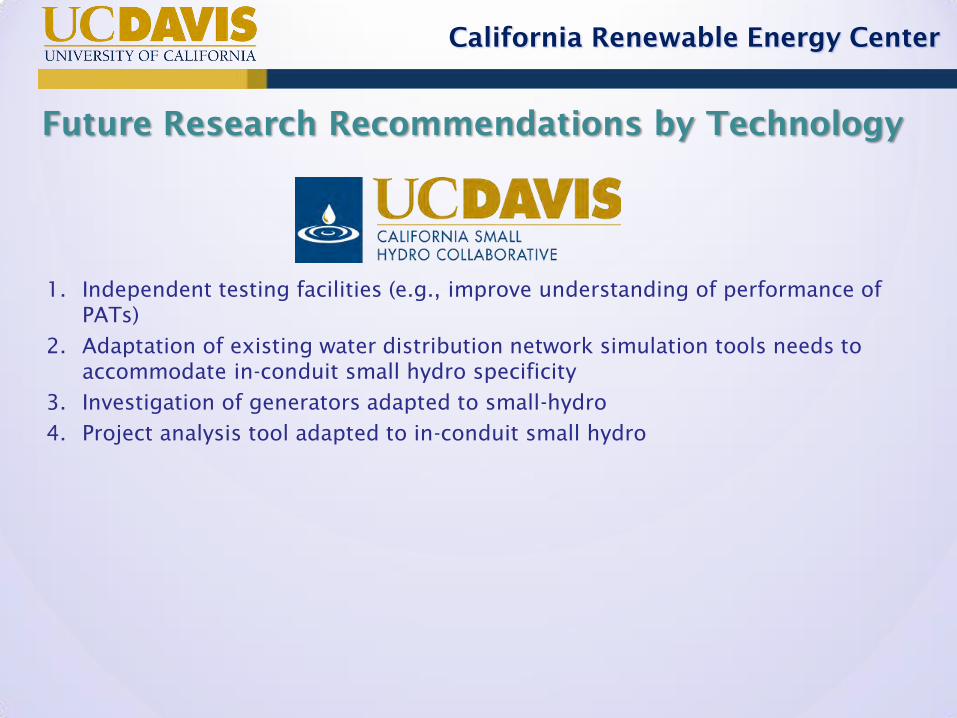
California Renewable Energy Center
Future Research Recommendations by Technology
1. Independent testing facilities (e.g., improve understanding of performance of
PATs)
2. Adaptation of existing water distribution network simulation tools needs to
accommodate in-conduit small hydro specificity
3. Investigation of generators adapted to small-hydro
4. Project analysis tool adapted to in-conduit small hydro

California Renewable Energy Center
335
General Observation: Future R&D Needs
• Better integration of demand side management with renewable
supply (can DSM play a bigger role in off-setting the variability of
intermittent renewables?)
• Evaluation of how renewable microgrids can be optimally
integrated into utility infrastructure
• Assessment of the impacts of state’s electric vehicle and ZNE
goals on the design and management of electric infrastructure
and the overall energy usage of the state (e.g., will goals result in
greater electric demand? Less natural gas?)
• Develop standardized methods for optimizing an energy mix
based on overall LCOE, emissions, maximized generation
• Quantification of the total benefits (including societal benefits,
ancillary services, environmental impact) of all renewables to
distinguish among different renewables.
• Better decision support tools for policymakers that incorporate
modeling that allows for optimization of siting localized/regional
renewables

California Renewable Energy Center
336
General Observation: Future R&D Needs (cont’d)
• Assessment of emerging technologies that may allow renewables
to provide flexible capacity needed to meet system needs.
• Develop constrained optimization models that support a strong
renewable market while optimizing siting that minimizes
environmental impacts.
• Coordinate resource assessment methods to achieve consistent
metrics for generation outputs including storage
• Identify energy mix zones (analogous to climate zones) to
optimize assessment and development efforts and streamline
incentives.
• Incorporate demand data at fine spatial resolution. Opportunity
to encourage distributed installations by power consumers.
• Region-specific distribution level integration studies, including
smart grid technologies, vehicle-to-grid, and energy storage.
California Renewable Energy Center
9:00 Introduction and Overview
9:15 Integrated assessment of renewable technology options
10:15 Break
10:30 Assessment of Co-located renewable generation potential
11:00 Assessment of geothermal in under-served regions
11:30 Solar heating and cooling technology analysis
Noon Lunch
1:15 California off-shore wind technology assessment
1:45 Technical assessment of small hydro
2:15 Biomass resources and facilities database update
2:45 Break
3:00 Assessment of sustainability for new/existing biomass energy
3:30 Biomass/MSW gap assessment and tech options for biogas clean-up
4:15 Future research recommendations
4:45 Closing
California Renewable Energy Center
Closing Remarks

THANK YOU!
For more information:
Adam Schultz
Program Manager, UC Davis Energy Institute
http://energy.ucdavis.edu