The Global Hydrosphere Mapper - Byrd Polar Research Center
13
The Global Hydrosphere Mapper Response to the National Research Council Decadal Survey Request L-L. Fu (1) , E. Rodriguez (2) Jet Propulsion Laboratory California Institute of Technology (1) [email protected] (2) [email protected] 1. Concept Description The proposed concept is to fly a radar interferometry system to make high-resolution measurement of the surface of the ocean and water bodies on land. The concept can be considered as a Hydrosphere Mapper. The technical approach is based on a seven-year study and development of a Wide-Swath Ocean Altimeter (WSOA) funded by NASA to address an important missing link in the ocean-circulation component of the Earth system (Fu and Rodriguez, 2004). WSOA was to be flown as an experimental payload on the Ocean Surface Topography Mission (OSTM, a follow-on mission of Jason and TOPEX/Poseidon). Due to funding problems, WSOA has recently been removed from OSTM. However, the maturity of the development of the instrument has been critically reviewed and endorsed by expert groups at JPL as well science community at large. The legacy of WSOA provides a strong technical base for the development of the next generation Hydrosphere Mapper. This concept paper is complementary to the NRC concept paper entitled “WatER: the Wat er E levation R ecovery Satellite”, submitted by Alsdorf, Rodriguez, Lettenmaier, and Famiglietti. The proposed interferometer instrument and orbit concepts are identical to those proposed in that mission concept. In order to obtain the required accuracy for ocean mapping, we supplement the WatER instrument with a Ku-band nadir altimeter and a 3- frequency water vapor radiometer, as in the TOPEX/Jason instrument configuration. The purpose of this concept paper is to concentrate on the oceanographic and bathymetric applications that could be made of the data collected by that instrument, leading to a complete coverage of the Earth’s hydrosphere by a single mission. The measurement of ocean surface topography by precision altimetry missions like TOPEX/Poseidon and Jason has revolutionized oceanography. For the first time, the large-scale ocean circulation and heat storage of the global oceans has been well sampled for a long period of time, leading to a wide range of new scientific discoveries and societal benefits (Fu and Cazenave, 2001). A significant drawback of nadir-looking radar altimetry is the coarse spatial resolution in the direction perpendicular to the spacecraft’s ground tracks. For a 10-day repeat orbit like the orbits of T/P and Jason, the cross-track
Transcript of The Global Hydrosphere Mapper - Byrd Polar Research Center

The Global Hydrosphere Mapper
Response to the National Research Council Decadal Survey Request
L-L. Fu(1), E. Rodriguez(2)
Jet Propulsion Laboratory California Institute of Technology
(1) [email protected] (2) [email protected]
1. Concept Description The proposed concept is to fly a radar interferometry system to make high-resolution
measurement of the surface of the ocean and water bodies on land. The concept can be considered as a Hydrosphere Mapper. The technical approach is based on a seven-year study and development of a Wide-Swath Ocean Altimeter (WSOA) funded by NASA to address an important missing link in the ocean-circulation component of the Earth system (Fu and Rodriguez, 2004). WSOA was to be flown as an experimental payload on the Ocean Surface Topography Mission (OSTM, a follow-on mission of Jason and TOPEX/Poseidon). Due to funding problems, WSOA has recently been removed from OSTM. However, the maturity of the development of the instrument has been critically reviewed and endorsed by expert groups at JPL as well science community at large. The legacy of WSOA provides a strong technical base for the development of the next generation Hydrosphere Mapper.
This concept paper is complementary to the NRC concept paper entitled “WatER: the
Water Elevation Recovery Satellite”, submitted by Alsdorf, Rodriguez, Lettenmaier, and Famiglietti. The proposed interferometer instrument and orbit concepts are identical to those proposed in that mission concept. In order to obtain the required accuracy for ocean mapping, we supplement the WatER instrument with a Ku-band nadir altimeter and a 3-frequency water vapor radiometer, as in the TOPEX/Jason instrument configuration. The purpose of this concept paper is to concentrate on the oceanographic and bathymetric applications that could be made of the data collected by that instrument, leading to a complete coverage of the Earth’s hydrosphere by a single mission.
The measurement of ocean surface topography by precision altimetry missions like
TOPEX/Poseidon and Jason has revolutionized oceanography. For the first time, the large-scale ocean circulation and heat storage of the global oceans has been well sampled for a long period of time, leading to a wide range of new scientific discoveries and societal benefits (Fu and Cazenave, 2001). A significant drawback of nadir-looking radar altimetry is the coarse spatial resolution in the direction perpendicular to the spacecraft’s ground tracks. For a 10-day repeat orbit like the orbits of T/P and Jason, the cross-track

spacing between ground tracks is over 300 km at the equator (reduced to 200 km at 50° latitude). Therefore, nadir-looking altimetry has inherently inhomogenous spatial resolution- 7 km along-track, 200-300 km cross track. This drawback has thus prevented the ability of computing the two-dimensional current velocity of the ocean and resolving the oceanic mesoscales, which contain 90 % of the kinetic energy of ocean circulation. The technique of radar interferomety will be able to provide a uniform spatial resolution of better than 5 km, approaching the smallest scales of ocean current signals in ocean surface topography. Radar interferometry is a natural candidate for the baseline technique of measuring ocean surface topography in the future.
For land hydrology mapping, we envision that the data set provided by this mission
would be the first global assessment of surface water storage and the first chance for monitoring the storage changes of fresh water over a multi-year period. In addition, by coupling our measurements with hydrologic models, we expect to be able to produce global estimates of river run-off globally, an essential input to the understanding of the Earth’s water cycle. For further details on the Land hydrology measurement concept and science payoff, we refer the reader to the WatER concept paper by Alsdorf et al. 2. Science and Societal Benefits 2.1 Ocean Surface Topography The height of sea surface, or the OST (denoted as OST hereafter), reveals a great deal
of information about the physical state of the ocean as well as the earth’s gravity field. To a first approximation, OST is determined by the earth’s gravity field, which conforms the sea surface close to an equi-geopotential surface called the geoid. A variety of oceanic processes may cause OST to deviate from the geoid, including waves, tides, and currents. The knowledge of OST thus has many applications to oceanography and geophysics.
2.1.1 Mesoscale Currents and Eddies The strongest currents of the ocean such as the Gulf Stream and Kuroshio have a spatial
scale of a few tens of kilometers in the cross-stream direction. These currents and their meanders and eddies carry most of the kinetic energy of the ocean. Recent numerical experiments suggest that only models that are able to fully resolve these scales can simulate realistic heat transport of the ocean that affects global climate. The validation of these models needs high-resolution observations of OST. To make realistic simulation and forecast of ocean currents, the models also need to assimilate high-resolution OST data. We present in Figure 1 examples of the unique ocean data that would be collected by this mission and which would provide a unique data set for studying the ocean mesoscale circulation. These data would include vector geostrophic velocities, relative vorticity, and Reynolds stress tensor measurements. These measurements would be available at every point imaged by the instrument, not just at the orbit cross-overs, as in current altimeter instruments.

2.1.1 Coastal Processes Transport processes in the coastal ocean are of interest to both scientific research and
operational applications. Scientific issues include: coastal upwelling and cross-shelf transport of mass, salt, and nutrients; the degree of topographic control over the shelf; the effect of the coastal circulation on marine organisms; changes to coastal ocean ecosystems caused by climate variability, etc. The need for operational nowcasts and forecasts of the coastal ocean circulation arises from the heavy human utilization of the coastal ocean – fishing, transportation, recreation, waste disposal, habitation next to the water’s edge, and the search and rescue services needed by those engaged in the above activities. The required spatial resolutions for certain operational applications may approach 1 km, but the fundamental scales controlling the dynamics of coastal currents are generally 5-15 km and can be resolved by the intrinsic resolution of the Hydrosphere Mapper with synthetic aperture capability (see below).
2.1.3 Biogeochemical Processes Measurements of ocean color from space have revealed complex patterns at mesoscales.
At these scales, ocean color variability is modulated by physical processes either directly by turbulent advection and stirring or indirectly via impacts on phytoplankton growth rates and trophic interactions. The pattern of the underlying biogeochimcal processes exhibits latitudinal variation with maximal values of 250-300 km along the Equator. The scale decreases poleward to less than 50 km near the poles. The latitudinal decrease in biological spatial scales is similar to the latitudinal variation of the scales of mesoscale eddy motions, suggesting that the mesoscale eddies play an important roles in determining the biological variability. The high-resolution, eddy-resolving observations of OST thus has important applications to the study of biogeochemical processes.
2.1.4 Ocean Bathymetry In the wavelength band of 10-100 km, the details of sea-floor topography can be estimated
from the slope of OST, providing the fine-scale ocean bathymetry that is important to the modeling of ocean currents, eddies and mixing, as well as geophysical applications. In order to make significant improvement in the current knowledge of ocean baythymetry, measurement of the slope of OST must meet an accuracy of 1 micro radian with a wavelength resolution of 15 km, or better (Smith et al., 2002). Note that 1 micro radian corresponds to the slope of 1 mm over 1 km. The Hydrosphere Mapper with synthetic aperture capability will meet this requirement.
2.1.5 Hurricane Forecast The observation of OST has been used with models in computing the “heat potential” for
the prediction of the intensity of hurricanes. The spatial structure of a hurricane is complex, requiring high-resolution observations. Existing studies, based on the merging of multiple satellite altimeter observations, have shown a 17% improvement in the 96 hour lead-time

forecast of Hurricane Ivan. NOAA’s National Hurricane Center is now routinely using altimeter data for hurricane forecast, but the resolution of the data is likely to decrease due to the lack of multiple altimeter missions in the future (Goni and Trinanes, 2003). The Hydrosphere Mapper will demonstrate making high-resolution measurements with a single spacecraft.
2.1.6 Offshore Operations and Navigation High-resolution OST data, obtained from multiple satellites, have been used by many
offshore operations. A notable example is the information on the eddy currents in the Gulf of Mexico. This information has been used by marine operators in scheduling offshore drilling operations with significant cost savings. Information on the surface currents has also been useful for aiding ship routing and yacht racing. More information on this application can be found at http://wwwccar.colorado.edu/~altimetry/applications/offshore/index.html
2.1.7 Fisheries Management The fishing industry is using OST data to locate likely places of higher fish
concentrations and also to pinpoint locations of target species. Fishery Managers have used multiple-satellite data in conjunction with other remotely sensed data sets in the following areas:
• Fisheries management research, e.g. swordfish studies (e.g. see http://sealevel.jpl.nasa.gov/science/swordfish.html • Mitigation of fisheries interaction with sea turtles • Recovery of endangered Monk Seals • Monitoring and assessment of Coral reef ecosystems and essential fish habitats.
Spatial resolution is a key issue regarding the utility of the observations. The Hydrosphere Mapper will make headways in this application.
3. Technical and Mission Characteristics 3.1 Mapping Requirements We envision an instrument that will be able to meet the space-time mapping
requirements for a variety of science applications. Below, we summarize the requirements for the applications outlined above. Further details can be found in (Fu and Rodriguez, 2004) and (Alsdorf and Lettenmaier, 2003).
Mesoscale Currents and Eddies and Biogeochemical Processes: Most mesoscale
activity will be mapped by a Topex/Jason orbit (66o inclination), but there are
advantages, if possible, in extending the latitude coverage to include the full Antarctic Circumpolar current. The spatial resolution of the instrument should be smaller than one-half the Rossby radius of deformation: 15 km for most mid-latitude eddies, smaller (5 km – 10 km) for higher latitude eddies. The temporal revisit time should be between 10 days (e.g., TOPEX/Jason) and 17 days (e.g., GeoSAT). The height accuracy should be greater than 5 cm. Since biogeochemical processes are strongly coupled with mesoscale eddies, the sampling requirements are similar to the ones outlined above.
Coastal Processes: Similar to the previous set of requirements, but with reduced spatial
scales. The desired spatial sampling will be between 5 km and 10 km. An 8-day temporal sampling is adequate. This sampling will be obtained by combining ascending and descending passes of the 16-day repeat orbit proposed for WatER.
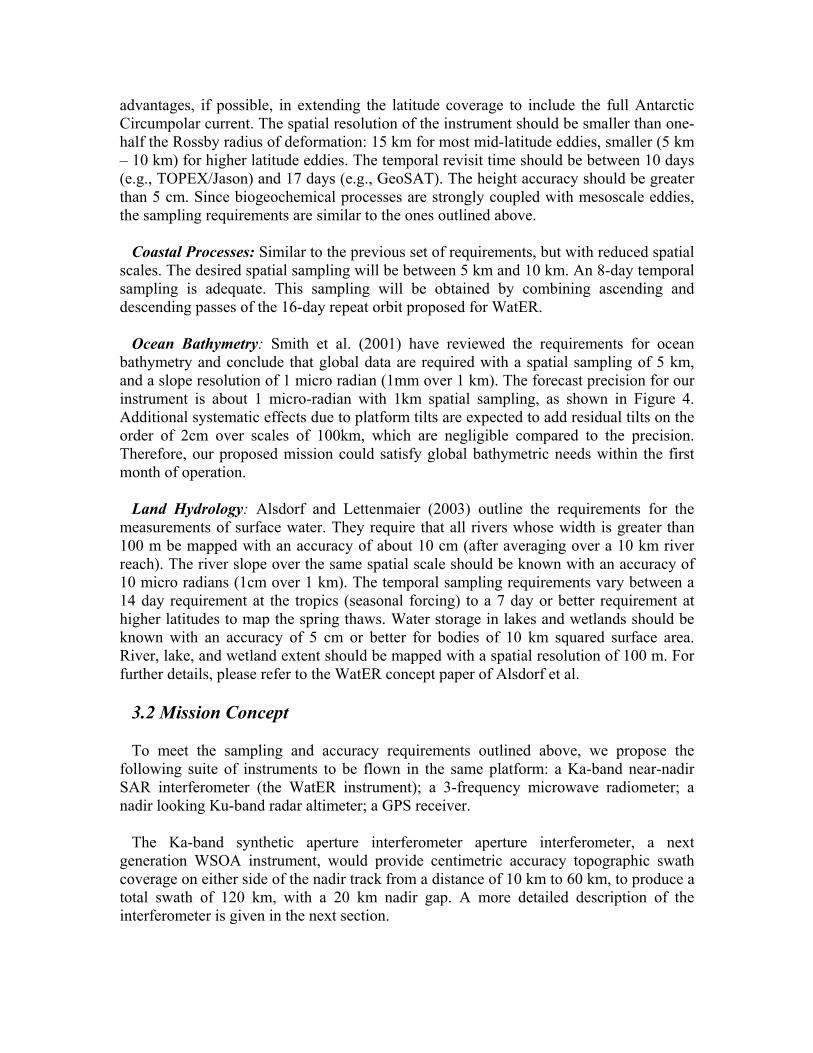
Ocean Bathymetry: Smith et al. (2001) have reviewed the requirements for ocean
bathymetry and conclude that global data are required with a spatial sampling of 5 km, and a slope resolution of 1 micro radian (1mm over 1 km). The forecast precision for our instrument is about 1 micro-radian with 1km spatial sampling, as shown in Figure 4. Additional systematic effects due to platform tilts are expected to add residual tilts on the order of 2cm over scales of 100km, which are negligible compared to the precision. Therefore, our proposed mission could satisfy global bathymetric needs within the first month of operation.
Land Hydrology: Alsdorf and Lettenmaier (2003) outline the requirements for the
measurements of surface water. They require that all rivers whose width is greater than 100 m be mapped with an accuracy of about 10 cm (after averaging over a 10 km river reach). The river slope over the same spatial scale should be known with an accuracy of 10 micro radians (1cm over 1 km). The temporal sampling requirements vary between a 14 day requirement at the tropics (seasonal forcing) to a 7 day or better requirement at higher latitudes to map the spring thaws. Water storage in lakes and wetlands should be known with an accuracy of 5 cm or better for bodies of 10 km squared surface area. River, lake, and wetland extent should be mapped with a spatial resolution of 100 m. For further details, please refer to the WatER concept paper of Alsdorf et al.
3.2 Mission Concept To meet the sampling and accuracy requirements outlined above, we propose the
following suite of instruments to be flown in the same platform: a Ka-band near-nadir SAR interferometer (the WatER instrument); a 3-frequency microwave radiometer; a nadir looking Ku-band radar altimeter; a GPS receiver.
The Ka-band synthetic aperture interferometer aperture interferometer, a next
generation WSOA instrument, would provide centimetric accuracy topographic swath coverage on either side of the nadir track from a distance of 10 km to 60 km, to produce a total swath of 120 km, with a 20 km nadir gap. A more detailed description of the interferometer is given in the next section.

The nadir gap would be filled with a Ku-band nadir altimeter, similar to the Jason altimeter, but with the capability of doing synthetic aperture processing to improve the along-track spatial resolution. In addition to providing nadir coverage, the Ku-band instrument would be able to collect during rain, provide data for the calibration of the Ka-band interferometer, and, in conjunction with the Ka-band instrument (which will also have nadir data), provide accurate data for correcting ionospheric delays. For our mission, we envision using a nadir altimeter identical to the Ku-band instrument which will be used for the Ocean Surface Topography Mission (OSTM or Jason-2).
The 3-frequency radiometer would be used for the estimation of the wet tropospheric
delay along the nadir direction, as has been done for the TOPEX and Jason Altimeters. Finally, also as in TOPEX and Jason, the GPS receiver would be used to obtain a centimeter level precision orbit. As with the nadir altimeter, we envision using identical radiometers and GPS receivers as those used for the OSTM mission, as those will be sufficient for meeting the science requirements.
Orbit selection for this mission must be a compromise between the desired temporal
sampling and the 120 km swath capabilities of the Ka-band interferometer. In order to improve platform stability by reducing the articulation in the solar panels, and, also, to reduce the amount of battery power required for the bus, we select a 98o inclination sun-synchronous orbit with a repeat period of 16 days, similar to the repeat period of the Terra satellite. Due to the swath coverage, the average temporal separation between observations will be approximately 8 days, since ascending and descending tracks can be used for observations. The coverage will be nearly global for all latitudes smaller than 82o, but there will be small gaps around the equator, which will not impact the spatial coverage of rivers, lakes, or mesoscale activity (see Figure 2).
3.3 Ka-band Interferometer The instrument we propose is a direct descendant of the Wide-Swath Ocean Altimeter
concept (Fu and Rodriguez, 2004), which had over 7 years of conceptual development and subsystem prototyping prior to its cancellation in 2005. Figure 3 presents a conceptual outline of the instrument configuration and Table 1 lists the key instrument parameters. In the following paragraphs, we briefly describe the basis for the interferometric measurements, and pay special detail to the differences between this system and WSOA.
Conventional altimetry is a ranging measurement which can only achieve limited
across-track spatial resolution (~1 km). These limitations can be overcome by the introduction of a second antenna to achieve triangulation by measuring the phase difference between the radar channels (Rodriguez and Martin, 1992; Rosen et al., 2000), a technique called synthetic aperture radar interferometry (IFSAR). This technique is quite mature and has been demonstrated from airborne platforms, and, most notably from space during the Shuttle Radar Topography Mission (SRTM), where two IFSARs (at C and X-bands) produced global data with an accuracy of a few meters.

In order to achieve centimetric accuracies over water, a few design changes to the SRTM design are required. The major contributor to height errors is the lack of knowledge of the knowledge of the interferometric baseline roll angle: an estimation error of δθ will result in a height error δh = xδθ, where x is the cross track distance. Clearly, the error will be reduced if one reduces the swath cross-track distance, or, equivalently, the radar look angles. In SRTM, the look angle varied from about 20o to about 60o. We propose to limit our maximum look angle to about 4.3o, which will reduce the outer swath error by about 14 times, compared to the SRTM outer swath attitude error, A similar reduction applies to errors due to phase, since the two errors have very similar angular signatures (Rodriguez and Martin, 1992).
The reduction in look angles entails a reduction in swath, from 220 km for SRTM, to
about 50 km (from 10 km to 60 km in cross-track distance), for our instrument. In order to mitigate this loss in coverage, we look to both sides of the nadir track to achieve a total swath of 120 km. The isolation between the two swaths is accomplished by means of offset feed reflectarray antennas which produce beams of orthogonal polarizations for each swath. This technology was developed for the WSOA and the antennas have been prototyped and their performance demonstrated.
The height noise of the instrument is proportional to the ratio between the
electromagnetic wavelength (λ) and the interferometric baseline (B). For SRTM, a 63 m baseline was required to achieve the desired height accuracy using a wavelength of 5.6 cm (λ/B~8.9x10-4). Such a large structure entails large costs. In order to reduce the instrument size, we choose a smaller wavelength (Ka-band, λ=0.86 cm), and reduce the interferometric mast size to 10 m (λ/B~8.6x10-4). The technology for a 10 m interferometric mast capable of meeting the stringent mechanical stability required for centimetric measurements has been developed in support of the WSOA technology development. Unlike WSOA, we propose to utilize Ka-band (not Ku) radar frequencies and a slightly longer mast (10m vs 6.4m) in order to improve the instrument precision over coastal regions and inland water bodies.
Height noise can be reduced by averaging neighboring image pixels. In order to achieve
centimetric height noise, and also in order to produce images of the water bodies, one must increase the intrinsic range resolution of the instrument. We choose a 200 MHz bandwidth system (0.75 m range resolution) to achieve ground resolutions varying from about 10 m in the far swath to about 70 m in the near swath. We achieve a resolution of about 5 m (after onboard data reduction) in the along track direction by means of synthetic aperture processing. To compensate for the fact that the radar signal is being reflected from a smaller area, we must increase the amount of power transmitted: we build on heritage from the CloudSat mission Extended Interaction Klystron (EIK) technology to achieve an appropriate signal to noise ratio for centimetric accuracies.
Notice that in order to achieve the desired resolution, SAR processing must be
performed. Current processing technology is not yet able to accommodate the required computations onboard. Therefore, we store the raw data, after passing it through an

averaging filter, and downlink it to the ground. The data downlink requirements for all the ocean and land water bodies can be met with 8 300Mbit/sec X-band stations.
Prameter Units Value Mass kg 150 Frequency GHz 35 Peak Transmit
Power W 1500
Duty Cycle % 2.65 RF Operating Power W 790 Operating
Time/Orbit % 40
Average Power/Orbit
W 316
Raw Data Rate Mbits/s 504 Data Volume/Orbit Gbytes 76 Antenna Length m 4 Antenna Width m 0.2 Boresight Look
angle deg 3.5
Baseline Length m 10 Orbit Height km 800 One-Sided Swath km 50 Number of Swaths 2 Range Resolution m 0.75 Azimuth Resolution m 5 Table 1: Key parameters for the Ka-band interferometer system.
3.4 Predicted Instrument Performance and Calibration
IFSAR errors can be separated into random errors, which are independent from pixel to pixel, and systematic errors, which consist of residual tilts over the entire swath. In addition to these instrumental errors, additional range errors can be caused by media delays due to wet and dry tropospheric delays and ionospheric delays.
Random errors are due to thermal noise in the system, and cannot be compensated. For
our system, their magnitude will depend on wind speed over the water surface, but, as an order of magnitude, they are on the order of 0.5 m for 10 m pixels. These errors can, however be reduced by averaging and typically they will decrease linearly with the surface area used for the averaging. Figure 4 presents the estimated precision of height and slopes as a function of the area over which the heights are averaged to produce a height estimate. As can be seen from these plots, the instrument precision will be more than adequate for meeting the science requirements.
Given these results, the instrument error budget will be dominated by systematic errors.
Fu and Rodriguez (2004) discuss a calibration procedure for reducing attitude and phase

errors using ocean cross-overs. We propose to utilize the same technique for this mission concept. For inland water bodies, we utilize an alternate procedure which utilizes available topographic maps (such as SRTM) to correct for long wavelength tilts. Table 2 presents an error budget for ocean and inland water bodies based on WSOA results (for ocean) and the characteristics of the SRTM calibration data (for land). Note that for land hydrology applications, only the height of the water relative to the surrounding land is required, so that the systematic errors of the SRTM map are acceptable for these applications.
Ocean Inland Precision 1 cm 1 cm Wet Troposphere 1 cm 5 cm EM Bias 1 cm 0.5 cm Ionosphere 1 cm 1 cm Orbit 1 cm 1 cm Residual Calibration
2 cm 5 cm
Total 3 cm 7 cm Table 2: Measurement error budget for ocean and inland water bodies.
4. Mission Heritage and Cost
As previously discussed, the concept presented here is based on the development of the Wide Swath Ocean Altimeter, so that there is a large amount of technical heritage and cost history which can be used to estimate the mission cost and risk. The major change relative to WSOA is the use of Ka-band as the interferometer frequency. The main technology driver in this change is the RF tube and the high voltage power supplies. Fortunately, many of these challenges have already been addressed by the Cloudsat mission. The manufacturer of the Cloudsat EIK is in the process of developing a tube based on Cloudsat technology at Ka-band. The high voltage power supply gained during the manufacture of Cloudsat can also be inherited directly by this mission. The other changes to the mast length and the radar antenna are well within the scope of current technology.
A second change relative to WSOA is the data volume for such a mission. As
previously stated, this would require 8 300 Mbit/sec ground stations. There is a large amount of heritage in the processing of such a data set based on the heritage from SRTM ground processor.
Based on these assumptions and the assumption of a 5 year mission lifetime, a
preliminary cost for this mission indicates that the mission will lie towards the lower end of a medium scope mission range ($200M to $500M). There are currently no major technology items requiring development before the implementation of this mission.

Summary We have presented a mission concept that, with minor enhancements to the proposed WatER surface water concept, would produce an unprecedented data set for studying the Earth’s hydrosphere. The instrument we propose builds on a solid heritage (SRTM, WSOA, Cloudsat, Jason, and TOPEX) and is feasible with current technology. The data that would be obtained by such an instrument would be invaluable for the study of both land and the ocean water bodies. We know of no other single mission that would have such an integrated capability to study these key components of the Earth system, which have importance for both basic science and societal needs. References Alsdorf, D., and Lettenmaier, D., Tracking fresh water from space, Science, 301, 1485-
1488, 2003. Fu, L.-L., and A. Cazenave, editors, 2001: Satellite Altimetry and Earth Sciences: A
Handbook of Techniques and Applications., Academic Press, San Diego, 463 pp Fu, L.-L., and E. Rodriguez, 2004: High-resolution measurement of ocean surface
topography by radar interferometry for oceanographic and geophysical applications, AGU Geophysical Monograph 150, IUGG Vol. 19: "State of the Planet: Frontiers and Challenges", R.S.J. Sparks and C.J. Hawkesworth, editors, 209-224.
G. Goni and J. Trinanes, Ocean thermal structure monitoring could aid in the intensity forecast of tropical cyclones, , EOS Transactions, American Geophysical Union, 84, pp.573-580, 2003.
Rodriguez, E. and Martin, J. M., Theory and Design of Interferometric Synthetic Aperture Radars, IEE Proceedings F, 139, 2, 1992, 147—159
Rosen, P., Hensley, S., Joughin, I.R., Li, F.K., Madsen, S., Rodriguez, E., Goldstein, R., Synthetic aperture radar interferometry, Proc. IEEE, vol. 88, 333-382, 2000.
W. H. F. Smith, R. K. Raney, and the ABYSS team, Altimetric Bathymetry from Surface Slopes (ABYSS): Seafloor geophysics from space for ocean climate, Weikko A Heiskanen Symposium in Geodesy, the Ohio State University, October 1--5, 2002, Columbus, Ohio.
Figures
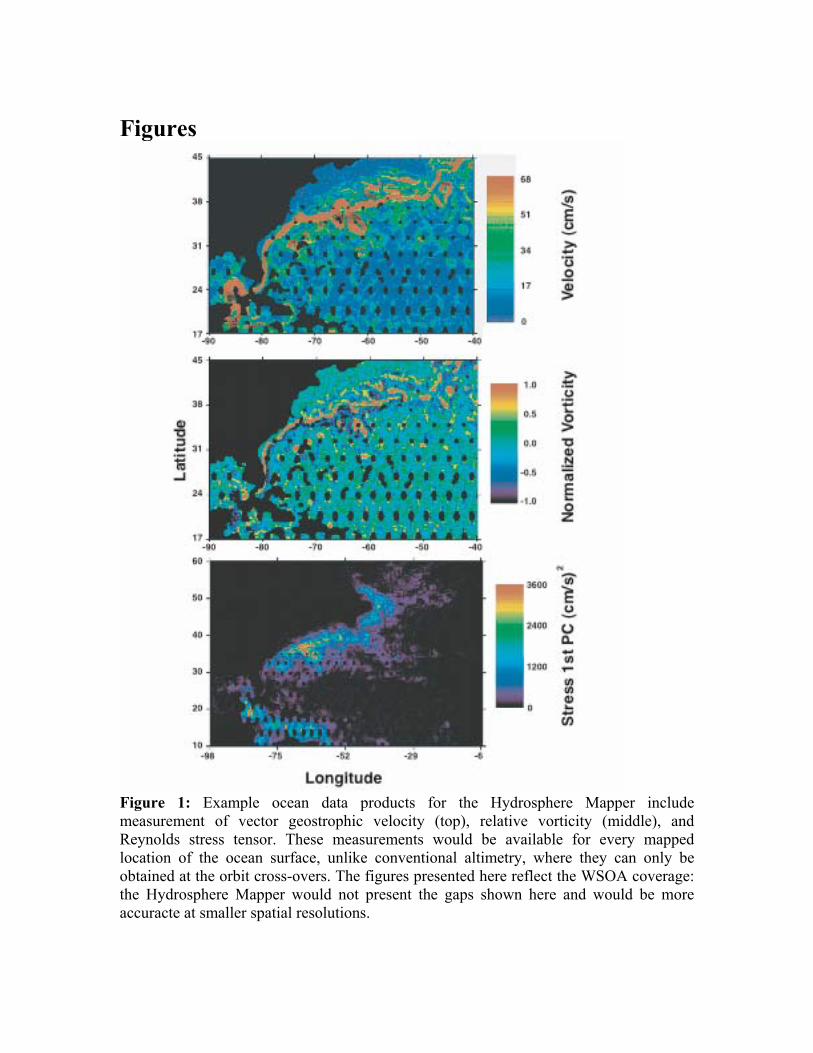
Figure 1: Example ocean data products for the Hydrosphere Mapper include measurement of vector geostrophic velocity (top), relative vorticity (middle), and Reynolds stress tensor. These measurements would be available for every mapped location of the ocean surface, unlike conventional altimetry, where they can only be obtained at the orbit cross-overs. The figures presented here reflect the WSOA coverage: the Hydrosphere Mapper would not present the gaps shown here and would be more accuracte at smaller spatial resolutions.

Figure 2: Spatial coverage of the proposed instrument for a 16-day repeat mission. The swath of the instrument is pictured in green, while the nadir altimeter coverage is in red. The figures to the right show the coverage of rivers and lakes for the swath instrument (black) and the nadir instrument (red). Even at the equator, near-global coverage is achieved: the small coverage gaps meet the science requirements.
Figure 3: Conceptual drawing of the Ka-band interferometer. Swaths on either side of nadir are mapped by horizontal (red) and vertical (blue) polarizations to avoid signal contamination. The spatial resolution will be 2m in the along-track direction and vary between 70 m in the near swath to 10 m in the far swath.
120 km Swath
Pulse Limited Swath
Global Lake Coverage Histogram
Global River Coverage Histogram

Figure 4: Predicted height and slope precisions as a function of the area used for obtaining an average height measurement and for a range of water surface slopes (or equivalently, wind speeds).