The Fruits of Disaggregation: the General Engineering ... · The Fruits of Disaggregation: the...
26
The Fruits of Disaggregation: the General Engineering Industry in Italy, 18611913 Stefano Fenoaltea No. 358 June 2014 www.carloalberto.org/research/working-papers © 2014 by Stefano Fenoaltea. Any opinions expressed here are those of the authors and not those of the Collegio Carlo Alberto. ISSN 2279-9362
Transcript of The Fruits of Disaggregation: the General Engineering ... · The Fruits of Disaggregation: the...
The Fruits of Disaggregation: the GeneralEngineering Industry in Italy, 18611913
Stefano Fenoaltea
No. 358June 2014
www.carloalberto.org/research/working-papers
© 2014 by Stefano Fenoaltea. Any opinions expressed here are those of the authors and not those ofthe Collegio Carlo Alberto.
ISSN 2279-9362
THE FRUITS OF DISAGGREGATION: THE GENERAL ENGINEERING INDUSTRY IN ITALY, 1861-1913
Stefano Fenoaltea* Collegio Carlo Alberto
and Department of Economics and Statistics “Cognetti de Martiis”
University of Turin
revised, June 2014
ABSTRACT
In post-Unification Italy the cyclical movements of the economy largely reflected those in the production of durable goods. The engineering industry has been seen as one that transformed metal into machines: its metal consumption suggests that investment in machinery followed the Kuznets-cycle long swing, as construction did, that domestic production ever dominated the domestic market, and that changes in protection didn’t matter. New, disaggregated time-series estimates force a radical revision of these long-held views. Far more metal was turned into (ever-protected) hardware than into machines: the long cycle in aggregate “engineering” was not so much parallel to, as simply part of, the cycle in construction. Investment in machinery grew altogether more steadily than investment in infrastructure, with more numerous but far more modest cycles (and a heretofore unrecognized peak in 1907). All the extant interpretations of Italy’s industrial progress in the period at hand turn on the non-existent long swing in industrial investment, and they all collapse together. The domestic production of machinery, initially very small, reacted strongly to increases in net protection: the conventional view of the impact of the tariff is also to be jettisoned.
* The author is grateful for the comments and suggestions received from the participants at seminars at the Bank of Italy, Bocconi University, the Collegio Carlo Alberto, and the University of Turin.
1
THE FRUITS OF DISAGGREGATION: THE GENERAL ENGINEERING INDUSTRY IN ITALY, 1861-1913
1 Alexander Gerschenkron may have been a son of a bitch – when he found out that the thesis I was writing under his supervision was producing results not consistent with his own views he withdrew from my dissertation committee, ejected me from the Economic History Workshop, and cut off my funding – but he was a charismatic son of a bitch, in many ways a lovable son of a bitch, most certainly a genial son of a bitch: in just 16 pages on post-Unification Italy he defined a research agenda rich enough to hold my attention for half a century and more. Truly, he trained me à la russe, as Pavlov his dog; I am sorry I bit him.1 2 He taught me everything I know – and a fair bit I have had to unlearn. The engineering industry in post-Unification Italy – large, volatile, central to the historians’ debates – is the most recent case in point. Gerchenkron identified “the engineering industry” with “the machinery industry,” using the two terms interchangeably; and he famously lamented that it never received more than negligible net protection from Italy’s badly designed tariffs.2 The production of the engineering industry was not documented in the sources; Gerschenkron tracked its production movements by measuring the consumption of (wrought) iron and steel, net of rails.3 3. Richer estimates of the engineering industry’s production, and of its movements, are now available.4 The State was heavily involved, as a regulator and more, with maritime and railway transportation: shipbuilding and railway rolling stock production can be reconstructed
1 A. Gerschenkron, “Notes on the Rate of Industrial Growth in Italy, 1881-1913,” Journal of Economic History, 15, 1955, pp. 360–375. For a review of the subsequent literature, and evidence of Gerschenkron’s pervasive influence, see S. Fenoaltea, The Reinterpretation of Italian Economic History: From Unification to the Great War, New York, 2011. 2 Gerschenkron, “Notes,” p. 369. His condemnation of the tariff was one of the reasons for his general condemnation of public intervention by Italy’s successive governments: a condemnation largely echoed in Fenoaltea, The Reinterpretation, and vigorously contradicted by other scholars (ibid., ch. 1). 3 A. Gerchenkron, “Description of an Index of Italian Industrial Development, 1881-1913,” in Id., Economic Backwardness in Historical Perspective, Cambridge MA, 1962. 4 S. Fenoaltea, Italian Industrial Production, 1861-1913: A Statistical Reconstruction (in progress), section F, available on request. This work took its cue directly from Gerchenkron’s “Description”; my narrower focus has allowed me to pursue the issue in greater depth, and the estimates have been improved inter alia by disaggregating heterogeneous aggregates into more nearly homogeneous components (Id., “The Reconstruction of Historical National Accounts: The Case of Italy,” PSL Quarterly Review 63, 2010, pp. 85-86).
2
directly from the abundant data in the sources, and these industries are now represented by a few dozen annual series.5 The residual, here labeled for convenience “general engineering,” is the last bit to fall into place. It is now represented by a further (baker’s) dozen annual series; and the historical evidence these incorporate prompts a radical revision of our views. 4 The general engineering industry was very different from what we thought. On the one hand, it was as much a maintenance industry as a new-production industry. Unlike new production, maintenance was cyclically stable, and used little metal: a metal-consumption index much overstates the cyclical volatility of the industry’s aggregate product.6 Metal was used overwhelmingly for new production, rather than for maintenance: the path of metal consumption is at best an index of new production alone. 5 On the other hand, even the industry’s new production was far from what we had presumed. The general engineering industry was not “the machinery industry” at all: over the half-century at hand some seventy percent of the metal it consumed was turned into simple hardware, from hand tools to horseshoes, another six percent into truss-structure components; precision equipment absorbed a trivial share (but resources were lavished on what little metal it consumed), and under one quarter went into machinery and the like (the residual “general equipment” category). 6 Most significantly, these shares display very different time paths: metal consumption is a poor index even of new production, for it masks the changes in the composition of output. The major components of the engineering industry display very different trend growth rates: the metal-consumption share of hardware dropped from over ninety percent at Unification to sixty percent or so in the run-up to the Great War, that of (residual) general equipment rose from some five percent to thirty percent and more. Moreover, the transition was not slow and progressive, but concentrated in the decade that followed the introduction of the 1887 tariff. The aggregate metal-tonnage measure suggests that that tariff was ineffective, as Gerchenkron argued: the new, disaggregated estimates point to the exact opposite. 7 The major components of the engineering industry also display very different cycles. Aggregate metal consumption is characterized, as construction is, by the long Kuznets cycle, with a sustained upswing from the late 1870s to the late 1880s, a collapse followed by a slow recovery through the turn of the century, and a new surge over the final decade of the belle époque. The new evidence that has been brought to bear documents that long cycle in the (dominant) hardware sector (and in the small precision-equipment sector as well); the production of machinery and the like, and investment in industrial and agricultural equipment, instead grew steadily over the half-century at hand, with no more than relatively brief setbacks at roughly decadal intervals. Interestingly, investment in equipment turned down well before the War, even as construction and hardware production continued to surge: the new estimates are the first to document a real-side counterpart to the financial “crisis of 1907.” 8 What is even more interesting, indeed exciting, is that the newly recovered evidence pulls the rug out from under the related historiography of the last half century. The long cycle 5 C. Ciccarelli and S. Fenoaltea, “Shipbuilding in Italy, 1861-1913: The Burden of the Evidence,” Historical Social Research, 34, no. 2, 2009, pp. 333-373; Id., Id., “The Rail-Guided Vehicles Industry in Italy, 1861-1913: The Burden of the Evidence,” Research in Economic History, 28, 2011, pp. 43-115. As part of a parallel project to document Italy’s geographically unbalanced growth the national time series presented there are disaggregated to the regional level. 6 Unlike new production, too, general-engineering maintenance was characterized by a comparative lack of productivity growth: this difference is the stuff of the “Gerschenkron effect,” which seems widely misunderstood. See S. Fenoaltea, “The Measurement of Production Movements: Lessons from the General Engineering Industry in Italy, 1861-1913” (ms.).
3
in “aggregate engineering” turns out to have been not so much parallel to, as simply part of, the construction cycle. The attribution of that same long cycle to the production of machinery and to business investment turns out to have been simply wrong; the extant interpretations are based on that error, and must now be jettisoned. The reconstruction of the time path of Italy’s economy from Unification to the Great War has taken a further (and, as it turns out, much-needed) step; the newly recovered evidence calls for a thorough reconsideration of Italy’s industrial development over the half-century at hand.
1. THE NEW ESTIMATES
1 The road to the new estimates has been a long one. Gerschenkron’s mid-1950s index of the time path of the engineering (“machinery”) industry was as noted Italy’s consumption of (wrought) iron and steel, net of rails. My own first measure, a decade later, was very similar.7 The industry was returned to another decade on, for work on the sources specific to ships and railway rolling stock, and again on the (industrial and demographic) censuses of 1911. These readily revealed the importance of maintenance on the one hand, and of fabricated-metal production on the other; but the engineering industry was then again set aside, and the differences in the fabricated-metal and machinery production cycles remained unknown. That partially revised information set underpinned the published work of the subsequent decades, including Warglien’s time-series estimates of investment in machinery, my own detailed estimate of the industry’s structure in 1911, and my revised but still highly preliminary time-series estimates for the industry as a whole.8 In these last the entire base-metal-bashing industry was represented by just three series: one for the maintenance of hand tools, by blacksmiths, a mere interpolation of census benchmarks; one for the maintenance of machinery, indexed by energy consumption net of firewood; and one for new production, indexed, much like the preceding aggregates, by the consumption of (all) iron and steel excluding rails.9 The major role of maintenance had been recognized and allowed for, and the aggregate product cycle correspondingly damped; the importance of hardware production in 1911 had also been recognized. On the other hand, the single metal-consumption-based time series for all new production together reflected our enduring ignorance of how its composition may have varied over time; it incorporated, implicitly, the working assumption that it had in fact remained reasonably constant. Gerschenkron had interpreted the long cycle in metal
7 S. Fenoaltea, “Public Policy and Italian Industrial Development, 1861-1913” (unpublished Ph.D. dissertation, Harvard University, 1967). My estimates merely removed a minor error in Gerschenkron’s reading of his sources, and extended his series back to 1861; all metal was assumed to have been turned into machinery, and the industry’s aggregate value added in 1911 was vastly overstated. 8 M. Warglien, “Note sull’investimento industriale in macchinari e altre attrezzature meccaniche: Italia 1881-1913,” Rivista di storia economica, 2, 1985, pp. 125-146; S. Fenoaltea, "Il valore aggiunto dell'industria italiana nel 1911," in G. M. Rey, ed., I conti economici dell'Italia. 2. Una stima del valore aggiunto per il 1911, Collana storica della Banca d'Italia, serie "statistiche storiche," vol. I.II, Bari, 1992, pp. 105-190; Id., “Notes on the Rate of Industrial Growth in Italy, 1861-1913,” Journal of Economic History, 63, 2003, pp. 695-735. 9 The metal-consumption series used there includes cast iron, the consumption of which grew much less rapidly than that of wrought iron and steel. A fourth series, again a mere interpolation of census benchmarks, represented the precious-metal-products industry; but the latter does not concern us here.
4
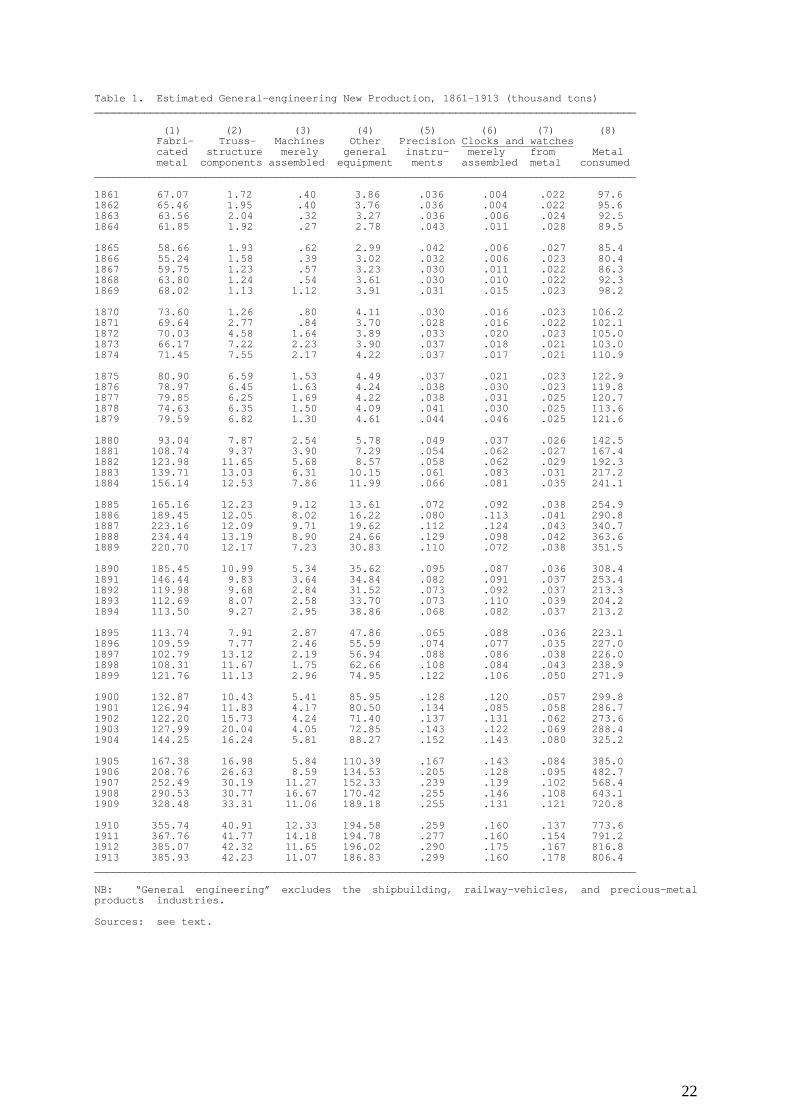
consumption as a long cycle in machinery production; half a century on we had progressed only far enough to think of it as a long cycle in the production of hardware as well as of machinery, amending but not rejecting our earlier beliefs. 2 A major, dedicated research effort has finally brought the estimates for the engineering industry up to the standards of the “second-generation” Italian series.10 The derivation of these estimates has been summarized elsewhere, and only the barest outline will be provided here.11 In essence, a system of equations is used to derive the value added, physical product, employment, and metal consumption by the maintenance and new-production branches of the various components of the general-engineering industry in 1911 from the detailed census data (on the labor force, horsepower in use, and shop size) and the evidence on product prices, technical coefficients, and aggregate metal consumption. The fabricated-metal maintenance series, machinery-maintenance series, assembly-of-parts and truss-structure-components production series are then extrapolated from the 1911 benchmarks using appropriate specific indices; the (residual) precision-equipment production and maintenance benchmarks are instead extrapolated together, to obtain series consistent with import flows, tariff movements, and the labor force data for the other census years.12 The same equations as before then yield the employment, output, and metal consumption estimates for the new-production components of the fabricated-metal and (residual) general-equipment industries in the other years (1871, 1881, and 1900) for which the censuses provide labor-force data; and the four resulting output benchmarks for each of these industries are finally interpolated and extrapolated to annual series, subject to the constraint of their joint metal consumption, using differential movements in the corresponding net imports, allowing for changes in tariffs, to infer differential movements in (demand and) production. 3 The (seven) new, disaggregated physical-product series are presented in Table 1, along with the corresponding aggregate metal-consumption series.13 To save space the
10 The “first-generation” series are the Gerschenkron index and the conceptually similar Istat-Vitali corpus produced by the Central Institute of Statistics for Italy’s centenary and extended shortly thereafter by Giorgio Fuà’s “Ancona group.” These used the traditional methodology, marked inter alia by the acritical incorporation of the figures in the sources, and the attribution of the path of documented production to undocumented production; not surprisingly, they appear to have gotten things very badly wrong. The “third-generation” estimates will abandon base-year value-added weighting in favor of a proper deflation of current-price value added estimates, not yet available, by a common deflator; but the second-generation figures are for present purposes thoroughly adequate, as the rate of productivity growth seems to have been very similar in the various branches of the new production of base-metal goods (mere-assembly activity alone excepted). See Fenoaltea, “The Reconstruction,” and references therein. 11 Fenoaltea, “The Measurement,” Appendix. That too can only give the reader a sense of the issues that were faced, and the means by which they were resolved; the replication of the estimates requires the full (ca. 240-page) manuscript available on request. 12 The mere assembly of imported parts (of clocks and watches; of general machinery) is indexed directly by the corresponding import series. The cyclical variability of those imports suggests that the parts in question were assembled into new products rather than used as replacements in the course of maintenance work. 13 This last excludes both the metal the engineering industry did not consume at all (rails, rebars, and the like), and that which it consumed elsewhere, in shipbuilding and railway-rolling-stock work, and of course in general-engineering maintenance. That maintenance does not concern us here; the (six) new time series that now represent it may be found in Fenoaltea, “The Measurement,” Table 2.
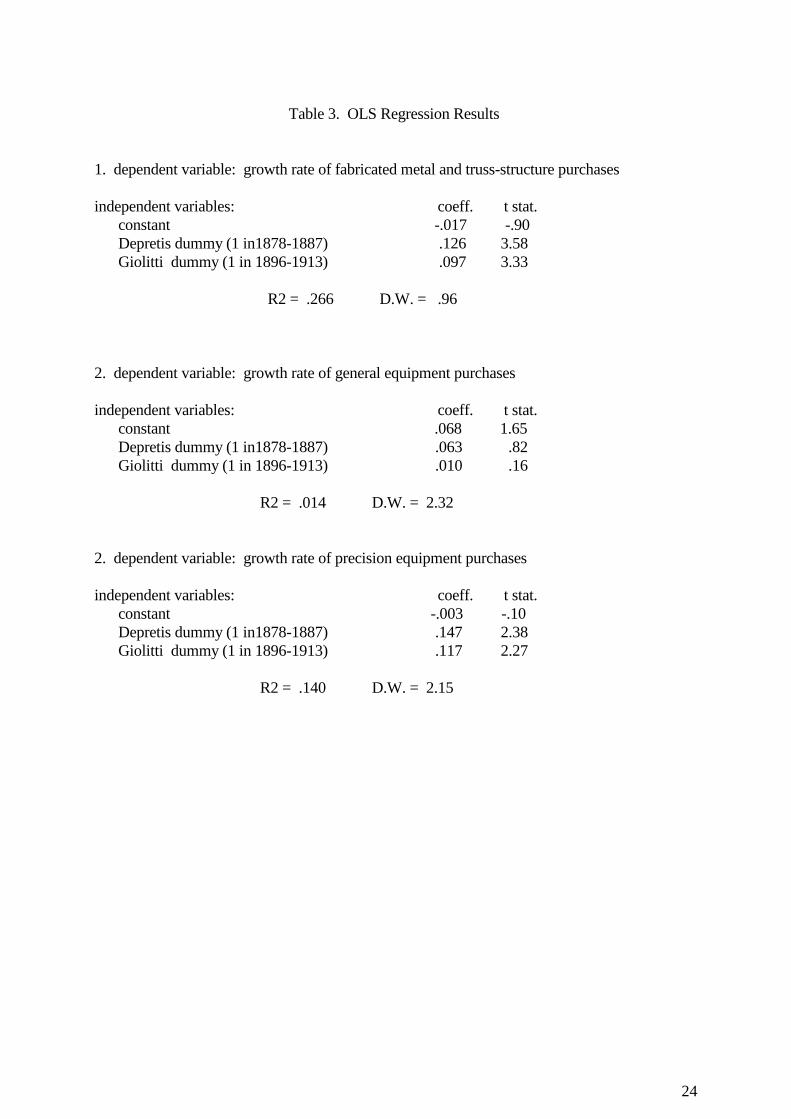
5
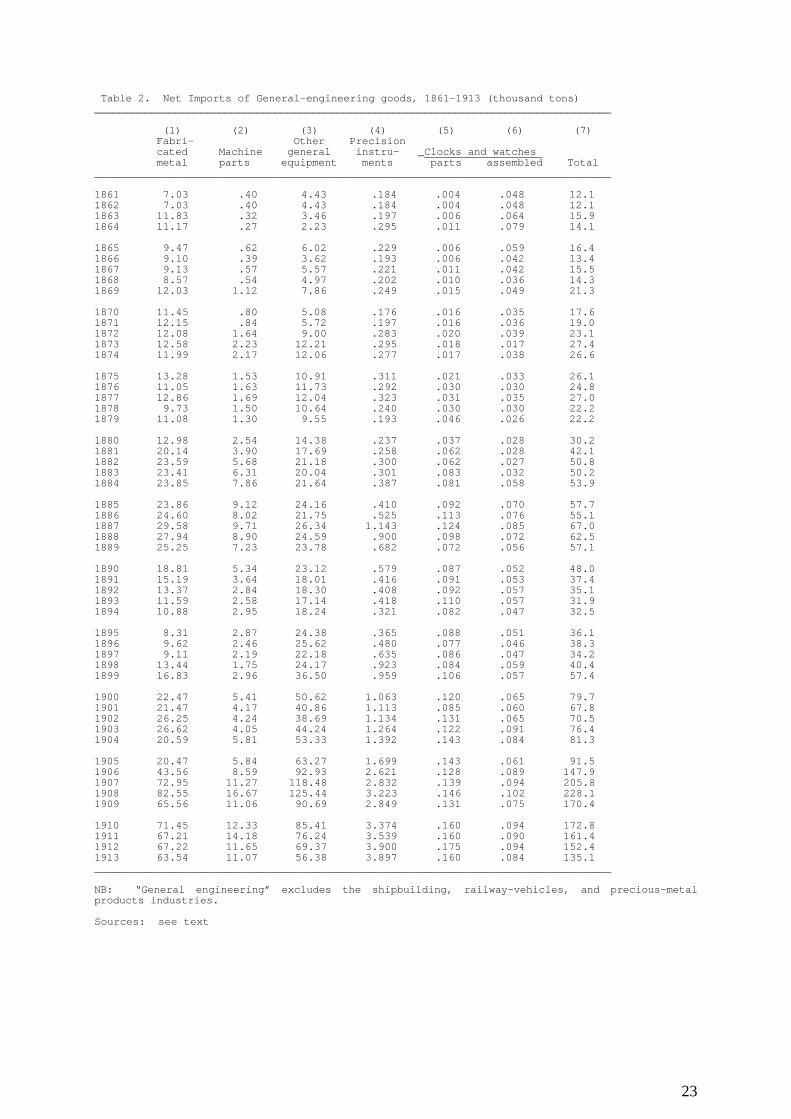
disaggregated new-production constant-price value added series are not presented; they are simply the physical-product series in Table 1, each multiplied by value added per unit at 1911 prices (415 lire per ton of fabricated metal; 350 lire per ton of truss-structure components, 300 lire per ton of machinery assembled from imported parts, and 900 lire per ton of other general equipment; 16,500 lire per ton of precision instruments, 8,000 lire per ton of clocks and watches assembled from imported parts, and 15,000 lire per ton of clocks and watches from metal). 4 The aggregate net import series for fabricated metal (including, in the trade statistics, truss-structure components), general equipment (again machines and the like, excluding ships and railway rolling stock), precision (and musical) instruments, and clocks and watches are presented in Table 2.14 The reconstruction of these series from the detailed annual data on international trade was a labor not of love but of necessity, and in the main merely tedious; but it brought occasional rewards. In particular, the data on rifle and pistol imports and exports yield, normally, minor net imports, presumably of sporting weapons, and two sorts of outliers. Some are sporadic, significant net exports, suggesting orders by a foreign government; the others are a string of significant net imports, specifically of French rifles, in the earliest years following Unification.15 These were almost certainly, given their volume, not for sportsmen but for the army; but they were too early to be Chassepots, and ordered in France despite the apparent technical adequacy of their Italian equivalents (evidenced by Italian exports a few years later) and above all the excess capacity in such production within Italy itself, documented by contemporary sources.16 Italy’s Unification took place with the political support of the Second Empire, and that support was secured by a variety of means, from the provision of la Castiglione as mistress to Napoleon III to the cession of significant territory: as in our own day, the placing of an order for weapons may well have reflected not just market opportunities but considerations of foreign policy.
2. THE BURDEN OF THE EVIDENCE
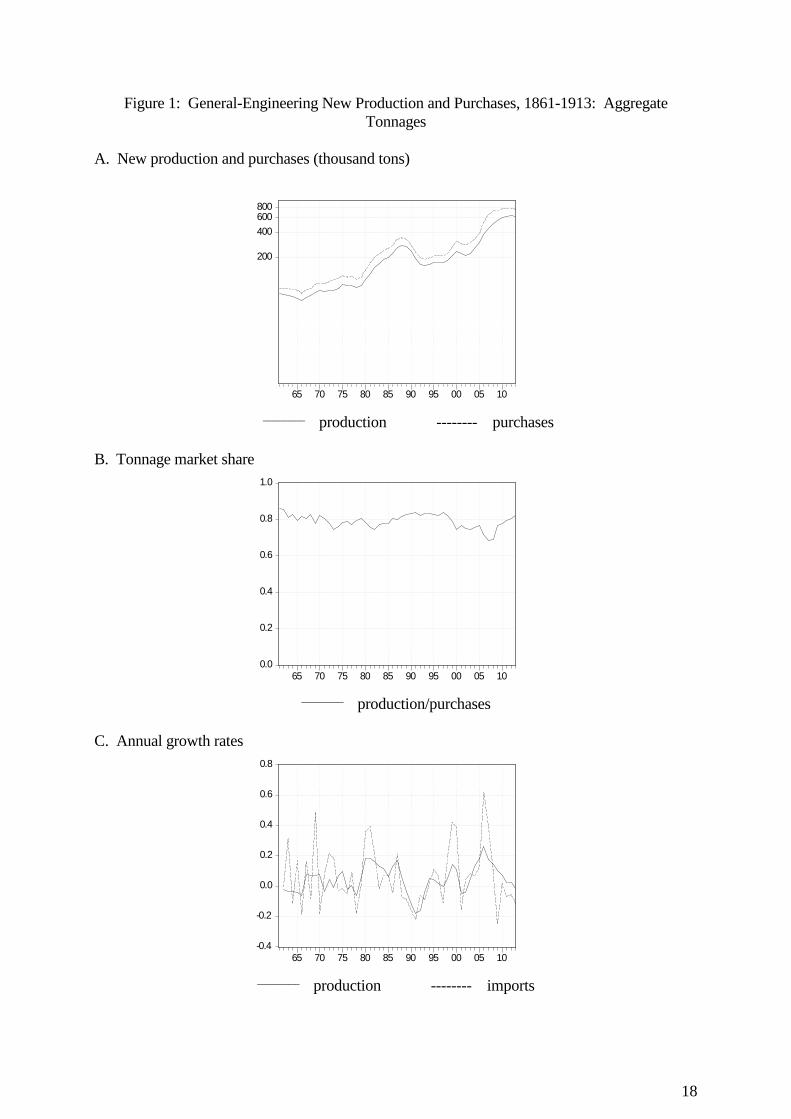
1 All we knew until very recently is captured by Figure 1. Panel A illustrates the path of total output, in tonnage terms, and of output plus imports (“purchases,” rather than “consumption,” as these are in essence investment goods). For simplicity, production is the sum of Table 1, cols. 1 – 7 (which obviously moves very much like the corresponding metal-consumption series in col. 8, as the two are linked by the average input-output ratio); purchases further include the aggregate-import series in Table 2, col. 7.17 For convenience,
14 Trade statistics for the entire Kingdom were not compiled for 1861; the present estimates for that year simply repeat the figures obtained for the following one. The series presented here are corrected for border changes, and for inventory movements from anticipated tariff increases; assembled machines and machine parts were reported together until 1887, and the breakdown provided here is also an estimate. 15 “Significant” is here to be understood as considerably larger than average. Next to the total trade in general industrial and agricultural machinery, trade in firearms was always insignificant. 16 F. Giordano, L’industria del ferro in Italia. Per cura del Ministero della Marina, Turin, 1864, pp. 356-357, reports that the Glisenti works in Brescia employed 250 men, “but could employ twice as many.” In this case, therefore, high imports are not evidence of high demand from which domestic producers also benefited.
6
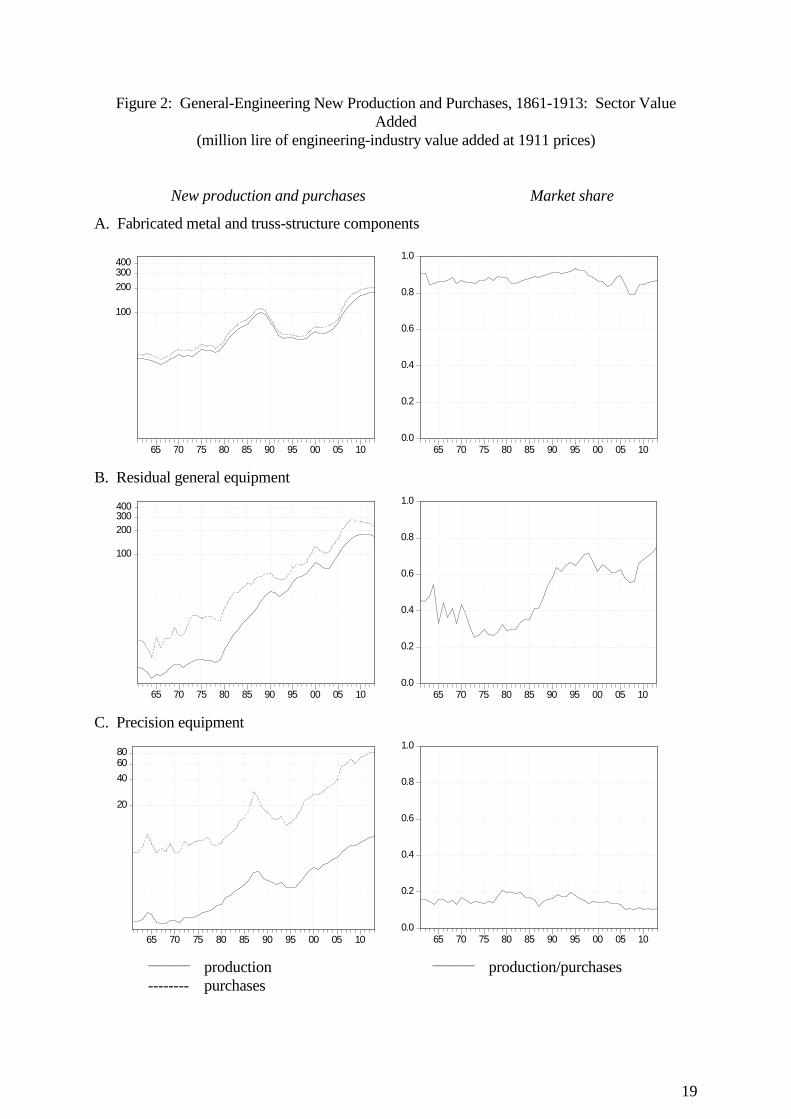
the illustrated series are based on the new estimates; but a virtually identical graph appeared long ago in the author’s dissertation.18 2 Two features of that graph hit the eye. One is the long cycle in production (which we first attributed entirely to, and subsequently also to, the production of machinery); the other is the largely parallel path of purchases and production, which in turn has a host of implications. The first is the arithmetic (rectius logarithmic) implication that domestic industry’s market share remained roughly constant over the decades at hand, and was ever relatively high – as is illustrated directly by panel B.19 There is no visible import-substituting surge in the wake of tariff increases, suggesting, as Gerschenkron had argued, that these never actually increased the industry’s net protection. In fact, there is no visible import-substituting surge at all, such as one would expect in the context of a “big push” unleashed by the late creation of (substitutes for) previously missing prerequisites. The path of the engineering industry dominated that of my earliest index, and if the prerequisite-substitution story didn’t fit that industry it didn’t fit at all. The evidence pointed rather to a demand cycle – a cycle in the demand for producer durables (“machines”), in short a simple investment cycle – interacting with an ever-elastic supply side; and on that note Gerschenkron and I parted company.20 3 The broad stability of domestic industry’s market share pointed to an elastic supply curve; but the market share line is not absolutely flat. It drifts down in the aftermath of Unification; today, better informed of Italy’s regional history, I would attribute it to the running down of the South’s once highly protected industry, as the mild Piedmontese tariff was immediately applied nation-wide. But after that the market share of domestic production seems to have varied contracyclically, dropping when purchases surged and vice-versa – suggesting a domestic supply curve that was indeed elastic, but not as elastic, in the short run, as the (“infinitely elastic”) world supply curve. This point is illustrated by panel C, which compares the year-to-year growth rates of (aggregate) imports on the one hand and of (aggregate) domestic production on the other. The domestic-production growth rate follows a heavily damped version of the import growth rate’s path. Domestic production could grow at spectacular rates, in the high teens and more, but for all that it could not keep up with demand when the latter really surged; on those occasions imports would grow far more, by 40%, even 60% in the annus mirabilis 1906.21 4 The fruits of disaggregation are evident in Figure 2. The left-hand graphs illustrate engineering-industry value added embodied in the goods produced and purchased in Italy, the right-hand graphs the ratios of these figures.22 These graphs are divided, for clarity, into three panels; but they share their vertical scales, and each set of three graphs can be reduced to one simply by (judicious) superimposition. Panel A refers to the sum of fabricated metal and truss-structure components. The latter were combined with the former in the trade statistics;
17 Imported parts thus appear once in the production series, and twice in the purchases series; but the quantities involved do not materially affect the paths of the aggregates. 18 Fenoaltea, “Public Policy,” Figure 24. 19 For a very similar graph, again, see Fenoaltea, “Public Policy,” Figure 25. 20 For a more extended review of my early results see Fenoaltea, The Reinterpretation, pp. 22-28. 21 This pattern, apparent in the aggregate, is built into the algorithms used to infer the product-specific output time paths from those of the corresponding imports. 22 In the case of goods assembled in Italy from imported parts, therefore, the value added in manufacturing the parts is considered imported, that in assembly domestic production.
7
and, like much hardware, truss-structure components were provided to the construction industry, and entered investment in infrastructure rather than in (industrial and agricultural) equipment. Production corresponds to Table 1, cols. 1 – 2, domestic purchases further include the net imports transcribed in Table 2, col. 1, all of them weighted by 1911-price value added per unit.23 Panel B refers to (residual) general equipment; production corresponds to the value-added-weighted sum of Table 1, cols. 3 – 4, domestic purchases further include the (again value-added-weighted) net imports in Table 2, cols. 2 – 3.24 Panel C refers to precision equipment: production corresponds to Table 1, cols. 5 – 7 (again weighted by unit value added), domestic purchases further include the (similarly weighted) net imports in Table 2, cols. 4 – 6.25 5 Given that the fabricated-metal industry dominated general engineering even in the early twentieth century, in tonnage terms, and practically coincided with it over the earlier decades, the two graphs in panel A unsurprisingly resemble those in Figure 1. They tell the same story as the aggregate tonnage figures, the story we inferred long ago from metal consumption alone: production fluctuated very strongly, but the share of the market captured by domestic producers remained very high, at four-fifths and more, albeit with a general tendency to fall when purchases surged, and to rise when they decelerated or fell outright.26 That steady dominance of the domestic market was in fact buttressed, if not altogether created, by the significant net protection “fabricated metal” always enjoyed: the industry the tariffs (long) mistreated was the general-equipment industry, the “machinery” industry (about which more forthwith), not the entire, altogether broader, base-metal-processing “engineering” industry. 6 But the graphs of panels B and C do not much resemble those of panel A: the story once told for the entire industry is now told for the fabricated-metal/construction-related sector alone, and different stories emerge for the others. The right-hand graph of panel C, for example, shows that the precision equipment industry’s share of the domestic market was ever far lower than that of the fabricated metal industry, one fifth or less against the four-fifths and more of the latter: a difference surely due in part to relatively lower rates of net protection, but mainly, it would seem, to the presence of well-established foreign hegemonies in clocks
23 Since the structural-components industry was able to export its products made from duty-free metal, and (given the trade categories) received tariff protection, its imports should have been negligible, save perhaps very early on; for simplicity, all net imports are attributed the domestic fabricated-metal value added of 415 lire per ton. The production of fabricated metal far outweighed that of structural components, and the graphs presented here are barely distinguishable from their equivalents for fabricated metal alone. 24 Imported parts and assembled machines are attributed 600 and 900 lire per ton, respectively, like (implicitly, in the case of parts) the corresponding domestic product. Within “general equipment” the respective shares of industrial and agricultural machinery unfortunately remain unknown. The trade statistics make that distinction only from 1888, with agricultural machinery typically accounting for 10 to 20% of the total; the censuses ignore it altogether. 25 Imported precision instruments are attributed 16,500 lire per ton, like the corresponding domestic product. In the case of clocks and watches, to reflect the apparently superior average quality of the imported goods, imports are attributed a value added of 30,000 lire per ton of parts, and 38,000 lire per ton of assembled pieces. 26 A sudden surge in exports of tin cans in 1904-05 reduced net imports, and generated the exceptional local peak in domestic producers’ market share evident in the right-hand graph of Figure 2, panel A.
8
and watches (Switzerland) and in optical and (other) precision instruments (Germany). The competitive position of domestic producers appears to have been much improved by the single major increase in protection, in 1878; but it soon weakened again, over the 1880s in general as purchases surged and imports poured in, and in 1887 in particular as imports of optical and measuring equipment briefly trebled (perhaps to satisfy a military requirement). The subsequent downturn in purchases may have affected imports more than domestic producers, but that apart domestic producers seem generally to have been losing ground, perhaps, as was suggested at the time, because the diffusion of electricity played to foreign (and again German) strength.27 7 The left-hand graph of panel C suggests that the light-equipment industry displayed much the same long cycle as the fabricated-metal industry. Both can perhaps be linked to the infrastructure-investment cycle, but surely, even then, through very different paths. Infrastructure absorbed hardware (and truss-structure components): the fabricated metal industry appears tied to construction by Leontief’s input-output coefficient. Time pieces are largely consumer goods, and the clock-and-watch industry appears tied to construction by Keynes’s multiplier; and if the military were traditionally the main consumers of precision instruments, the boom-and-bust of the latter industry over the 1880s and early ’90s is tied to construction only because both it and deficit spending were first encouraged and then discouraged by the long swing in the supply of capital.28 8 Again, the detailed international trade statistics tell us more. The number of watches imported each year surged from a few tens of thousands through the 1860s and 1870s to a few hundred thousand from the 1880s. Their sheer volume, and their declining average values, are evidence that this boom was fueled not by luxury pieces for the (relatively thin) upper crust but by cheap (Roskopf) watches for the laboring classes. The new estimates for the engineering industry thus unexpectedly supply yet another nail to secure the coffin of the formerly dominant view that the sharp fall in the price of grain in the (early) 1880s generated an economy-wide crisis and a decline in the working classes’ consumption.29 9 The most interesting graphs are surely those for the general-equipment industry, in panel B. From 1861 to 1913 the output of such equipment grew nearly fifty-fold, against less than tenfold for precision equipment, and just sixfold for fabricated metal (and truss-structure components).30 Above all, it followed a different path, apparently growing, after 1880, with
27 Direzione generale della statistica, Statistica industriale. Riassunto delle condizioni industriali del Regno, vol. 1, Rome, 1906, p. 57. 28 Fenoaltea, The Reinterpretation, pp. 70-104. 29 The early historiography, close to the period in question, remembered the 1880s as a decade of prosperity and increasing consumption; the post-war literature invented the economy-wide “crisis of the 1880s,” with consumption falling despite the growth of industry and of investment, on the presumption that the “grain invasion” hurt Italy’s essentially agricultural economy. The argument was blithely a-ricardian, but it was apparently supported by the (flawed) Istat reconstructions recalled above, and that was largely that. These views now seem largely to have been abandoned even by their former champions, apparently convinced by recently presented evidence of rising consumption in the 1880s; see Fenoaltea, The Reinterpretation, pp. 109-134. The most recent literature includes additional material supporting the new consensus (C. Ciccarelli, “The Consumption of Tobacco in Italy: National and Regional Estimates, 1871-1913,” Rivista di storia economica, 28, 2012, pp. 409-452), and the Oliphant-call of the preceding one (E. Cerrito, “Quale storiografia economica? Chiose su ‘Depressioni’,” Studi storici, 23, 2012, pp. 141-191).
9
only brief setbacks at roughly decadal intervals.31 The long cycle so visible in the production of fabricated metal and precision equipment is altogether absent: in the thirty years from 1880 to 1910, general-equipment value added at 1911 prices (and the weight of the industry’s physical product) apparently reached a new high in four years out of five, failing the mark only in 1891-93 and 1901-03, as it would again in 1913. The qualifier is de rigueur, as the lack of a census in 1891 means that the allocation across the 1880s and 1890s of the census-documented growth between 1881 and 1900 is a judgment call; but as will be confirmed forthwith the evidence points to the pattern embodied in the present estimates. The purchases of general equipment are our nearest measure of “business” investment in industrial and agricultural machinery; and such purchases apparently grew even more regularly than domestic production, again with short cycles but no trace of a long one.32 The new, disaggregated estimates further suggest that these purchases peaked in 1908: they are the first to show a real-side trace of the notorious “crisis of 1907,” altogether absent from the preceding, aggregate series for “engineering” as a whole, and correspondingly from the interpretations derived from those aggregate estimates.33 10 Gerschenkron had condemned the Italian tariff for protecting metalmaking rather than “engineering,” and complaints of negative protection on machinery are a leitmotiv in the literature of the day.34 The complaints appear fully justified in the 1860s and ’70s, but in 30 In the later 1870s the estimated production of machines was much less, on a tonnage basis, than that of truss-structure components (Table 1); and this sits well with the emphasis on the latter in the literature of the day, e.g., Corpo delle miniere, Notizie statistiche sull’industria mineraria in Italia dal 1860 al 1880, Rome, 1881, p. 141. 31 The estimates are in fact perceptibly sturdier after 1880, as iron and steel production data become available. In the early decades the production of iron and steel is also estimated, and the cycle in metal consumption may be distorted by the failure adequately to allow for production from domestic scrap, notably in the early 1870s. It is of course tempting to impute to the 1860s and 1870s the patterns evident over the subsequent decades, and to back out metal-consumption and production estimates for those decades consistent with that assumption; but that temptation has here been resisted. 32 Contemporary observers had noted the shorter cycle, and it turns up in a spectral analysis of the extant aggregate GDP series; see L. Sella and R. Marchionatti, “On the Cyclical Variability of Economic Growth in Italy, 1881-1913: a Critical Note,” Cliometrica, 6, 2012, pp. 307-328. Table 3 presents the results of simple OLS regressions of the growth rate of the “purchases” series illustrated in Figure 2 on time dummies for the Depretis and Giolitti years. These confirm what is obvious to the eye: in those years purchases of hardware and precision equipment grew at above-average rates, purchases of general equipment did not. 33 See F. Bonelli, La crisi del 1907. Una tappa dello sviluppo industriale in Italia, Turin, 1971; compare Fenoaltea, The Reinterpretation, s.v. “crisis of 1907.” A possible qualifier here is that the railways’ nationalization in 1905 spawned a reequipment surge that also peaked in 1907 and then rapidly fell off, as orders were filled; but its quantitative significance seems minor. From 1906 to 1913 railway-related general-equipment value added estimated as 10% of the construction value added in railway renovations plus 10% of the engineering value added in rolling stock purchases equals a small and virtually constant 3-to-5% share of total purchased general-equipment value added, and the time path of the residual is entirely parallel to that of the latter. See S. Fenoaltea, “Railway Construction in Italy,” Rivista di storia economica, 1, International Issue, 1984, and Ciccarelli and Fenoaltea, “The Rail-Guided Vehicles Industry.” 34 Gerschenkron, “Notes,” p. 369; Giordano, L’industria, pp. 418-422; Corpo delle miniere, Notizie, p. 151; Comitato nazionale per le tariffe doganali e per i trattati di commercio, Notizie sulla industria
10
point of fact the path of tariff reform was clearly ameliorative. For general machinery, the reform of 1878 meant passing from negative to practically zero net protection, that of 1887 from zero to positive; and the evidence available at the census-year benchmarks suggests that both changes markedly raised the steady-state ratio of production to purchases. The present annual estimates accordingly assume as much, even as they allow for a reduction in the year-specific ratio in the presence of sudden surges in purchases and, consequently, in elastically supplied imports (and of course vice-versa when purchases suddenly collapsed). The ratio of production to purchases is accordingly taken to have grown sharply after 1887, when tariff rates improved and purchases decelerated; similarly, in later years, that ratio is taken to have drifted down as the market recovered, dropped when it exploded, and finally recovered as purchases stopped growing. The assumptions that underlie the present time-series estimates appear reasonable. 11 Alternative estimates could of course continue to attribute the long cycle to business investment too: purchases of “general equipment” can be assumed to have fallen sharply after 1888, and remained depressed through the end of the century, just like the “general engineering” aggregate illustrated in Figure 1. But that assumption would not be reasonable. The census-based estimate for 1900 yields machinery purchases of some 128 million lire, 79 of them domestic, on a 1911-price value added basis (from Table 1, cols. 3 and 4, Table 2, cols. 2 and 3, and the above-noted value added weights). Extrapolate those purchases back to the 1888 peak with the aggregate-tonnage-purchased series (the dotted line in Figure 1): in 1888, on the same value-added basis, purchases would have been some 140 million lire, for a domestic value added, allowing for imports, of some 112 million lire. But the again census-based estimates for 1881 yield a domestic value added of just 7.7 million lire, and purchases of 26 million lire. To have purchases of machinery follow the post-1888 long cycle, that is to say, we must be willing to accept as plausible that from 1881 to 1888 domestic production rocketed up from 7.7 million lire to 112 million lire, at near 50% annually, compounded, with domestic producers’ share of the market shooting up from 30% to 80%, thanks presumably to the elimination of negative protection with the tariff of 1878 – and that after 1888, despite the introduction of positive protection, despite the decline in total purchases, that share instead drifted down, back to 62% in 1900: that is to say, that domestic producers were first helped, and then hurt, by the successive increases in net protection – or, discounting the effects of tariff reform, that the domestic short-run supply curve was more elastic than the (“infinitely elastic”) world supply curve, despite the evidence to the contrary from the aggregate figures reviewed above. In the light of the census, trade, and tariff-rate data incorporated in the new, disaggregated estimates, the long cycle in investment in machinery can be dismissed: it is simply not present in reasonable estimates, and the estimates on which it is imposed have preposterous implications. 12 The time path of aggregate metal consumption illustrated in Figure 1, once attributed to the engineering industry as a whole, reappears as noted in Figure 2 only in panel A, that for (or at least dominated by) the fabricated-metal industry. But the output of that industry is essentially hardware, the hand tools of artisans and farm workers, the bits of metal consumed in construction work; and of the two, the latter component seems much the more cyclically volatile. The new estimates thus sit well with the assertions of contemporary observers, who attributed the cycle of the engineering industry after 1880 to that in public works and residential construction.35 13 The aggregate-tonnage market share was ever high, and varied little (Figure 1, panel B);
meccanica in Italia. Locomobili – macchine agrarie, Milan, 1917, pp. 16-17. 35 Direzione generale della statistica (Dirstat), Annuario statistico italiano 1895, p. 398.
11
but its import is now clear. It does not signify, as we thought, that tariff increases didn’t have any net effect. Au contraire: the relative constancy of the aggregate share is the arithmetic result of the falling relative weight of the fabricated-metal part, with continuous net protection and an always high market share (Figure 2, panel A), and the rising weight of the machinery part, with improving net protection and a market share that sharply increased as a result, but remained below that of the fabricated-metal sector (Figure 2, panel B). Where they occurred, improvements in net protection had very significant effects: the (disaggregated) second-generation estimates reveal what the (aggregate) first-generation estimates altogether masked. 36
3. AGGREGATE ENGINEERING-INDUSTRY NEW PRODUCTION
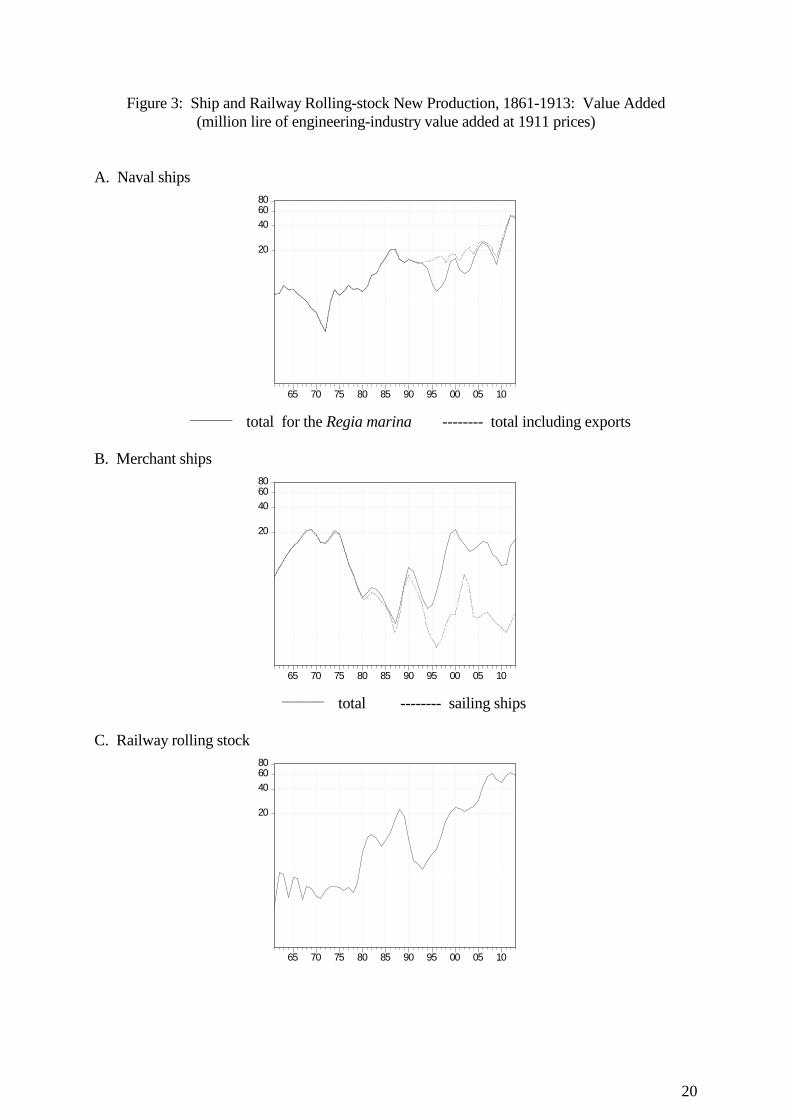
1 Over the decades following Unification the growth rate of the Italian economy fluctuated, with a short agricultural cycle, and a long industrial cycle located in the production of durables: the construction industry, the engineering industry, and those that supplied them with their raw materials.37 Our understanding of this long cycle, with its characteristic upswings in the 1880s and the belle époque, is central to our interpretation of Italy’s economic development. 2 The second-generation estimates for the construction industry were compiled now decades ago.38 The newly completed second-generation estimates for the engineering industry include those recently compiled for the shipbuilding and railway rolling stock industries, referred to above; the corresponding new-production series are illustrated in Figure 3 (to the same logarithmic scale as in Figures 1 and 2). Panel A refers to the construction of naval ships. The long cycle is readily apparent, especially in the production of ships for the Regia marina; it bears notice that over the decade straddling the turn of the century the shipyards managed to maintain their output on a relatively smooth growth path by turning to export work.39 Panel B refers to merchant shipbuilding, distinguishing sailing-ship and steam-ship production.40 The construction of (wooden) sailing ships enjoyed a unique boom in the wake of Unification (tied perhaps to the opening of the Suez canal), and then dropped to low levels. The construction of (metal) steamships also went much its own way: negligible into the early 1890s, it shot up to a peak in 1900 thanks to the introduction of subsidies, and then fell back. The new production of
36 There is precedent for this: the impact of the rising tariffs on cotton goods is also visible in the estimates of the second generation, but not in those of the first. See Fenoaltea, The Reinterpretation, pp. 142-147. 37 C. Ciccarelli and S. Fenoaltea, "Business Fluctuations in Italy, 1861-1913: The New Evidence," Explorations in Economic History, 44, 2007, pp. 432-451. 38 S. Fenoaltea, "International Resource Flows and Construction Movements in the Atlantic Economy: The Kuznets Cycle in Italy, 1861-1913," Journal of Economic History, 48, 1988, pp. 605-637, and references therein. 39 Naval vessels were then at the cutting edge of technical progress, much as military aircraft are in our own day. These exports speak to the broader debate on the Italian tariff, as those who would absolve the tariff on steel from the charge that it destroyed Italy’s comparative advantage in engineering products claim that Italy’s engineering industry was technologically too backward to export at all: see Fenoaltea, The Reinterpretation, pp. 147-152, and references therein. 40 The latter is indicated only as a residual (the illustrated total less the illustrated sailing-ship component) , as it was initially nil, and therefore not amenable to a logarithmic scale.
12
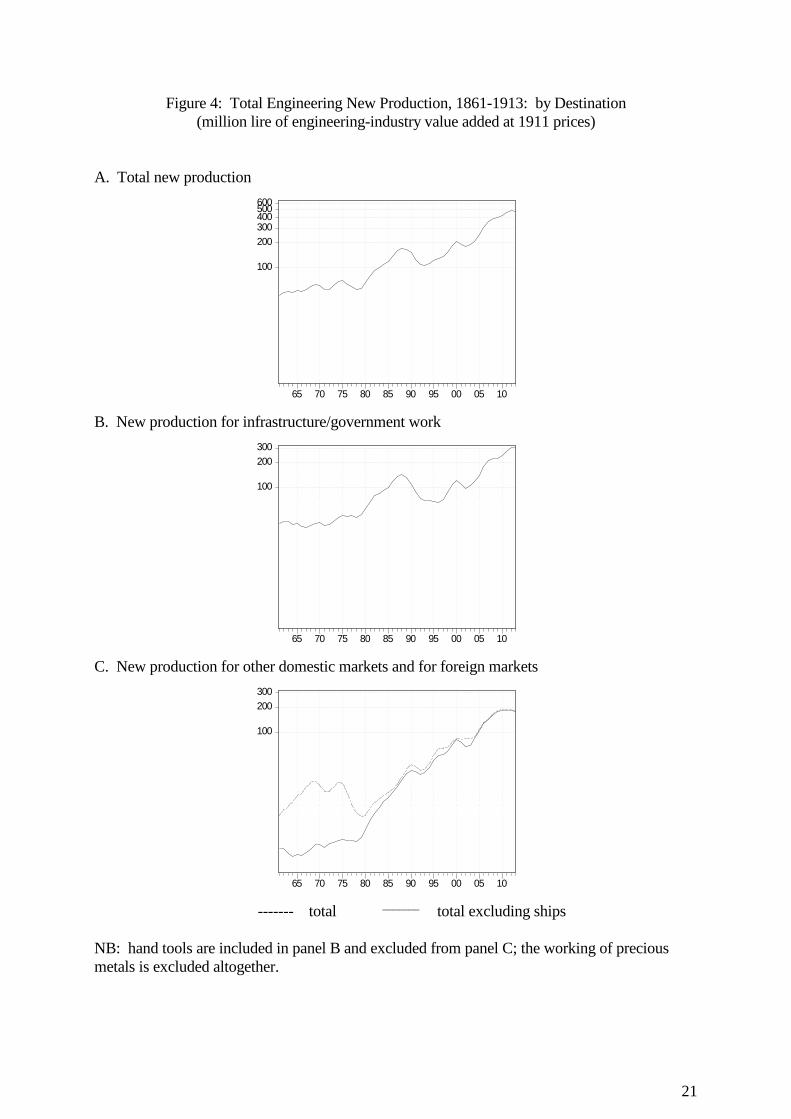
railway rolling stock is illustrated in panel C; the long cycle is obvious, and obviously related to the long swing in the construction of the rail lines themselves.41 3 The aggregate new production of the (base-metal-working) engineering industry is illustrated in Figure 4, panel A: the long cycle obvious in a number the industry’s major components (Figure 2, panel A; Figure 3, panels A and C) is obvious there as well. Figure 4, panels B and C allocate that production to two groups. The larger group, illustrated in panel B, includes the components that belong to two overlapping categories. One refers to infrastructure-related work: the new production of hardware, of truss-structure components, of railway rolling stock. The other includes the (other) components of the industry’s new production directly tied to public procurement and public subsidies: vessels for the Regia marina and merchant steamships, and also, not that they matter, precision instruments (presumably used mainly by such public bodies as the military, laboratories, and universities). The line between the two is blurred, but since they are here combined it hardly matters. 4 What matters rather more is that all hardware is included here, even though much of that went into the hand-tools used by farmers and artisans: much, surely, but how much the sources (“so far recovered”) do not tell us.42 On the other hand, one can presume, with fair confidence, that construction and the production of related hardware were far more cyclically sensitive than the production of tools: the “infrastructure/government work” line in panel B is surely too high, but there is no reason to believe that its time path is distorted.43 5 In Figure 4, panel C, refers to the (residual) “market-oriented” production of the engineering industry. The upper (dotted) line tracks the construction of sailing ships and of exported naval vessels, plus the new production (including the mere assembly) of residual “general equipment” on the one hand and clocks and watches on the other; the lower (solid) line excludes (“open-market”) shipbuilding. Clearly, in the 1860s and ’70s this second group was dominated by the cycle in the construction of sailing ships; after that, it is very close to the production of residual “general equipment” alone (Figure 2, panel B). Again, the long cycle is simply absent, as the long depression from the late 1880s through the turn of the century is nowhere to be seen: the inclusion of the shipbuilding and rolling-stock industries does not materially affect the novel understanding of “the engineering industry” provided by the evidence incorporated in the new, disaggregated estimates for residual “general engineering.”
41 For further discussion see Ciccarelli and Fenoaltea, “Shipbuilding,” and Id., Id., “The Rail-Guided Vehicles Industry.” 42 There seems to be no direct evidence on the production of hand tools, not even in the censuses, presumably because blacksmiths were indifferently devoted to tools and other hardware. Some orders of magnitude might be obtained from the reported numbers of cultivators and craftsmen, but the stocks held depended on their specific activities, and the exploitation of that evidence has not even begun. 43 In our present state of ignorance various hypotheses can reasonably be entertained. One is that the production of hand tools was simply trend-dominated, as the numbers of cultivators and craftsmen grew relatively steadily. Another is that the production of (specifically agricultural) hand tools also followed the long cycle (in real protection, and specialization in tree crops); but whether it was parallel to the aggregate hardware cycle, or its mirror-image, depends on the relative tool-intensity of tree and field crops. What does not seem at all likely (and has here been discounted) is the possibility that the long swing in hardware production was entirely in hand tools, and unrelated to the construction cycle.
13
4. THE INTERPRETATION OF ITALIAN ECONOMIC HISTORY 1 Our imagination is shaped by the world we live in. In the mid-twentieth century we naturally presumed that metal consumption meant machine production, that machines were essentially factory equipment rather than farm equipment; we naturally saw in the long cycle in metal consumption a long cycle in investment by industry. That long industrial-investment cycle provided the factual premise of Gerschenkron’s own interpretation of Italy’s industrial progress, and of the succeeding alternatives proposed in the literature: proposed to this day, for even the subsequent, partial reality check merely qualified our early certainties, and did not destroy them. A more thorough reality check has only now yielded its fruits, and our long-shared understanding of the path of industrial investment turns out to have been grossly in error. The newly recovered evidence on the purchases of general equipment, of investment in ordinary industrial (and agricultural) machinery, tells us that these did not follow the long metal-consumption cycle at all; rather, they grew relatively steadily throughout the half-century at hand, with only limited (mild or brief) setbacks, notably after 1874, 1890, 1900, and 1908 (Figure 2, panel B). 2 Gerschenkron thought of industrial development in terms of stages of growth, with a “big push” unleashed by the creation of the necessary supply-side prerequisites. In backward Italy, he thought, the critical missing prerequisite was the ability to accumulate, and manage, industrial capital. The State failed signally to provide it, and exploit the opportunities of the 1880s; it appeared only with the creation of the (German) industrial banks in the mid-1890s, as shown by the attendant rise in the rate of industrial investment and of industrial growth in general.44 The mid-1890s “kink in the curve” of industrial investment was the rock on which he built his edifice; but the underlying upsurge in metal consumption turns out to have been a matter of investment in infrastructure rather than in industry, and that rock has turned to dust. 3 Gerschenkron’s near-contemporary and principal interlocutor was Rosario Romeo. Romeo shared Gerschenkron’s stages-of-growth approach, but thought that the State had more nearly done everything right than everything wrong. In particular, the State taxed agriculture to create the “necessary” (railroad) infrastructure in the 1860s and ’70s; the flow of savings could then be redirected to industry, which duly began to grow, aided by tariff protection, in the 1880s.45 The late-1870s “kink in the curve” of industrial investment was the rock on which he built his edifice; but the underlying upsurge in metal consumption turns out to have been a matter of investment in infrastructure rather than in industry, and that rock has turned to dust. 4 The subsequent, hegemonic interpretation was the one proposed by Franco Bonelli and Luciano Cafagna around 1980. It was in essence Romeo’s in slow motion: the “prerequisite” accumulation of (agricultural) capital to 1880 had lasted over a century, and not just the twenty years after Unification; the industrial “take-off” was itself not a concentrated spurt but a sequence of successive “waves,” each stronger than the one before, in the 1880s, in the “Giolitti years” (1895-1913), and again in later years, beyond the temporal horizon of this paper.46 The
44 Gerschenkron, “Notes”; for further references and discussion see Fenoaltea, The Reinterpretation, pp. 10-14. 45 R. Romeo, Risorgimento e capitalismo, Bari 1959; for further references and discussion see Fenoaltea, The Reinterpretation, pp. 19-21. 46 F. Bonelli, "Il capitalismo italiano. Linee generali di interpretazione," in R. Romano, C. Vivanti, eds., Storia d'Italia. Annali, 1. Dal feudalesimo al capitalismo, Turin 1978, pp. 1193-1255, and L. Cafagna, "La formazione del sistema industriale: ricerche empiriche e modelli di crescita," Quaderni della Fondazione G. G. Feltrinelli 25 (1983), pp. 27-38; for further references and discussion see Fenoaltea,
14
pre-War “waves” of industrial investment were those revealed by the extant indices, by the consumption of metal; but it now appears that these were “waves” in investment in infrastructure, and investment in industry displayed no more than ripples. 5 My own early work reflected those same indices, the same misguided certainty that metal consumption meant industrial investment. That work abandoned the “stages of growth” approach, as noted, in favor of a straightforward investment-cycle approach; and it ended by proposing an explanation of that cycle. Our imagination is shaped by the world we live in: near half a century ago, shortly after Italy’s post-war “economic miracle” had come to a crashing end because, it was said, the political “opening to the Left” frightened entrepreneurs and curtailed investment, a political explanation came obviously to mind. The strong cycle in “machinery” production and industrial investment stood oddly next to the relatively steady growth of other industrial output, the fall in investment after the 1887 tariff hike stood oddly next to its rise after that of 1878. The (“obvious”) hypothesis was that the path of investment had been dominated not by the changes in the expected growth of output, but by the changes in the desired capital-output ratio, presumably high when risk was low because industrial entrepreneurs could trust Italy’s political leaders (Depretis, from 1876 to 1887, and again Giolitti, from the turn of the century to 1913), and conversely low when risk was high (under the “agrarian” Right, and again under Crispi, Depretis’ successor, who pursued highly adventurous policies).47 It is now apparent that there was no long cycle in industrial investment: the “political cycle” hypothesis, as it has come to be known, proposed a solution to a non-existent problem. 6 The “political cycle” hypothesis was in any case killed off a few years later by my own work on the construction industry referred to above, above all by (my discovery of) the writings of the Kuznets school.48 On the one hand, the (putative) long cycle in industrial investment in Italy exactly matched the construction cycle in Australia, where the influence of Depretis, Crispi and Giolitti seemed questionable; on the other, the long (Kuznets) cycle was clearly present in construction in Italy as well. The long cycle in Italy was not specific to industrial investment, it seemed to involve capital formation in general; not least, it was part of a world-wide cycle, and clearly called for a world-wide explanation. 7 What then emerged can be called the “revised Kuznets cycle” hypothesis. The Kuznets school had discovered the characteristic long swing of the “Atlantic economy,” with transoceanic migration, capital flows, and New-World construction rising while British construction fell, and vice versa; and it had considered migration the prime mover in these related cycles.49 Italy didn’t fit: it was an Old-World land of out-migration, but its construction cycle was parallel to that of the New World rather than to the British one. The revised hypothesis maintained the Kuznets school’s sense that the various cycles were indeed related, but accepted the critics’ view that the long cycle in capital exports was rooted in financial markets, in the long waves of favor and disfavor with which investors viewed non-British bonds. It accordingly inverted the chain of causation: as the spread between core (British) and periphery interest rates varied over the long cycle, it argued, the supply of capital varied The Reinterpretation, pp. 28-32. 47 Fenoaltea, “Public Policy”; for further references and discussion see Id., The Reinterpretation, pp. 25-28, 67-70. 48 That discovery (which led me to interrupt my work on engineering) came absurdly late: I studied under Alexander Gerschenkron, as the reader by now suspects, and it was somehow understood that one should never enter the office next to his, occupied by Simon Kuznets. 49 For references and discussion see Fenoaltea, The Reinterpretation, pp. 70-75.
15
inversely in the core and in the periphery, setting in motion the inverse construction cycles and, with these, the cycle in migration. Over the decades at hand, save for the very earliest years (until defeat in the Austrian war?) and the very latest (after victory in the Turkish war?), the risk premium on Italian consols varied with that of the financial periphery as a whole, on a par, for example, with that on Central American railway bonds: the long cycle in capital formation in Italy was essentially that of the entire financial periphery, imported through the international capital market, and not genetically Italian at all.50 8 The Kuznets school saw construction as “population-sensitive capital formation”; the revised hypothesis saw construction as “finance-sensitive capital formation.” Metal consumption, still to our minds “industrial investment,” moved much as construction did; the evidence seemed to tell us that investment in industry had been as finance-sensitive as investment in infrastructure. That was admittedly bothersome, as it sat poorly with the familiar relationship between interest-sensitivity and asset longevity; but if those were the facts, there was not much that could be done about it. 9 We now know better. In the light of the new evidence, of the differences between the left-hand graphs of Figure 2, panels A and B, the Kuznets cycle in metal consumption and engineering-industry output appears limited to the construction-related part of engineering, to hardware; the path of investment in machinery was altogether different. The new evidence thus reduces the scope of the (Italian) Kuznets-cycle story, from an investment cycle involving both infrastructure and equipment to an investment cycle involving infrastructure alone. But it thereby strengthens its appeal: industrial investment did not follow the long cycle at all, the problem created by its apparently excessive sensitivity to capital-market conditions has been eliminated at the root. 10 The Kuznets-cycle story did not of course play to universal acclaim, and the recent literature is marked by a return to Gerschenkron’s belief in a structural break in the mid-1890s – and a return to Romeo’s belief that that the key to growth was the praiseworthy policy of the State. Pierluigi Ciocca, in particular, traces the exceptionally vigorous growth of industrial investment in the Giolitti years to Giolitti’s pro-competition policies, which put pressure on monopoly rents and induced entrepreneurs to increase productivity. The analogy between the 1880s and the belle époque, a staple of the immediately preceding literature, is thrown to the wolves: in Ciocca’s long-term perspective the Giolitti years are to be seen as analogous to that other period when the anti-competitive constraints on Italy’s economic growth were temporarily loosened, the halcyon years of the mid-twentieth-century “economic miracle.”51 Gianni Toniolo’s recent survey similarly draws a sharp distinction between the years of “tenuous growth,” to 1896, and those of the subsequent acceleration, when Italy began to converge on the world’s more advanced economies; and he attributes the trend change to the banking reform of the mid-1890s and, above all, to the sound, indeed “clever,” macroeconomic policies that thence “supported growth.”52 But the evidence that has now been brought to bear deprives the neo-
50 For references and discussion see ibid., pp. 75-104. 51 P. Ciocca, Ricchi per sempre? Una storia economica d’Italia (1796-2005), Turin, 2007, pp. 137-163; the claim (pp. 142-143) that the acceleration in GDP growth was mostly due to more rapid trend growth rather than to a cyclical deviation from trend depends critically on the fitted (quadratic) trend, and must be taken cum grano salis. See also Id., "Interpreting the Italian Economy in the Long Run," Rivista di storia economica, 24, 2008, pp. 241-246, and, for further references and discussion, Fenoaltea, The Reinterpretation, pp. 104-108. 52 G. Toniolo, "An Overview of Italy’s Economic Growth,” in Id., ed., The Oxford Handbook of the Italian Economy since Unification, New York, 2013, pp. 9-18; for a statistical underpinning he simply
16
Gerschenkronian view of its empirical foundation: in the Giolitti years investment in industry appears to have grown no faster than before, and the effect of more enlightened policies is simply moot. 11 The newly recovered evidence area-bombs Gerschenkron’s story, Romeo’s story, the Bonelli-Cafagna story, the “political cycle” story, the neo-Gerschenkronian story, reducing them to rubble. The (revised) Kuznets-cycle complex takes a surgical strike: the infrastructure-investment story emerges unscathed, but the industrial-investment component is utterly destroyed. 12 The long debate over the proper interpretation of the long swing in industrial investment has come to an inglorious end: it now appears that for half a century we chewed on, and fought over, a non-existent bone. The long swing in industrial production was a long swing in investment in infrastructure (and other government spending); investment in industry grew instead relatively steadily from decade to decade, with no long swing at all. The exceptional growth of the 1880s and the belle époque was not in the additions to Italy’s industrial plant, in the modernization of its economy, in anything dear to our hearts; it was, as it turns out, in the activity of Italy’s blacksmiths and bricklayers. Sic transit. 13 The newly recovered evidence moves the discussion of Italy’s industrial development to a new and different venue. The old debate is dead: long live the new one, whithersoever it may take us.
CONCLUSION 1 The story of the engineering industry in post-Unification Italy had been derived directly from the evidence on aggregate metal consumption; the latter points to a long (Kuznets) cycle in production, and suggests that domestic products ever dominated the domestic market, with no visible gain from Italy’s poorly designed, but progressively improved, tariff structure. New, disaggregated estimates are now available; and they tell a richer, less paradoxical story. The long cycle – with production and total purchases rapidly rising in the 1880s, falling back in the 1890s, and rising again in the early 1900s – is present in the (dominant) hardware sector, and seems tied directly, as contemporary observers suggested, to the construction cycle. The hardware industry ever dominated the domestic market, with a share of purchases that exceeded eight-tenths; but the net tariff protection it received was ever significant, and varied little. Purchases of general equipment (“machinery”) grew far more rapidly but altogether more steadily, with setbacks at roughly decadal intervals, and nothing like the two decades it took for hardware purchases to surpass their late-1880s peak. Domestic production, initially minuscule, grew even more rapidly. The census data suggest that its share of the domestic market practically doubled, from some thirty-to-forty percent in 1871 and 1881 to sixty in 1900 and seventy in 1911; its strongest growth appears to have been in the 1880s, as the tariff reforms of 1878 and 1887 progressively altered net protection from negative to positive. The production of precision equipment shows the same long cycle as that of fabricated metal, but it seems mostly a (public and private) consumption cycle, the induced reflection of the long cycle in capital supply, construction and overall production; the massive increases in watch imports recorded over the 1880s are a further confirmation that “the crisis of the 1880s” is a figment of the literature.
refers back to Ciocca’s. He traces the long cycle in capital imports to domestic policy measures that altered investors’ confidence (pp. 14, 15, 17), as the “political cycle” story had (S. Fenoaltea, Decollo, ciclo, e intervento dello Stato, in A, Caracciolo, ed., La formazione dell’Italia industriale, Bari, 1969, p. 110); why the risk premium on Central American railway bonds then moved like that on Italian consols is not explained..
17
2 The new, disaggregated estimates have broad implications for the macroeconomic history of post-Unification Italy. The previous, aggregate estimates for the engineering industry pointed to a cycle broadly parallel to the Kuznets cycle in construction. The new estimates both strengthen and weaken that parallel. They strengthen it, by showing that that long cycle was in the (large) hardware component of the engineering industry, that for which construction was a direct customer. But they otherwise weaken it, for they show that that long cycle in metal consumption was not, as it had been taken to be, a long cycle in the production of, and investment in, industrial machinery. Investment in machinery grew relatively steadily, with altogether shorter cycles (and a downturn in the wake of “the crisis of 1907” even as infrastructure investment continued to grow). The long cycle tied to capital-market conditions now appears essentially as a pure construction cycle; and that too can be seen as a return to normalcy. 3 The literature of the last half century has focused on the causes, and significance, of the exceptionally vigorous growth of industrial investment in the Depretis and Giolitti years, that is, in the 1880s and again from the turn of the century. The new, disaggregated estimates establish that the growth of industrial investment in the Depretis and Giolitti years was not exceptionally vigorous at all, in fact it much resembled that of the preceding and intervening decades: our long debate turns out to have been about nothing at all. 4 Proper measurement is all too often its own niggardly reward. In this case the fruits of disaggregation have proved wonderfully rich: long-held views have been swept away, and the path ahead appears in a new light. The moment is sweet indeed. Bliss is it in this dawn to be alive: to be young would be very heaven.
18
Figure 1: General-Engineering New Production and Purchases, 1861-1913: Aggregate Tonnages
A. New production and purchases (thousand tons)
200
400600800
65 70 75 80 85 90 95 00 05 10
________ production -------- purchases B. Tonnage market share
0.0
0.2
0.4
0.6
0.8
1.0
65 70 75 80 85 90 95 00 05 10
________ production/purchases
C. Annual growth rates
-0.4
-0.2
0.0
0.2
0.4
0.6
0.8
65 70 75 80 85 90 95 00 05 10
________ production -------- imports
19
Figure 2: General-Engineering New Production and Purchases, 1861-1913: Sector Value Added
(million lire of engineering-industry value added at 1911 prices)
New production and purchases Market share
A. Fabricated metal and truss-structure components
100
200300400
65 70 75 80 85 90 95 00 05 100.0
0.2
0.4
0.6
0.8
1.0
65 70 75 80 85 90 95 00 05 10
B. Residual general equipment
100
200300400
65 70 75 80 85 90 95 00 05 100.0
0.2
0.4
0.6
0.8
1.0
65 70 75 80 85 90 95 00 05 10
C. Precision equipment
20
40
6080
65 70 75 80 85 90 95 00 05 100.0
0.2
0.4
0.6
0.8
1.0
65 70 75 80 85 90 95 00 05 10
________ production ________ production/purchases -------- purchases
20
Figure 3: Ship and Railway Rolling-stock New Production, 1861-1913: Value Added (million lire of engineering-industry value added at 1911 prices)
A. Naval ships
20
406080
65 70 75 80 85 90 95 00 05 10
________ total for the Regia marina -------- total including exports B. Merchant ships
20
406080
65 70 75 80 85 90 95 00 05 10
________ total -------- sailing ships C. Railway rolling stock
20
406080
65 70 75 80 85 90 95 00 05 10
21
Figure 4: Total Engineering New Production, 1861-1913: by Destination (million lire of engineering-industry value added at 1911 prices)
A. Total new production
100
200300400500600
65 70 75 80 85 90 95 00 05 10
B. New production for infrastructure/government work
100
200300
65 70 75 80 85 90 95 00 05 10
C. New production for other domestic markets and for foreign markets
100
200300
65 70 75 80 85 90 95 00 05 10
------- total _______ total excluding ships
NB: hand tools are included in panel B and excluded from panel C; the working of precious metals is excluded altogether.
22
Table 1. Estimated General-engineering New Product ion, 1861-1913 (thousand tons) ___________________________________________________ ____________________________________ (1) (2) (3) (4) (5) (6) (7) (8) Fabri- Truss- Machines Other Pr ecision Clocks and watches cated structure merely general i nstru- merely from Metal metal components assembled equipment ments assembled metal consumed ___________________________________________________ ____________________________________ 1861 67.07 1.72 .40 3.86 .036 .004 .022 97.6 1862 65.46 1.95 .40 3.76 .036 .004 .022 95.6 1863 63.56 2.04 .32 3.27 .036 .006 .024 92.5 1864 61.85 1.92 .27 2.78 .043 .011 .028 89.5 1865 58.66 1.93 .62 2.99 .042 .006 .027 85.4 1866 55.24 1.58 .39 3.02 .032 .006 .023 80.4 1867 59.75 1.23 .57 3.23 .030 .011 .022 86.3 1868 63.80 1.24 .54 3.61 .030 .010 .022 92.3 1869 68.02 1.13 1.12 3.91 .031 .015 .023 98.2 1870 73.60 1.26 .80 4.11 .030 .016 .023 106.2 1871 69.64 2.77 .84 3.70 .028 .016 .022 102.1 1872 70.03 4.58 1.64 3.89 .033 .020 .023 105.0 1873 66.17 7.22 2.23 3.90 .037 .018 .021 103.0 1874 71.45 7.55 2.17 4.22 .037 .017 .021 110.9 1875 80.90 6.59 1.53 4.49 .037 .021 .023 122.9 1876 78.97 6.45 1.63 4.24 .038 .030 .023 119.8 1877 79.85 6.25 1.69 4.22 .038 .031 .025 120.7 1878 74.63 6.35 1.50 4.09 .041 .030 .025 113.6 1879 79.59 6.82 1.30 4.61 .044 .046 .025 121.6 1880 93.04 7.87 2.54 5.78 .049 .037 .026 142.5 1881 108.74 9.37 3.90 7.29 .054 .062 .027 167.4 1882 123.98 11.65 5.68 8.57 .058 .062 .029 192.3 1883 139.71 13.03 6.31 10.15 .061 .083 .031 217.2 1884 156.14 12.53 7.86 11.99 .066 .081 .035 241.1 1885 165.16 12.23 9.12 13.61 .072 .092 .038 254.9 1886 189.45 12.05 8.02 16.22 .080 .113 .041 290.8 1887 223.16 12.09 9.71 19.62 .112 .124 .043 340.7 1888 234.44 13.19 8.90 24.66 .129 .098 .042 363.6 1889 220.70 12.17 7.23 30.83 .110 .072 .038 351.5 1890 185.45 10.99 5.34 35.62 .095 .087 .036 308.4 1891 146.44 9.83 3.64 34.84 .082 .091 .037 253.4 1892 119.98 9.68 2.84 31.52 .073 .092 .037 213.3 1893 112.69 8.07 2.58 33.70 .073 .110 .039 204.2 1894 113.50 9.27 2.95 38.86 .068 .082 .037 213.2 1895 113.74 7.91 2.87 47.86 .065 .088 .036 223.1 1896 109.59 7.77 2.46 55.59 .074 .077 .035 227.0 1897 102.79 13.12 2.19 56.94 .088 .086 .038 226.0 1898 108.31 11.67 1.75 62.66 .108 .084 .043 238.9 1899 121.76 11.13 2.96 74.95 .122 .106 .050 271.9 1900 132.87 10.43 5.41 85.95 .128 .120 .057 299.8 1901 126.94 11.83 4.17 80.50 .134 .085 .058 286.7 1902 122.20 15.73 4.24 71.40 .137 .131 .062 273.6 1903 127.99 20.04 4.05 72.85 .143 .122 .069 288.4 1904 144.25 16.24 5.81 88.27 .152 .143 .080 325.2 1905 167.38 16.98 5.84 110.39 .167 .143 .084 385.0 1906 208.76 26.63 8.59 134.53 .205 .128 .095 482.7 1907 252.49 30.19 11.27 152.33 .239 .139 .102 568.4 1908 290.53 30.77 16.67 170.42 .255 .146 .108 643.1 1909 328.48 33.31 11.06 189.18 .255 .131 .121 720.8 1910 355.74 40.91 12.33 194.58 .259 .160 .137 773.6 1911 367.76 41.77 14.18 194.78 .277 .160 .154 791.2 1912 385.07 42.32 11.65 196.02 .290 .175 .167 816.8 1913 385.93 42.23 11.07 186.83 .299 .160 .178 806.4 ___________________________________________________ ____________________________________ NB: “General engineering” excludes the shipbuildin g, railway-vehicles, and precious-metal products industries. Sources: see text.
23
Table 2. Net Imports of General-engineering goods , 1861-1913 (thousand tons) ___________________________________________________ ________________________________ (1) (2) (3) (4) (5) (6) (7) Fabri- Other Precision cated Machine general instru- _Clocks and watches . metal parts equipment ments parts assembled Total ___________________________________________________ ________________________________ 1861 7.03 .40 4.43 .184 .004 .048 12.1 1862 7.03 .40 4.43 .184 .004 .048 12.1 1863 11.83 .32 3.46 .197 .006 .064 15.9 1864 11.17 .27 2.23 .295 .011 .079 14.1 1865 9.47 .62 6.02 .229 .006 .059 16.4 1866 9.10 .39 3.62 .193 .006 .042 13.4 1867 9.13 .57 5.57 .221 .011 .042 15.5 1868 8.57 .54 4.97 .202 .010 .036 14.3 1869 12.03 1.12 7.86 .249 .015 .049 21.3 1870 11.45 .80 5.08 .176 .016 .035 17.6 1871 12.15 .84 5.72 .197 .016 .036 19.0 1872 12.08 1.64 9.00 .283 .020 .039 23.1 1873 12.58 2.23 12.21 .295 .018 .017 27.4 1874 11.99 2.17 12.06 .277 .017 .038 26.6 1875 13.28 1.53 10.91 .311 .021 .033 26.1 1876 11.05 1.63 11.73 .292 .030 .030 24.8 1877 12.86 1.69 12.04 .323 .031 .035 27.0 1878 9.73 1.50 10.64 .240 .030 .030 22.2 1879 11.08 1.30 9.55 .193 .046 .026 22.2 1880 12.98 2.54 14.38 .237 .037 .028 30.2 1881 20.14 3.90 17.69 .258 .062 .028 42.1 1882 23.59 5.68 21.18 .300 .062 .027 50.8 1883 23.41 6.31 20.04 .301 .083 .032 50.2 1884 23.85 7.86 21.64 .387 .081 .058 53.9 1885 23.86 9.12 24.16 .410 .092 .070 57.7 1886 24.60 8.02 21.75 .525 .113 .076 55.1 1887 29.58 9.71 26.34 1.143 .124 .085 67.0 1888 27.94 8.90 24.59 .900 .098 .072 62.5 1889 25.25 7.23 23.78 .682 .072 .056 57.1 1890 18.81 5.34 23.12 .579 .087 .052 48.0 1891 15.19 3.64 18.01 .416 .091 .053 37.4 1892 13.37 2.84 18.30 .408 .092 .057 35.1 1893 11.59 2.58 17.14 .418 .110 .057 31.9 1894 10.88 2.95 18.24 .321 .082 .047 32.5 1895 8.31 2.87 24.38 .365 .088 .051 36.1 1896 9.62 2.46 25.62 .480 .077 .046 38.3 1897 9.11 2.19 22.18 .635 .086 .047 34.2 1898 13.44 1.75 24.17 .923 .084 .059 40.4 1899 16.83 2.96 36.50 .959 .106 .057 57.4 1900 22.47 5.41 50.62 1.063 .120 .065 79.7 1901 21.47 4.17 40.86 1.113 .085 .060 67.8 1902 26.25 4.24 38.69 1.134 .131 .065 70.5 1903 26.62 4.05 44.24 1.264 .122 .091 76.4 1904 20.59 5.81 53.33 1.392 .143 .084 81.3 1905 20.47 5.84 63.27 1.699 .143 .061 91.5 1906 43.56 8.59 92.93 2.621 .128 .089 147.9 1907 72.95 11.27 118.48 2.832 .139 .094 205.8 1908 82.55 16.67 125.44 3.223 .146 .102 228.1 1909 65.56 11.06 90.69 2.849 .131 .075 170.4 1910 71.45 12.33 85.41 3.374 .160 .094 172.8 1911 67.21 14.18 76.24 3.539 .160 .090 161.4 1912 67.22 11.65 69.37 3.900 .175 .094 152.4 1913 63.54 11.07 56.38 3.897 .160 .084 135.1 ___________________________________________________ ________________________________ NB: “General engineering” excludes the shipbuildin g, railway-vehicles, and precious-metal products industries. Sources: see text
24
Table 3. OLS Regression Results.
1. dependent variable: growth rate of fabricated metal and truss-structure purchases independent variables: coeff. t stat.
constant -.017 -.90 Depretis dummy (1 in1878-1887) .126 3.58 Giolitti dummy (1 in 1896-1913) .097 3.33 R2 = .266 D.W. = .96 .
2. dependent variable: growth rate of general equipment purchases independent variables: coeff. t stat.
constant .068 1.65 Depretis dummy (1 in1878-1887) .063 .82 Giolitti dummy (1 in 1896-1913) .010 .16 R2 = .014 D.W. = 2.32 .
2. dependent variable: growth rate of precision equipment purchases independent variables: coeff. t stat.
constant -.003 -.10 Depretis dummy (1 in1878-1887) .147 2.38 Giolitti dummy (1 in 1896-1913) .117 2.27 R2 = .140 D.W. = 2.15 .