THE EFFECTS OF SUBSTITUTING FISHMEAL WITH … · THE EFFECTS OF SUBSTITUTING FISHMEAL WITH RAPESEED...
33
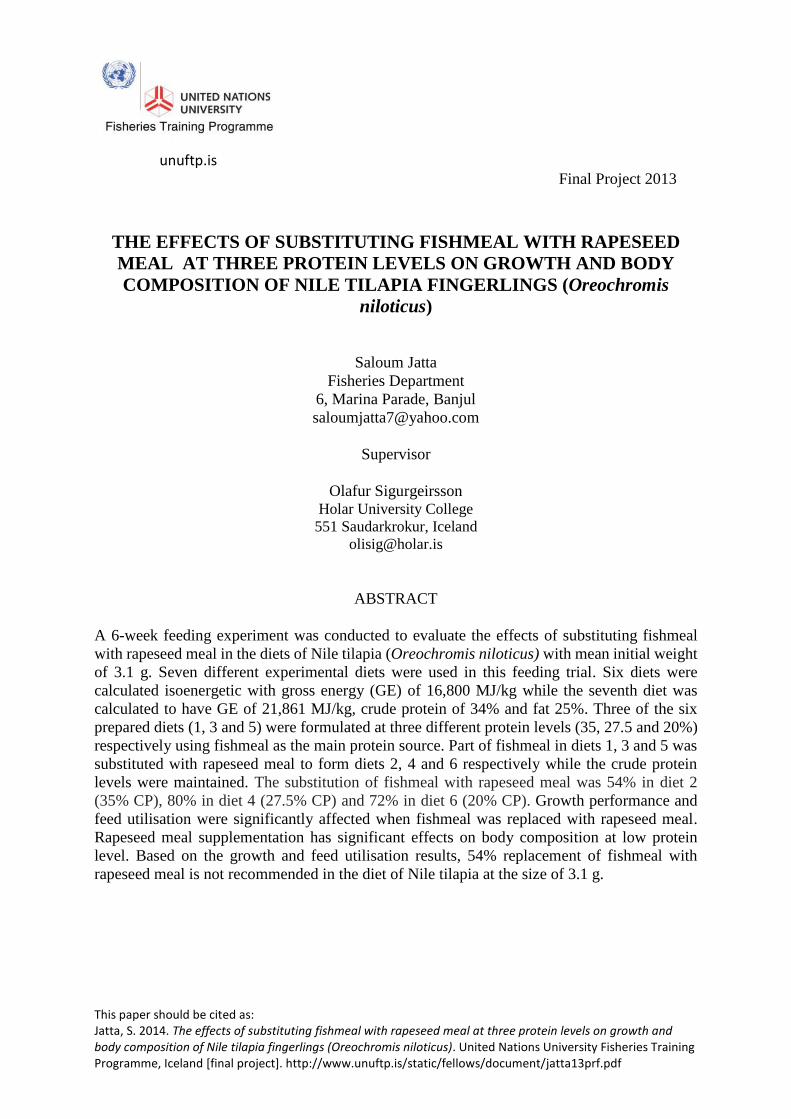
unuftp.is This paper should be cited as: Jatta, S. 2014. The effects of substituting fishmeal with rapeseed meal at three protein levels on growth and body composition of Nile tilapia fingerlings (Oreochromis niloticus). United Nations University Fisheries Training Programme, Iceland [final project]. http://www.unuftp.is/static/fellows/document/jatta13prf.pdf Final Project 2013 THE EFFECTS OF SUBSTITUTING FISHMEAL WITH RAPESEED MEAL AT THREE PROTEIN LEVELS ON GROWTH AND BODY COMPOSITION OF NILE TILAPIA FINGERLINGS (Oreochromis niloticus) Saloum Jatta Fisheries Department 6, Marina Parade, Banjul [email protected] Supervisor Olafur Sigurgeirsson Holar University College 551 Saudarkrokur, Iceland [email protected] ABSTRACT A 6-week feeding experiment was conducted to evaluate the effects of substituting fishmeal with rapeseed meal in the diets of Nile tilapia (Oreochromis niloticus) with mean initial weight of 3.1 g. Seven different experimental diets were used in this feeding trial. Six diets were calculated isoenergetic with gross energy (GE) of 16,800 MJ/kg while the seventh diet was calculated to have GE of 21,861 MJ/kg, crude protein of 34% and fat 25%. Three of the six prepared diets (1, 3 and 5) were formulated at three different protein levels (35, 27.5 and 20%) respectively using fishmeal as the main protein source. Part of fishmeal in diets 1, 3 and 5 was substituted with rapeseed meal to form diets 2, 4 and 6 respectively while the crude protein levels were maintained. The substitution of fishmeal with rapeseed meal was 54% in diet 2 (35% CP), 80% in diet 4 (27.5% CP) and 72% in diet 6 (20% CP). Growth performance and feed utilisation were significantly affected when fishmeal was replaced with rapeseed meal. Rapeseed meal supplementation has significant effects on body composition at low protein level. Based on the growth and feed utilisation results, 54% replacement of fishmeal with rapeseed meal is not recommended in the diet of Nile tilapia at the size of 3.1 g.
Transcript of THE EFFECTS OF SUBSTITUTING FISHMEAL WITH … · THE EFFECTS OF SUBSTITUTING FISHMEAL WITH RAPESEED...
unuftp.is
This paper should be cited as: Jatta, S. 2014. The effects of substituting fishmeal with rapeseed meal at three protein levels on growth and body composition of Nile tilapia fingerlings (Oreochromis niloticus). United Nations University Fisheries Training Programme, Iceland [final project]. http://www.unuftp.is/static/fellows/document/jatta13prf.pdf
Final Project 2013
THE EFFECTS OF SUBSTITUTING FISHMEAL WITH RAPESEED
MEAL AT THREE PROTEIN LEVELS ON GROWTH AND BODY
COMPOSITION OF NILE TILAPIA FINGERLINGS (Oreochromis
niloticus)
Saloum Jatta
Fisheries Department
6, Marina Parade, Banjul
Supervisor
Olafur Sigurgeirsson Holar University College
551 Saudarkrokur, Iceland
ABSTRACT
A 6-week feeding experiment was conducted to evaluate the effects of substituting fishmeal
with rapeseed meal in the diets of Nile tilapia (Oreochromis niloticus) with mean initial weight
of 3.1 g. Seven different experimental diets were used in this feeding trial. Six diets were
calculated isoenergetic with gross energy (GE) of 16,800 MJ/kg while the seventh diet was
calculated to have GE of 21,861 MJ/kg, crude protein of 34% and fat 25%. Three of the six
prepared diets (1, 3 and 5) were formulated at three different protein levels (35, 27.5 and 20%)
respectively using fishmeal as the main protein source. Part of fishmeal in diets 1, 3 and 5 was
substituted with rapeseed meal to form diets 2, 4 and 6 respectively while the crude protein
levels were maintained. The substitution of fishmeal with rapeseed meal was 54% in diet 2
(35% CP), 80% in diet 4 (27.5% CP) and 72% in diet 6 (20% CP). Growth performance and
feed utilisation were significantly affected when fishmeal was replaced with rapeseed meal.
Rapeseed meal supplementation has significant effects on body composition at low protein
level. Based on the growth and feed utilisation results, 54% replacement of fishmeal with
rapeseed meal is not recommended in the diet of Nile tilapia at the size of 3.1 g.

Jatta
UNU-Fisheries Training Programme ii
TABLE OF CONTENT
LIST OF TABLES ................................................................................................................................................ III
LIST OF FIGURES .............................................................................................................................................. IV
1 INTRODUCTION ....................................................................................................................................... 1
1.1 DEVELOPMENTAL STAGES OF AQUACULTURE IN THE GAMBIA .................................................................................. 1
1.2 LOCAL INGREDIENTS AVAILABLE IN THE GAMBIA ................................................................................................... 2
1.3 LOCAL INGREDIENTS CURRENTLY USED IN AQUA-FEEDS .......................................................................................... 2
1.4 PROBLEM STATEMENT .................................................................................................................................... 2
1.5 OBJECTIVES .................................................................................................................................................. 3
1.6 HYPOTHESIS AND QUESTIONS ........................................................................................................................... 3
1.7 JUSTIFICATION ............................................................................................................................................... 3
2 LITERATURE REVIEW ............................................................................................................................... 4
2.1 DIETARY REQUIREMENTS OF TILAPIA .................................................................................................................. 4
2.1.1 Protein requirements of tilapia ....................................................................................................... 4
2.1.2 Amino acids requirements of tilapia ............................................................................................... 5
2.1.3 Lipid requirements of tilapia ........................................................................................................... 6
2.1.4 Rapeseed meal ................................................................................................................................ 6
3 MATERIALS AND METHODS .................................................................................................................... 7
3.1 EXPERIMENTAL DESIGN AND DIET ...................................................................................................................... 7
3.2 GROWTH TRIAL ........................................................................................................................................... 10
3.3 SAMPLING .................................................................................................................................................. 11
3.4 CALCULATIONS OF PARAMETERS ..................................................................................................................... 11
3.5 ANALYSIS OF THE DIETS ................................................................................................................................. 11
3.6 ANALYSIS OF THE BODY COMPOSITION ............................................................................................................. 11
3.7 STATISTICAL ANALYSIS ................................................................................................................................... 11
4 RESULTS ................................................................................................................................................ 12
4.1 WATER QUALITY PARAMETERS ........................................................................................................................ 12
4.2 GROWTH AND SURVIVAL ............................................................................................................................... 13
4.3 BODY COMPOSITION .................................................................................................................................... 17
4.4 EFFECT OF PRODUCTION COST ........................................................................................................................ 18
5 DISCUSSION .......................................................................................................................................... 19
6 CONCLUSIONS AND RECOMMENDATIONS ............................................................................................ 21
ACKNOWLEDGEMENTS .................................................................................................................................. 22
REFERENCES ................................................................................................................................................... 23
APPENDIX....................................................................................................................................................... 28

Jatta
UNU-Fisheries Training Programme iii
LIST OF TABLES
Table 1. The 10 essential amino acid requirements of Nile tilapia (O. niloticus) data adapted
from NRC (2011) ....................................................................................................................... 6
Table 2. Formulations and proximate composition of experimental diets (as fed basis). .......... 9
Table 3. Estimated raw material price and content of crude protein, crude fat, crude ash and
moisture of the experimental diets. ............................................................................................ 9
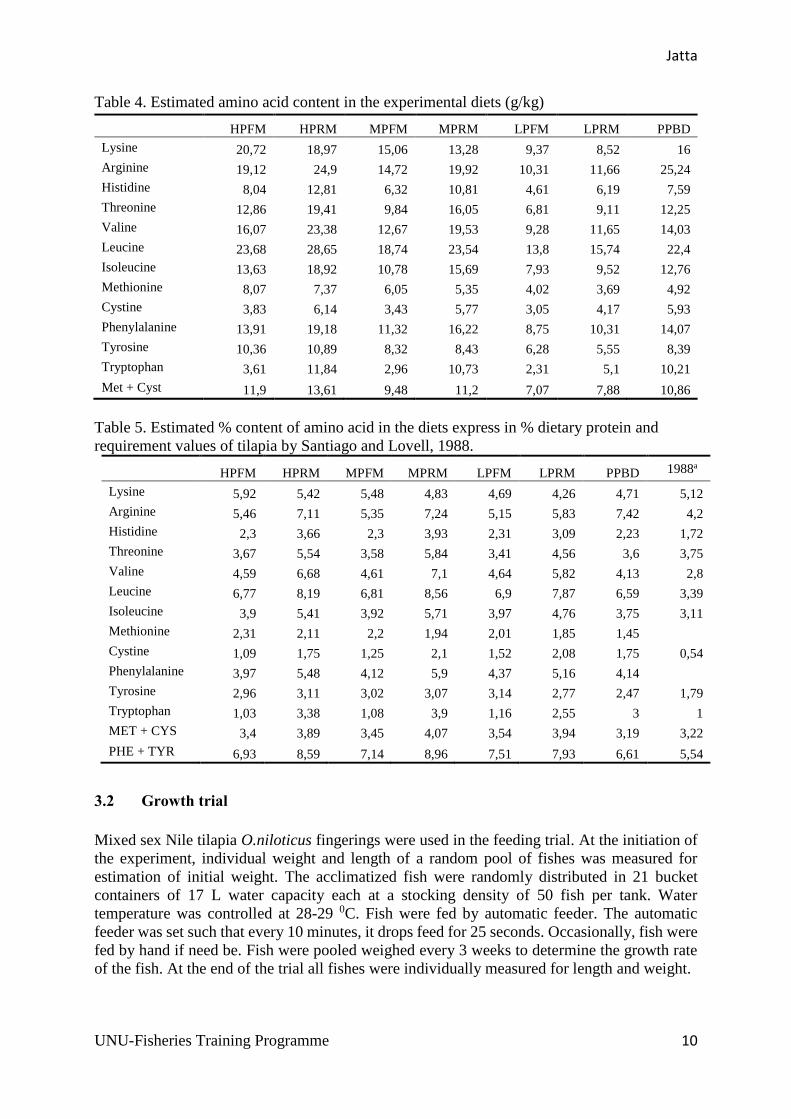
Table 4. Estimated amino acid content in the experimental diets (g/kg) ................................. 10
Table 5. Estimated % content of amino acid in the diets express in % dietary protein and
requirement values of tilapia by Santiago and Lovell, 1988. ................................................... 10
Table 6 : Body composition parameters of Nile tilapia fingerlings before and feeding on
different experimental diets. (N=4). ......................................................................................... 18
Table 7. Cost of production of a kilo of fish per diet in Icelandic Kroner (ISK) ..................... 18
Table 8. Comparison of growth and feed utilisation performances of Nile tilapia fingerlings
fed on fishmeal and fishmeal plus rapeseed meal protein sources diets at the end of 3 weeks.
(N=3). ....................................................................................................................................... 28
Table 9. Growth and feed utilisation parameters of Nile tilapia fingerlings fed on different
experimental diets at the end of 6 weeks. (N=3). ..................................................................... 28
Table 10. Comparison of growth and feed utilisation performances of Nile tilapia fingerlings
fed on fishmeal protein source diets at different protein levels at the end of 6 weeks. (N=3). 28
Table 11. Comparison of growth and feed utilisation performances of Nile tilapia fingerlings
fed on fishmeal plus rapeseed meal protein sources diets at different protein levels at the end
of 6 weeks. (N=3). .................................................................................................................... 29
Table 12. Comparison of growth and feed utilisation performances of Nile tilapia fingerlings
fed on fishmeal and fishmeal plus rapeseed meal protein sources diets at the same protein
level at the end of 6 weeks. (N=3). .......................................................................................... 29
Jatta
UNU-Fisheries Training Programme iv
LIST OF FIGURES
Figure 1 : Comparison of essential amino acid composition of rapeseed meal and fish meal.
The composition of fish meal is set as an index of 100 and the figure is showing the deviation
.................................................................................................................................................... 7
Figure 2. Flow chart of experimental design and diets .............................................................. 8
Figure 3. Average dissolved oxygen level (mg/l ±SD) in groups fed fish meal protein diets
during the feeding period. n= 3 for each treatment .................................................................. 12
Figure 4. Temperature (°C) in the experimental tanks during the trial period. ........................ 13
Figure 5. Changes in total body weight (g) of Nile tilapia fingerlings fed different
experimental diets .................................................................................................................... 14
Figure 6. Effects of dietary protein level and source and their interaction on final average
weight of Nile tilapia fingerlings (Values are mean of the triplicate ±SD) ............................. 15
Figure 7. Effects of dietary protein level and source and their interaction on specific growth
rate (SGR) of Nile tilapia fingerlings (Values are mean of the triplicate ±SD) ....................... 15
Figure 8. Effects of dietary protein level and source and their interaction on percentage weight
gain (WG (%)) of Nile tilapia fingerlings (Values are mean of the triplicate ±SD) ................ 16
Figure 9.Effects of dietary protein level and source and their interaction on percentage feed
efficiency (FE (%)) of Nile tilapia fingerlings (Values are mean of the triplicate ±SD) ......... 16
Figure 10. Effects of dietary protein level and source and their interaction on feed conversion
ratio (FCR) of Nile tilapia fingerlings (Values are mean of the triplicate ±SD) ...................... 17

Jatta
UNU-Fisheries Training Programme 1
1 INTRODUCTION
In many developing countries, the basic and affordable animal protein is provided by aquatic
organisms, mainly fish from capture fisheries as protein from terrestrial animals is very
expensive for ordinary or low income earners. The main source of fish in the Gambia is artisanal
capture fisheries (DOF, 2011) and the productivity of this sector is declining. For the country
to meet the demand for fish for its population, one of the available feasible options is
aquaculture. Currently, aquaculture is the fastest growing food producing sector globally.
According to FAO (2013), world aquaculture production of food fish was 62.7 million tonnes
totaling to USD 130 billion in 2011. Therefore, the sector is playing an important role in
providing products which are very essential to human basic needs and also providing
employment opportunities to many people worldwide.
Fish farming requires the provision of feed especially in intensive and semi-intensive systems.
Since feed represents about 50-80% of the operational costs in intensive system (Oliveira-
Cavalheiro et al., 2007), special attention should be given to protein, the most expensive macro
component of feed (Lim et al., 2007), particularly fishmeal, the most expensive protein source
(Tacon, 1993). It is high time to search for alternatives to replace fishmeal because in the near
future, its usage in aqua-feeds will be limited in many developing countries due to high cost
(El-Sayed, 1998), unavailability or both. Cheap ingredients that are currently used in aqua feeds
in The Gambia are by-products of plants and animals. Most of the plant ingredients have
imbalance amino acid profiles that do not match the dietary requirements of fish as fishmeal
does. That being the case, in order to get alternative substitutes for fish meal, there should be
thorough investigation of the ingredients feasible for the cultured species. This can be done
through formula manipulations and mixing of various ingredients, in order to come out with
ideal formulations. Once alternative substitutes are obtained, the cost of production can be
estimated, productivity can be enhanced and this will go a long way in helping the Government
to achieve its Millennium Development Goal on eradicating extreme poverty and hunger.
Tilapia is an economically important fish which is being farmed in both tropical and subtropical
regions. It has high yield potentials of output and it can be cultured by using simple technology
in earthen ponds, tanks, raceways, etc. These qualities make it a good candidate for subsistence
and commercial aquaculture.
1.1 Developmental stages of aquaculture in the Gambia
The earliest freshwater aquaculture trials were carried out in the late1970’s and involved
culturing of Tilapia and African catfish in small fish ponds. Catholic Relief Services (CRS)
with assistance from the US Peace Corps and the Department of Fisheries carried out the culture
trials. Though the trials did not produce the expected output, important lessons were learnt.
Shrimp farming started in 1986 by a Scandinavian Company called Scan-Gambia Ltd. The
company was raising Peneaus monodon, imported from Sri Lanka. It has hatchery, grow out
ponds and processing plant. The farm consists of 54 ponds and each pond is 4 ha. After about
six years of production, the company was bankrupt and stopped production in 1992. Three
species polyculture was carried out by Fisheries Department in 1995. Tilapia nilotica, Heterotis
niloticus and Clarias garipinus were the fish cultured in this trial. Although successful, the trial
could not continue due to lack of funds.
Jatta
UNU-Fisheries Training Programme 2
The West Africa Aquaculture (WAA) bought Scandinavian shrimp farm in 2000 after several
years of dysfunction. West Africa Aquaculture is also raising P. monodon from larva to
maturity. Of the original 200 ha, only few are being used today.
Taiwan Technical Mission established a fish farm in The Gambia in 2007 consisting of a
hatchery, grow out ponds and feed milling machine. The hatchery produces tilapia. It uses hapas
for tilapia fry production, concrete nursery ponds for raising fry to fingerlings and earthen ponds
for grow out.
The FAO TCP project was established in 2009 but started production in 2010. The project has
20 ponds initially for tilapia farming but later dug an additional 31 ponds.
1.2 Local ingredients available in The Gambia
Local ingredients available that can be used in aqua-feed are: groundnut cake, cotton seed meal,
sesame seed cake, rice, maize, millet and sorghum brans; expired wheat flour from stores,
cassava peels and leaves, pawpaw leaves, duckweed, moringa leaf meal, by-products from fish
and shrimp processing factories, brewers waste, wild fruits, etc.
1.3 Local ingredients currently used in aqua-feeds
In the Gambia, the only fish farm that has a feed mill is Taiwanese Fish Hatchery (presently
under Fisheries Department). Feed formulations at that farm are dictated to a large extent by
the price of local ingredients. The farm adjusts its feed formulations in order to reduce feed cost
but they have yet to produce a formula that is cost effective without compromising fish growth.
1.4 Problem statement
Feed is generally the most expensive cost item in aquaculture production. The high cost of feed
is mostly due to the protein component, and feed for most of the cultured fish species contain
high protein level (30-50% CP). Fishmeal is commonly a very good protein source in fish feed,
due to good digestibility and amino acid content. The problem is that fishmeal is of high price
and a limited resource. High cost of raw materials force many aquaculture farmers in
developing countries to substitute expensive conventional feed ingredients like fish meal with
other local and available ingredients. The substitution of ingredients and formulation of feeds
effects the growth response and wellbeing of the fish. If feed selection is not taken into careful
consideration, the farming effort will hardly bring any benefit to farmers due to low quality and
poor production rate. This does not only discourages the farmers but also scares off potential
investors in aquaculture. Aquaculture cannot grow in any country without significant
investment. Various sources and by-products can be used in fish feed. Therefore different feed
formulations using different raw materials need to be tested. These formulations might be a
compromise of low cost and optimal or appropriate fish growth.
The aim of this study is to examine whether replacement of fish meal with rapeseed meal will
have significant effects on growth performance of Nile tilapia fingerlings (Oreochromis
niloticus).
Jatta
UNU-Fisheries Training Programme 3
1.5 Objectives
The purpose of this study is to examine if replacing fish meal with rapeseed meal will have
significant effects on growth performance of Nile tilapia fingerlings (O. niloticus).
The primary aims of this project are:
To investigate the effects of different protein levels on growth responses of Nile tilapia
fingerlings fed on diets prepared from different raw materials.
To investigate the effects of substituting fish meal with rapeseed meal on growth
response of Nile tilapia fingerlings.
To compare the diets which have fish meal with diets which have fish meal plus
rapeseed meal (plant protein) as protein sources or plant based diet.
1.6 Hypothesis and questions
Crude protein level may have significant effect on growth performance of Nile tilapia.
Substituting fish meal protein with rapeseed meal protein in Nile tilapia fingerling diet or may
not have significant effects on growth.
Substitution of fish meal with rapeseed meal may have significant effect on body composition
of Nile tilapia fingerlings.
1. Will the crude protein level have any significant effects on growth performance of Nile
tilapia fingerling, survival and size distribution?
2. Will the substitution of fish meal with rapeseed meal have significant impact on growth
performance of Nile tilapia fingerlings?
3. Will the substitution of fish meal with rapeseed meal have significant effect on the body
composition of Nile tilapia?
1.7 Justification
The use of low quality feeds in aquaculture is affecting the productivity of fish farming in the
Gambia. It is evident that the efforts of fish farmers are not yielding the expected benefits or
results from the farms. Therefore, some interventions should be taken to enhance economic
returns of the farmers in order to keep them in the sector. Otherwise they will be discouraged.
It is also obvious that the Government’s aspirations to use aquaculture to reduce pressure on
capture fisheries, enhance the production of food fish, improve livelihoods of the populace and
as well as generate income for rural resource poor farmers cannot be achieved at the current
production levels. Therefore, an important way out is to enhance feed quality which will
consequently increase the production and the benefit. Improving feed quality will require
extensive research on the nutritional compositions of the available ingredients and the
recognition of requirement of the cultured fish especially if one is to use nonconventional
ingredients. Tangible results which one can rely on can come through experimental trials. The
findings from investigation can be used to improve the present formulations.

Jatta
UNU-Fisheries Training Programme 4
2 LITERATURE REVIEW
2.1 Dietary requirements of tilapia
2.1.1 Protein requirements of tilapia
Dietary protein requirements of tilapia have been extensively studied worldwide. From the
findings, it appears that the protein requirements of tilapia like other finfishes depend on fish
size and can be expressed as digestible protein (DP) to digestible energy (DE) ratio (NRC,
2011).
Conflicting results have been obtained by many authors concerning the dietary protein
requirements of tilapia. Based on the size/age, small tilapia have higher dietary protein
requirement and the requirement decreases as the fish grows bigger (Abdel-Tawwab and
Ahmad, 2009; Winfree and Stickney, 1981). Fry of 2.5 g of O. niloticus requires about 56%
dietary protein while 2.5-7.5 g fry require 34% dietary protein for maximum growth
performance (Winfree and Stickney, 1981) although lower dietary protein value of 45% at
energy level of 400 kcal/100 g was reported to give maximum growth to swim-up fry (12 mg)
when reared under laboratory conditions (El-Sayed and Teshima, 1992). The optimum dietary
protein requirements for optimal growth of Nile tilapia fry (~0.5 g) was reported to be 45%
whereas the optimal requirements for fingerling (~20 g) and advanced juvenile (~40 g) was
found to be 35% (Abdel-Tawwab et al., 2010). According to Siddiqui et al., (1988), 0.8g Nile
tilapia (O. niloticus) require 40% dietary protein while those weighing 40g require 30% dietary
protein. The dietary protein level for economical diet for O. niloticus fry (0.51 g) and juvenile
fish (45 g) was found to be 40% while that of the adult (96 and 264 g) was 30% (Al-Hafedh,
1999). The results of least-cost dietary protein levels evaluation for four species of tilapia (O.
mossambicus, O. niloticus, O. aureus and Tilapia Zillii) showed maximum growth from the
dietary protein levels 34 - 36% for young tilapia (1-5 g), but the authors recommended 25-28%
as the most cost-effective protein level (De-Silva et al., 1989). The recommended protein level
for 21 g grow-out hybrid tilapia fed on all-plant diets and reared in tanks was 28% (Twibell and
Brown, 1998). There is inconsistency among the results which could be due to differences in
culture methods, raw materials or possible genetic differences in the strains used. The general
trend is clear though, protein requirements as a proportion of the mass of the diet, decrease with
size (NRC, 2011).
The growth rate of fish is high when the ratio of digestible protein to digestible energy in the
diet is optimal for the species but when the ratio of DP to DE in the diet is very high or very
low for the species, growth rate becomes constant or declines. Tilapia at fry stage require diets
which have high digestible protein to digestible energy ratio but as they grow bigger, they need
diets which have low DP to DE protein ratio. Winfree and Stickney (1981) reported that diets
which have high protein to energy (P:E) ratio (123 mg protein/kcal) produced better growth
than diets which have lower P:E ratio (82 mg protein/kcal) during the first few weeks but high
protein to-energy ratios became growth limiting factor as fish approached 5g. At the end of the
experiment, fish fed diets with protein to-energy ratio (108 mg protein/kcal) produced the best
growth. The best protein to-energy ratio in the diet of tilapia that produced the highest growth
(average final weight, 39.04 g) was found to be 89 mg protein/kcal at dietary protein level of
25% and energy level of 2,800 kcal/kg (Li et al., 2013).

Jatta
UNU-Fisheries Training Programme 5
Physiological conditions can also influence dietary protein needs of tilapia. Broodstock require
high dietary protein in their diets for efficient performance and quality eggs. In an experiment
where the effects of dietary protein level investigated on spawning performance of Nile tilapia
broodstock, the authors concluded that 40% dietary protein is required for optimum spawning
performance of this fish reared at 0 ppt., 7 ppt. and 14 ppt salinity in clear water (El-Sayed et
al., 2003). Although Gunasekera et al. (1996a) did not make any conclusive statement about
protein requirement of Nile tilapia broodstock when fed on three different dietary protein levels
(10, 20 and 35%), the eggs of fish fed on 35% protein have higher protein content and overall
total amino acid composition compared to those fed on sub-optimal protein levels (10 and 20%).
It was also noticed when broodstock were fed on low protein diet (10% CP), spawning intervals
were delayed (Gunasekera et al., 1996a) and the eggs produced were not fertilized (Gunasekera
et al., 1996b).
A review of Luquet (1989) concluded that tilapia’s dietary protein requirements seem to be
between 30-35% but 30% appears to be a safe level.
2.1.2 Amino acids requirements of tilapia
Amino acids are the end products of protein digestion and they can be used in anabolism to
synthesize proteins again or catabolism to generate energy. Tilapia also require the 10 essential
amino acids (Santiago and Lovell, 1988) namely: arginine, histidine, isoleucine, leucine, lysine,
methionine, phenylalanine, threonine, tryptophan and valine. The quantitative essential amino
acids (EAA) requirements of few farmed tilapia have been determined but there were some
discrepancies in the reported values from species to species and sometimes even same species.
The variations could be caused by amino acid sources used in semi-purified and practical diets
or the expression of the requirements as percentage of the diet instead of dietary protein.
Although fish can sufficiently synthesize nonessential amino acids, their inclusion in the diets
will reduce or reserve the energy which could have been used in their synthesis to be used for
other body functions. Cystine and tyrosine although are nonessential AAs, they are of particular
importance as they can only be synthesized by methionine and phenylalanine respectively.
Therefore, their inclusion in diets reduces the requirements of these two essential AAs. It was
reported that in practical diet formulation when the level of dietary cystine was 0.45% (or 1.61%
of dietary protein), methionine at a level of 0.49% of the diet or 1.75% of dietary protein was
adequate for meeting the requirement of juvenile Nile tilapia (Nguyen and Davis, 2009a). In
another study, the same authors indicated that cystine could replace 49% of methionine in the
diet of juvenile Nile tilapia (Nguyen and Davis, 2009b). The ten essential amino acid
requirements of Nile tilapia are shown in Table 1.

Jatta
UNU-Fisheries Training Programme 6
Table 1. The 10 essential amino acid requirements of Nile tilapia (O. niloticus) data adapted
from NRC (2011)
Amino acid Estimated requirement Reference
Arginine
4,2% of CP (Santiago and Lovell, 1988)
Histidine
1,7% of CP (Santiago and Lovell, 1988)
Isoleucine
3,1% of CP (Santiago and Lovell, 1988)
Leucine
3.4% of CP (Santiago and Lovell, 1988)
Lysine
5,1% of CP (Santiago and Lovell, 1988)
5,4-5,7% of CP (Furuya et al., 2004a)
5,23% of CP (Furuya et al., 2006)
Methionine
2,7% of CP (with
0,5% Cys) (Santiago and Lovell, 1988)
2,1% of CP (Furuya, et al., 2001)
2,8% CP
(Nguyen and Davis, 2009a)
Phenilalanine
3,8% of CP (Santiago and Lovell, 1988)
Threonine
3,8% of CP (Santiago and Lovell, 1988)
Tryptophane
1,0% of CP (Santiago and Lovell, 1988)
Valine
2,8% of CP (Santiago and Lovell, 1988)
2.1.3 Lipid requirements of tilapia
Dietary lipids are important sources of highly digestible energy and are the only source of
essential fatty acids for fish for normal growth and development. They also improve the flavour
of feed and affect feed texture and fatty acid composition of fish. There are varying results for
lipid requirements of tilapia. Some researchers reported dietary lipid requirement of more than
10% while others recommended 10% or below. A better growth was obtained from hybrid
tilapia fed on 55 and 85 g/kg lipid diets compared to those fed on 25 and 115 g/kg lipid diets
(Han et al., 2011). Good growth and feed efficiency were obtained by Chou and Shiau (1996)
from juvenile hybrid tilapia (O. niloticus x O. aureus) when the fish were fed with 10 and 15%
lipid diets. They suggested that 5% lipid level appeared to meet the minimum requirement for
this species, but for maximum growth, 12% was recommended. Although the augmentation of
dietary lipid significantly increase the weight of blue tilapia, lipid level of about 17% was said
to be too high for this species (Wille et al., 2002).
2.1.4 Rapeseed meal
Rapeseed meal is the major plant protein source which is substituted with fish meal in this trial.
It is made from oilseeds from the genus Brassica which are grown as oil and protein crops. The
Jatta
UNU-Fisheries Training Programme 7
world production is close to 60 million tons. Rape seed meal (or Canola meal) contains about
35% crude protein, 3,5% crude oil, 6% ash, 12% crude fiber and 10% moisture.
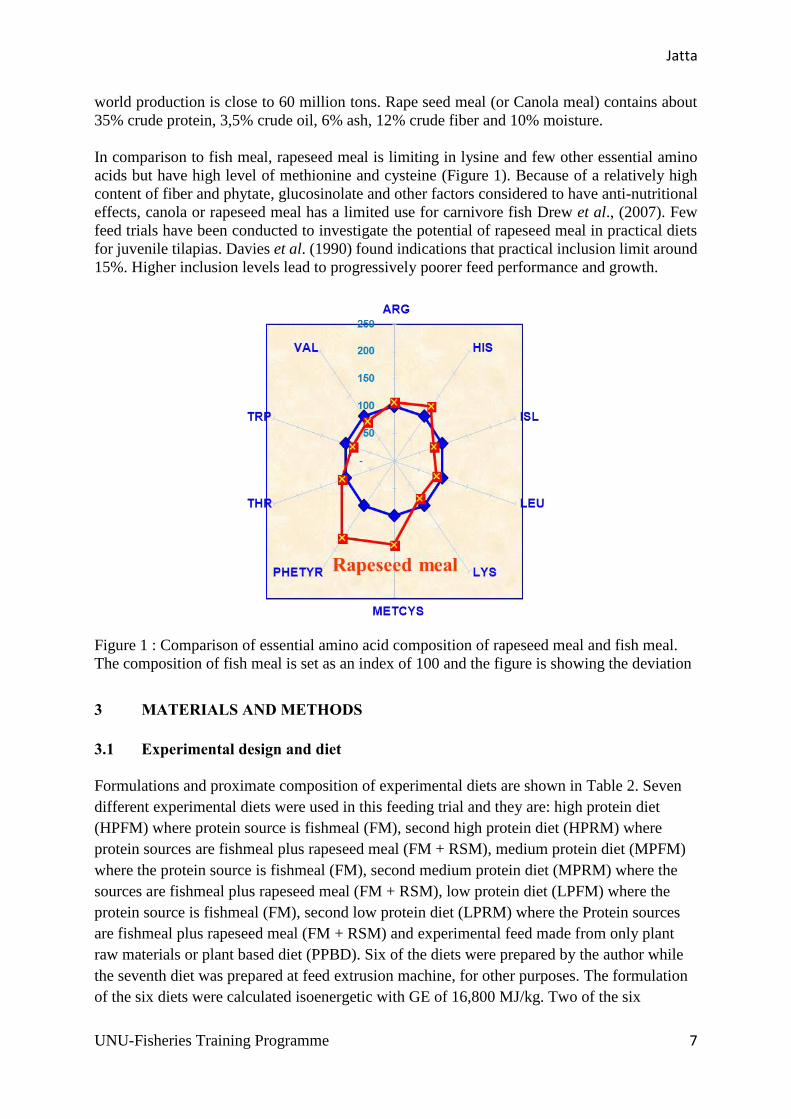
In comparison to fish meal, rapeseed meal is limiting in lysine and few other essential amino
acids but have high level of methionine and cysteine (Figure 1). Because of a relatively high
content of fiber and phytate, glucosinolate and other factors considered to have anti-nutritional
effects, canola or rapeseed meal has a limited use for carnivore fish Drew et al., (2007). Few
feed trials have been conducted to investigate the potential of rapeseed meal in practical diets
for juvenile tilapias. Davies et al. (1990) found indications that practical inclusion limit around
15%. Higher inclusion levels lead to progressively poorer feed performance and growth.
Figure 1 : Comparison of essential amino acid composition of rapeseed meal and fish meal.
The composition of fish meal is set as an index of 100 and the figure is showing the deviation
3 MATERIALS AND METHODS
3.1 Experimental design and diet
Formulations and proximate composition of experimental diets are shown in Table 2. Seven
different experimental diets were used in this feeding trial and they are: high protein diet
(HPFM) where protein source is fishmeal (FM), second high protein diet (HPRM) where
protein sources are fishmeal plus rapeseed meal (FM + RSM), medium protein diet (MPFM)
where the protein source is fishmeal (FM), second medium protein diet (MPRM) where the
sources are fishmeal plus rapeseed meal (FM + RSM), low protein diet (LPFM) where the
protein source is fishmeal (FM), second low protein diet (LPRM) where the Protein sources
are fishmeal plus rapeseed meal (FM + RSM) and experimental feed made from only plant
raw materials or plant based diet (PPBD). Six of the diets were prepared by the author while
the seventh diet was prepared at feed extrusion machine, for other purposes. The formulation
of the six diets were calculated isoenergetic with GE of 16,800 MJ/kg. Two of the six

Jatta
UNU-Fisheries Training Programme 8
prepared diets (HPFM and HPRM) contain 35% crude protein and 8.94 and 11.7% crude lipid
respectively; another two diets (MPFM and MPRM) have 27.5% crude protein and 8.4 and
10.56% crude lipid respectively; and the last two diets (LPFM and LPRM) contain 20% crude
protein and 7.7% crude lipid. The crude protein and lipid levels of the seventh diet (PPBD)
were 34 and 25% respectively with GE of 21,861 MJ/kg. The ingredients were ground,
thoroughly mixed, then oil and water or water was added to form moist dough then the dough
was prepared into feed –through small extrude machine, grounded and sieved to form
appropriate particle size for the fish. Feed formulations are outlined in Table 2.
Figure 2. Flow chart of experimental design and diets

Jatta
UNU-Fisheries Training Programme 9
Table 2. Formulations and proximate composition of experimental diets (as fed basis).
Ingredient (%) HPFM HPRM MPFM MPRM LPFM LPRM PPBD
Wheat bran 9,523 8,457 1,965
Wheat 55,385 8 67,469 21,931 79,958 61,638 8
Rapeseed meal DK 63,182 63,159 29,633 11,544
Premix Laxa 1 1 1 1 1 1 1
NSM Meal 706/105 39,769 18,296 27,006 5,453 14,172 3,966
Fish oil 22,464
Vegetable oil 3,846 4,525 4,87 1,798
Soya 47/5 Brasil 45,028
Wheatgluten mealG 10,62
Monoca-Phosphate 1,29
Carophyl Red 10% 0,027
Carophyl Pink 10% 0,027
Total 100 100 100 100 100 100 100
Proximate composition (%)
Crude protein 33,8 33,7 26,4 27,2 19,1 19,6 39,3
Crude lipid 7,59 11,15 6,3 10,33 6,17 6,81 24,17
Moisture 10,28 8,35 13,17 7,47 14,97 11,21 6,62
Ash 8,05 8,25 5,77 6,3 5,61 3,85 4,7
GE(MJ/kg) 16,8 16,8 16,8 16,8 16,719 16,8 21,861
Estimated raw material price, and contents of crude protein, crude fat, crude ash and moisture
of the experimental diets are shown in table 3. Estimated amino acid contents in the
experimental diets (g/kg) are shown in Table 4. Estimated percent contents of amino acid in the
diets express in percentage of dietary protein and requirement values of tilapia by Santiago and
Lovell, 1988 are shown in Table 5.
Table 3. Estimated raw material price and content of crude protein, crude fat, crude ash and
moisture of the experimental diets.
Parameter HPFM HPRM MPFM MPRM LPFM LPRM PPBD
Price/kg diet (Ikr) 146,95 95,02 121,99 69,01 96,17 70,15 147,58
Crude Protein (%) 35 35 27,5 27,5 20 20 34
Crude Fat (%) 8,94 11,7 8,4 10,56 7,7 7,7 25
Crude Ash (%) 8,17 7,48 6,32 5,63 4,46 4,15 5,67
Moisture (%) 10,14 9,58 11,11 10,68 12,12 12,12 8,1
Dry matter% 89,86 90,42 88,89 89,32 87,88 87,88 91,9
%Carbohydrates including fibers 37,75 36,24 46,67 45,63 55,72 56,03 27,23
Calculated brutto energy (MJ/kg) 18,3 19,2 17,9 18,6 17,4 17,5 22,6
Jatta
UNU-Fisheries Training Programme 10
Table 4. Estimated amino acid content in the experimental diets (g/kg)
HPFM HPRM MPFM MPRM LPFM LPRM PPBD
Lysine 20,72 18,97 15,06 13,28 9,37 8,52 16
Arginine 19,12 24,9 14,72 19,92 10,31 11,66 25,24
Histidine 8,04 12,81 6,32 10,81 4,61 6,19 7,59
Threonine 12,86 19,41 9,84 16,05 6,81 9,11 12,25
Valine 16,07 23,38 12,67 19,53 9,28 11,65 14,03
Leucine 23,68 28,65 18,74 23,54 13,8 15,74 22,4
Isoleucine 13,63 18,92 10,78 15,69 7,93 9,52 12,76
Methionine 8,07 7,37 6,05 5,35 4,02 3,69 4,92
Cystine 3,83 6,14 3,43 5,77 3,05 4,17 5,93
Phenylalanine 13,91 19,18 11,32 16,22 8,75 10,31 14,07
Tyrosine 10,36 10,89 8,32 8,43 6,28 5,55 8,39
Tryptophan 3,61 11,84 2,96 10,73 2,31 5,1 10,21
Met + Cyst 11,9 13,61 9,48 11,2 7,07 7,88 10,86
Table 5. Estimated % content of amino acid in the diets express in % dietary protein and
requirement values of tilapia by Santiago and Lovell, 1988.
HPFM HPRM MPFM MPRM LPFM LPRM PPBD 1988a
Lysine 5,92 5,42 5,48 4,83 4,69 4,26 4,71 5,12
Arginine 5,46 7,11 5,35 7,24 5,15 5,83 7,42 4,2
Histidine 2,3 3,66 2,3 3,93 2,31 3,09 2,23 1,72
Threonine 3,67 5,54 3,58 5,84 3,41 4,56 3,6 3,75
Valine 4,59 6,68 4,61 7,1 4,64 5,82 4,13 2,8
Leucine 6,77 8,19 6,81 8,56 6,9 7,87 6,59 3,39
Isoleucine 3,9 5,41 3,92 5,71 3,97 4,76 3,75 3,11
Methionine 2,31 2,11 2,2 1,94 2,01 1,85 1,45
Cystine 1,09 1,75 1,25 2,1 1,52 2,08 1,75 0,54
Phenylalanine 3,97 5,48 4,12 5,9 4,37 5,16 4,14
Tyrosine 2,96 3,11 3,02 3,07 3,14 2,77 2,47 1,79
Tryptophan 1,03 3,38 1,08 3,9 1,16 2,55 3 1
MET + CYS 3,4 3,89 3,45 4,07 3,54 3,94 3,19 3,22
PHE + TYR 6,93 8,59 7,14 8,96 7,51 7,93 6,61 5,54
3.2 Growth trial
Mixed sex Nile tilapia O.niloticus fingerings were used in the feeding trial. At the initiation of
the experiment, individual weight and length of a random pool of fishes was measured for
estimation of initial weight. The acclimatized fish were randomly distributed in 21 bucket
containers of 17 L water capacity each at a stocking density of 50 fish per tank. Water
temperature was controlled at 28-29 0C. Fish were fed by automatic feeder. The automatic
feeder was set such that every 10 minutes, it drops feed for 25 seconds. Occasionally, fish were
fed by hand if need be. Fish were pooled weighed every 3 weeks to determine the growth rate
of the fish. At the end of the trial all fishes were individually measured for length and weight.

Jatta
UNU-Fisheries Training Programme 11
3.3 Sampling
At the end of the experiment, all the fish were counted, the weight and the body length of each
fish were taken for determination of mean weight (MWT), percentage weight gain (WG (%)),
specific growth rate (SGR), percentage feed efficiency (FE (%)), feed conversion ratio (FCR)
and survival.
3.4 Calculations of parameters
The following formulae were used for calculations:
Percentage weight gain (WG (%)) = 100 × (final mean weight – initial mean weight)/ initial
mean weight.
Specific growth rate (SGR) =100 (ln (final mean weight) – ln (initial mean weight))/ number
of days.
Percentage feed efficiency (FE (%)) = 100 × (wet weight gain of fish (g)) / dry weight of feed
given (g).
Feed conversion ratio (FCR) = total dry feed fed (g) / total wet weight gain (g)
3.5 Analysis of the diets
In order to determine the proximate composition of feeds, they were finely ground into powder,
and then analyzed. Crude protein (total Nitrogen x 6.25) was determined by the use of micro-
Kjeldahl method. The sample was digested in sulphuric acid in the presence of CuSO4 as
catalyst. Thereafter, the sample was placed in distillation unit, 2400 Kjeltec Auto Sampler
System. The acid solution was made alkaline by using of NaOH solution. The ammonia was
distilled into boric acid which is then titrated with H2SO4. The nitrogen content was multiplied
by factor 6.25 to obtain % crude protein. Crude fat was extracted by Soxhlet method. The
sample was extracted with petroleum ether, boiling range 40-60 oC. The extraction apparatus
was Soxtec Avanti Automatic System. Ash was determined by incineration of samples in muffle
furnace at 550 oC for 4 h and the residue weighed. Moisture was calculated from the weight
difference after oven drying the samples at 105 oC for 4 h. Percentage of moisture corresponds
to the weight loss.
3.6 Analysis of the body composition
The determination of fat, moisture, and protein in fish were done by using the FOSS FoodScan
Near-Infrared Spectrophotometer with FOSS Artificial Neural Network Calibration Model
(FOSS, Hillerod, Denmark). Approximately 50 g ground sample was placed in a 90 mm round
sample dish, and the dish was placed in the FoodScan. Results were displayed for percent (g/100
g) fat, moisture and protein.
3.7 Statistical analysis
All statistical analyses were performed with SPSS version 18 (SPSS, Chicago, IL, USA).
Biometric data amongst fish groups reared on different diets were compared using two way
Jatta
UNU-Fisheries Training Programme 12
analysis of variance (ANOVA); after ascertaining the assumptions of normality and equal
variance. In case of significant differences amongst group, means were compared using
Bonferroni technique at P-values ≤ 0.05.
4 RESULTS
4.1 Water quality parameters
The experiment was conducted at ambient temperature for tilapia and was subjected to
continuous 24h light (24L: 0D). Dissolved oxygen concentration was measured daily in each
bucket. The water temperature was also measured daily in the total system. The mean
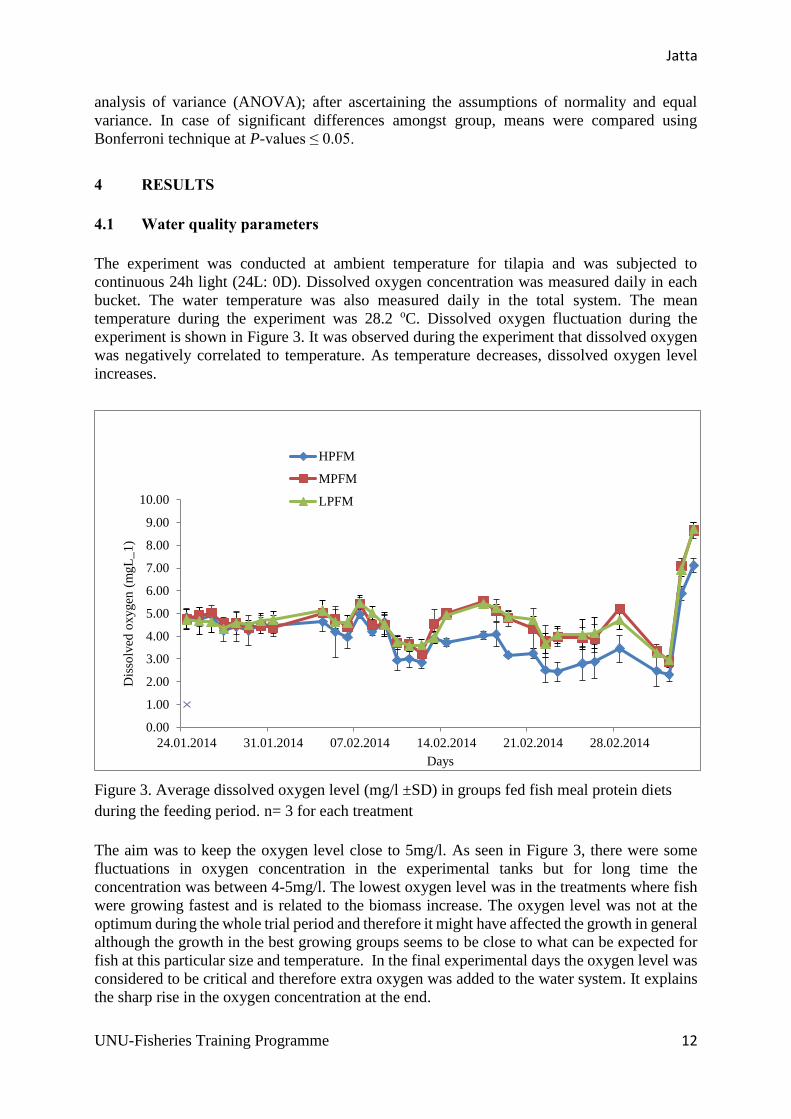
temperature during the experiment was 28.2 oC. Dissolved oxygen fluctuation during the
experiment is shown in Figure 3. It was observed during the experiment that dissolved oxygen
was negatively correlated to temperature. As temperature decreases, dissolved oxygen level
increases.
Figure 3. Average dissolved oxygen level (mg/l ±SD) in groups fed fish meal protein diets
during the feeding period. n= 3 for each treatment
The aim was to keep the oxygen level close to 5mg/l. As seen in Figure 3, there were some
fluctuations in oxygen concentration in the experimental tanks but for long time the
concentration was between 4-5mg/l. The lowest oxygen level was in the treatments where fish
were growing fastest and is related to the biomass increase. The oxygen level was not at the
optimum during the whole trial period and therefore it might have affected the growth in general
although the growth in the best growing groups seems to be close to what can be expected for
fish at this particular size and temperature. In the final experimental days the oxygen level was
considered to be critical and therefore extra oxygen was added to the water system. It explains
the sharp rise in the oxygen concentration at the end.
24.01.2014 31.01.2014 07.02.2014 14.02.2014 21.02.2014 28.02.2014
0.00
1.00
2.00
3.00
4.00
5.00
6.00
7.00
8.00
9.00
10.00
Days
Dis
solv
ed o
xygen
(m
gL
_1
)
HPFM
MPFM
LPFM

Jatta
UNU-Fisheries Training Programme 13
The water temperature was in the range of 26-29°C, and rather stable, close to 28°C most of
the period as illustrated in Figure 4. The fluctuations did not have any detected effect on the
feed intake of the fish. It was noticed that biomass increase has no effect on temperature
fluctuation.
Figure 4. Temperature (°C) in the experimental tanks during the trial period.
4.2 Growth and Survival
In this experiment, no pathological signs and symptoms were observed throughout the study
which shows that both the diets and the culture environment were conducive to the fish. The
survival ranged from 89-100%.
The effects of crude protein source and level on growth and feed utilisation parameters at the
end of 3 weeks are shown in Table 6. From the results, it was noticed that the higher the dietary
protein level the better the WG %, SGR, FE and FCR. It was also observed from the results that
fish performance was significantly higher on fishmeal based diets compared to fishmeal plus
rapeseed meal diets.
The ranking of the treatments based on the growth performances and feed utilisation at the end
of the experiment is shown in Table 7. Although the prepared diets were formulated to be
isoenergetic, the calculated gross energy values were different. HPFM gained the highest mean
weight (MWT), percentage weight gain (WG (%)), specific growth rate (SGR), percentage feed
efficiency (FE (%)) and the best feed conversion ratio (FCR) followed by MPFM, then HPRM.
There were no significant differences between MPFM and LPFM in these parameters. PPBD
gained the lowest values of MWT, WG (%), SGR and FE (%) but there were no significant
differences between this diet and LPRM.
The effect of fishmeal as crude protein source at different protein levels on growth and feed
utilisation at the end of experiment is shown in Table 8. From the results, it was observed that
25
26
27
28
29
30
31
32
23.01.2014 30.01.2014 06.02.2014 13.02.2014 20.02.2014 27.02.2014 06.03.2014
Tem
per
atu
re (
°C)
date

Jatta
UNU-Fisheries Training Programme 14
when fishmeal was used as the main dietary protein source, fish fed on HPFM diet (35% CP)
obtained the best MWT, WG (%), SGR, FE (%) and FCR followed by MPFM diet (27.5% CP)
and then LPFM diet (20% CP).
The effect of fishmeal plus rapeseed meal as crude protein sources at different protein levels on
growth and feed utilisation at the end of the experiment is shown in Table 9. It was observed
that when fishmeal and rapeseed meal (plant protein) were used as protein sources, fish fed on
HPRM diet (35% CP) obtained the highest MWT, WG (%), SGR, FE (%) and the best FCR
followed by MPRM diet (27.5% CP) then LPRM diet (20% CP).
The effect of crude protein sources at the same protein level at the end of the trial on growth
and feed utilisation is shown in Table 10. It was observed from the results that at the same
protein level, fish fed fishmeal based diet performed significantly better than those fed fishmeal
plus rapeseed meal based diet.
Changes in total body weight (g) of Nile tilapia fingerlings fed different experimental diets is
shown in. figure 5 Although at the initiation of the experiment there were no significant
differences among the treatment groups however, at the end of the trial there were significantly
differences among the treatment groups.
Figure 5. Changes in total body weight (g) of Nile tilapia fingerlings fed different experimental
diets
The effects of protein level and source and their interaction on final average weight is shown in
fig. 6. It was observed that both crude protein level and crude protein source have significant
effects on final average weight and there was significant interaction between the two. It was
noticed that as protein level increases, the interaction also increases. It was also observed that
when high quality (FM) protein source was used, final average weight increases.
0 21 42
0
500
1000
1500
2000
2500
3000
Days
Bo
dy
wei
ght
HPFM
HPRM
MPFM
MPRM
LPFM
LPRM
PPBD

Jatta
UNU-Fisheries Training Programme 15
a
Crude protein level
18 20 22 24 26 28 30 32 34 36
Fin
al a
ve
rag
e w
eig
ht
(g)
4
6
8
10
12
14
16
18
FM
FM+RM b
c
f
e
d
Figure 6. Effects of dietary protein level and source and their interaction on final average weight
of Nile tilapia fingerlings (Values are mean of the triplicate ±SD)
The effects of protein level and source on other growth parameters (SGR & WG (%)) and their
interaction are shown in Figures 7 and 8. The effects of crude protein level and source and their
interaction followed the trend observed on final average weight.
a
Crude protein level (%)
18 20 22 24 26 28 30 32 34 36
SG
R (
%)
1.0
1.5
2.0
2.5
3.0
3.5
4.0
4.5
FM
FM+RM
b
c
d
e
f
Figure 7. Effects of dietary protein level and source and their interaction on specific growth rate
(SGR) of Nile tilapia fingerlings (Values are mean of the triplicate ±SD)

Jatta
UNU-Fisheries Training Programme 16
a
Crude protein level (%)
18 20 22 24 26 28 30 32 34 36
WG
(%
)
0
100
200
300
400
500
FM
FM+RM
f
b
ec
d
Figure 8. Effects of dietary protein level and source and their interaction on percentage weight
gain (WG (%)) of Nile tilapia fingerlings (Values are mean of the triplicate ±SD)
The effects of protein level and source on feed utilisation parameters (FE (%) & FCR) and their
interaction are shown in fig. 9-10. It was observed that both protein level and source have
significant effects on these parameters. As protein level increases, FE (%) increases but FCR
decreases. When high quality source (FM) was used, FE (%) increases and FCR decreases.
When the blend protein source (FM plus RSM), FE (%) decreases and FCR increases.
c
Crude protein level (%)
18 20 22 24 26 28 30 32 34 36
FE
(%
)
0
10
20
30
40
50
60
70
80
FM
FM+RM
a
b
f
e d
Figure 9.Effects of dietary protein level and source and their interaction on percentage feed
efficiency (FE (%)) of Nile tilapia fingerlings (Values are mean of the triplicate ±SD)

Jatta
UNU-Fisheries Training Programme 17
a
Crude protein level (%)
18 20 22 24 26 28 30 32 34 36
FC
R
1
2
3
4
5
6
7
8
9
FM
FM+RM
b
c
d
e
Figure 10. Effects of dietary protein level and source and their interaction on feed conversion
ratio (FCR) of Nile tilapia fingerlings (Values are mean of the triplicate ±SD)
4.3 Body Composition
The result of the body composition is shown in Table 6. Fish fed diet PPBD gained the highest
protein in the body and was significantly different from the initial, followed by diets MPRM,
LPRM and MPFM which were not significantly different from the initial. There were no
significant difference between diets HPRM and LPFM and there were no significant difference
also between LPFM and HPFM. All treatments significantly increased in fat compared to initial
sample. Fish fed diet PPBD gained the highest body fat followed by those fed on diet LPFM
which was not significantly different from MPRM and MPRM was not also significantly
different from LPRM and MPFM. Among the treatments, HPFM gained the lowest body fat.
The initial sample obtained the highest moisture in the body which was significantly different
from all the treatment groups. MPRM that followed was not significantly different from PPBD.
Diets HPRM and HPFM that followed were not significantly different from each other. Fish
fed on diet LPFM gained the lowest body moisture. LPFM gained the highest body salt and was
significantly different from the rest of the treatments and the initial sample, followed by MPFM
and then MPRM but MPRM was not significantly different from HPRM and HPFM. PPBD
gained the lowest body salt but was not significantly from the initial and LPRM. A full
breakdown of growth performance and feed utilization parameters observed for the different
feed types is in the appendix.

Jatta
UNU-Fisheries Training Programme 18
Table 6 : Body composition parameters of Nile tilapia fingerlings before and feeding on
different experimental diets. (N=4).
Diet Parameter
Protein Fat Moisture Salt
Initial 13.70 ± 0.1c 11.64 ± 0.1f 72.14 ± 0.1a 0.58 ± 0.20ef
HPFM 13.41 ± 0.0e 15.66 ± 0.1d 69.79 ± 0.1c 0.65 ± 0.08cde
HPRM 13.55 ± 0.0d 15.10 ± 0.1e 69.97 ± 0.1c 0.68 ± 0.07cd
MPFM 13.68± 0.0c 16.44 ± 0.1c 69.43 ± 0.1d 0.82 ± 0.05b
MPRM 13.79 ± 0.1c 16.54 ± 0.0bc 70.95 ± 0.0b 0.69 ± 0.04c
LPFM 13.43 ± 0.0de 16.82 ± 0.2b 68.35 ± 0.0e 1.05 ± 0.03a
LPRM 13.74 ± 0.1c 16.47 ± 0.1c 69.23 ± 0.1d 0.56 ± 0.05ef
PPBD 13.95± 0.0a 17.17 ± 0.1a 70.89 ± 0.1b 0.53 ± 0.06f
Values are means of the triplicates ± SD; values within the same column without a common
superscript are significantly different (p <0.05).
4.4 Effect of production cost
The effect of feed cost and the growth response on estimated production cost of one kilo fish is
shown in Table 12. The feed cost is similar for the high protein diets although the raw material
price is very different. This is due to much higher FCR in the plant protein diets in general. The
cost is also similar for the medium protein fish meal group, actually the price is lowest in that
group. The plant protein based diet (PPBD) gives double feed cost related to the best three
groups. That is due to very poor feed efficiency although it contain only plant protein sources,
the increased volume of fish oil is raising the feed price.
Table 7. Cost of production of a kilo of fish per diet in Icelandic Kroner (ISK)
Diet HPFM HPRM MPFM MPRM LPFM LPRM PPBD
Raw material price/kg diet (ISK) 146,95 95,02 121,99 69,01 96,17 70,15 147,58
FCR 1,52 2,34 1,79 3,81 4,51 7,86 7,68
Feed cost per kg fish gain 223 222 218 263 434 551 1133
Relative % feed cost/kg fish gain 100 99,5% 98,2% 120,4% 165,0% 127,1% 205,6%
Jatta
UNU-Fisheries Training Programme 19
5 DISCUSSION
Tilapia, like other fish, have dietary protein requirement for optimal growth and growth is
negatively affected when fed diets above or below their protein requirement. With regards to
the protein level, generally growth increases as the level increases up to a point where increase
of protein level does not have any positive effect on growth (Twibell and Brown, 1998;
Bahnasawy, 2009). In case of protein source (quality), growth is usually high when high quality
source like fishmeal is used but on the other hand when low quality source such as plant protein
is used, the reverse occurs (Furuya, Pezzato et al., 2004b). This experiment was set up to
investigate the effects of substituting fishmeal with rapeseed meal (plant protein) at different
protein levels on growth, feed utilisation and body composition of Nile tilapia fingerlings. The
results showed that both protein source and protein level have significant effects on growth and
feed utilisation of tilapia fingerlings but protein source has more effect compared to level at this
size.
When fishmeal was used as the primary protein source, mean weight, percentage weight gain
and specific growth rate increased as protein level increases from low (20% CP) to high (35%
CP) and there were significant differences among the diets (HPFM, MPFM and LPFM). This
indicates that 20-27.5% dietary crude protein level is below the requirement of 3 g Nile tilapia
fingerlings even when fishmeal is used as protein source. The effectiveness of fishmeal seems
to be low at low protein diet which could be due to lysine deficiency. The significant high
performance of fish fed on 35% CP diet in this trial implies that the optimal protein level in the
diet of Nile tilapia at this size should be higher than 27.5%. This is in line with the results of
Abdel-Tawwab et al. (2010), who found protein requirement for Nile tilapia fingerlings and
advance juvenile (~20 and 40 g) to be 35%; De-Silva et al. (1989), who obtained maximum
growth from dietary protein levels 34-36%; Winfree and Stickney (1981), who reported that
2.5-7.5 g Nile tilapia require 34% dietary protein for maximum growth performance;
Bahnasawy (2009), who recommended 30% CP; Hafedh (1999) who reported 40% CP for
juvenile Nile tilapia (40 g); Abdel-Tawwab (2012) also indicated that growth of Nile tilapia
was improved significantly by increasing the dietary protein level from 35 to 45%. The results
of this study are inconsistent with the results of Li et al. (2013), who reported that 25% protein
level met the requirement of 7.44 g Nile tilapia. The culturing condition, the origin of fish and
several water and culturing or management parameters must been taken into consideration when
comparing research trials investigating optimal protein requirement. It must be noted that fish
in trials in hapas or ponds can have access to some planktonic feed, providing them with some
of their nutritional needs.
Percentage feed efficiency follows the trend of MWT, WG (%) and SGR as it increased as the
dietary protein level increases from low to high. The feed conversion ratio, decreased as protein
level increased, but there was no significant difference between high (35% CP) and medium
(27.5% CP) protein levels but the two diets (HPFM and MPFM) were significantly different
from LPFM diet (20% CP) in FCR. This is in line with the results of other authors on tilapia
growth (Bahnasawy, 2009; Al-Hafedh, 1999).
In this experiment, the substitution of fishmeal with rapeseed meal was 54% in HPRM diet
(35% CP), 80% in MPRM diet (27.5% CP) and 72% in LPRM diet (20% CP) and there was no
addition of crystalline amino acids or dicalciumphosphate. Plant protein based diet (34% CP),
which did not contain any fishmeal, was supplemented with monocalciumphosphate but not
crystalline amino acids. The results revealed that growth and feed utilisation were significantly
affected when plant protein based diet (PPBD) or fishmeal substituted diets (HPRM, MPRM

Jatta
UNU-Fisheries Training Programme 20
and LPRM) were used which could be attributed to high inclusion levels of plant protein. This
is in agreement with the results of Soltan et al. (2008), who found that growth and feed
utilisation were significantly affected when fishmeal replacement with plant protein mixture
was more than 45%; Zhou and Yue (2010), who indicated that canola meal can be incorporated
in the diet of hybrid tilapia up to 19.02%, which can replace only 30% protein of soybean meal
without significant negative effects on growth performance and feed utilisation; Koumi et al.
(2009), who also reported that incorporation of 50 and 100% plant protein (soya protein) in diet
of O. niloticus decreased the growth. Davies et al. (1990), also found indications that practical
inclusion limit around 15% in substituting fish meal with rapeseed meal.
Another possible factor for poor performance of fish fed fishmeal substituted diets and plant
based diet could be linked to the size of the fish (3.1 g) used in this experiment. There is
evidence that fry and small fingerlings of tilapia need high quality protein source like fishmeal
in their diets and as they grow bigger, they gradually accept or feed on plant materials. For
instance, Twibell and Brown (1998) obtained good growth when tilapia were fed an all-plant
diet at the size of 21 g; Luo et al. (2012), also reported that 75% replacement of fishmeal with
canola meal (plant protein of same origin as rape seed meal) did not significantly reduce growth
performance of GIFT strain of Nile tilapia at the size of 20 g.
Although tilapias are known for their efficient dietary lipid utilisation, they cannot tolerate high
dietary lipid levels. The unexpected poor performances of HPRM and PPBD with protein levels
of 35 and 34% and lipid levels of 11.70 and 25% respectively could be attributed to the dietary
lipid content. Many authors reported growth retardation when tilapia were fed with diets in
which lipid levels were above 10%. Han et al. (2011), reported better growth of hybrid tilapia
fed on 5.5 and 8.5% lipid diets compared to those fed 11.5% lipid diet; Wille et al. (2002),
reported 17% lipid level as too high for tilapia. Therefore, the poor performances of fish fed
diets high in lipid particularly diet which has 25% lipid in this study is in line with the findings
of the previous authors.
In this study, rapeseed meal substituted diets were not supplemented with either
dicalciumphosphate or crystalline amino acids and PPBD diet was only supplemented with
monocalciumphosphate. It was observed from the results that at the same protein level, fish fed
fishmeal based diets performed better than those fed diets in which fishmeal was substituted
with rapeseed meal or plant based diet. This concurs with the results of Furuyata et al. (2004b),
who found that when soybean meal based diet was not supplemented with dicalciumphosphate
and some essential amino acids or supplemented with only dicalciumphosphate or some
essential amino acids, the growth of fish was inferior to fishmeal control diet. In addition to
that, tilapia like other fish also require the 10 essential amino acids in their diets and deficiency
of any one of them can affect the performance of fish. Lysine content in diets MPRM, LPFM,
LPRM and PPBD is below the requirement of tilapia so the poor performances of fish fed on
these diets could be attributed to lysine deficiency.
Plant protein based diets and fishmeal plus rapeseed meal diets have high fibre or carbohydrate
content which can affect digestibility of the feed and poor digestibility can lead to poor
performance of fish. Anti nutritional factors found in plant ingredients (rapeseed meal and
soybean meal) are known to affect palatability of feed and once the palatability is affected, feed
consumption could be reduced and consequently growth is compromised.
The proximate analyses results of this study indicated that there were significant differences in
whole body protein, fat and moisture and salt contents. Body composition analyses revealed

Jatta
UNU-Fisheries Training Programme 21
that protien, fat and moisture contents of the initial fish used in this research were 13.70%,
11.64% and 72.14% respectively. After feeding on the diets for 6 weeks, protein and fat
contents of those fed on PPBD diet increased while their moisture contents decreased. The high
fat content of fish fed on plant protein based diet is in agreement with the results of Koumi et
al. (2009), where fish fed plant protein based diets obtained high fat compared to those fed
fishmeal based diet. Fish fed on LPFM diet increased in body fat but decreased in body protien
and moisture. Fish fed on MPFM and MPRM diets maintained their body protein contents,
increased in fat contents and decreased in moisture content. The protein content of fish fed with
HPFM and HPRM diets were decreased, fat content increased and moisture contents decreased
compared to the initial fish.
The feed cost as an effect on production of one kilo fish in the HPFM, HPRM and MPFM
groups are similar. The feed cost in the other groups is higher, and this does not reflect the total
production cost because the growth rate or the growth responce in this groups are quite different.
This can affect the production time and other cost parameters. Therfore the MPFM- diet or the
HPRM-diet are not recommended for tilapia fingerlings of this size.
6 CONCLUSIONS AND RECOMMENDATIONS
In this research, the best growth and feed utilisation performances were obtained by fish fed
high protein fishmeal diet while the lowest performances were observed in those fed plant
protein based diet and low protein fishmeal plus rapeseed meal diet. The results clearly
indicated that both protein source and level have significant influence on the analysed
parameters but protein source seems to be more important to the cultured fish compared to
protein level at this size. It can be concluded with certainty that even the lowest replacement
level of fishmeal with rapeseed meal in this experiment was too high for 3 g Nile tilapia since
growth and feed utilisation parameters were significantly affected with the substitution. From
the results, it seems that dissolved oxygen consumption increased as biomass increases. All the
experimental diets significantly increased the fat content of the fish. Other body composition
parameters (protein, moisture and salt) were either increased, maintained or decreased
compared to initial composition after feeding on the diets but no clear pattern was observed.
The author would like to recommend the use of quality protein diets for small fingerlings up to
certain size then thereafter, progressive substitution of fishmeal with plant protein or other
alternatives. Further research for longer period is also recommended in order to find out whether
there will be some improvement.
Jatta
UNU-Fisheries Training Programme 22
ACKNOWLEDGEMENTS
I am grateful to my sponsor, United Nation University Fisheries Training Programme for
providing me the Fellowship. I would like to express my sincere thanks to my able supervisor,
Dr. Olafur Sigurgeirsson for the support he has been rendering to me since I arrived at Holar.
The knowledge gained will go a long way in shaping my life and helping me to achieve my
aspirations. I would also like to sincerely thank the programme Leader: Dr. Helgi Thorarensen
for his visionary guidance, suggestions and encouragement.
Special thanks go to the following institutions: Marine Research Institute, Holar University
College, Fisheries Department of The Gambia and all other Institutions at VERID. I cannot
forget to thank my colleague UNU-FTP Fellows for their unflinching support without which
this work might not have been accomplished as expected.
Last but not the least, I would like to thank my loving wife, Jainaba K. Bojang and our children
Abubacarr Jatta and Isha Jatta who normally consoled me when needed. I acknowledge my
brothers and sisters, friends for their moral support.

Jatta
UNU-Fisheries Training Programme 23
REFERENCES
Abdel-Tawwab, M. (2012). Interactive effects of dietary protein and live bakery yeast,
Saccharomyces cerevisiae on growth performance of Nile tilapia, Oreochromis
niloticus (L.) fry and their challenge against Aeromonas hydrophila infection.
Aquacult Int, 20, 317-331.
Abdel-Tawwab, M., & Ahmad,, M. H. (2009). Effect of dietary protein regime during the
growing period on growth performance, feed utilization and whole-body chemical
composition of Nile Tilapia, Oreochromis niloticus (L.). Aquaculture Research, 40,
1532-1537.
Abdel-Tawwab, M., Ahmad,, M. H., Khattab,, Y. A., & Shalaby,, A. M. (2010). Effect of
dietary protein level, initial body weight, and their interaction on the growth, feed
utilization, and physiological alterations of Nile tilapia, Oreochromis niloticus (L.).
Aquaculture, 298, 267-274.
Ahamed, M. (2012). Sustainable Aquaculture Systems Project Closing Report 2011. Banjul:
DOF.
Al-Hafedh, Y. (1999). Effects of dietary protein on growth and body composition of Nile
tilapia, Oreochromis niloticus L. Aquaculture Research, 30, 385-393.
Bahnasawy, M. (2009). Effect of Dietary Protein Levels on Growth Performance and Body
Composition of Monosex Nile Tilapia, Oreochromis niloticus L. Reared in Fertilized
Tanks. Pakistan Journal of Nutrition, 8((5)), 674-678.
Chou, B., & Shiau,, S. Y. (1996). Optimal dietary lipid level for growth of juvenile hybrid
tilapia, Oreochromis niloticus X Oreochromis aureus. Aquaculture, 143, 185-195.
Davies, S., McConnell,, S., & Bateson,, R. I. (1990). Potential of rapeseed meal as an
alternave protein source in complete diets for tilapia (Oreochromis mossambicus
Prters). Aquaculture, 87(2), 145-154.
De-Silva, S., Gunasekera, ,. R., & Atapattu, ,. D. (1989). The dietary protein requirements of
young tilapia and an evaluation of least cost dietary protein level. Aquaculture, 3, 271-
281.
DOF. (2011). Gambia Fisheries Strategic Action Plan 2012-2015. Banjul: DOF.
Drew, M., Oqunkoya,, A. E., Janz,, D. M., & Van Kessel,, A. G. (2007). Dietary influence of
replacing fishmeal and oil with canola protein concentrate and vegetable olis on

Jatta
UNU-Fisheries Training Programme 24
growth performance, fatty acid composition and organochlorine residues in rainbow
trout (Oncorhynchus mykiss). Aquaculture, 267, 260-268.
El-Saidy, D., & Gaber,, M. M. (2005). Effect of dietary protein levels and feeding rates on
growth performance, production traits and body composition of Nile tilapia,
Oreochromis niloticus (L.) cultured in concrete tanks. Aquaculture Research, 36, 163-
171.
El-Sayed, A., & Teshima,, S. (1992). Protein and energy requirements of Nile Tilapia,
Oreochromis niloticus, fry. Aquaculture, 103, 55-63.
El-Sayed, A.-F. M. (1998). Total replacement of fish meal with animal protein sources in Nile
tilapia, Oreochromis niloticus (L), feeds. Aquaculture Research, 29, 275-280.
El-Sayed, A.-F., Mansour,, C. R., & Ezzat,, A. A. (2003). Effects of dietary protein level on
spawning performance of Nile tilapia (Oreochromis niloticus) broodstock reared at
different water salinities. Aquaculture, 220, 619-632.
FAO. (2013). Global Aquaculture Production Statistics for the year 2011. FAO, Fisheries and
Aquaculture Department.
Furuya, W., Botaro,, D., Neves,, P. R., Silva,, C. R., & Hayashi,, C. (2004a). Lysine
requirement of Nile tilapia, (Oreochromis niloticus), for grow-out phase. Cienc. Rural,
34, 1571-1577.
Furuya, W., dos Santos,, V. G., Silva,, L. C., Furuya,, V. R., & Sakaguti,, E. S. (2006).
Digestible lysine requirements of Nile tilapia juveniles. Rev. Bras. Zootecn., 35, 937-
942.
Furuya, W., Hayashi,, C., Furuya,, V. R., Botaro,, D., da Silva,, L. C., & Neves,, P. R. (2001).
Exigencias de metionina + cistina paraalevinos revertidos de tilapia do Nilo
(Oreochromis niloticus), baseadasno conceito de proteina ideal. Maringa, 23, 885-889.
Furuya, W., Pezzato, ,. L., Barros, ,. M., Pezzato, ,. A., & Furuya, ,. V. (2004b). Use of ideal
protein concept for precision formulation of amino acid levels in fish-meal-free diets
for juvenile Nile tilapia (Oreochromis niloticus L.). Aquaculture Research, 35, 1110-
1116.
Gunasekera, R., Shim,, K. F., & Lam,, T. J. (1996a). Effect of dietary protein level on
spawning performance and amino acid composition of eggs of Nile tilapia,
Oreochromis nilo ticus. Aquaculture, 146, 121-134.

Jatta
UNU-Fisheries Training Programme 25
Gunasekera, R., Shim,, K. F., & Lam,, T. J. (1996b). Influence of protein content of
broodstock diets on larval quality and performance in Nile tilapia, Oreochromis
niloticus ( L.). Aquaculture, 146, 245-259.
Han, C.-Y., Wen,, X.-B., Zheng,, Q.-M., & Li,, H.-B. (2011). Effects of dietary lipid levels on
lipid deposition and activities of lipid metabolic enzymes in hybrid tilapia
(Oreochromis niloticus · O. aureus). Journal of Animal Physiology and Animal
Nutrition, 95, 609-615.
Jackson, A., & Capper,, B. S. (1982). Investigations into the requirements of the tilapia
Sarotherodon mossambicus for dietary methionine, lysine and arginine in semi-
synthetic diets. Aquaculture, 29, 289-297.
Koumi, A., Atse,, B. C., & Kouame,, L. P. (2009). Utilization of soya protein as an alternative
protein source in Oreochromis niloticus diet: Growth performance, feed utilization,
proximate composition and organoleptic characteristics. African Journal of
Biotechnology, 8, 091-097.
Larumbe-Moran, E., Hernandez-Vergara, ,. M., Olvera-Novoa, ,. M., & Rostro, ,. C. (2010).
Protein requirements of Nile tilapia (Oreochromis niloticus) fry cultured at different
salinities. Aquaculture research, 41, 1150-1157.
Li, Y., Bordinhon,, A. M., Davis,, D. A., Zhang,, W., & Zhu,, X. (2013). Protein: energy ratio
in practical diets for Nile tilapia Oreochromis niloticus. Aquacult Int, 21, 1109-1119.
Lim, C., & Webster,, C. D. (2006). Nutr. Req. In: Lim,C., Webster, C.D., Tilapia: biology,
culture and nutrition. NY, LD and OX: The Haworth Press.
Lim, C., Garcia, J. C., Yildirim-Aksoy, M., Klesius, P. H., Shoemaker, C. A., & Evans, J. J.
(2007). Growth response and resistance to Streptococcus iniae of Nile tilapia,
Oreochromis niloticus, fed diets containing distiller's dried grains with solubles.
Journal of the World Aquaculture Society, 38, 231–237.
Luo, Z., Liu, ,. C.-X., & Wen, ,. H. (2012). Effect of Dietary Fish Meal Replacement by
Canola Meal on Growth Performance and Hepatic Intermediary Metabolism of
Genetically Improved Farmed Tilapia Strain of Nile Tilapia,Oreochromis niloticus,
Reared in Fresh Water. Jounal of the World Aquaculture Society, 43, 670-678.
Luquet, P. (1989). Practical considerations on the protein nutrition and feeding of tilapia.
Aquat. Licing Resour., 2, 99-104.

Jatta
UNU-Fisheries Training Programme 26
Nguyen, T. N., & Davis,, D. A. (2009a). Methionine Requirement in Practical Diets of
Juvenile Nile Tilapia, Oreochromis niloticus. JOURNAL OF THE WORLD
AQUACULTURE SOCIETY, 40, 410-415.
Nguyen, T. N., & Davis,, D. A. (2009b). Re-evaluation of total sulphur amino acid
requirement and determination of replacement value of cystine for methionine in
semi-purified diets of juvenile Nile tilapia, Oreochromis niloticus. Aquaculture
Nutrition, 15, 247-253.
NRC (National Research Council). (1993). Nutrient requirement of fishes. Washington, DC,:
National Academy of Sciences.
NRC. (2011). Nutrient Requirements of Fish and Shrimps. Washington, D.C.: National
Academies Press.
Oliveira-Cavalheiro, J., Oliveira de Souza, E., & Bora, P. (2007). Utilization of shrimp
industry waste in the formulation of tilapia (Oreochromis niloticus Linnaeus) feed.
Bioresource Technology, 98, 602–606.
Santiago, C., & Lovell,, R. T. (1988). Amino Acid Requirements for Growth of Nile Tilapia.
J. Nutr., 118, 1540-1546.
Shiau, S. (1993). Protein-sparing effect by carbohydrates in diets for tilapia, Oreochromis
niloticus×O. aureus. (C. Y. Peng,, Ed.) Aquaculture, 117(3-4), 327-334.
Shiau, S., & Huang,, S. L. (1989). Optimaldietary protein level for hybrid tilapia (O. niloticus
x O. aureus) reared in sea water. Aquaculture, 81, 119-127.
Shiau, S., & Peng,, C. Y. (1993). Protein-sparing effect by carbohydrates in diets for tilapia,
Oreochromis niloticus×O. aureus. Aquaculture, 117, 327-334.
Shiau, S., Chuang,, J. L., & Sun,, C. L. (1987). Inclution of soybean in Tilapia (Oreochromis
niloticus x O. aureus) diets at two protein levels. Aquaculture, 65, 251-261.
Siddiqui, A., Howlander,, M. S., & Adam,, A. A. (1988). Efeects of dietary protein levels on
growth, diet conversion protein utilization in fry and young Nile tilapia, Oreochromis
niloticus. Aquaculture, 70, 63-70.
Soltan, M., Hanafy,, M. A., & Wafa,, M. I. (2008). Effect of Replacing Fish Meal by a
Mixture of Different Plant Protein Sources in Nile Tilapia (Oreochromis niloticus L.)
Diets. Global Veterinaria, 2, 157-164.

Jatta
UNU-Fisheries Training Programme 27
Tacon, A. (1993). Feed Ingredients for Warmwater fish, Fishmeal and other processed
feedstuffs. Rome: FAO.
Twibell, R., & Brown,, P. B. (1998). Optimal dietary protein concentration for hybrid tilapia
Oreochromis niloticus X O-aureus fed all-plant diets. Journal of The Word
Aquaculture Society, 29, 9-16.
Wille, K., McLean,, E., Goddard,, J. S., & Byatt,, J. C. (2002). Dietary lipid level and growth
hormone alter growth and body conformation of blue tilapia, Oreochromis aureus.
Aquaculture, 209, 219-232.
Winfree, R., & Stickney, ,. R. (1981). Effects of Dietary Protein and Energy on Growth, Feed
Conversion Efficiency on Body Composition of Tilapia aurea. J. Nutr., 111, 1001-
1012.
Winfree, R., & Stickney,, R. R. (1981). Effects of dietary protein and energy on growth, feed
conversion efficiency and body composition of Tilapia aurea. J. Nutr., 111, 1001-
1012.
Winfree, R., & Stickney,, R. R. (1981). Effects of Dietary Protein and Energy on Growth,
Feed Conversion Efficiency and Body Composition of Tilapia aurea. J. Nutr., 111,
1001-1012.
Zhou, Q.-C., & Yue,, Y.-R. (2010). Aquaculture Research, 41, 982-990.

Jatta
UNU-Fisheries Training Programme 28
APPENDIX
Table 8. Comparison of growth and feed utilisation performances of Nile tilapia fingerlings
fed on fishmeal and fishmeal plus rapeseed meal protein sources diets at the end of 3 weeks.
(N=3).
Protein source Parameter
WG% SGR FE FCR
Fishmeal (FM)
35% CP (HPFM) 209.28 ± 24.7.23a 5.38 ± 0.11a 71.12 ± 2.60a 1.41 ± 0.05b
27.5% CP (MPFM) 187.06 ± 12.40b 5.02 ± 0.20b 63.62 ± 4.71b 1.58 ± 0.12b
20% CP (LPFM) 102.37 ± 19.07c 3.34 ± 0.45c 34.46 ± 7.45c 3.00 ± 0.69a
FM plus Rapeseed
35% CP (HPRM) 119.88 ± 9.88a 3.75 ± 0.21a 49.82 ± 2.79a 2.01 ± 0.11b
27.5% CP (MPRM) 87.66 ± 13.68b 2.99 ± 0.34b 34.75 ± 3.84b 2.90 ± 0.31b
20% CP (LPRM) 57.71 ± 6.65c 2.17 ± 0.20c 20.10 ± 2.17c 5.01 ± 0.52a
Values are means of the triplicates ± SD; values within the same column and the same protein
source without a common superscript are significantly different (p <0.05).
WG (%) = percentage weight gain; SGR = specific growth rate; FE (%) =percentage feed
efficiency; FCR = feed conversion ratio.
Table 9. Growth and feed utilisation parameters of Nile tilapia fingerlings fed on different
experimental diets at the end of 6 weeks. (N=3).
Diet Parameter
IW MWT WG (%) SGR FE (%) FCR
HPFM 3.1 16.21 ± 0.5a 411.85 ± 20.7a 3.88 ± 0.1a 126.28 ± 9.0a 1.52 ± 0.17a
HPRM 3.1 10.05 ± 0.4c 219.95 ± 15.1c 2.76 ± 0.11c 82.04 ± 7.8c 2.34 ± 0.31a
MPFM 3.1 13.97 ± 0.6b 344.81 ± 3.8b 3.55 ± 0.0b 107.18 ± 3.0b 1.79 ± 0.07a
MPRM 3.1 7.46 ± 0.2d 139.1 ± 2.1d 2.08 ± 0.0d 50.12 ± 1.4d 3.81 ± 0.07b
LPFM 3.1 7.30 ± 0.3d 132.62 ± 10.6d 2.01 ± 0.1d 45.93 ± 4.7d 4.51 ± 0.78b
LPRM 3.1 5.23 ± 0.2e 68.85 ± 0.7e 1.24 ± 0.0e 27.15 ± 0.3e 7.86 ± 0.25c
PPBD 3.1 5.22 ± 2e 64.1 ± 1e 1.18 ± 0.1e 25.51 ± 1.7e 7.68 ± 0.80c
Values are means of the triplicates ± SE; values within the same column without a common
superscript are significantly different (p <0.05).
IW = initial weight; MWT = mean weight; WG (%) = percentage weight gain; SGR = specific
growth rate; FE (%) =percentage feed efficiency; FCR = feed conversion ratio.
Table 10. Comparison of growth and feed utilisation performances of Nile tilapia fingerlings
fed on fishmeal protein source diets at different protein levels at the end of 6 weeks. (N=3).
Protein source Parameter
Fishmeal MWT WG (%) SGR FE (%) FCR
35% CP (HPFM) 16.21 ± 0.5a 411.85 ± 20.7a 3.88 ± 0.1a 126.28 ± 9.0a 1.52 ± 0.17a
27.5% CP (MPFM) 13.97 ± 0.6b 344.81 ± 3.8b 3.55 ± 0.0b 107.18 ± 3.0b 1.79 ± 0.07a
20% CP (LPFM) 7.30 ± 0.3c 132.62 ± 10.6c 2.01 ± 0.1c 45.93 ± 4.7c 4.51 ± 0.78b

Jatta
UNU-Fisheries Training Programme 29
Values are means of the triplicates ± SE; values within the same column without a common
superscript are significantly different (p <0.05).
IW = initial weight; MWT = mean weight; WG (%) = percentage weight gain; SGR = specific
growth rate; FE (%) =percentage feed efficiency; FCR = feed conversion ratio.
Table 11. Comparison of growth and feed utilisation performances of Nile tilapia fingerlings
fed on fishmeal plus rapeseed meal protein sources diets at different protein levels at the end
of 6 weeks. (N=3).
FM plus Rapeseed MWT WG (%) SGR FE (%) FCR
35% CP (HPRM) 10.05 ± 0.4a 219.95 ± 15.1a 2.76 ± 0.11a 82.04 ± 7.8a 2.34 ± 0.31a
27.5% CP (MPRM) 7.46 ± 0.2b 139.1 ± 2.1b 2.08 ± 0.0b 50.12 ± 1.4b 3.81 ± 0.07b
20% CP (LPRM) 5.23 ± 0.2c 68.85 ± 0.7c 1.24 ± 0.0c 27.15 ± 0.3c 7.86 ± 0.25c
Values are means of the triplicates ± SE; values within the same column without a common
superscript are significantly different (p <0.05).
IW = initial weight; MWT = mean weight; WG (%) = percentage weight gain; SGR = specific
growth rate; FE (%) =percentage feed efficiency; FCR = feed conversion ratio.
Table 12. Comparison of growth and feed utilisation performances of Nile tilapia fingerlings
fed on fishmeal and fishmeal plus rapeseed meal protein sources diets at the same protein
level at the end of 6 weeks. (N=3).
At same CP level MWT WG (%) SGR FE FCR
35% CP (HPFM) 16.21 ± 0.5a 411.85 ± 20.7a 3.88 ± 0.1a 126.28 ± 9.0a 1.52 ± 0.17a
35% CP (HPRM) 10.05 ± 0.4b 219.95 ± 15.1b 2.76 ± 0.11b 82.04 ± 7.8b 2.34 ± 0.31a
27.5% CP (MPFM) 13.97 ± 0.6a 344.81 ± 3.8a 3.55 ± 0.0a 107.18 ± 3.0a 1.79 ± 0.07a
27.5% CP (MPRM) 7.46 ± 0.2b 139.1 ± 2.1b 2.08 ± 0.0b 50.12 ± 1.4b 3.81 ± 0.07b
20% CP (LPFM) 7.30 ± 0.3a 132.62 ± 10.6a 2.01 ± 0.1a 45.93 ± 4.7a 4.51 ± 0.78a
20% CP (LPRM) 5.23 ± 0.2b 68.85 ± 0.7b 1.24 ± 0.0b 27.15 ± 0.3b 7.86 ± 0.25b
Values are means of the triplicates ± SE; values within the same column without a common
superscript are significantly different (p <0.05).
IW = initial weight; MWT = mean weight; WG (%) = percentage weight gain; SGR = specific
growth rate; FE (%) =percentage feed efficiency; FCR = feed conversion ratio.