The effects of log erosion barriers on post-fire hydrologic ... and sediment yield in small forested...
14
HYDROLOGICAL PROCESSES Hydrol. Process. 15, 3053-3066 (2001) DOI: 10.1002/hyp.391 The effects of log erosion barriers on post-fire hydrologic response and sediment yield in small forested watersheds, southern California Peter M. Wohlgemuth, 1 * Ken R. Hubbert 1 and Peter R. Robichaud 2 1 USDA Forest Service, Pacific Southwest Research Station, Forest Fire Laboratory, Riverside, CA 92507, USA 2 USDA Forest Service, Rocky Mountain Research Station, Forestry Science Laboratory, Moscow, ID 83843, USA Abstract: Wildfire usually promotes flooding and accelerated erosion in upland watersheds. In the summer of 1999, a high-severity wildfire burned a series of mixed pine/oak headwater catchments in the San Jacinto Mountains of southern California. Log erosion barriers (LEBs) were constructed across much of the burned area as an erosion control measure. We built debris basins in two watersheds, each about 1 ha in area, one with LEBs, the other without, to measure post-fire hydrologic response and sediment yield and to evaluate the effectiveness of the LEBs. The watersheds are underlain by granitic bedrock, producing a loamy sand soil above large extents of weathered bedrock and exposed core stones (tors) on the surface. Measured soil water-repellency was similar over the two catchments. Rain gauges measured 348 mm of precipitation in the first post-fire year. The ephemeral stream channels experienced surface flow after major rainstorms, and the source of the water was throughflow exfiltration at the slope/channel interface. Post-fire overland flow produced some rilling, but hillslope erosion measured in silt fences away from any LEBs was minor, as was sediment accumulation behind the LEBs. Stream channels in the catchments exhibited minor net scour. Water yield was much greater in the LEB-treated watershed. This resulted in 14 times more sediment yield by weight than the untreated watershed. Average soil depths determined by angering were nearly double in the catchment without the LEBs compared with the treated watershed. This suggests that differences in water and sediment yield between the two catchments are due to the twofold difference in the estimated soil water-holding capacity in the untreated watershed. It appears that the deeper soils in the untreated watershed were able to retain most of the precipitation, releasing less water to the channels and thereby reducing erosion and sediment yield. Thus, the test of LEB effectiveness was inconclusive in this study, because soil depth and soil water-holding capacity may have masked their performance. Published in 2001 by John Wiley & Sons, Ltd. KEY WORDS: sediment yield; hydrologic response; fire; erosion control; log erosion barriers; upland watersheds; soil depth; water repellency INTRODUCTION In the fire-prone southwestern USA, post-fire erosion, sedimentation, and flooding threaten life, property, and infrastructure. In addition, post-fire environmental degradation can extirpate refugia populations of endangered species in sensitive riparian corridors. This has prompted expensive emergency watershed rehabilitation measures on the part of land managers to protect downstream sites at risk (Robichaud et al., 2000). It has been well documented that wildfire can alter the hydrologic and erosion response of watersheds in southern California (Kraebel, 1934; Rowe et al., 1954; Rice, 1974; Wells, 1981). With the removal of the vegetation canopy and surface organic material, rainfall interception is reduced (Hamilton and Rowe, 1949) and the bare hillslopes are subjected to unimpeded raindrop impacts (Wells, 1981). Moreover, the combustion * Correspondence to: P. M. Wohlgemuth, USDA Forest Service, Pacific Southwest Research Station, Forest Fire Laboratory, Riverside, CA, USA. E-mail: [email protected] Received 1 April 2001 This article is a US Government work and is in the public domain in the USA Accepted 9 July 2001
Transcript of The effects of log erosion barriers on post-fire hydrologic ... and sediment yield in small forested...

HYDROLOGICAL PROCESSES Hydrol. Process. 15, 3053-3066 (2001) DOI: 10.1002/hyp.391
The effects of log erosion barriers on post-fire hydrologic response and sediment yield in small forested watersheds,
southern California
Peter M. Wohlgemuth,1* Ken R. Hubbert1 and Peter R. Robichaud2
1 USDA Forest Service, Pacific Southwest Research Station, Forest Fire Laboratory, Riverside, CA 92507, USA 2 USDA Forest Service, Rocky Mountain Research Station, Forestry Science Laboratory, Moscow, ID 83843, USA
Abstract:
Wildfire usually promotes flooding and accelerated erosion in upland watersheds. In the summer of 1999, a high-severity wildfire burned a series of mixed pine/oak headwater catchments in the San Jacinto Mountains of southern California. Log erosion barriers (LEBs) were constructed across much of the burned area as an erosion control measure. We built debris basins in two watersheds, each about 1 ha in area, one with LEBs, the other without, to measure post-fire hydrologic response and sediment yield and to evaluate the effectiveness of the LEBs. The watersheds are underlain by granitic bedrock, producing a loamy sand soil above large extents of weathered bedrock and exposed core stones (tors) on the surface. Measured soil water-repellency was similar over the two catchments. Rain gauges measured 348 mm of precipitation in the first post-fire year. The ephemeral stream channels experienced surface flow after major rainstorms, and the source of the water was throughflow exfiltration at the slope/channel interface. Post-fire overland flow produced some rilling, but hillslopeerosion measured in silt fences away from any LEBs was minor, as was sediment accumulation behind the LEBs. Stream channels in the catchments exhibited minor net scour. Water yield was much greater in the LEB-treated watershed. This resulted in 14 times more sediment yield by weight than the untreated watershed. Average soil depths determined by angering were nearly double in the catchment without the LEBs compared with the treated watershed. This suggests that differences in water and sediment yield between the two catchments are due to the twofold difference in the estimated soil water-holding capacity in the untreated watershed. It appears that the deeper soils in the untreated watershed were able to retain most of the precipitation, releasing less water to the channels and thereby reducing erosion and sediment yield. Thus, the test of LEB effectiveness was inconclusive in this study, because soil depth and soil water-holding capacity may have masked their performance. Published in 2001 by John Wiley & Sons, Ltd. KEY WORDS: sediment yield; hydrologic response; fire; erosion control; log erosion barriers; upland watersheds; soil
depth; water repellency
INTRODUCTION
In the fire-prone southwestern USA, post-fire erosion, sedimentation, and flooding threaten life, property, and infrastructure.In addition, post-fire environmental degradation can extirpate refugia populations of endangered species in sensitive riparian corridors. This has prompted expensive emergency watershed rehabilitation measures on the part of land managers to protect downstream sites at risk (Robichaud et al., 2000).
It has been well documented that wildfire can alter the hydrologic and erosion response of watersheds in southern California (Kraebel, 1934; Rowe et al., 1954; Rice, 1974; Wells, 1981). With the removal of the vegetation canopy and surface organic material, rainfall interception is reduced (Hamilton and Rowe, 1949) and the bare hillslopes are subjected to unimpeded raindrop impacts (Wells, 1981). Moreover, the combustion
* Correspondence to: P. M. Wohlgemuth, USDA Forest Service, Pacific Southwest Research Station, Forest Fire Laboratory, Riverside, CA, USA. E-mail: [email protected]
Received 1 April 2001 This article is a US Government work and is in the public domain in the USA Accepted 9 July 2001
3054 P. M. WOHLGEMUTH, K. R. HUBBERT AND P. R. ROBICHAUD
of soil organic matter often creates a subsurface water-repellent layer that restricts infiltration and promotes overland flow (DeBano, 1981). This enhances both catchment water yield (Anderson, 1949; Rowe et al., 1954; Baker, 1990) and sediment yield (Hamilton et al., 1954; Pase and Ingebo, 1965; Hibbert, 1985; Heede et al., 1988).
Log erosion barriers (LEBs) are built by felling and placing fire-killed trees parallel to the hillside contours. The LEBs are designed to retard overland flow of water and sediment on hillside slopes, thereby reducing post-fire hillslope erosion and sediment delivery to stream channels (Robichaud et al., 2000). Ideally, the LEBs are placed in an overlapping arrangement that maximizes ponding (fostering infiltration and deposition) and minimizes potential barrier failure. LEB performance has been closely tied to initial construction, e.g. positioning along the slope contour, horizontal dip, and sealing the log with the ground surface (Robichaud et al., 2000).
In September 1999, the Mixing Fire burned over 1200 ha of brushfields and forest in the San Jacinto Mountains of southern California. Following the fire, USDA Forest Service personnel constructed LEBs across a portion of the Mixing Fire site as an erosion control measure. The purpose of this study is to quantify the post-fire hydrologic response and the sediment yield from two small watersheds, while evaluating the effectiveness of the LEBs as an erosion control practice.
STUDY SITE AND WATERSHED DESCRIPTION
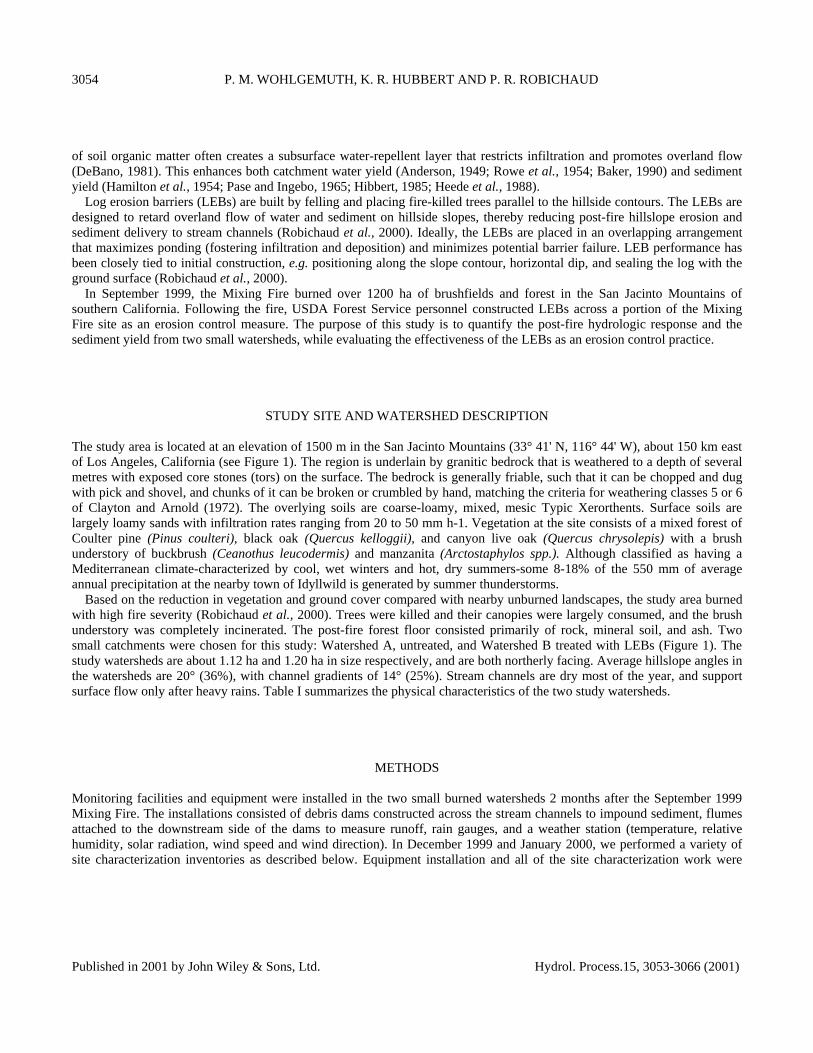
The study area is located at an elevation of 1500 m in the San Jacinto Mountains (33° 41' N, 116° 44' W), about 150 km east of Los Angeles, California (see Figure 1). The region is underlain by granitic bedrock that is weathered to a depth of several metres with exposed core stones (tors) on the surface. The bedrock is generally friable, such that it can be chopped and dug with pick and shovel, and chunks of it can be broken or crumbled by hand, matching the criteria for weathering classes 5 or 6 of Clayton and Arnold (1972). The overlying soils are coarse-loamy, mixed, mesic Typic Xerorthents. Surface soils are largely loamy sands with infiltration rates ranging from 20 to 50 mm h-1. Vegetation at the site consists of a mixed forest of Coulter pine (Pinus coulteri), black oak (Quercus kelloggii), and canyon live oak (Quercus chrysolepis) with a brush understory of buckbrush (Ceanothus leucodermis) and manzanita (Arctostaphylos spp.). Although classified as having a Mediterranean climate-characterized by cool, wet winters and hot, dry summers-some 8-18% of the 550 mm of average annual precipitation at the nearby town of Idyllwild is generated by summer thunderstorms.
Based on the reduction in vegetation and ground cover compared with nearby unburned landscapes, the study area burned with high fire severity (Robichaud et al., 2000). Trees were killed and their canopies were largely consumed, and the brush understory was completely incinerated. The post-fire forest floor consisted primarily of rock, mineral soil, and ash. Two small catchments were chosen for this study: Watershed A, untreated, and Watershed B treated with LEBs (Figure 1). The study watersheds are about 1.12 ha and 1.20 ha in size respectively, and are both northerly facing. Average hillslope angles inthe watersheds are 20° (36%), with channel gradients of 14° (25%). Stream channels are dry most of the year, and support surface flow only after heavy rains. Table I summarizes the physical characteristics of the two study watersheds.
METHODS
Monitoring facilities and equipment were installed in the two small burned watersheds 2 months after the September 1999 Mixing Fire. The installations consisted of debris dams constructed across the stream channels to impound sediment, flumes attached to the downstream side of the dams to measure runoff, rain gauges, and a weather station (temperature, relative humidity, solar radiation, wind speed and wind direction). In December 1999 and January 2000, we performed a variety of site characterization inventories as described below. Equipment installation and all of the site characterization work were
Published in 2001 by John Wiley & Sons, Ltd. Hydrol. Process.15, 3053-3066 (2001)
EFFECTS OF LOG EROSION BARRIERS ON POST-FIRE HYDROLOGY AND SEDIMENT YIELD 3055
Figure 1. Map showing locations of the two 1 ha watersheds and drainages. Locations of the measuring facilities are noted
completed before the study area received more than 5 mm of rainfall. We determined soil non-wettability using the water drop penetration test (DeBano, 1981). We placed drops of water on the
soil and recorded the time it took them to penetrate or infiltrate into the soil mass. Testing was done at 16 locations in eachwatershed, stratified by hillslope position (crest, midslope, and toeslope).
Published in 2001 by John Wiley & Sons, Ltd. Hydrol. Process. 15, 3053-3066 (2001)
3056 P. M. WOHLGEMUTH, K. R. HUBBERT AND P. R. ROBICHAUD
Table I. Characteristics of the study watersheds
Watershed A Watershed B
Treatment Untreated control LEB treated Size (ha) 1.12 1.20Aspect NNE NWAverage slope angle (deg) 20 21Average channel gradient (deg) 14 15Total channel length (m) 93 219Drainage density (km km-2) 8.30 18.25Channel sediment storage 0.32 0.16 (m3 m-1)Average soil texture loamy sand loamy sandAverage soil depth (m) 1.01 0.54Average soil organic matter 6.63 6.60
content by weight (%)
At each location, we performed the test five times for each of three soil strata: the top of the ash layer, the mineral soilsurface, and 1 cm into the mineral soil.
Rock, litter, and vegetation all provide ground cover that offers some watershed protection against raindrop impact and surface runoff. To assess ground cover in the study area, we randomly chose 25 sampling points in each watershed andmonumented them with sections of rebar. Four 1 m x 1 m plots were established at each sampling point, with the near corner of each plot located 1 m from the rebar along diagonals to the cardinal compass points. The plots were repeatedly surveyedby ocular estimate by the same operator to quantify ground cover.
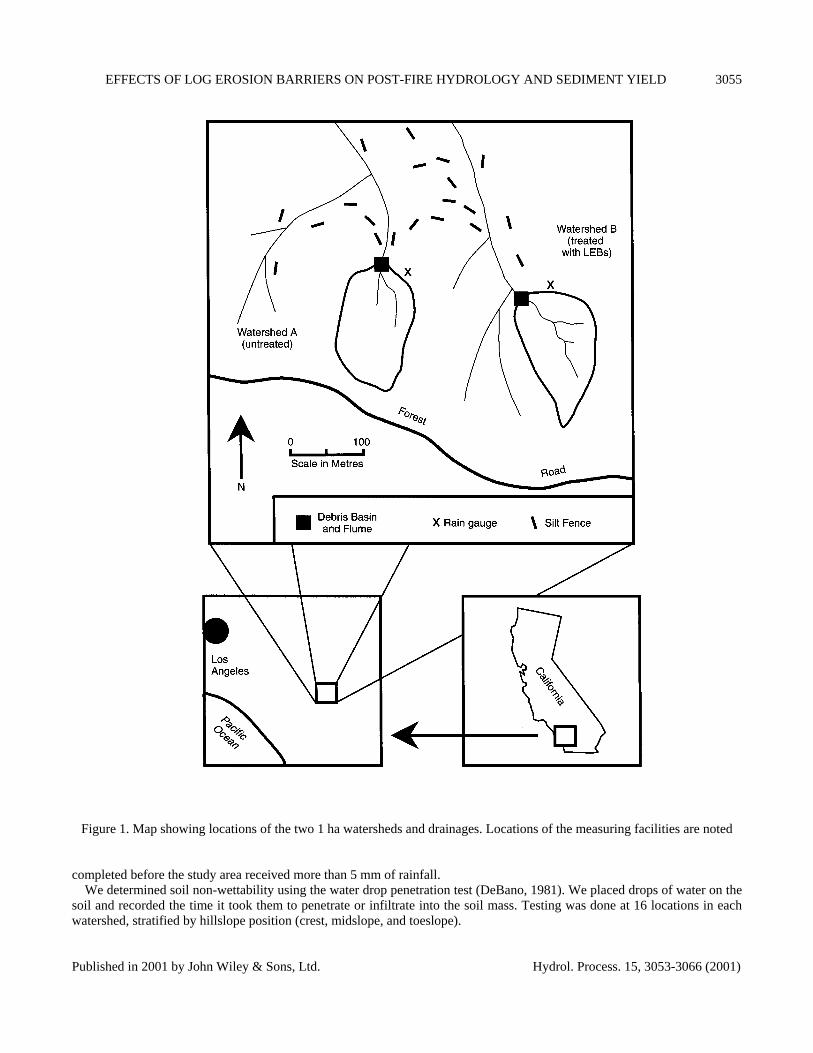
We measured hillslope erosion in the Mixing Fire study area with silt fence barriers (Robichaud et al., 2000). Thesebarriers, constructed of silt cloth wired to t-posts (see Figure 2), retained sediment from plots that ranged from 3.7 to 4.3 mwide by 12 to 30 m long. The average contributing area for each silt fence was 83.6 m2. We sprinkled construction chalk justuphill of the barriers to identify the initial ground surface, then removed and measured the captured material as itaccumulated. Twenty silt fences were installed in the project area outside of the study watershed boundaries (Figure 1).
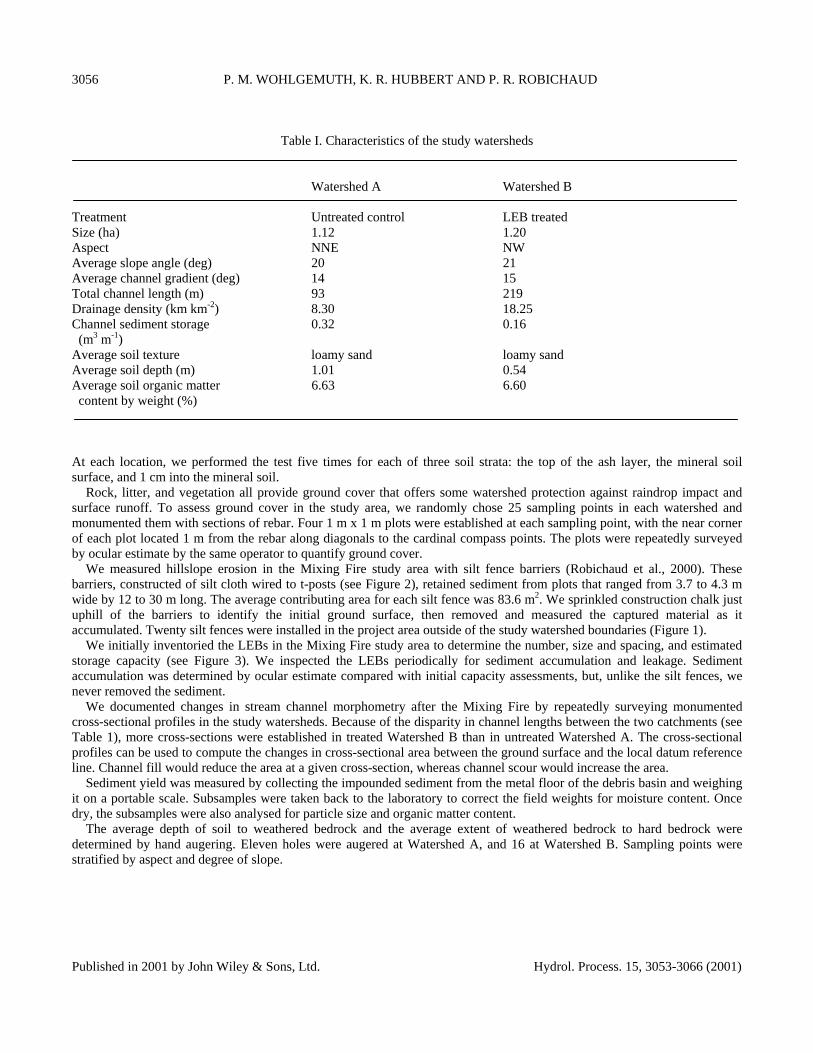
We initially inventoried the LEBs in the Mixing Fire study area to determine the number, size and spacing, and estimatedstorage capacity (see Figure 3). We inspected the LEBs periodically for sediment accumulation and leakage. Sedimentaccumulation was determined by ocular estimate compared with initial capacity assessments, but, unlike the silt fences, wenever removed the sediment.
We documented changes in stream channel morphometry after the Mixing Fire by repeatedly surveying monumentedcross-sectional profiles in the study watersheds. Because of the disparity in channel lengths between the two catchments (see Table 1), more cross-sections were established in treated Watershed B than in untreated Watershed A. The cross-sectionalprofiles can be used to compute the changes in cross-sectional area between the ground surface and the local datum referenceline. Channel fill would reduce the area at a given cross-section, whereas channel scour would increase the area.
Sediment yield was measured by collecting the impounded sediment from the metal floor of the debris basin and weighingit on a portable scale. Subsamples were taken back to the laboratory to correct the field weights for moisture content. Oncedry, the subsamples were also analysed for particle size and organic matter content.
The average depth of soil to weathered bedrock and the average extent of weathered bedrock to hard bedrock weredetermined by hand augering. Eleven holes were augered at Watershed A, and 16 at Watershed B. Sampling points werestratified by aspect and degree of slope.
Published in 2001 by John Wiley & Sons, Ltd. Hydrol. Process. 15, 3053-3066 (2001)

EFFECTS OF LOG EROSION BARRIERS ON POST-FIRE HYDROLOGY AND SEDIMENT YIELD 3057
Figure 2. Photograph of a silt fence to measure surface erosion
RESULTS
The following sections detail the results of the first year's response of the two small watersheds to the Mixing fire.
Vegetation cover
Initial vegetation surveys, performed in January 2000, revealed very little cover in either watershed, with bare ground averaging 86% and 83% in Watershed A and Watershed B respectively. Vegetation averaged 1-2%, all in the form of standing dead trees. The litter category, which included the felled dead trees (LEBs), was twice as great in Watershed B (9% versus 4%), as the LEBs themselves provide cover. The remaining 6-8% cover was rock. Surveys were made again in May 2000, with little change from the initial cover estimates. Bare ground averaged 81% in each watershed, and the vegetation covered 8% and 5% of Watershed A and Watershed B respectively. Vegetation regrowth consisted primarily of forbs and grasses, as well as sprouts from the base of the oaks. Pine seedlings were very rare. Qualitative observations in
Published in 2001 by John Wiley & Sons, Ltd. Hydrol. Process. 15, 3053-3066 (2001)

3058 P. M. WOHLGEMUTH, K. R. HUBBERT AND P. R. ROBICHAUD
Figure 3. Photograph of Watershed B showing the LEBs
November 2000 indicated that the dominant vegetation regrowth providing cover protection to the watersheds was resprouting oaks.
Soil and weathered bedrock depths
Average soil depth to weathered bedrock was 1.01 m at Watershed A, and 0.54 m at Watershed B (Table I). Weathered bedrock extended on average 0.94 m to hard bedrock at Watershed A, and 0.99 m at Watershed B. Assuming a volumetric water content of 0.13 cm3 cm-3 for the loamy sand soil profile (Hillel, 1982) and 0.08 cm3 cm-3 for the weathered bedrock (Jones and Graham, 1993), we can estimate a water storage capacity of 13.2 cm for soil and 12.8 cm for weathered bedrock (26 cm combined) at Watershed A, and 7.1 cm for soil and 13.5 cm for weathered bedrock (20.6 cm combined) at Watershed B. Estimated water storage capacity for the soil depth in Watershed A is about twice that of Watershed B (the ratio of B to A is 0.54). Soil water-holding capacity (cm) is the total water contained in the soil after gravitational water has freely drainedaway. This water volume is expressed as depth of water in a depth of soil (e.g. 13.2 cm of water in 101 cm soil depth).
Published in 2001 by John Wiley & Sons, Ltd. Hydrol. Process. 15, 3053-3066 (2001)

EFFECTS OF LOG EROSION BARRIERS ON POST-FIRE HYDROLOGY AND SEDIMENT YIELD 3059
Soil non-wettabilityResults of the water drop penetration times are shown in Table II. As expected, the drops penetrated the ash layer virtually
instantaneously in both watersheds. Non-wettability was uniformly the greatest at the surface of the mineral soil in both watersheds, with 68% of the drops exceeding 1 min or more before infiltrating. Non-wettability was most heterogeneouswithin the mineral soil: 28% of the drops exceeded 40 s before infiltrating, 12% penetrated in under 20 s, and the rest of the drops took between 20 and 40 s.
RainfallThe precipitation records from the rain gauges at each study watershed are very similar to each other. The total rainfall for
the first year of the study at the two gauges was within 1%, and a correlation analysis of daily rain yields an r2 value of 0.98.Slightly higher peak rainfall intensities were recorded in the gauge
Table II. Soil non-wettability determinations
Slope as ect Slope angle Slope position Drop penetration timea (sec) (Deg) (Deg)
Top of ash Mineral soil surface 1 cm in mineral soil
Watershed A 300 12 Crest 0 >60 >60285 17 Midslope 0 0 5270 19 Midslope 0 >60 35250 12 Toeslope 0 40 35005 23 Toeslope 0 25 45285 25 Toeslope 0 >60 35030 17 Toeslope 0 50 20300 25 Midslope 0 >60 40300 12 Crest 0 >60 40000 20 Midslope 0 >60 30020 18 Midslope 0 >60 35010 23 Midslope 0 >60 35000 23 Midslope 0 25 40015 8 Crest 0 55 20105 13 Midslope 0 30 40345 20 Crest 0 >60 >60Watershed B 005 17 Crest 0 >60 45005 18 Crest 0 >60 55000 18 Midslope 0 55 15000 17 Midslope 0 50 25025 21 Toeslope 5 >60 40240 20 Toeslope 0 > 60 45285 15 Crest 0 >60 10285 16 Midslope 0 >60 35205 15 Crest 0 >60 15230 17 Midslope 0 > 60 45265 12 Midslope 0 >60 45250 19 Toeslope 0 >60 25020 18 Toeslope 0 50 50355 18 Midslope 0 >60 20355 18 Midslope 0 >60 20005 17 Midslope 0 >60 20
a Each time represents the average of five determinations.
Published in 2001 by John Wiley & Sons, Ltd. Hydrol. Process. 15, 3053-3066 (2001)
3060 P. M. WOHLGEMUTH, K. R. HUBBERT AND P. R. ROBICHAUD
at Watershed B, but there was no consistent pattern from storm to storm and a correlation analysis of peak 10 min stormintensities yields an r2 of 0.93 between the two gauges. Field calibration tests show that both gauges accurately measuredcontrolled volumes of water. Therefore, the following rainfall summaries are based on the average of the two gauges.
The rain gauges were installed in early November 1999, and the first rain was recorded on January 1, 2000. For the purposes of this paper, the final rain of the year was recorded on November 5, 2000. Total precipitation over this period(some of which fell as snow in February) was 348 mm, well below the average annual value of ~550 mm. Winter cyclonicstorms produced 254 mm of rain and snow between January and April. Summer thunderstorms yielded a total of 46 mm ofrain in August and September. Cyclonic storms returned in October and early November, producing another 48 mm of rain,and marking the start of the second post-fire winter season. Cyclonic storms typically generated peak 10 min rainfall levels of1.3 to 1.9 mm (7.8-11.4 mm h-1). In contrast, thunderstorms produced peak 10 min rainfall levels of 1.8 to 2.6 mm (10.8-15.6mm hr-1). These rainfall intensities are less than the soil infiltration rates generally found in the study area.
StreamflowNot surprisingly, the below-normal precipitation and relatively low peak rainfall intensities produced unspectacular
streamfiow events. In fact, no runoff records were ever generated because the water impounded in the debris basin neverreached the level of the flume. Rather, once the runoff ceased, the ponded water would slowly percolate through the porousfloor of the reservoir, and we observed that the basin was usually dry before the next rain. However, flow was sporadicallyobserved in the stream channels of both watersheds, with observations indicating the source of the water was throughflowexfiltration at the slope/channel interface rather than any sustained hillslope overland flow. Based on the level of thehigh-water marks recorded on the dam face in each debris basin after every significant storm, treated Watershed B appears to have consistently produced more runoff than did untreated Watershed A.
Hillslope erosionHillslope erosion in the study area, measured in the silt fences, was minor compared with reported post-fire erosion levels
in southern California (see Table III). Although we observed some rilling in swales and below rock outcrops, there were notthe pervasive rills commonly associated with burned watersheds in southern California (Wells, 1981). Flux rates, themovement of sediment past a unit width of slope contour per unit time (g cm-1 day-1), were greater in the winter, but total soilloss was greater during the summer (Table III). Some of this response undoubtedly reflects the below-normal rainfallexperienced during the study period.
LEBsThe intent of the LEBs is to disrupt the overland flow of water and sediment off the hillslopes and, in turn, delay water and
sediment from entering the channels. Capturing and retaining sediment is only of secondary
Table III. Hillslope erosion and soil loss in the project area measured behind the siltfences. Total number of silt fences is 20. Average contributing area to each fence is
83.6 m2
Collection date Average eroded Average sediment Average soilsediment (kg) flux (g cm -1 day 1) loss (kg ha 1)
2/22/00 0.88 0.002 105 2/24/00 1.43 0.084 171 4/20/00 0.90 0.002 108 11/7/00 6.86 0.004 821 Total per fence 10.07 0.004 1205
Published in 2001 by John Wiley & Sons, Ltd. Hydrol. Process. 15, 3053-3066 (2001)

EFFECTS OF LOG EROSION BARRIERS ON POST-FIRE HYDROLOGY AND SEDIMENT YIELD 3061
importance (Robichaud et al., 2000). However, one measure of the performance of the LEBs is the amount of sedimentcaught. Another performance indicator is evidence of any leakage or spillage under or around the LEB. Table IV providessummary statistics of the initial inventory of the 157 LEBs, established at a density of 131 LEBs p ha-1. Generally, LEBsediment accumulation was minor, as would be expected with the level of hillslope sediment yield measured behind the siltfences. Only about 10% of the LEBs caught more than 0.1 m3, while two-thirds captured less than 0.01 m3 and nearlyone-quarter caught nothing. The total site storage capacity of 182 m3 was reduced by only about 5% (9.1 m3) after the first post-fire year. Although there were some dramatic examples of LEB failure and water cascading from LEB to LEB, only nineof the 157 LEBs showed evidence of leakage, and another nine LEBs had spills around the end of the log.
Stream channel erosionTable V summarizes the channel surveys for the study watersheds. The initial surveys were performed in early January
2000, prior to significant rain. Surveys in mid-February indicated that the channels in Watershed A were filling slightly,whereas the channels were scouring in Watershed B. However, surveys at the end of February showed that this pattern hadreversed, although both catchments indicated a slight cumulative channel scour from the initial baseline. By early May, bothwatersheds exhibited considerable channel filling from the late winter and early spring rains. In September, channels in bothwatersheds had scoured again,
Table IV. Summary statistics of the LEBs (n = 157) in Watershed B
Log length Average log Slope Horizontal dipb Storage Estimated catch Estimated soil (m) diameter lengtha (deg) capacity (m3) (m3) lossc (kg ha -1)
(cm) (m)
Mean 5.5 22.5 9.0 5.5 1.16 0.057 13939Std. Dev. 2.6 8.4 4.2 3-9 1.81 0.106 25922Median 4.8 20 8.2 5 0.57 0.003 734Maximum 16.3 55 21.0 16 13.14 1.596 390300Minimum 1.2 7 2. 1 0 0.03 0 0
a Upslope distance to drainage divide or next LEB.b Contour placement deviation.c Loss = catch volume x density/mean contributing area, density assumed to be 1 .2 g cm-3; contributing area = log length xslope length.
Table V. Stream channel cross-section profile summaries
Survey date Average cross-sectional area (m2)a
Watershed A (n = 8) Watershed B (n = 27)
1/6/00 (initial measurements) 0.538 69 0.464 462/16/00 0.533 52 0.478 342/29/00 0.541 07 0.472 355/03/00 0.496 53 0.427 539/15/00 0.549 98 0.482 2512/27/00 0.546 23 0.478 25Net change 0.007 54 0.013 79
Computed volumeb (m3) 0.70 3.02 Sediment lossc (kg ha-1) 750 3020
a An increase in area represents channel scour, a reduction in area represents channel fill.b Volume = channel length x net change in cross-sectional area.c Loss = volume x sediment density/watershed area; density assumed to be 1.2 g cm-3.
Published in 2001 by John Wiley & Sons, Ltd. Hydrol. Process. 15, 3053-3066 (2001)
3062 P. M. WOHLGEMUTH, K. R. HUBBERT AND P. R. ROBICHAUD
presumably in response to the summer thunderstorms. A subsequent survey in December indicated a slight channel filling with the return of winter cyclonic storms. Assuming a sediment density of 1-2 g cm-3 , by the end of the season the two catchments had produced net channel scours of 750 kg ha-1 and 3020 kg ha-1 for Watershed A (untreated) and Watershed B (treated) respectively (see Table V).
Watershed sediment yieldTable VI summarizes rainfall, sediment yield, and soil loss for the two study watersheds in the Mixing Fire project.
Watershed B (treated) produced over 14 times as much total sediment as Watershed A in the first year after the fire, and the differences were even greater for some individual collections. Watershed B consistently generated more sediment thanWatershed A. The sediments in the debris basins were both finer-textured (equivalent to a loam soil) and much richer inorganics than the surface soil samples collected in each watershed (as seen by comparing organic matter contents in Tables Iand VI).
DISCUSSION
Fire can dramatically alter the physical environment, making the post-burn landscape more sensitive to the agents of erosion(Wells, 1981). The production of non-wettable soil layers is thought to govern much of the post-fire watershed hydrologicand erosion response (DeBano, 1981; DeBano et al., 1998). Following the Mixing Fire, fairly uniform non-wettability was documented at the top of the mineral soil in both study watersheds, regardless of hillslope position (Table II). However,based on field observations, pervasive sheetwash and rilling were absent in the study area. The inference is that the non-wettable layer did not significantly restrict rainfall infiltration. This reaffirms the difficulty of testing a spatially variablelandscape feature with point samples (Robichaud, 1996), and suggests that a model of a discontinuous or porousnon-wettable layer is more realistic (Booker et al., 1993).
Hillslope erosion can be extensive in burned watersheds. Soil material at steep angles will often be transported solely bygravitational forces in the process known as dry ravel (Krammes, 1960). Burned hillslopes, denuded of cover, are alsosubjected to unimpeded raindrop impacts that preferentially move soil particles downhill (Wells, 1981). Moreover, with theproduction of a classic non-wettable soil layer and the attendant reduction in infiltration, sheetwash and rilling are promoted(DeBano, 1981). However, hillslope erosion in the study area was remarkably subdued. Annual soil losses of 1200 kg ha-1 inthe first post-fire year (Table 111) pale in comparison with other studies in southern California that have measured post-burnhillslope erosion
Table VI. Rainfall, sediment yield, and soil loss by collection date. The instrumentation was in place in November 1999
Collection Rainfall (mm) Watershed A Watershed B date
Total Daily 10 min Sediment Soil loss Organic Sediment Soil loss Organic max. max. yield (kg) (kg ha-1) matter (%) yield (kg) (kg ha-1) matter (%)
1/28/00 33.3 10.4 1.8 6.60 5.89 15 18.53 15.44 462/16/00 47.3 15.2 2.0 0.03 0.03 51 3.80 3.17 502/17/00 12.8 11.2 2.0 0.42 0.38 12 146.73 122.28 36 2/24/00 60.6 21.8 1.8 1.44 1.29 22 15.97 13.31 242/29/00 10.9 9.4 1.5 0.74 0.66 16 2.70 2.25 315/3/00 88.9 23.9 1.8 6.53 5.83 16 74.47 62.06 178/18/00 17.1 12.2 3.0 0 0 -- 106.74 88.95 348/31/00 16.0 14.0 2.8 0.15 0.13 72 72.69 60.58 319/15/00 13.4 13.4 2.0 19.02 16.96 37 77.44 64.53 2911/7/00 47.9 15.5 1.5 2.70 2.41 43 8.09 6.74 31
Total 348.2 37.63 33.58 527.16 439.31
Published in 2001 by John Wiley & Sons, Ltd. Hydrol. Process. 15, 3053-3066 (2001)
EFFECTS OF LOG EROSION BARRIERS ON POST-FIRE HYDROLOGY AND SEDIMENT YIELD 3063
at over 20000 kg ha-1 (Wohlgemuth, 2001). Much of this response is undoubtedly a function of the below normal rainfall and the evidence of little or no overland flow, as noted previously. Not unexpectedly, more hillslope erosion was likely generated by the summer thunderstorms than by the winter cyclonic storms (Table III).
Some of this hillslope erosion was caught by the LEBs. However, comparing Tables III and IV, the estimated soil loss calculated from the LEBs was an order of magnitude greater than the loss computed from the silt fences. This disparity can be explained by the different hillslope topographic locations of the silt fences and the LEBs. The silt fences, constructed specifically to measure surface erosion, were placed on fairly uniform slope facets. The LEBs, constructed operationally by Forest Service personnel, were located not only on uniform facets but also in swales, and several were even placed directly in the channels. These latter locations accumulated far more sediment than did the LEBs on planar slopes. Omitting these outliers and re-computing the estimated soil loss generates values that are roughly comparable to those from the silt fences.
Stream channels receive water and sediment from the hillslopes and convey them out of the watershed. Generally, in post-fire environments, channels initially fill with sediment washed off the hillslopes, then scour through these deposits afterthe sediment supply of easily mobilized ash and organic material is depleted (Campbell et al., 1987; Florsheim et al., 1991). The channels in the study watersheds exhibit this same fill-scour pattern, although it is as subdued as the erosion activity onthe hillsides. There was evidence of aggradation and degradation at most cross-sections (often simultaneously), but the net change between successive surveys was never more than 5% (Table V). Channel filling appears to be associated with the lower intensity winter cyclonic storms, whereas channel scour appears to be associated with the higher intensity summer thunderstorms.
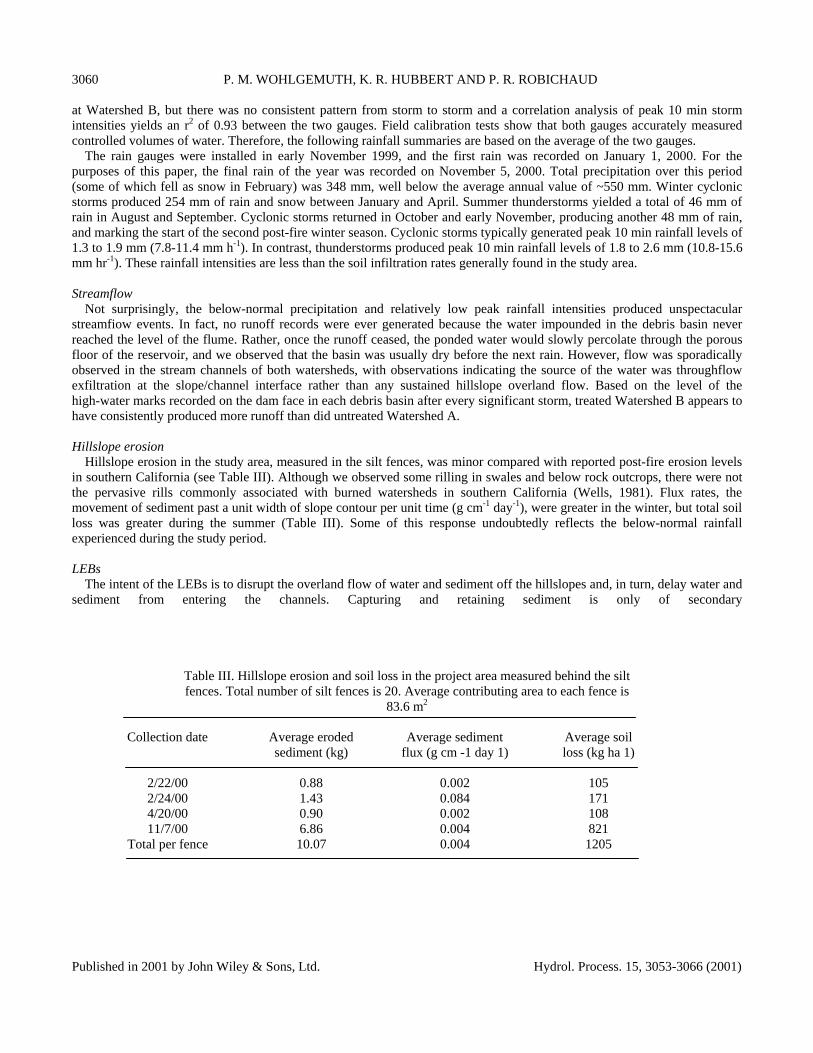
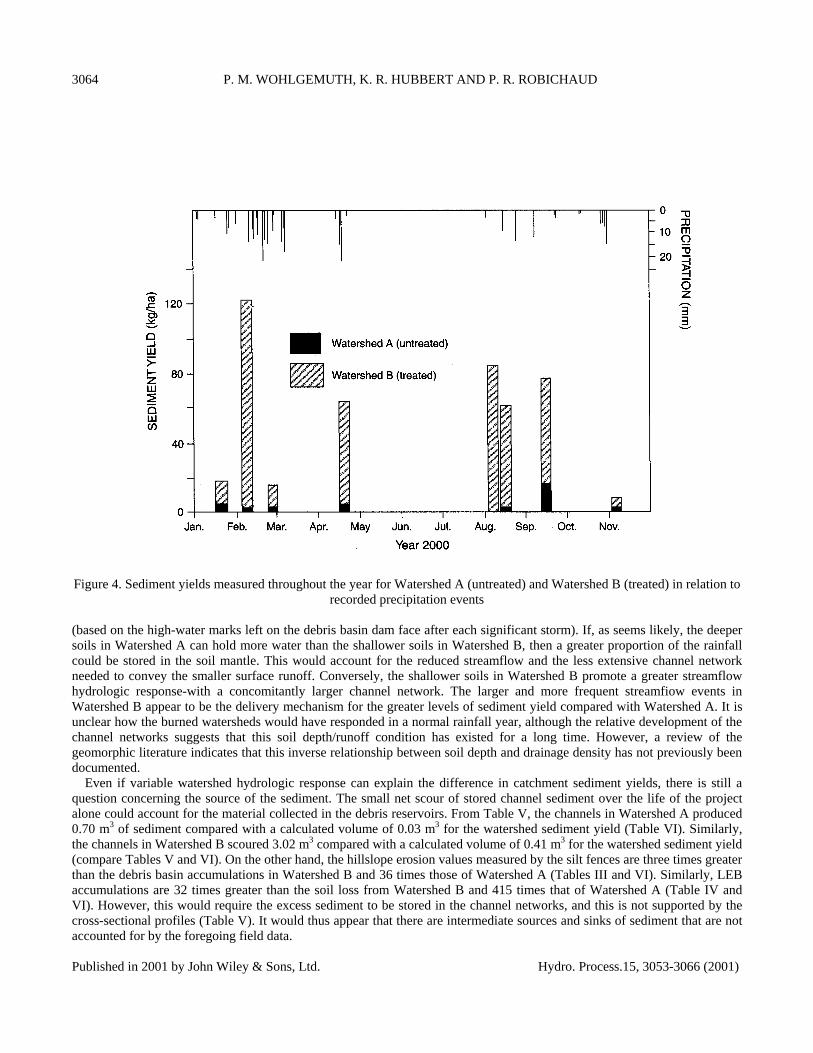
Sediment yield is the integrated output of sediment from a watershed unit. Sediment is stripped off the hillslopes, scoured out of the channels, and transported to the watershed outlet. Sediment yield reflects the complicated balance of rainfall amounts and intensities, hillslope erosion, and channel scour and ,fill. One significant finding of this project is the great disparity in sediment yield between the two study watersheds. Rain-derived streamflow is the only mechanism by which sediment can be delivered to the debris basins. Unfortunately, there is no simple relationship between either rainfall totals orintensities that appears to govern sediment yield (see Table VI). Over half the total sediment yield in Watershed A was the result of a single thunderstorm on September 7, 2000, with total depth and peak intensity that were singularly unspectacular (Figure 4).
Two catchments with similar attributes are often compared to evaluate the effectiveness of a management practice. If all other physical factors are constant, any differences in erosional response should reflect the watershed treatment (i.e. the LEBs). However, the conclusion that the relatively large sediment yields in Watershed B are produced by the LEBs is counterintuitive and not supported by observations in the field. The higher level of watershed disturbance associated with LEB installation did not appear to be the source of the higher levels of sediment yield. Moreover, the performance evaluations of the LEBs indicate that treatment failure was not the cause of accelerated watershed erosion. Thus, if the treatment was not responsible for the observed watershed differences, then the physical factors between the two catchments must not have been constant, which was the case.
Although many of the environmental characteristics between the study watersheds were very similar, some important ones differed. Watershed size and topography, fire severity, soil non-wettability, vegetation cover, and rainfall amounts and intensities were virtually identical across the two study catchments. Lacking any field evidence to the contrary, hillslope erosion must also be treated as uniform across the study area. In fact, the only major differences between the two watersheds are the soil depths and the drainage densities. These factors are related, and together may account for the disparity in watershed sediment yield.
The drainage network in Watershed B is much more extensive than the channel system in Watershed A (the total length of channels is 219 m as opposed to 93 m in comparably sized watersheds). The hillslope soil depths in Watershed B are only about half as deep as those in Watershed A (Table I). Further, although runoff was never recorded, streamflow was consistently greater in Watershed B compared with Watershed A
Published in 2001 by John Wiley & Sons, Ltd. Hydrol. Process.15, 3053-3066 (2001)
3064 P. M. WOHLGEMUTH, K. R. HUBBERT AND P. R. ROBICHAUD
Figure 4. Sediment yields measured throughout the year for Watershed A (untreated) and Watershed B (treated) in relation to recorded precipitation events
(based on the high-water marks left on the debris basin dam face after each significant storm). If, as seems likely, the deepersoils in Watershed A can hold more water than the shallower soils in Watershed B, then a greater proportion of the rainfall could be stored in the soil mantle. This would account for the reduced streamflow and the less extensive channel network needed to convey the smaller surface runoff. Conversely, the shallower soils in Watershed B promote a greater streamflow hydrologic response-with a concomitantly larger channel network. The larger and more frequent streamfiow events in Watershed B appear to be the delivery mechanism for the greater levels of sediment yield compared with Watershed A. It is unclear how the burned watersheds would have responded in a normal rainfall year, although the relative development of the channel networks suggests that this soil depth/runoff condition has existed for a long time. However, a review of the geomorphic literature indicates that this inverse relationship between soil depth and drainage density has not previously been documented.
Even if variable watershed hydrologic response can explain the difference in catchment sediment yields, there is still a question concerning the source of the sediment. The small net scour of stored channel sediment over the life of the project alone could account for the material collected in the debris reservoirs. From Table V, the channels in Watershed A produced 0.70 m3 of sediment compared with a calculated volume of 0.03 m3 for the watershed sediment yield (Table VI). Similarly, the channels in Watershed B scoured 3.02 m3 compared with a calculated volume of 0.41 m3 for the watershed sediment yield (compare Tables V and VI). On the other hand, the hillslope erosion values measured by the silt fences are three times greater than the debris basin accumulations in Watershed B and 36 times those of Watershed A (Tables III and VI). Similarly, LEB accumulations are 32 times greater than the soil loss from Watershed B and 415 times that of Watershed A (Table IV and VI). However, this would require the excess sediment to be stored in the channel networks, and this is not supported by the cross-sectional profiles (Table V). It would thus appear that there are intermediate sources and sinks of sediment that are notaccounted for by the foregoing field data.
Published in 2001 by John Wiley & Sons, Ltd. Hydro. Process.15, 3053-3066 (2001)
EFFECTS OF LOG EROSION BARRIERS ON POST-FIRE HYDROLOGY AND SEDIMENT YIELD 3065
SUMMARY AND CONCLUSIONS
Two study watersheds were instrumented after the Mixing Fire in the San Jacinto Mountains of southern California to quantify post-fire hydrologic and erosion response, and to assess the performance of LEBs as an erosion control measure. These values, in units of kilograms per hectare, are small compared with the results of similar research throughout the region,and may reflect the effects of below-normal rainfall. The first-year LEB assessments indicate that treatment implementation was excellent, and nearly 90% of the LEBs performed as planned. However, because of the low rainfall and the minor hillslope erosion, the LEBs were not subjected to design storm conditions. It is unclear how the LEBs would have performed in a normal or above-normal rainfall year. Also, because of the huge variation in watershed hydrologic response, it is difficultto evaluate the treatment effectiveness of LEBs as a management practice. The test of LEB effectiveness was inconclusive in this study, because soil depth and soil water-holding capacity may have masked their performance. In order to ascertain the treatment effect, the influences of the inherent site characteristics must first be normalized across both watersheds. Normalization is difficult for such spatially variable data, no pretreatment calibration, and a sample size of one. However, theinformation from this project for subsequent years will put this initial data into the larger context and may help answer thesebroader questions.
ACKNOWLEDGEMENTS
We thank the Joint Fire Sciences Committee and the Burned Area Emergency Rehabilitation program of the USDA Forest Service for funding this research. We also thank the Fire and Resource divisions of the San Bernardino National Forest, as well as Department of Agriculture technicians from Idaho and California, for providing coordination and labour for initial site establishment. We further thank the Forest Service scientists and professionals who consulted with us in the field on various aspects of this research project. Moreover, we thank the anonymous reviewers whose comments and insights greatly improved the manuscript.
REFERENCES
Anderson HW. 1949. Does burning increase surface runoff? Journal of Forestry 47: 54-57. Baker Jr MB. 1990. Hydrologic and water quality effects of fire. In Effects of Fire Management on Southwestern Natural
Resources, Krammes JS (tech. coord.). USDA Forest Service Gen. Tech. Report RM-191. Rocky Mountain Research Station: Ft Collins, CO; 31-42.
Booker FA, Dietrich WE, Collins LM. 1993. Runoff and erosion after the Oakland firestorm. California Geology 46:159-173.
Campbell AG, Wohlgemuth PM, Wells II WG. 1987. Post-fire response of a boulder-bed channel. In Erosion and Sedimentation on the Pacific Rim, Beschta RL et al. (eds). International Association of Hydrological Sciences: Washington, DC; 277-278.
Clayton JL, Arnold JF. 1972. Practical grain size, fracturing density, and weathering classification of intrusive rocks of the Idaho batholith. USDA Forest Service Gen. Tech. Report INT-2. Intermountain Forest Range Experiment Station: Ogden, UT.
DeBano LF. 1981. Water repellent soils: a state-of-the-art. UDSA Forest Service Gen. Tech. Report PSW-46. Pacific Southwest Forest Range Experiment Station: Berkeley, CA.
DeBano LF, Neary DG, Ffolliet PF. 1998. Fire's Effects on Ecosystems. John Wiley & Sons: New York. Florsheim JL, Keller EA, Best DW. 1991. Fluvial sediment transport in response to moderate storm flows following
chaparral wildfire, Ventura County, southern California. Geological Society of America Bulletin 103: 504-511. Hamilton EL, Rowe PB. 1949. Rainfall interception by chaparral in California. USDA Forest Service Report California
Forest Range Experiment Station: Berkeley, CA. Hamilton EL, Horton JS, Rowe PB, Reimann LF. 1954. Fire-flood sequences on the San Dimas Experimental Forest. USDA
Forest Service Tech. Paper No. 6. California Forest Range Experiment Station: Berkeley, CA. Heede BH, Harvey MD, Laird JR. 1988. Sediment delivery linkages in a chaparral watershed following a wildfire.
Environmental Management 12: 349-358. Hibbert AR. 1985. Storm runoff and sediment production after wildfire in chaparral. In Hydrology and Water Resources in
Arizona and the Southwest, American Water Research Association: Las Vegas, NV; 31-42. Hillel D. 1982. Introduction to Soil Physics. Academic Press, Inc.: San Diego, CA. Jones DP, Graham RC. 1993. Water-holding characteristics of weathered granitic rock in chaparral and forest ecosystems.
Published in 2001 by John Wiley & Sons, Ltd. Hydrol. Process.15, 3053-3066 (2001)

3066 P. M. WOHLGEMUTH, K. R. HUBBERT AND P. R. ROBICHAUD
Soil Science Society of America Journal 57: 256-261. Kraebel CJ. 1934. The La Crescenta flood. American Forests 40: 251-254, 286-287. Krammes JS. 1960. Erosion from mountain side slopes after fire in southern California. USDA Forest Service Research Note
171. Pacific Southwest Forest Range Experiment Station: Berkeley, CA. Pase CP, Ingebo PA. 1965. Burned chaparral to grass: early effects on water and sediment yields from two granitic soil
watersheds in Arizona. In Arizona Watersheds. Arizona Water Board: Tempe, AZ; 8-11. Rice RM. 1974. The hydrology of chaparral watersheds. In Living with the Chaparral. Sierra Club: San Francisco; 27-34. Robichaud PR. 1996. Spatially-varied erosion potential from harvested hillslopes after prescribed fire in the interior
Northwest. PhD dissertation, University of Idaho. Robichaud PR, Beyers JL, Neary DG. 2000. Evaluating the effectiveness of postfire rehabilitation treatments. USDA Forest
Service Gen. Tech. Report RMRS-63. Rocky Mountain Research Station: Ft Collins, CO. Rowe PB, Countryman CM, Storey HC. 1954. Hydrologic analysis used to determine effects of fire on peak discharge and
erosion rates in southern California watersheds. USDA Forest Service Report California Forest Range Experiment Station: Berkeley, CA.
Wells II WG. 1981. Some effects of brushfires on erosion processes in coastal southern California. In Erosion and SedimentTransport in Pacific Rim Steeplands, Davies TRH, Pearce AJ (eds). International Association of Hydrological Sciences: Washington, DC; 305-342.
Wohlgemuth PM. 2001. Prescribed fire as a sediment management tool in southern California chaparral watersheds. In Seventh Federal Interagency Sedimentation Conference. Interagency Advisory Committee on Water Data, Sedimentation Subcommittee: Washington, DC; x-49-x-56.
Published in 2001 by John Wiley & Sons, Ltd. Hydrol. Process. 15, 3053-3066 (2001)