Money, the Commons, and Growth Oct. 24, 2003 Gary Flomenhoft Gund Institute.
date post
19-Dec-2015Category
view
217download
0
Hubbert and the Oil PeakVT Law SchoolClass 2
Gary Flomenhofthttp://www.uvm.edu/~gflomenh/VTLAW-EcoEcon

The “OIL PEAK”

Source: Smil (1991)

0
25
50
75
100
1800 1825 1850 1875 1900 1925 1950 1975 2000
Composition of U.S. Energy UseComposition of U.S. Energy Use
wood
animal feed
coal
oil
gas
electricity
Per
cen
t o
f to
tal
ener
gy
use

World GDP and CO2
$1
$10
$100
$1,000
$10,000
$100,000
1000

Energy Rate of Return

Energy Densities of Fuels
Fuel Energy Density (Mj/kg)
Peats, green wood, grasses 5.0-10.0Crop residues, air-dried wood 12.0-15.0Bituminous coals 18.0-25.0Charcoal, anthracite coals 18.0-32.0Crude oils 40.0-44.0
0%
20%
40%
60%
80%
100%
1850 1870 1890 1910 1930 1950
Fuel
DomesticatedAnimals
Labor
Work Done in the U.S. Economy, 1850-1970
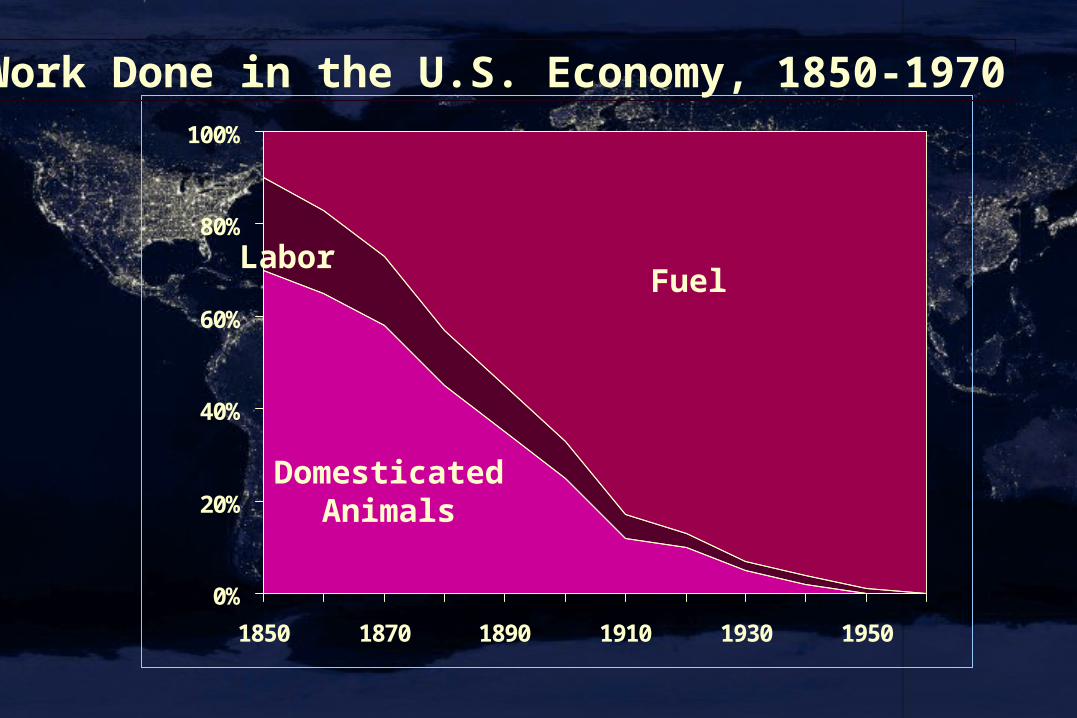
The Epoch of Fossil Fuel Exploitation(after Hubbert, 1969)
0-5 -4 -3 -2 -1 +1 +2 +3 +4 +5
Iron inMiddleEast
StonehengeBuilt
Parthenoncompleted
Pyramidsconstructed
Mayanculture
Inquisition
BlackDeath
Magellan'sCircumnavigation
Steam Engine
100
200
300
Tri
llio
n k
wh
per
yea
r
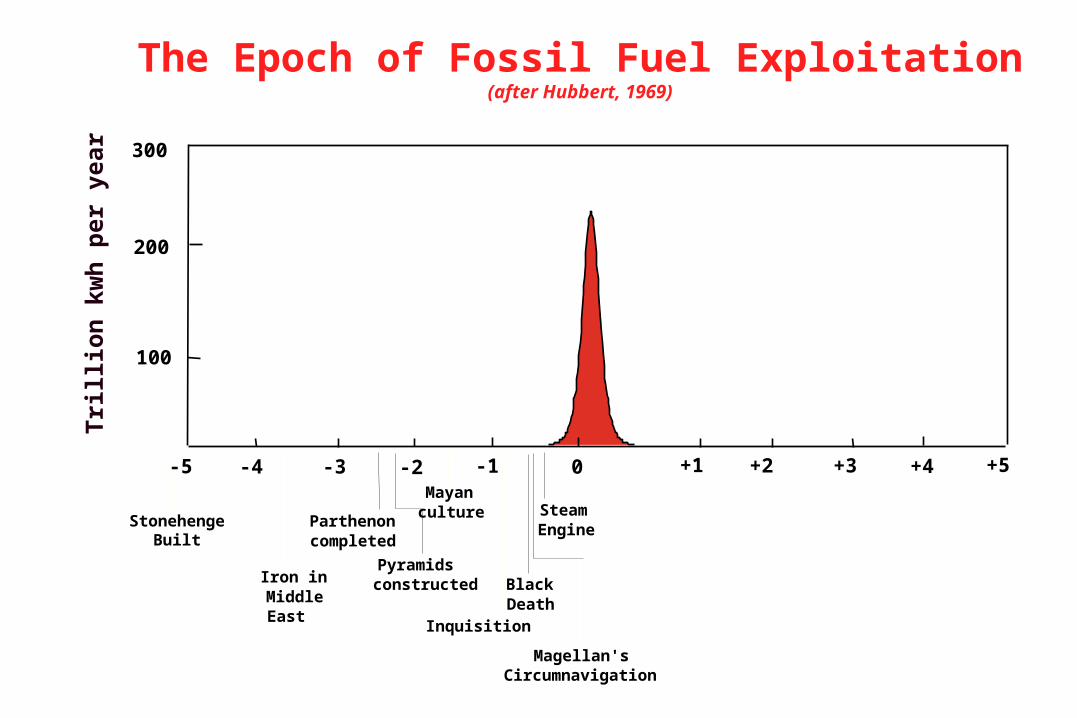
Hubbert Oil Cycle

US Oil Extraction
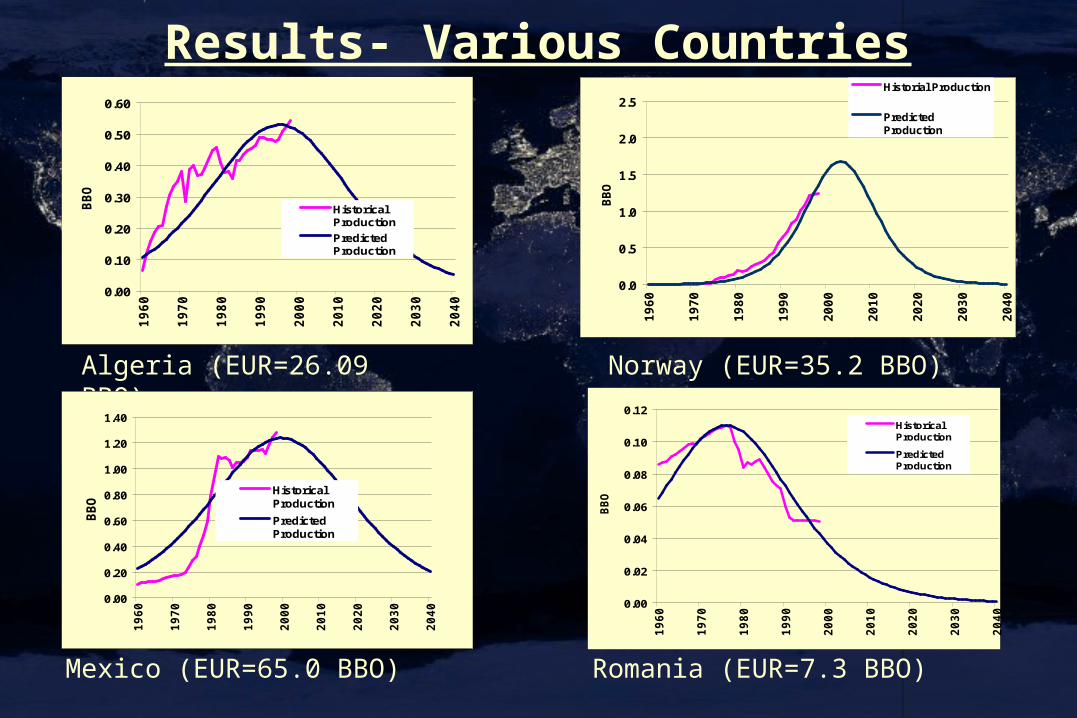
Results- Various Countries
Algeria (EUR=26.09 BBO)
Mexico (EUR=65.0 BBO)
Norway (EUR=35.2 BBO)
Romania (EUR=7.3 BBO)
0.00
0.10
0.20
0.30
0.40
0.50
0.60
19
60
19
70
19
80
19
90
20
00
20
10
20
20
20
30
20
40
BB
O
HistoricalProduction
PredictedProduction
0.0
0.5
1.0
1.5
2.0
2.5
19
60
19
70
19
80
19
90
20
00
20
10
20
20
20
30
20
40
BB
O
Historial Production
PredictedProduction
0.00
0.02
0.04
0.06
0.08
0.10
0.12
1960
1970
1980
1990
2000
2010
2020
2030
2040
BB
O
HistoricalProduction
PredictedProduction
0.00
0.20
0.40
0.60
0.80
1.00
1.20
1.40
19
60
19
70
19
80
19
90
20
00
20
10
20
20
20
30
20
40
BB
O
HistoricalProduction
PredictedProduction

World Oil Extraction

Various National Patterns United States (EUR = 286 BBO)
02468
101214
1980 1990 2000 2010 2020 2030 2040Bil
lio
n B
arr
els
per
Year
Production
Demand
USA – E.g.. of a net consumer
Venezuela – E.g. of a net producer
High reserves (~ 3000 BBO) and low economic growth scenario
Venezuela (EUR = 95.71 BBO)
0
0.5
1
1.5
2
1980 1990 2000 2010 2020 2030 2040
Bill
ion
barr
els
per
year
Production
Demand
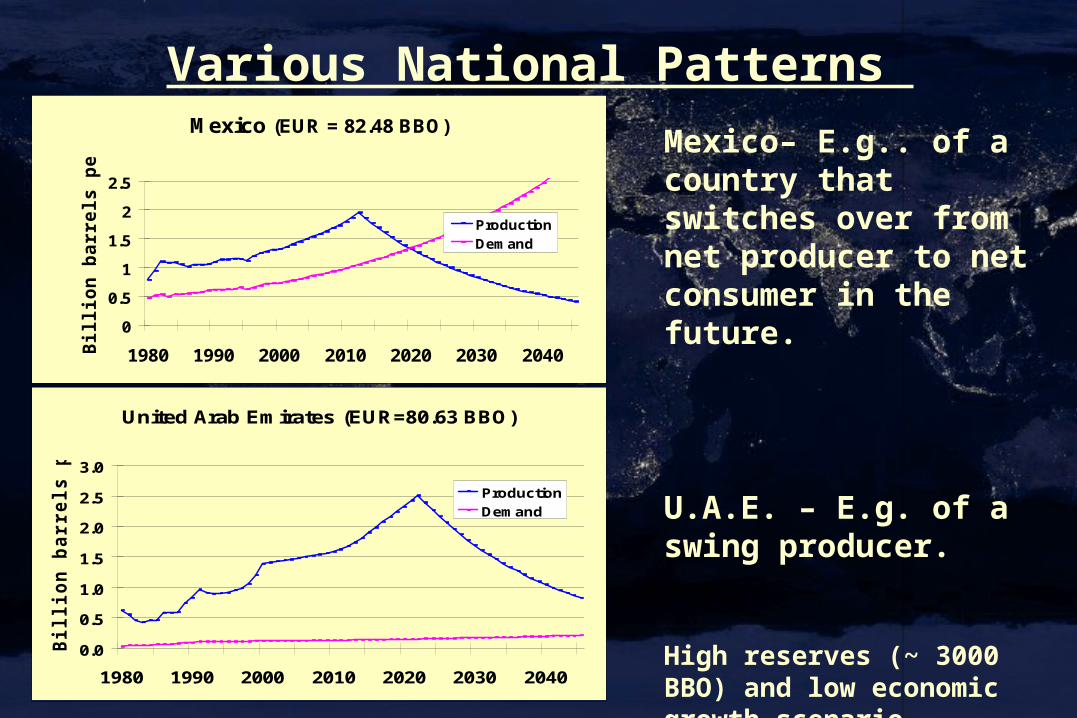
Various National Patterns
United Arab Emirates (EUR=80.63 BBO)
0.0
0.5
1.0
1.5
2.0
2.5
3.0
1980 1990 2000 2010 2020 2030 2040
Bil
lio
n b
arr
els
pe
r y
ea
r
Production
Demand
Mexico (EUR = 82.48 BBO)
0
0.5
1
1.5
2
2.5
1980 1990 2000 2010 2020 2030 2040Bil
lio
n b
arr
els
pe
r y
ea
r
ProductionDemand
Mexico– E.g.. of a country that switches over from net producer to net consumer in the future.
U.A.E. – E.g. of a swing producer.
High reserves (~ 3000 BBO) and low economic growth scenario
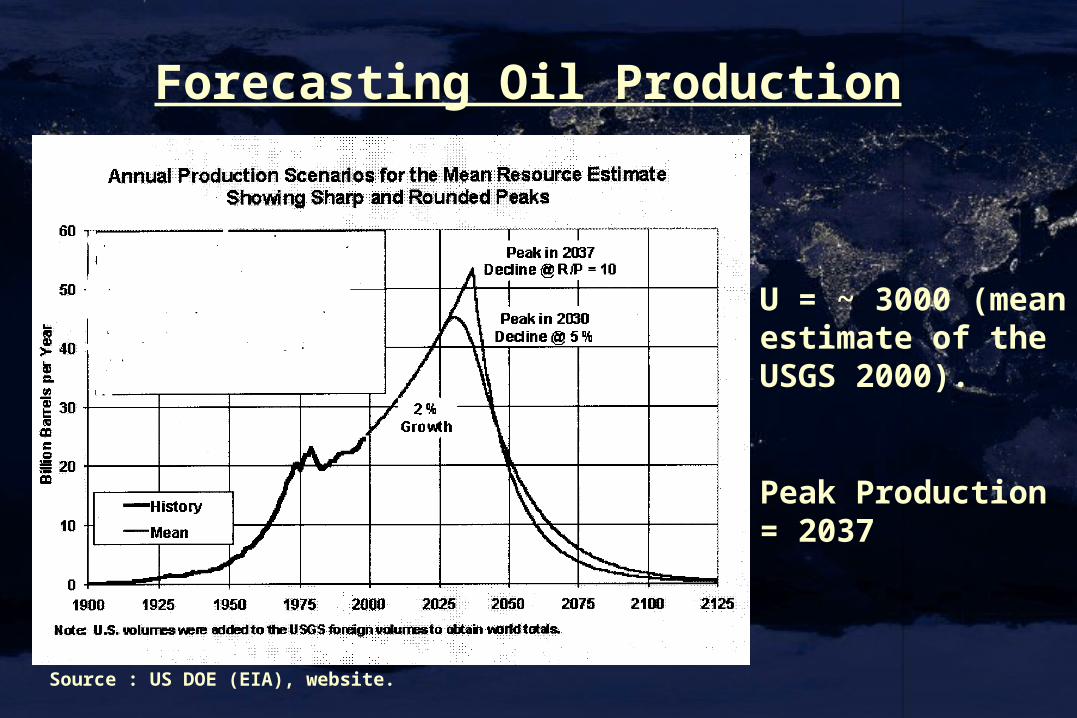
Forecasting Oil Production
Source : US DOE (EIA), website.
U = ~ 3000 (mean estimate of the USGS 2000).
Peak Production = 2037

World Oil Extraction

World Oil Extraction

World Oil Consumption
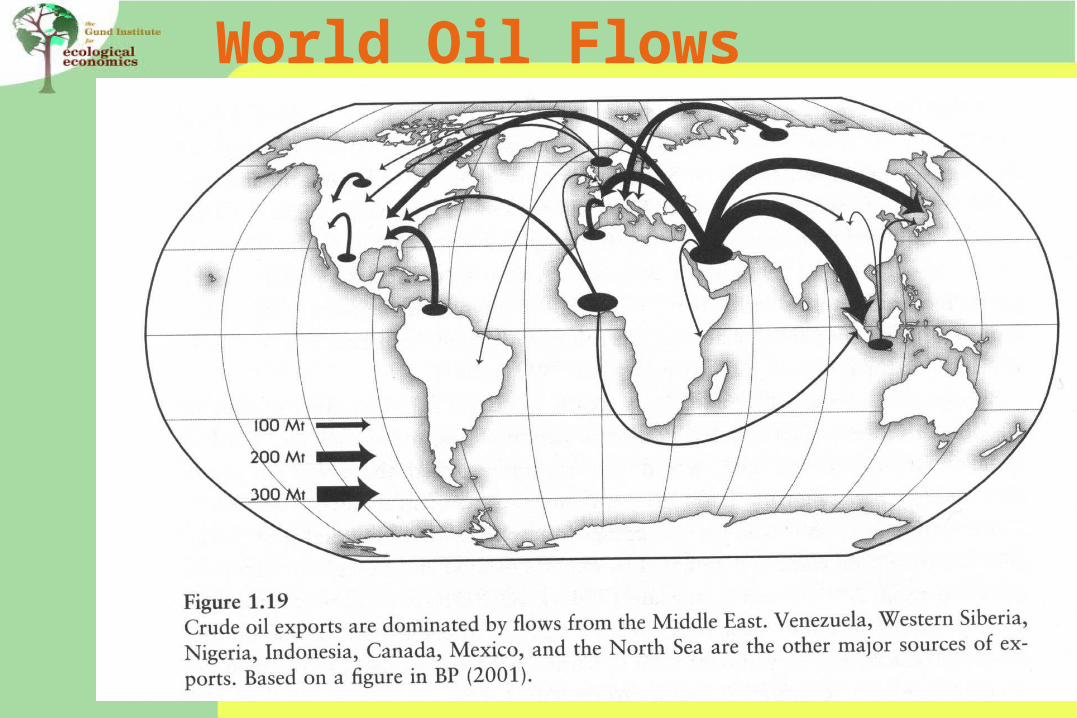
World Oil Flows

•Julian Simon view: technological Julian Simon view: technological developments and human ingenuity will developments and human ingenuity will yield more resourcesyield more resources
–““Drowning in oil” Drowning in oil” The EconomistThe Economist, March 6, March 6thth--1212thth 1999, pp. 23-25 1999, pp. 23-25
•Colin Campbell, et al. use Hubbert curves Colin Campbell, et al. use Hubbert curves to predict the end of oilto predict the end of oil
–““The End of Cheap Oil” The End of Cheap Oil” Scientific AmericanScientific American, , March 1998, pp. 78-83 (Campbell and March 1998, pp. 78-83 (Campbell and Laherrere)Laherrere)
Two ViewsTwo Views
S. GS. Gürcan Gülen, ürcan Gülen, Ph.D.Ph.D.

Real Price of Oil since 1869
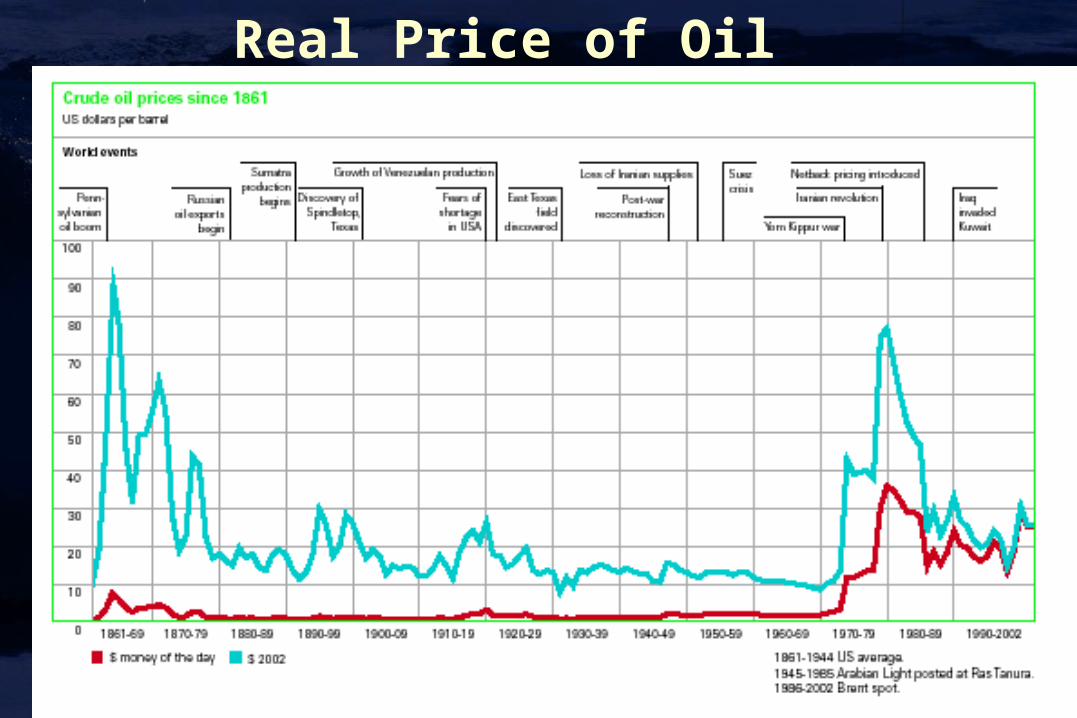
Real Price of Oil since 1869

Oil Reserve/Production ratio

Oil Reserves

“Proven” oil reserves

Natural Gas Reserves

Natural Gas Reserves

Coal Reserves

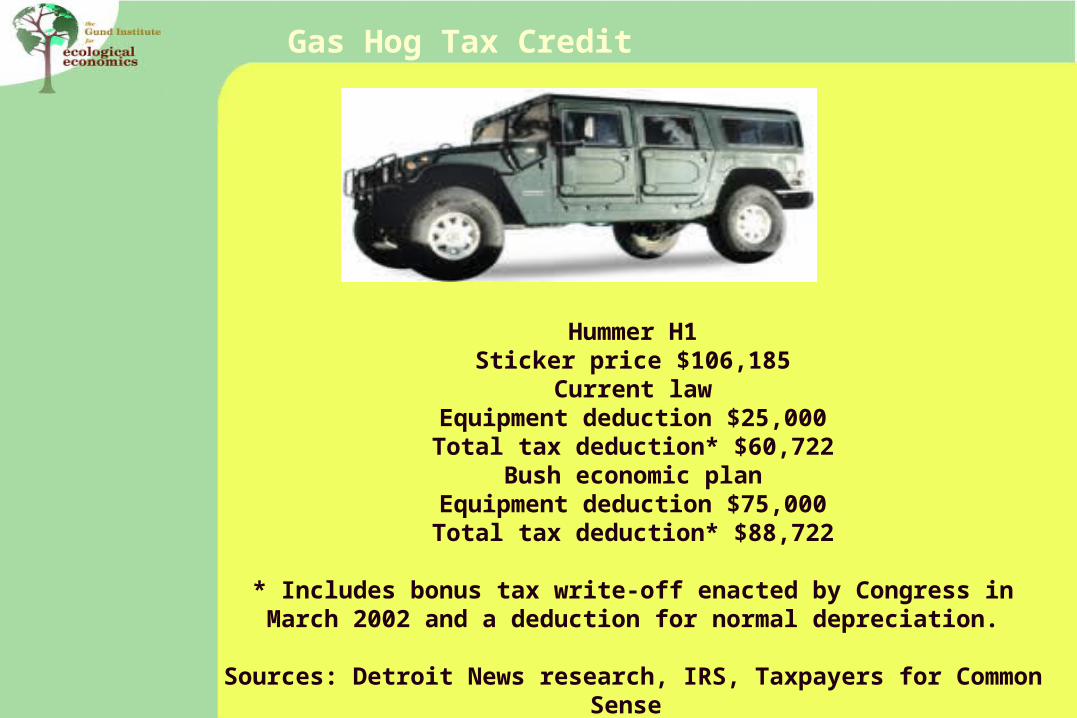
Hummer H1Sticker price $106,185
Current lawEquipment deduction $25,000Total tax deduction* $60,722
Bush economic planEquipment deduction $75,000Total tax deduction* $88,722
* Includes bonus tax write-off enacted by Congress in March 2002 and a deduction for normal depreciation.
Sources: Detroit News research, IRS, Taxpayers for Common Sense
Gas Hog Tax Credit
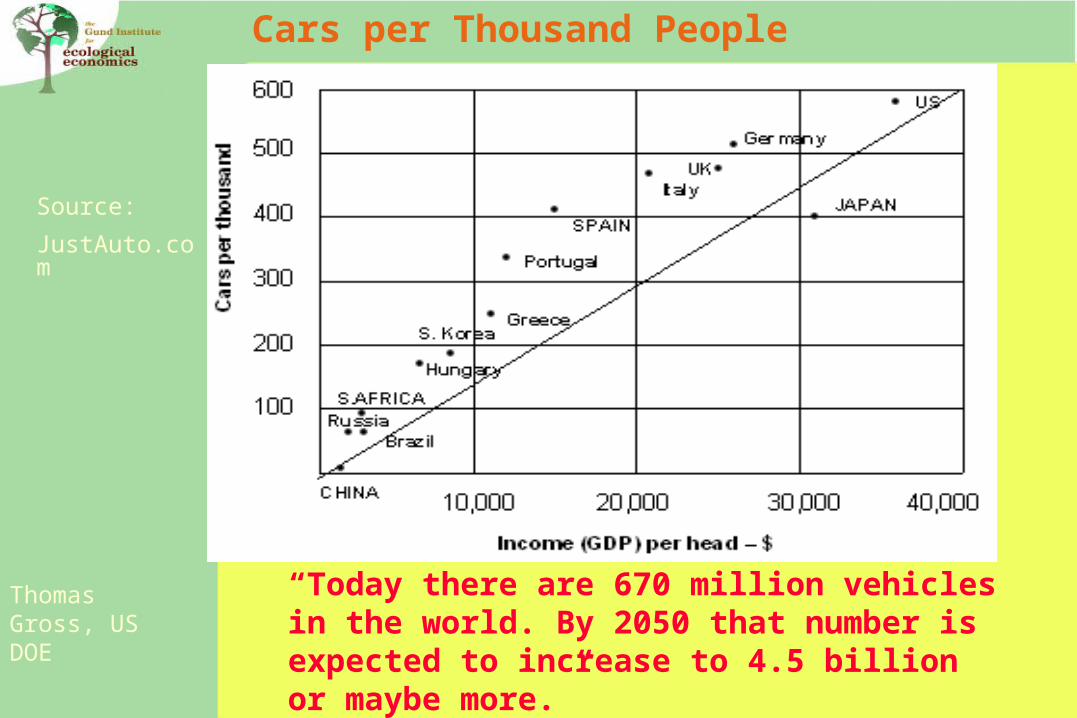
Cars per Thousand People
Source:
JustAuto.com
“Today there are 670 million vehicles in the world. By 2050 that number is expected to increase to 4.5 billion or maybe more.”
Thomas Gross, US DOE
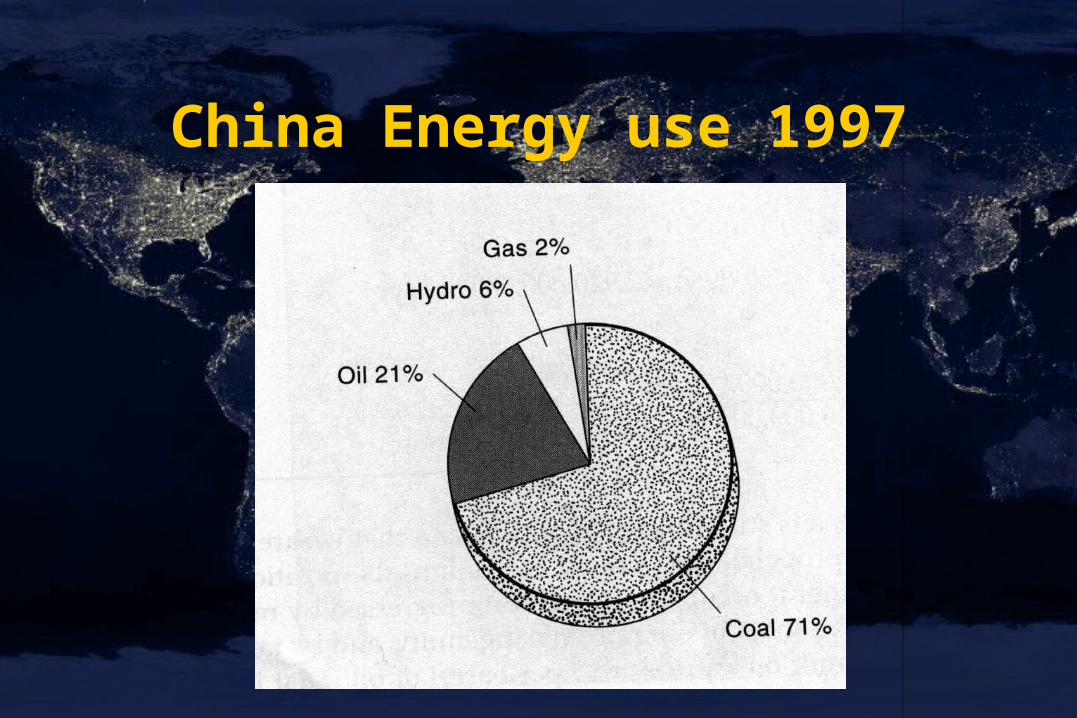
China Energy use 1997

Source: EPA

Heinberg Chapter 1
How to gain an Energy Subsidy
1)Takeover
2)Tool Use
3)Specialization
4)Scope Enlargement
5)Drawdown
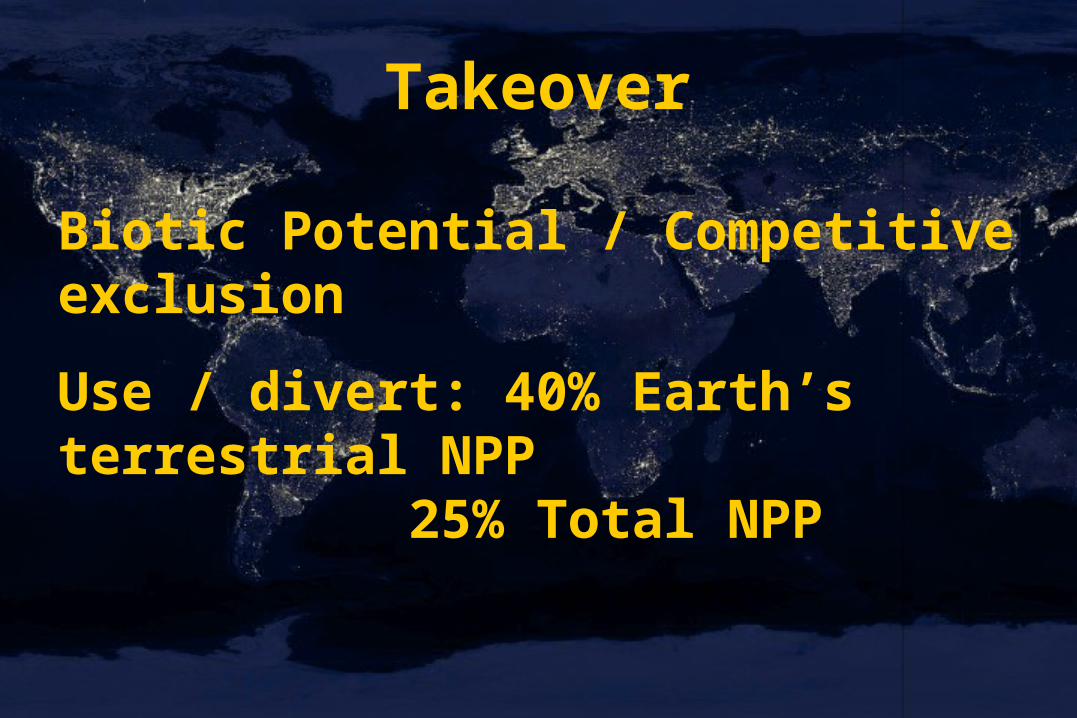
Takeover
Biotic Potential / Competitive exclusion
Use / divert: 40% Earth’s terrestrial NPP 25% Total NPP
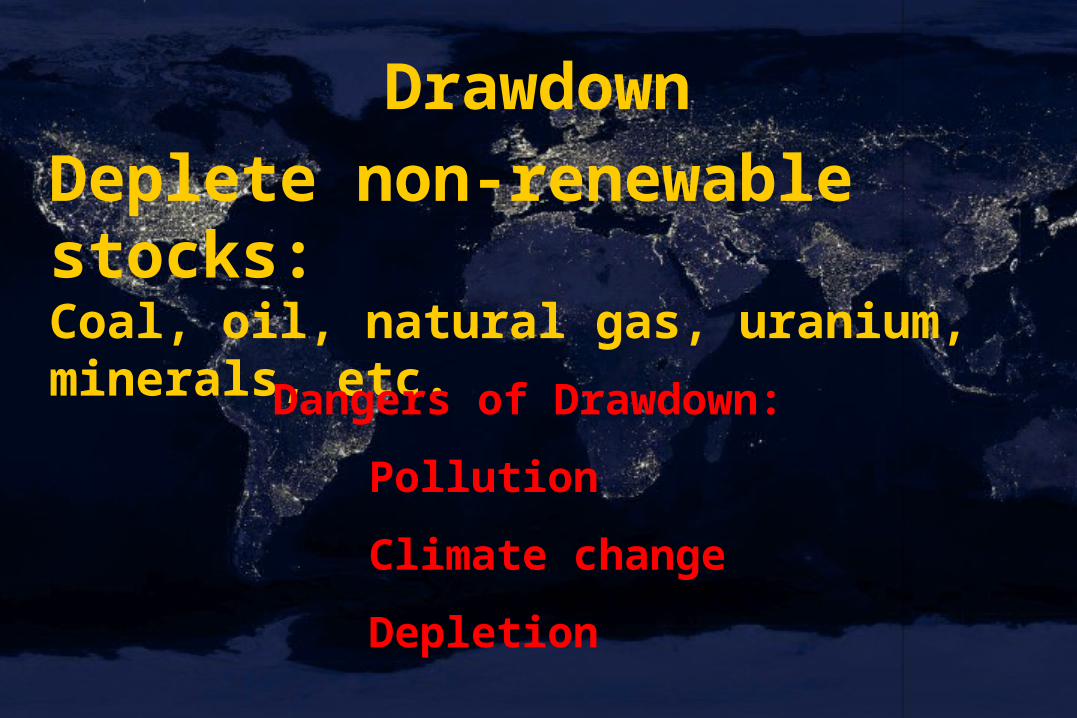
Drawdown
Deplete non-renewable stocks:Coal, oil, natural gas, uranium, minerals, etc.
Dangers of Drawdown:
Pollution
Climate change
Depletion
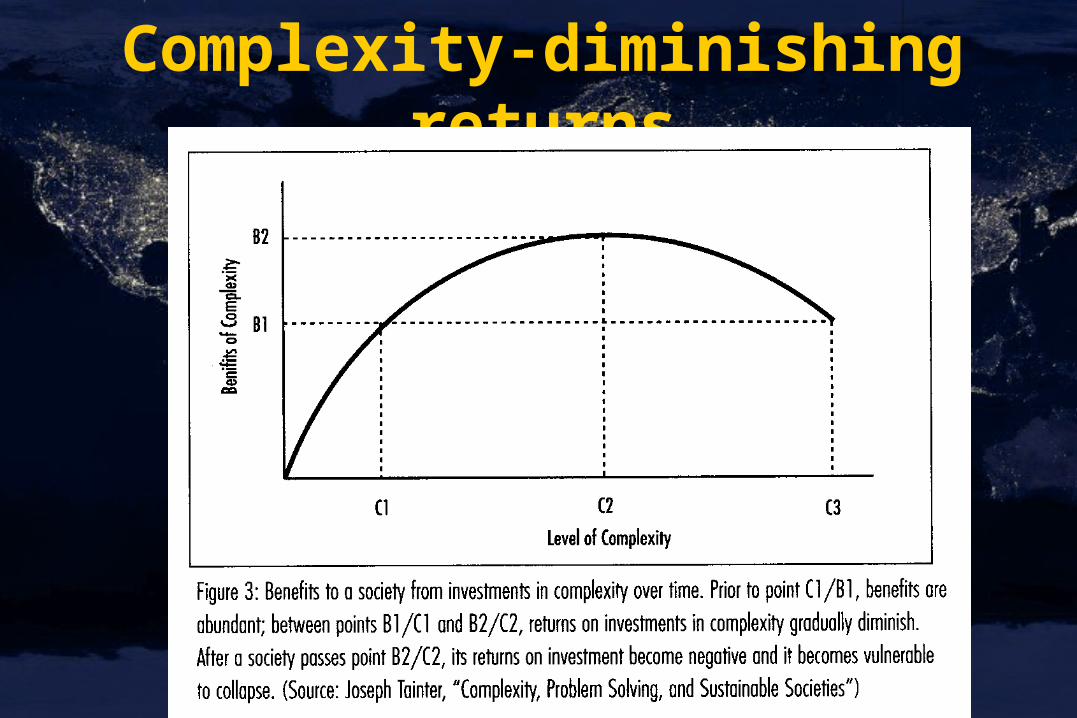
Complexity-diminishing returns
Complexity
Increasing costs of:Maintaining organization and controlControlling conquered territoryTaxation
American success
Great natural resourcesEnergy subsidies: slaves then fossil fuelsGlobal trade


Other Extinct cultures
Rapa Nui- (Easter Island)MangaiaMangerevaPitcairnHenderson
Exception:Tikopia