The Effect of University Campus Recreation Programs on ...
110
Eastern Kentucky University Encompass Online eses and Dissertations Student Scholarship January 2014 e Effect of University Campus Recreation Programs on Student Retention Caelin Sco Eastern Kentucky University Follow this and additional works at: hps://encompass.eku.edu/etd Part of the Higher Education Commons is Open Access Dissertation is brought to you for free and open access by the Student Scholarship at Encompass. It has been accepted for inclusion in Online eses and Dissertations by an authorized administrator of Encompass. For more information, please contact [email protected]. Recommended Citation Sco, Caelin, "e Effect of University Campus Recreation Programs on Student Retention" (2014). Online eses and Dissertations. 315. hps://encompass.eku.edu/etd/315
Transcript of The Effect of University Campus Recreation Programs on ...

Eastern Kentucky UniversityEncompass
Online Theses and Dissertations Student Scholarship
January 2014
The Effect of University Campus RecreationPrograms on Student RetentionCaelin ScottEastern Kentucky University
Follow this and additional works at: https://encompass.eku.edu/etd
Part of the Higher Education Commons
This Open Access Dissertation is brought to you for free and open access by the Student Scholarship at Encompass. It has been accepted for inclusionin Online Theses and Dissertations by an authorized administrator of Encompass. For more information, please contact [email protected].
Recommended CitationScott, Caelin, "The Effect of University Campus Recreation Programs on Student Retention" (2014). Online Theses and Dissertations.315.https://encompass.eku.edu/etd/315


THE EFFECT OF UNIVERISTY CAMPUS RECREATION PROGRAMS ON
STUDENT RETENTION
By
CAELIN BRYCE SCOTT
Master of Science
Eastern Kentucky University
Richmond, Kentucky
2010
Bachelor of Science
Eastern Kentucky University
Richmond, Kentucky
2007
Submitted to the Faculty of the Graduate School
Eastern Kentucky University
In partial fulfillment of the requirements
For the degree of
DOCTOR OF EDUCATION
December, 2014

Running head: EFFECT OF UNIVERSITY CAMPUS RECREATION PROGRAMS
ii
Copyright © Caelin Bryce Scott, 2014
All Rights Reserved

Running head: EFFECT OF UNIVERSITY CAMPUS RECREATION PROGRAMS
iii
DEDICATION
This dissertation is dedicated to my husband Zach. Thank you for your love and support
as I focused my energy towards this degree. I could not have completed this program
without all the encouragement you provided.

Running head: EFFECT OF UNIVERSITY CAMPUS RECREATION PROGRAMS
iv
ACKNOWLEDGEMENTS
I would like to thank my husband, Zach, for his love and support. Thank you for
your encouragement and emotional support throughout this process and never allowing
me to settle for anything but the best. Without your support and giving me the added
strength and determination to complete this dissertation I would have not been successful.
I would also like to thank my friends and family for their support through this process.
To my chair, Dr. Charles Hausman, I appreciate your guidance, dedication and
devotion that helped me reach to this point. I would also like to thank my other
committee members, Dr. James Bliss, Dr. Ryan Sharp, and Dr. Ryan Wilson for their
support. Also, I would like to thank Dr. Jessica Hearn for her support during the process
as well. All of their guidance and assistance as committee members over this project is
truly appreciated.
To my classmates, a special thank you for all your encouragement, support and
the life-long friendships we have built throughout this process.

Running head: EFFECT OF UNIVERSITY CAMPUS RECREATION PROGRAMS
v
ABSTRACT
This study examined the effect campus recreation programs have on student retention for
full-time freshman students at Eastern Kentucky University. Gender, first-generation,
non-traditional students and participation in recreation programs were used as predictor
variables for the purpose of this study. Data were collected from Eastern Kentucky
University’s campus recreation database on the utilization of general gym facility use,
Adventure Programs, and Intramural Sports. The analysis of the results revealed that the
retention rates of students who participated in campus recreation programs were higher
than the students who did not participate in campus recreation programs had a higher
retention rate than students who did not participate. Recommendations for policy
implications and future research are provided.

Running head: EFFECT OF UNIVERSITY CAMPUS RECREATION PROGRAMS
vi
TABLE OF CONTENTS
CHAPTER PAGE
I. INTRODUCTION ........................................................................................................... 1
Problem Statement .............................................................................................................. 1
General Background ........................................................................................................... 1
Rationale for Campus Recreation Programs ....................................................................... 3
Value of Recreational Sports on Campus ........................................................................... 6
Theoretical Framework for Student Involvement in Recreation ........................................ 8
Rationale for the Study ..................................................................................................... 11
Purpose of the Study ......................................................................................................... 13
Research Questions ........................................................................................................... 14
Significance of the Study .................................................................................................. 14
Study Limitations .............................................................................................................. 15
Definitions of Terms ......................................................................................................... 15
II. LITERATURE REVIEW ............................................................................................. 18
Review of Literature ......................................................................................................... 18
History of Recreational Sports ...................................................................................... 19
Theories of Involvement ............................................................................................... 21
Recruitment ................................................................................................................... 24
Health Benefits of Exercise ........................................................................................... 25
Stress Reduction ........................................................................................................ 25
Physical Fitness ......................................................................................................... 26
Personal Development ............................................................................................... 29
Differences in Retention Rates by Student Characteristics ........................................... 30
First Generation and Retention .................................................................................. 30
Non-Traditional Students and Retention ................................................................... 31
Gender and Retention ................................................................................................ 32
Summary ....................................................................................................................... 32

Running head: EFFECT OF UNIVERSITY CAMPUS RECREATION PROGRAMS
vii
III. METHODS ................................................................................................................. 34
Methods............................................................................................................................. 34
Purpose .......................................................................................................................... 34
Research Questions ....................................................................................................... 34
Context of the Study ...................................................................................................... 35
Campus Overview ......................................................................................................... 35
Campus Recreational Facility and Programs Overview ............................................... 36
Participants .................................................................................................................... 37
Sample ........................................................................................................................... 37
Data Collection .............................................................................................................. 38
Research Design and Analysis ...................................................................................... 38
Variables........................................................................................................................ 39
Limitations of the Study ................................................................................................ 40
IV. RESULTS ................................................................................................................... 41
Results ............................................................................................................................... 41
Differences in Gym Use by Student Characteristics ..................................................... 42
Differences in Gym Use by Gender .......................................................................... 42
Differences in Gym Use by First-Generation Status ................................................. 43
Differences in Gym Use by Non-Traditional Status ................................................. 45
Differences in Adventure Program Participation by Student Characteristics ............... 52
Differences in Adventure Programs by Gender ........................................................ 53
Differences in Adventure Programs Participation by First-Generation Status .......... 54
Differences in Adventure Programs Participation by Non-Traditional Status .......... 55
Differences in Intramural Sports Participation by Student Characteristics ................... 61
Differences in Intramural Sports Participation by Gender ........................................ 64
Differences in Intramural Sport Participation by First-Generation Status ................ 65
Differences in Intramural Sports Participation by Non-Traditional Status ............... 66
V. DISCUSSION .............................................................................................................. 72
Overview ................................................................................................................... 72
Summary of the Study ............................................................................................... 72
Interpretation of Results ............................................................................................ 73

Running head: EFFECT OF UNIVERSITY CAMPUS RECREATION PROGRAMS
viii
Implications for Policy and Practice .......................................................................... 76
Future Research ......................................................................................................... 78
Conclusion ................................................................................................................. 81
References ......................................................................................................................... 83
Appendices ........................................................................................................................ 94
Appendix A: Institutional Review Board Approval .................................................. 94
Vita ................................................................................................................................ 96

Running head: EFFECT OF UNIVERSITY CAMPUS RECREATION PROGRAMS
ix
LIST OF TABLES
TABLE……………………………………………………………………………....PAGE
4.1: Crosstabulation: Gym Visits by Gender .....................................................................42
4.2: Mean Number of Gym Visits by Gender ....................................................................43
4.3 Crosstabluation: Gym Visits by First Generation Status .............................................44
4.4: Mean Number of Gym Visits by First Generation Status ...........................................45
4.5: Crosstabulation: Gym Visits by Non-Traditional Status ............................................46
4.6: Mean Number of Gym Visits by Non-Traditional Status ...........................................47
4.7: Percent Retained by Participation by Gym Visits or Not ...........................................48
4.8: Test of Between-Subjects Effects: Gym Visits...........................................................49
4.9: Estimated Marginal Means: Gym Visits .....................................................................50
4.10: Regression: Retention ...............................................................................................51
4.11: Adventure Programs Participation by Student Characteristics .................................53
4.12: Crosstabulation: Adventure Program Participation by Gender ................................54
4.13: Crosstabulation: Adventure Program Participation by First Generation Status .......55
4.14: Crosstabulation: Adventure Program Participation by Non-Traditional Status .......56
4.15: Percent Retained by Adventure Programs Participation or Not ...............................57
4.16: Test of Between-Subjects Effects: Adventure Programs ..........................................58
4.17: Estimated Marginal Means: Adventure Programs ....................................................59
4.18: Regression: Retention ...............................................................................................60
4.19: Intramural Sport Participation by Student Characteristics .......................................62
4.20: Crosstabulation: Intramural Sports Participation by Gender ....................................64
4.21: Crosstabulation: Intramural Sports Participation by First Generation Status ...........65
4.22: Crosstabulation: Intramural Sports Participation by Non-Traditional Students .......66
4.23: Percent Retained by Participation in Intramural Sports or Not ................................67

Running head: EFFECT OF UNIVERSITY CAMPUS RECREATION PROGRAMS
x
4.24: Test of Between-Subjects Effects: Intramural Sports ...............................................68
4.25: Estimated Marginal Means: Intramural Sports .........................................................69
4.26: Regression: Retention ...............................................................................................70
Running head: EFFECT OF UNIVERSITY CAMPUS RECREATION PROGRAMS
xi
LIST OF FIGURES
FIGURE……………………………………………………………………………...PAGE
Figure 1. Tinto’s Model of Student Departure.....................................................................9
Figure 2. Astin’s Input-Environment-Output (I-E-O) Model ............................................10

Running head: EFFECT OF UNIVERSITY CAMPUS RECREATION PROGRAMS
1
I. INTRODUCTION
Problem Statement
Retention rates are low at numerous colleges and universities throughout the
United States (Bushong, 2009; Knapp, Kelly-Reid & Ginder, 2012; Sieben, 2011).
College student retention continues to be a growing concern to universities, state and
local governments, students and parents (Seidman, 2006). With federal and state
appropriations being reduced, universities face increased levels of accountability for
retention and enrollment numbers. Students and parents are scrutinizing the cost to
attend college, and students have a genuine concern regarding the amount of federal
student loan debt they will incur, particularly for students who do not complete their
degree (Choy & Li 2006; Nguyen, 2012; Wei & Horn, 2013). For over a decade,
retention of freshman continues to be a crucial concern amongst colleges and universities,
and the U.S Department of Education is focusing on outcomes and results, specifically in
retention and completion rates (Borrego, 2002). Due to this focus, higher education
institutions and administrators must respond to the declining retention rates and address
the concern at hand (Tinto, 2007; Aud et al., 2010). As Tinto (1987) indicates,
approximately 75% of student who leave college do so within the first two years, and of
those students, 85% do so voluntarily.
General Background
Colleges and universities are being held more accountable for student retention
due to declining retention rates at many universities in the United States. Because of the
higher level of accountability facing colleges, university administrators are focusing their
efforts on ways to improve retention rates and are therefore looking to offer programs

Running head: EFFECT OF UNIVERSITY CAMPUS RECREATION PROGRAMS
2
with positive effects on retention. Not only are postsecondary institutions seeking to find
programs with favorable outcomes, colleges and universities are increasingly becoming
more competitive in recruiting efforts in addition to retaining students. Programs and
activities offered through college campus recreation facilities are among those that can be
offered that may have positive influences on student retention.
While there have been studies to determine the learning outcomes and social
development associated with participation in club sport activities (Nesbitt, 1998; Haines
& Fortman, 2008), there has been limited research conducted on the environment campus
recreation programs provide as a whole. Research has shown that a relationship exists
between the use of campus recreation facilities and student development (Dalgarn, 2001),
higher retention rates of frequent users of campus recreation gym facilities (Belch, Gebel,
& Mass, 2011), and the social benefits of intramural sports (Artinger et al., 2006).
However, there is a gap in the research when looking at campus recreation programs in
their entirety. As research indicates, the connection a student has to a college campus
through various activities contributes to higher retention (Astin, 1984; Miller, 2011;
Terenzini & Pascarella, 1977), yet the gap in the literature is seen when it comes to
evaluating the impact of campus recreation centers as a whole and the specific effects the
programs have on student retention and social belonging.
As Frauman (2005) indicates, college retention can be linked to participation in
extracurricular activities, including those offered through campus recreation centers.
While there is research in support of students using campus recreation facilities to
increase college retention, social bonding and student development, there has not been a

Running head: EFFECT OF UNIVERSITY CAMPUS RECREATION PROGRAMS
3
study to date which effectively combines the numerous programs offered through campus
recreation and draws conclusions based on the impact of the programs as a whole.
Rationale for Campus Recreation Programs
Over the past three decades, there has been substantial evidence that participation
in extracurricular activities is linked to undergraduate success and student persistence
(Bean, 1980; Buccholz, 1993; Miller, 2011; Tinto, 1975). Higher education student
affairs professionals share a common understanding that the more a student is integrated
into a college community the less likely they are to willingly leave the institution,
consequently influencing attrition rates (Harris, 2006; Terenzini & Pascarella, 1977). In
fact, numerous studies have shown that what happens once a student becomes assimilated
into the college environment is more predictive of their persistence in college than other
pre-entry activities (Pascarella & Terenzini, 1977; Terenzini & Pascarella, 1977). A
critical part of the retention process is a student’s feeling of belonging to a community
(Wade, 1991). Thus, integrating students who participate in activities and programs into
the campus community is an objective of campus recreation facilities, and it proves
beneficial for university officials to understand the significance provided by recreation
activities due to the programs enhancing the institutional goal of retention.
In order for a student to become assimilated and feel as though they are part of the
university community, it is essential they develop both a sense of belonging and a sense
of community. Creating the feeling of integration and sense of community amongst
students can be accomplished through developing social networks, interactions between
students and faculty, and opportunities for inclusion, such as recreation programs and
student life activities (Harris, 2006). Creating a sense of community can also be achieved

Running head: EFFECT OF UNIVERSITY CAMPUS RECREATION PROGRAMS
4
through simply utilizing the campus recreation facility or gym. As noted by Dalgarn
(2001), many users see a campus recreation facility as a place to meet new people,
friends, and simply hang out, aiding in the development of social bonds and community.
In particular, first-year students build social bonds based on the connection they
have with their community, and students need to feel as though they belong somewhere
and are a part of something that gives their lives direction (Austin, Martin, Yoshino,
Schanning, Ogle, & Mittelstaedt, 2010). As Flora and Flora (2013) indicate, the term
community holds numerous definitions, all of which focus on groups of people. Often
based on a shared sense of place, the concept of community also may include the
relationships among the people, environment and place (Flora & Flora, 2013). Some see
sense of community as shared common values or those doing similar things, not just
those living in the same place. One goal of recreational activities at a university is the
development of such a sense of community—building social relationships with people,
having shared values or participating in similar activities.
Both notions of sense of community provide a foundation for understanding why
fostering a sense of community is so important in the students’ transition to college.
Integration into a new community can either be successful for the student if he or she
feels a connection with the place or a struggle if the student does not feel a sense of
belonging. As Salamon (2003) points out, “strong connections emerge when trust is
derived from knowing people and being able to count on them” (p. 187). Campus
recreation programs provide students an environment where trust, communication and
social relationships can all be cultivated aiding in students’ sense of community and
feeling of belongingness.

Running head: EFFECT OF UNIVERSITY CAMPUS RECREATION PROGRAMS
5
School setting and sense of belonging to a school are also determining factors in
student motivation and academic success. Whether or not students feel accepted,
included, respected or supported are all influential factors in the students’ sense of
belonging to a school and could potentially be the determining factors as to whether they
choose to stay at a particular college. Therefore, it is critical for students to develop deep
and meaningful relationships with peers and faculty in order to establish one’s sense of
belonging to a school and community (Chenoweth & Galliher, 2004). Campus recreation
programs offered to students aid in fostering such relationships and sense of belonging
amongst students.
As Miller (2011) indicates, students tend to have a stronger interest in continuing
an association with a particular place as they become more attached. Fostering this sense
of place, or place bonding, for an individual allows them to develop strong emotional ties
between the location and themselves. In Miller’s (2011) study, students indicated that the
student recreation center on campus provided a strong emotional tie to the university for
them. Reasons noted for this place bonding students felt towards the student recreation
center included an increase in self-confidence, perceived overall happiness, leadership
abilities, and personal development.
Jacobs and Archie (2008) have also provided evidence to illustrate that sense of
community is shown to be a positive predictor of student persistence. For this reason,
programming offered through campus recreation is positioned to help universities
promote a greater sense of community. According to Austin et al. (2010), by giving
attention to place and community, recreation programs truly have the potential to develop
deep relationships with students to peers, the natural world around them, and the

Running head: EFFECT OF UNIVERSITY CAMPUS RECREATION PROGRAMS
6
institution. Salamon (2003) notes that, “only through repetitive informal interactions do
people forge the shared meanings that foster a sense of community” (p. 183). With
colleges and universities being held more accountable for student retention, developing
programs such as those offered through campus recreation to foster sense of community
is crucial.
Value of Recreational Sports on Campus
In order to provide a brief review of literature on the value of recreational sports
on campus, Downs (2003) conducted a study for the National Intramural-Recreational
Sports Association (NIRSA). This study was conducted with a two-fold purpose—to
document the buying power of participants of recreation and to examine the value of
recreational sports to participants. The study focused primarily on participants in
recreational sports on college campuses due to the substantial number of colleges and
universities that are NIRSA member organizations. Faculty and staff have membership
options and access to campus recreation facilities in addition to the students. For the
purpose of the Downs (2003) study, though, students were the specific focus and it
included the following sports programs and activities: organized recreation teams and
league sports, fitness class participants, workout center programs, exercise enthusiasts,
organized sports clubs, aquatic enthusiasts, outdoor recreation enthusiasts, and other
participants in recreation sports fitness programs.
Downs’ (2003) study on the impact of participation in recreational sports
programs and activities on college campuses discovered several key relationships
between participation and college and personal success factors. Specifically, this study
found that participation in recreational sports programs and activities is correlated with

Running head: EFFECT OF UNIVERSITY CAMPUS RECREATION PROGRAMS
7
overall college satisfaction and success and reinforced that participation in recreational
sports is an important determinant of overall college satisfaction and success. The study
also found that students who participated heavily in college recreational sports programs
and activities were more socially oriented than other students. Students also agreed that
participation in recreational sports resulted in the following benefits: improved emotional
well-being, reduced stress, improved happiness, improved self-confidence, increased
character, made students feel like part of the college community and was an important
part of college social life.
Downs’ (2003) study contributed to existing literature on the value of recreational
sports on a college campus, and it is also added significance by focusing on self-reporting
measures and assessing buying power of participants in recreational sports. The results
of this study revealed several key relationships between participation in recreational
sports programs and activities, as well as college and personal success factors. While
there have been numerous other studies conducted on the value of recreational sports on
college campuses, this study signifies the most comprehensive effort to examine the
impact of participation in recreational sports programs and activities on college
satisfaction and performance (Downs, 2003). This study included more than 2,600
students from sixteen colleges, all members of the NIRSA organization, making it the
largest, representative group of college students ever studied with respect to the value of
participation in recreational sports and programs. Previous research on the value of
recreational sports on college campuses tended to focus on one specific college, whereas
Downs’ (2003) study had participants from sixteen colleges.

Running head: EFFECT OF UNIVERSITY CAMPUS RECREATION PROGRAMS
8
Theoretical Framework for Student Involvement in Recreation
There are two primary developmental social theories in which the empirical
background supporting the impact campus recreation centers and retention is based—
Astin’s (1999) theory of involvement and Tinto’s (1993) theory of integration. As Tinto
(1975) suggests, creating a sense of community on a college campus is a way to help
students feel a sense of belongingness and encourage their personal growth and academic
development. In his theory of integration, Tinto (1993) identifies the significance of how
creating a sense of belonging and commitment to the university is just as vital to
university life as the academic aspects. Tinto (1993) provides theoretical background to
the idea that a student not only needs to be integrated socially but academically as well
while in college in order to have a significant commitment to the institution. Tinto’s
(1993) theory suggests that a sense of commitment may substantially increase the
student’s desire to persist at that college or university. Tinto’s (1993) Interactionalist
Model of Student Departure also suggests a process in which students are more likely to
be persistent if they are successfully socialized. Students who are invested in recreational
activities are more likely to continue their education at that particular institution (Tinto,
1993). Because of this, his model emphasized the need to better understand the
connection between student involvement and its impact on student persistence.

Running head: EFFECT OF UNIVERSITY CAMPUS RECREATION PROGRAMS
9
Figure 1. Tinto’s Model of Student Departure
(Adapted from: Tinto 1993, 114)
Astin’s (1999) Student Involvement Theory posits that the environment strongly
influences the student’s development and maturation into adulthood. His theory emerged
from a longitudinal study of college student persistence which indicated that students
who are involved in their university had higher rates of persistence, and those students
who were not involved at their university were more likely to leave the school (Astin,
1975). As Astin indicates, what the student does and how he or she behaves define
involvement more than what the student feels or thinks.
The major components of Astin’s Involvement model, or the IEO Model, include
I-inputs, E-environment, and O-outputs. The IEO model is useful when applying the
process of assimilation to college. The input variable includes the underlying abilities
and knowledge a student has when entering college. Environment includes any situation

Running head: EFFECT OF UNIVERSITY CAMPUS RECREATION PROGRAMS
10
a student may be in, whether work or participating in recreational activities or other
factors, that may influence the student’s level of engagement. The output variable is the
result seen from the student’s level of engagement, such as academic persistence or
retention.
Figure 2. Astin’s Input-Environment-Output (I-E-O) Model
The significance Astin’s (1999) theory of involvement provides to research on the
effects of campus recreation center usage is in relation to that of students becoming
involved. Astin’s theory asserts (1999) that the greater the student’s involvement in
activities at a university, the greater their personal and learning development throughout
their college years. Students using campus recreation facilities and participating in
programs offered through campus recreation are doing so on campus, thus increasing
their interactions with other students. Students are using on campus recreational
activities and facilities as an avenue to develop a sense of belonging and become
involved, adding validity to Astin’s (1999) theory of involvement. Participation in
campus recreation activities not only allows for social interaction amongst students, it
allows students to maintain a level of physical fitness and decrease levels of stress as
well.
Running head: EFFECT OF UNIVERSITY CAMPUS RECREATION PROGRAMS
11
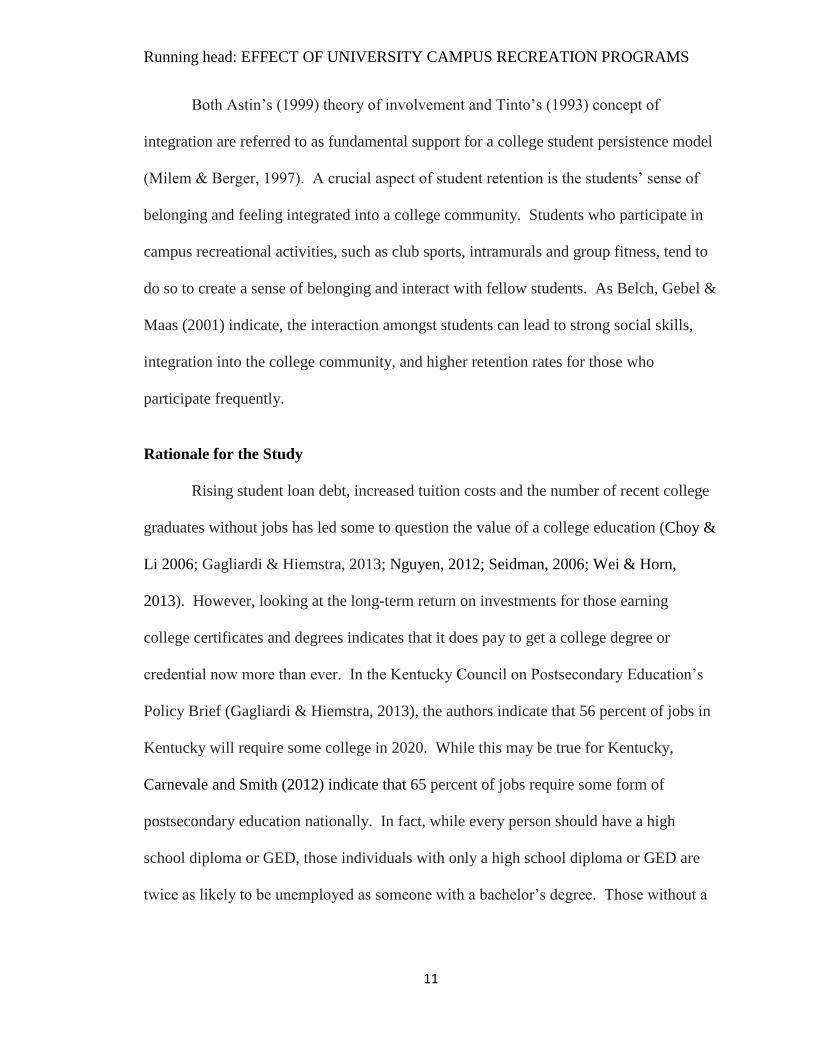
Both Astin’s (1999) theory of involvement and Tinto’s (1993) concept of
integration are referred to as fundamental support for a college student persistence model
(Milem & Berger, 1997). A crucial aspect of student retention is the students’ sense of
belonging and feeling integrated into a college community. Students who participate in
campus recreational activities, such as club sports, intramurals and group fitness, tend to
do so to create a sense of belonging and interact with fellow students. As Belch, Gebel &
Maas (2001) indicate, the interaction amongst students can lead to strong social skills,
integration into the college community, and higher retention rates for those who
participate frequently.
Rationale for the Study
Rising student loan debt, increased tuition costs and the number of recent college
graduates without jobs has led some to question the value of a college education (Choy &
Li 2006; Gagliardi & Hiemstra, 2013; Nguyen, 2012; Seidman, 2006; Wei & Horn,
2013). However, looking at the long-term return on investments for those earning
college certificates and degrees indicates that it does pay to get a college degree or
credential now more than ever. In the Kentucky Council on Postsecondary Education’s
Policy Brief (Gagliardi & Hiemstra, 2013), the authors indicate that 56 percent of jobs in
Kentucky will require some college in 2020. While this may be true for Kentucky,
Carnevale and Smith (2012) indicate that 65 percent of jobs require some form of
postsecondary education nationally. In fact, while every person should have a high
school diploma or GED, those individuals with only a high school diploma or GED are
twice as likely to be unemployed as someone with a bachelor’s degree. Those without a

Running head: EFFECT OF UNIVERSITY CAMPUS RECREATION PROGRAMS
12
high school diploma are three times more likely to be unemployed compared to those
who have earned a bachelor’s degree (Gagliardi & Hiemstra, 2013).
Not only does earning a college degree or credential reduce the likelihood of
being unemployed, college education also leads to higher earnings (Gagliardi &
Hiemstra, 2013). According to the Bureau of Labor Statistics, in 2009, the median
weekly earnings of workers with bachelor's degrees was $1,137, an amount 1.8 times the
average earned by those with only a high school diploma and 2.5 times the earnings of
high school dropouts. In 2011, earnings of high school graduates were 58 cents relative
to those with more education at 87 cents. Furthermore, a new employee with some
college earns approximately $2,700 more on average than someone with a high school
degree, and those individuals with a bachelor’s degree or higher earn $16,600 more
(Quarterly Wage Indicator, 2011).
Higher levels of education are not only associated with lower unemployment rates
and higher earnings, they are also associated with better health outcomes, less crime and
less reliance on public assistance (Gagliardi & Hiemstra, 2013). A more educated
population can help reduce the demands on state budgets and potentially increase
revenue. With federal and state appropriations being reduced, universities face increased
levels of accountability for retention and enrollment numbers. Therefore, in order for
states to acquire the benefits from a more educated population, it is essential that colleges
and universities continue to improve their efforts in postsecondary attainment (Gagliardi
& Hiemstra, 2013).

Running head: EFFECT OF UNIVERSITY CAMPUS RECREATION PROGRAMS
13
Purpose of the Study
This study addresses and examines the effects of student recreation center
programs on student retention through social belonging. Involvement in programs and
activities offered through campus recreation on campus may help create a sense of
belonging to the university, or sense of community, translating to an impact on student
retention.
It is essential for university administrators to understand why college recreation
centers are vital to student life as well as the overall benefits of campus recreation. Yet,
there is a gap in the research on campus recreation facilities, the programs they offer, and
the effects they have on student retention and social belonging. In order to enhance the
college students’ experience on campus and better understand how to serve the students,
researchers need to further examine the importance of campus recreation facilities,
recreational sports, and the correlation between campus recreation center use and
institutional goals.
The purpose of this study is to determine the impacts that the use of one
university campus recreation center use has on student retention. Specifically, this study
examined the various programs offered through campus recreation at Eastern Kentucky
University—including intramural sports, adventure programs, and general use of the gym
facility—to examine the effect on retention through student engagement and social
belonging.
Running head: EFFECT OF UNIVERSITY CAMPUS RECREATION PROGRAMS
14
Research Questions
The following research questions guided this study:
1. Controlling for student characteristics, is there a difference in retention rates
between those who participate in campus recreation and those who do not
participate?
2. What is the relationship between student characteristics and frequency in
participation in campus recreation programs with retention?
Significance of the Study
While there is an applied body of research developed on the effects of campus
recreation center use on students (Artinger et al., 2006; Blech, Gebel, & Mass,
2011Dalgarn, 2001; Downs, 2003), this study contributes to the general knowledge base
on the field of campus recreation facilities and the recreation programs they can offer.
Not only is it important to understand the importance campus recreation centers provide
to student life, it is also essential to understand the overall benefits students gain from
participation in these programs.
With many colleges and universities receiving less state appropriations and facing
harsh economic climates, university administrators are scrutinizing programs to
determine where resources should be allocated. The results of this study will provide
valuable information to help administrators make informed, educated decisions regarding
funding and resources allocated to programs based on their retention efforts and
effectiveness. Not only does this study aim to fill gaps in existing literature, the goal also
is to provide noteworthy information to the university that will assist in enhancing current

Running head: EFFECT OF UNIVERSITY CAMPUS RECREATION PROGRAMS
15
recreational programming. Results of this study will contribute to the overall body of
literature on campus recreation facilities and their effect on student retention.
Study Limitations
There are limitations to the study that are important to note. One limitation to the
study is the fact that the findings are specific to students at Eastern Kentucky University.
Due to the limited scope of the study, the results cannot be generalized to other student
populations. Although the study examines the various activities offered through campus
recreation, the study is limited to measuring the effect of one campus recreation facility.
Therefore, the results cannot be generalized to other campus recreation facilities across
various postsecondary institutions.
Despite the limitations to this study, the findings offer beneficial information to
university administrators and researchers examining campus recreation and the effects
these programs have on student retention. The results of this study also provide valuable
information to those involved in the decision-making of various student programs on
campus, specifically in regards to allocating funds for campus recreation.
Definitions of Terms
Campus Recreation is defined as the facility and/or program opportunities
available for students to participate in physical activities. These various activities include
intramural sports, adventure programs, and general use of the gym facility.

Running head: EFFECT OF UNIVERSITY CAMPUS RECREATION PROGRAMS
16
Campus Recreation Program is defined as the program opportunities available for
students to participate in physical activities. These various activities include intramural
sports, adventure programs, and general use of the gym facility. This term is used
synonymously with Campus Recreation Facility.
Campus Recreation Facility is defined as the venue in which students participate
in physical activity. An example of this would be general use of the gym facility. This
term is used synonymously with Campus Recreation Program.
Persistence is defined as the method in which a student remains enrolled in
coursework from one academic term to the next sequential term of enrollment. The
student continues to make satisfactory academic progress toward earning their college
degree. An example of this would be a student’s enrollment in the fall term continuing to
the spring term.
Retention is defined as the process in which a student maintains continuous
enrollment in coursework from one academic year to the next. The student also
continues to make satisfactory academic growth toward earning their college degree. An
example of retention is a student’s fall term enrollment continuing to spring enrollment
and into the subsequent fall term.
Sense of Belonging is defined as the connection or attachment a student feels
towards their university. An example of sense of belonging is the students increased
interaction or increased leadership potential at the university through their connection
with the university.

Running head: EFFECT OF UNIVERSITY CAMPUS RECREATION PROGRAMS
17
Sense of Community is defined as the established relationship(s) a student feels
with other students. An example of this would be the students’ ability to establish and
create relationships with other students.
Sense of Place is defined as the identity, dependence, and even possessiveness
towards a specific location. For example, the campus recreation facility on campus could
become the students only location utilized for recreational pursuits.
Running head: EFFECT OF UNIVERSITY CAMPUS RECREATION PROGRAMS
18
II. LITERATURE REVIEW
Review of Literature
As indicated in previous research, students who participate in recreational fitness
activities do so in order to interact with their peers, ultimately creating a sense of
belonging (Bucholz, 1993). The sense of a belonging a student gains from participation
in recreation programs allows students to become more integrated into the university.
According to Wade (1991), a critical part of the retention process is a student feeling that
sense of connecting and belonging to a community. Professionals in the field of
recreation have argued that participation in campus recreation programs have a positive
effect on the students’ social belonging and retention. One of the goals of this study it to
add to the body of research that has been developed on the effects of college campus
recreation centers on student outcomes.
The purpose of this study is to determine the effect of student recreation center
programs on student retention. Specifically, this study examines the various programs
offered through campus recreation at Eastern Kentucky University to assess the effect on
retention through student engagement and social belonging. Additionally, this study
hypothesizes that participation in campus recreation center programs aids students in
stress reduction and physical fitness ultimately increasing student retention. This chapter
reviews the literature pertaining to college retention and participation in campus
recreation programs. Topics in the review of literature include the history of recreational
sports, theories of involvement, benefits of participation in recreational sports,
recruitment and retention, the perceived health and wellness benefits resulting from
participation, and differences in retention rates by student characteristics.

Running head: EFFECT OF UNIVERSITY CAMPUS RECREATION PROGRAMS
19
History of Recreational Sports
It is important to review the history of campus recreation and how it has evolved
in order to understand where it is today. Recreation on college campuses has been
present almost since the inception of educational institutions in the United States, but not
always with the approval of the administration (Webster, 1965; Means, 1952). Literature
shows that intramural sports on campus began as a student-initiated, or sponsored athletic
contests, as activities in which students could participate during their leisure time
(Stewart, 1992). The athletic competitions were held during an era when physical
education programs were not required as part of a college’s general education courses
and intercollegiate sports programs were not well developed. Students merely
participated in the contests due to the fact that they were the only opportunities for
student looking to participate in recreational sports on a college campus (Bourgeois et.
al., 1995).
University administrators began to realize the need for recreational sports
facilities for students to utilize during their leisure time, and the first recreational facility
was opened in 1928 at the University of Michigan (Windschitl, 2008). This facility was
designed strictly for men’s participation in non-varsity club sports, intramural activities,
and physical activity (Taylor, Canning, Brailsford, & Rokosz, 2003). Over the course of
the next three decades, universities used this model when designing their campus
recreational facilities with funding primarily coming from the general funds of the
university and the athletic department (Taylor et al., 2003).
During the 1960s and 1970s, facilities were built closer to on-campus residential
housing to enable more student participation. At this time, both men and women were

Running head: EFFECT OF UNIVERSITY CAMPUS RECREATION PROGRAMS
20
participating in campus recreation activities, and in many instances, student fees
supported the construction of the facilities (Taylor et al., 2003). Because many facilities
were being constructed with student fees, students made the decision they wanted these
recreational facilities as part of their campus and imposed a referendum or fee upon
themselves for the construction and the operation of the facilities (Bryant et al., 1994;
Taylor et al., 2003; Wilson, 2009). Student lead decisions to provide recreational
facilities on college campuses provide insight into the value of campus recreation and the
importance of recruitment and retention to university administrators.
Beginning in the late 1980s, significant growth in the number of recreational
facilities being built was seen, and the construction boom continued at a rapid pace
(NIRSA, 2008). Many of the recreation facilities became the spotlight on college
campuses due to their open and inviting architectural designs (Taylor et al., 2003).
According to Huesman, Brown, Lee, Kellogg and Radcliffe (2009), campus recreation
facilities are intentionally designed to invite a sense of community and social interaction
as well as physical activity. Not only do the recreational facilities and programs serve as
a recruiting tool for new students, but they also enhanced satisfaction with the college
experience and contributed to institutional retention efforts (Banta, 1991).
Campus recreation facilities have become, and continue to be, a social gathering
point for many students on a college campus. Not only does the rich environment that
campus recreation facilities provide for student interaction make their usage a likely
contributor to student success (Huesman et al., 2009), but as Bryant et al. (1995) indicate,
campus recreation facilities facilitate social integration by creating large numbers of
opportunities for members of a college community to interact.

Running head: EFFECT OF UNIVERSITY CAMPUS RECREATION PROGRAMS
21
Theories of Involvement
There are two primary developmental social theories in which the empirical
background supporting the impact campus recreation centers and retention is based—
Astin’s (1999) theory of involvement, and Tinto’s (1993) theory of integration. Astin’s
(1999) theory of involvement is part of the theoretical foundation for this particular study
by hypothesizing that a student’s environment has a strong influence on their
development into adulthood. Not only does Astin’s (1999) IEO model posit that the
environment strongly influences the student’s development and maturation into
adulthood, it also helps to establish the relationship between participation in recreational
activities with college life satisfaction and degree attainment. Astin’s theory asserts
(1999) that the greater the student’s involvement in activities at a university, the greater
their personal and learning development throughout their college years. As Astin
indicates, what a student does and how they behave defines involvement more than what
the student thinks or feels.
The premise of Astin’s (1999) theory of involvement is that the greater the
student’s involvement in activities at the university, the greater their learning and
personal development is throughout their years in college. Typically, students who are
involved in more extracurricular activities tend to be students who have higher academic
standards. Not only are the students high achievers through their involvement in
organizations and clubs, they frequently interact with faculty members and spend
considerably more time studying than do their lower achieving counterparts (Astin,1999).
Astin’s (1999) study on involvement emphasized that the amount of student learning and
personal development gained from their involvement is directly linked to the amount and

Running head: EFFECT OF UNIVERSITY CAMPUS RECREATION PROGRAMS
22
quality of energy the student invests in those activities. He also argued that students
living in on-campus housing are more likely to be fully invested in the campus
community. As Astin (1999) indicates, the two main reasons for increased involvement
amongst residential students are the likelihood of interacting with other students more
frequently and the mere convenience of on-campus activities. Astin (1999) also stressed
that further studies in this area needed to be conducted in order to take an in-depth look at
the various forms of involvement including interaction with faculty, participation in
recreational sports, involvement in student government and other activities students
enjoy.
To further understand student’s use of leisure time, Wade (1991) developed a
study to examine how students at Pennsylvania State University chose to spend their
discretionary time outside the structured classroom. A sample of 367 students (a 73%
response rate) completed the surveys, 62% of whom were males. The survey instrument
contained 19 questions classified in non-academic and academic categories. Of the 19
questions, three focused on academics—amount of time related to number of credits,
amount of time dedicated to study, and number of hours spent at the library. The sixteen
non-academic questions focused on time related to employment, religious service,
volunteer activities, intramural sports, shopping, personal care, talking with friends,
dating, cultural events, and time away from the university community. As indicated in
the results, 82% of the students reported spending twenty or fewer hours per week on
study, 25% of the students spent no time in the library, and males showed a tendency to
enroll for more credits than females. Results also indicated that 47% of students reported
watching television five or fewer hours per week, 15% watched no television, 43%

Running head: EFFECT OF UNIVERSITY CAMPUS RECREATION PROGRAMS
23
worked, and 86% of those reported working 20 or fewer hours per week. Of the sample
population, 39% participated in intramural sports with 66% spending two or fewer hours
per week in intramural sports, and 38% spent one to three hours per week dating.
Wade’s (1991) study indicated that an essential and critical part of retention of
undergraduate students was their feeling of belonging to a community. These findings
were supported by Dalgarn (2001), who indicated that many students that participate in
recreational or fitness activities do so as a way to enhance social relationships by
interacting with other students. Additionally, Bailey (2005) supported this claim by
affirming that increased participation in sports and fitness activities throughout a person’s
life can contribute to the development of community with other participants,
consequently reducing the possibility of social exclusion.
Tinto (1975) suggested that creating a sense of community on a college campus is
a way to help students feel a sense of belongingness and encourage their personal growth
and academic development. In his theory of integration, Tinto (1993) contended that the
significance of creating a sense of belonging and commitment to the university is just as
vital to university life as the academic aspects. Tinto (1993) provided theoretical
background on the concept that integration into academic life as well as social life while
in college leads to significant commitment to that particular institution. Tinto (1993)
further stated that a sense of commitment by the student may considerably increase their
desire to persist at that specific institution. This aspect of student involvement provides a
great benefit to the institution itself in that students who are invested in recreational
activities are more likely to continue their education at that particular institution (Tinto,
1993). Tinto’s (1993) Interactionalist Model of Student Departure also articulated a

Running head: EFFECT OF UNIVERSITY CAMPUS RECREATION PROGRAMS
24
process by which students are more likely to be persistent if they are successfully
socialized. Because of this, his model emphasized the need to better understand the
connection between student involvement and its impact on student persistence. Not only
is this a benefit to the student, it is a viable way to retain students from an institutional
perspective as well.
Recruitment
As recruitment of students has become more crucial to an institution’s objectives
(Taylor et al., 2003), and to its budget, recruitment efforts have also become highly
competitive and expensive. Over the past decade, campus recreation programs and
facilities have become a major component and spotlight in colleges’ and universities’
recruitment strategy. The recreation programs offered and the campus recreation
facilities are considered to be key components of a student’s decision to attend a certain
institution (Haines, 2004; Kasin & Dzakira, 2001; Lamont, 1991; Zizzi, Ayers, &
Watson, 2004). There is a common understanding that students give a high ranking to
campus recreation programs, facilities for personal fitness, participation in team sports,
and unstructured recreation when deciding which institution to attend (NIRSA, 2004).
The literature shows that prospective students often rank access to recreational sport and
fitness facilities for personal use higher than internships, cultural activities, part-time/full-
time work, student clubs, student organizations, study abroad, Greek life and watching or
participating in NCAA sports (NIRSA, 2004). However, the literature is less clear on the
importance of campus recreation facilities to the student’s decision to attend a particular
institution. While this question necessitates more data, some studies have suggested that
up to 30% of students base a significant portion of their decision to attend a particular

Running head: EFFECT OF UNIVERSITY CAMPUS RECREATION PROGRAMS
25
institution on the quality and availability of extracurricular facilities and programs
(Bryant & Banta, 1995; Reynolds, 2007).
Health Benefits of Exercise
Stress Reduction
College can produce a stressful environment for students and having the proper
coping mechanisms is crucial for students to succeed. Physical fitness has been shown to
be a great stress reducer due to fact that exercise reduces both physiological stress and
self-perceived psychological stress (Windschitl, 2008). Increasing physical fitness to
reduce levels of stress is a method utilized by students. In fact, there has been significant
research showing that physically active recreation can relieve stress, enhance creativity,
and reenergize the body and mind (Fontaine, 2000; Kanters, 2000; Landers, 1997). Not
only does use of campus recreation facilities help decrease stress levels for those who
participate, coping with stress can lead to significant personal development amongst
students (Kanters, 2000).
As Kanters (2000) indicates, using campus recreation to moderate stress effects
student development in two different methods—through participation in physically active
sports or aerobic activity and through the social support facilitated through participation.
The results of this study indicated that students reporting a higher level of participation in
recreational activities also reported lower levels of stress during final exams (Kanters,
2000). Results also showed that students who had a strong social support group indicated
they had lower stress-related anxiety (Kanters, 2000). Kanters’ (2000) findings support
utilizing campus recreation facilities as a means of stress reduction and that working out
with a friend can help decrease stress related anxiety. Not only does participation

Running head: EFFECT OF UNIVERSITY CAMPUS RECREATION PROGRAMS
26
decrease levels of stress, it supports the argument for a strong sense of belonging to the
university as well (Kanters, 2000). These findings are critical for students seeking
options regarding decreasing levels of stress they may incur during college.
In addition to the Kanters (2000) study, Iso-Ahola and Park (2000) examined the
relationship between companionship and self-determination on stress levels using
participants from a Taekwondo studio. Their study results showed a positive correlation
between life stress and mental health problems and a negative relationship between
leisure factors and mental health problems (Iso-Ahola & Park, 2000). Results of this
study also indicated that physical health problems were not correlated to leisure factors
and that general health issues are related to levels of stress, affirming that levels of stress
can be lowered through leisure activities (Iso-Ahola & Park, 2000).
Fenzel (2001) conducted a study at a liberal arts university on the East Coast and
found that many of the activities individuals participated in that lead to healthy lifestyles
also have a positive effect on retention rates. In addition to the Student Development
Survey used in this study, students completed several demographic items and scales of
attitudes and behaviors, to include symptoms of anxiety. Participants of the study were
defined as those who visited recreational facilities (n=114) and those who did not visit the
recreational facilities (n=95). Results of this study showed that becoming involved in co-
curricular activities during as early as the first six weeks of college provided significant
benefits to the student (Fenzel, 2001).
Physical Fitness
As indicated in the first Surgeon General’s report on physical health and wellness,
participating in regular physical activity provides significant health benefits for
Running head: EFFECT OF UNIVERSITY CAMPUS RECREATION PROGRAMS
27
individuals of all ages (The Centers for Disease Control and Prevention, 1996). This
initial report, which was not released until 1996, developed from the emerging concern of
epidemiologists and other professionals in the health and wellness industry that greater
emphasis and awareness needs to be placed on the benefits of physical activity. More
specifically, as detailed in the landmark review of research, physical activity improves
one’s quality of life by improving psychological well-being as well as enhancing physical
functions. Even ten years after the initial Surgeon General’s report, the intent of the
recommendations has not been fully realized (Haskell, Lee, Pate, Powell, Blair, Franklin,
Macera, Heath, Thompson, & Bauman, 2005). Evidence still shows concern that adults
in the United States are not active enough; therefore, an updated recommendation
statement was issued. While fundamentally unchanged from the initial recommendation,
the updated recommendation clarifies eight topics: (a) frequency of activity, (b) intensity
of activity, (c) moderate and vigorous activity are complementary to one another, (d)
clarification on aerobic activity in addition to routine activity, (e) physical activity above
the minimum time provides significant health benefits, (f) consistency and clarity on
length of time, (g) incorporating muscle strengthening activities, and (h) making minor
wording changes to enhance clarity.
As the Surgeon General’s report on physical activity (1996) indicates, the health
benefits from participating in physical activity are obtainable even for those who may
dislike vigorous exercise, and those who regularly participate could potentially reap
additional benefits from maintaining or even increasing activity levels. Not only does
participation in regular physical activity enhance one’s physical functions, it also helps
reduce depression, improve one’s mood, as well as aid in the ability to perform daily

Running head: EFFECT OF UNIVERSITY CAMPUS RECREATION PROGRAMS
28
tasks. Despite the known benefits of lifetime physical activity, results from the National
College Health Risk Behavior Survey indicated that only 36.7% of students reported they
had participated in vigorous physical activity on three of more of the seven days
preceding the survey (Douglas, Collins, & Warren, 1997).
Regular consistent physical activity has been shown to provide a variety of health
enhancing benefits to include reducing the risk of developing cardiovascular disease,
certain types of cancer, diabetes, and stroke (Miller, Ogletree, & Welshimer, 2002). In
addition, physical activity improves general circulation and increased blood flow to the
brain as well as raises levels of norepinephrine and endorphins, all of which helps
improve one’s mood and induce a calming effect after exercise (Taras, 2005). These
benefits are vital to a student’s good health, but they are particularly important when
considering the challenges facing college students today (Windschitl, 2008).
Literature has also shown that physical activity increases students’ overall health,
which might increase the likelihood of a student returning. As Moskal, Dziuban, and
West (1996) indicate, health problems such as heart disease, cancer, and diabetes had an
effect on students’ academic performance. Collins, Valerius, King and Graham (1997)
found that physical activity enhanced physical, mental, and emotional capacity of the
participants, and Crews and Landers (1987) showed physical activity reduced both
physiological stress and self-perceived psychological stress. Additionally, Healthy
People 2010 by the U.S. Department of Health and Human Services (2000) indicated that
physical activity improved cardiovascular fitness.
Of the health and fitness benefits provided from participation in recreational
activities, one of the most rudimentary benefits to a student is the momentary escape

Running head: EFFECT OF UNIVERSITY CAMPUS RECREATION PROGRAMS
29
from daily matters. Beyond the escape from daily life, a more beneficial aspect
participation in recreational engagements provides students with is the opportunity to
develop and enhance their mental, physical or emotional capacity (Collins, et al., 1997).
Many students participate in a wide range of campus recreation programs due to the
attraction of improved physical health, thus developing their physical capacity (Huesman
et al., 2009). Other students, however, participate as a way to enhance social
relationships by interacting with other students (Dalgarn, 2001).
According to Keating, Guan, Pinero, and Bridges (2005), the physical activity
levels of college students can be attributed to four types of factors: personal, social,
cognitive, and developmental. Therefore, a student’s desire to take part in a form of
physical activity can be influenced by one or a combination of the four factors. Of the
various factors, a student’s drive to lose weight, stay healthy, or workout on a regular
basis is influenced by their personal factor. Social factors influence students to
participate in group physical activity settings including intramural sports, fitness classes
and other programs with peers (Keating, et al, 2005). It is important to recognize that
cognitive factors may not be the conscious reason for student utilization of recreation, but
it is important when considering student perception of recreation center use (Keating, et
al., 2005). As with cognitive factors, developmental factors might not play into students’
cognizant desire to use recreation facilities, but each student experiences a form of
development as a result of their participation (Keating, et al., 2005).
Personal Development
Campus recreation sports, particularly intramural and club sports, provide
students a strong avenue for interaction with their peers and others (Windschitl, 2008).

Running head: EFFECT OF UNIVERSITY CAMPUS RECREATION PROGRAMS
30
Not only does this interaction potentially provide freshmen the opportunity to informally
develop support groups and friendships, it also allows the opportunity to seek advice
from other students regarding the best classes to take or faculty to take classes from.
Typically, staff and faculty members of the university are a visible part of the
membership of campus recreation facilities, which in turn could provide students an
opportunity for informal interaction. Campus recreation facilities offering diverse
programming based on student, faculty, and staff needs can serve as a dynamic
community ultimately establishing student engagement and belonging, thus developing
an individual student’s ability to connect to the environment around them and to the
college community itself (Belch et al., 2001).
In 1996, a poll conducted at The Ohio State University (OSU) showed that 88.6%
of undergraduates indicated that recreational sports and fitness activities were important
to them (Haines, 2000). As Haines indicates, a feeling of physical well-being, sense of
accomplishment, fitness, physical strength, and stress reduction were all benefits from
participating in college recreational programs. This study also showed that students who
participated in campus recreation programs gained mastery leadership skills. In addition,
they were able to solve problems, achieve holistic wellness, work collaboratively in a
group setting, enhanced their perceptions of diversity, and shape their views that
participation in fitness and sports is important to them after graduation.
Differences in Retention Rates by Student Characteristics
First Generation and Retention
Research shows that first generation college students are at a higher risk for
attrition resulting in lower student retention at higher education institutions (Dennis,

Running head: EFFECT OF UNIVERSITY CAMPUS RECREATION PROGRAMS
31
Phinney, & Chuateco, 2005; Longwell-Grice & Longwell-Grice, 2008; Strayhorn, 2009).
Additionally, first generation college students tend to have fewer peer support systems,
less of a connection to the university and campus life, higher anxiety levels from dealing
with the new culture of campus life compared to non-first generation college students,
and that family support for education may be lacking, all of which lower their probability
of being retained (Ishitani, 2006; Lohfink & Paulsen, 2005; Lundberg, Schreiner,
Hovaguimian, & Miller, 2007). Research has also shown that first generation college
students potentially have less self-motivation to be successful in college compared to
non-first generation students, ultimately lowering the likelihood of retention (Naumann,
Debora & Gutkin, 2003). Collectively, these studies support the use of first generation
status as a predictor variable and covariate in this research.
Non-Traditional Students and Retention
The concept of non-traditional students is complex and not easy to traditionally
define (Kurantowicz & Nizinska, 2013). However, a general definition used is that adults
over the age of 24, and those who are younger adults with children or married that return
to college or attend college for the first time are referred to as non-traditional students
(Schuetze & Slowey, 2002). Non-traditional students tend to participate less in
extracurricular activities, and part of the lack of participation with the campus community
is more than likely due to responsibilities of family and work (Noel-Levitz, 1993). As
research indicates though, students that make connections to the institution are more
likely to be retained and graduate (Astin, 1984; Miller, 2011; Terenzini & Pascarella,
1977). Therefore, non-traditional students are used as a predictor variable and covariate
in this study.

Running head: EFFECT OF UNIVERSITY CAMPUS RECREATION PROGRAMS
32
Gender and Retention
Previous literature has also shown that a student’s gender is important to student
persistence and educational attainment. Women have made significant progress in
gaining access to and completing postsecondary education (King 2000; Horn, Peter, &
Rooney 2002). Research indicates females are attending college at higher rates than ever
before and make up over half of the undergraduate student population since 1981
(Fiegener, 2008). The National Center for Education (2005) statistics also indicates that
over the past two decades, the rates at which women enroll in undergraduate education
and attained college degrees increased faster than those of their male counterparts.
Additionally, Leppel’s (2002) national study on gender differences in college persistence
of men and women showed GPA and family income had a positive impact on both men’s
and women’s persistence. For this reason, gender is used as the final covariate and
predictor variable in this study.
Summary
Based on the literature reviewed, numerous studies exist showing the impact of
student recreation centers on various aspects of students’ lives. Most of the research
provides overwhelming support of the benefits campus recreational programs provide
students on college campuses. As indicated in previous research, a number of students at
colleges and universities nationwide are participating in campus recreation sports and
programs on a daily and even weekly basis. Although some may view these programs
and activities merely as a way for students to spend their leisure time outside of the
classroom, research makes it abundantly clear that participation in campus recreation
programs can provide benefits in many areas of student life.

Running head: EFFECT OF UNIVERSITY CAMPUS RECREATION PROGRAMS
33
Some of the previously cited research explains the benefits of participation in
campus recreation programs related to personal development, stress reduction, health
benefits, student involvement and retention. In order to fully understand how campus
recreation programs can influence student retention through social belonging and stress
reduction, further examination of the relationship between these variables must occur.
Looking at the type of students using campus recreation programs and facilities will help
university administrations better understand the importance provided by campus
recreation on college campuses.

Running head: EFFECT OF UNIVERSITY CAMPUS RECREATION PROGRAMS
34
III. METHODS
Methods
This chapter restates the purpose of the study as well as outlines the research
design, context of the study, limitations of the study, and potential implications for
policy, practice and future research. This chapter also contains descriptions of the
following sections: campus overview, variables, data collection, and data analysis.
Purpose
The purpose of this study is to determine the effect a university campus recreation
center use has on student retention. Specifically, this study looked at the various
programs offered through campus recreation at Eastern Kentucky University to examine
the effect on retention hypothetically through student engagement, social belonging and
stress reduction.
Research Questions
The following questions were investigated:
1. Controlling for student characteristics, is there a difference in retention rates
between those who participate in campus recreation and those who do not
participate?
2. What is the relationship between student characteristics and frequency in
participation in campus recreation programs with retention?

Running head: EFFECT OF UNIVERSITY CAMPUS RECREATION PROGRAMS
35
Context of the Study
Campus Overview
The university in this study is a regional, coeducational, public institution of
higher education offering general liberal arts programs, pre-professional and professional
training in education. The university also offers other fields of study at both the
undergraduate and graduate levels. This postsecondary institution is located in the
Southeast, accessible by a network of major highways from all parts of the state and
surrounding states. It serves primarily rural counties in eastern Kentucky. The university
seeks to provide both intellectual and cultural opportunities to help develop habits of
scholastic curiosity and develop a deep understanding of democracy and the role its
citizens play in maintaining vitality. The university also seeks to impart an understanding
of humans, their aspirations, enable effective and efficient communication, and prepare
productive and responsible citizens.
As a comprehensive public institution, the mission of the university is to prepare
students to lead productive, responsible, and enriched lives. To accomplish this mission,
the university emphasizes student success, regional stewardship, critical and creative
thinking, and effective communication. The vision of the university is to be an
accessible, nurturing, and academically rigorous center of learning and scholarship that
transforms lives and communities and enables them to adapt and succeed in a dynamic,
global society. Through its colleges and schools, the university seeks to offer quality
instruction at a variety of degree levels in general education, the arts, the sciences,
business, education, pre-professional and professional areas, and applied and technical
disciplines.
Running head: EFFECT OF UNIVERSITY CAMPUS RECREATION PROGRAMS
36
Campus Recreational Facility and Programs Overview
Campus Recreation offers numerous events and activities housed in the state-of-
the-art Fitness & Wellness Center to help students, faculty, and staff achieve the benefits
of a healthy lifestyle. The facility includes the following: treadmills, ellipticals, rowing
machines, stair steppers, bicycles, selectorized machines, free weights, two multipurpose
sport courts, 1/8 mile four lane track, group exercise studio, full swing golf simulator,
36 foot rock wall, and bouldering wall.
Programs offered by campus recreation include the following: adventure
programs, intramurals, group fitness, club sports, and general use of the gym facility.
Adventure programs consist of outdoor trips ranging from an afternoon to a week (or
more), team building, leadership development and workshops that teach students new
skills. Adventure programs focus on education through experiential learning.
Intramurals offer students the opportunity to compete on teams and individual/dual
activities that allow for growth outside the classroom environment. Intramural sports
offered include flag football, volleyball, softball, ultimate frisbee, tennis, basketball,
water polo, dodgeball, outdoor/indoor soccer, table tennis, wiffleball, underwater hockey,
golf, swim, and a triathlon. Club sports are all self-governed and function with moderate
funding from both Campus Recreation and The Student Government Association
(SGA). Most clubs hold tryouts in the fall and spring semesters. Group fitness classes,
including yoga, cycling, kickboxing, and zumba, are offered in the groups fitness studio
at the Fitness and Wellness Center. Sports clubs offered include the bassmasters club,
skeet and trap club, ice hockey club, men’s lacrosse club, women’s rugby club, women’s
volleyball club, men’s rugby club, equestrain club, women’s soccer club, women’s

Running head: EFFECT OF UNIVERSITY CAMPUS RECREATION PROGRAMS
37
basketball club, men’s soccer club, paintball club, women’s softball club, running club,
climbing club, baseball club, fencing club, capoeira club, and ultimate club.
General use of the gym facility can be tracked using scanners, specifically the CSI
Spectrum NG technology. This technology allows for general usage information to be
tracked and stored in the campus recreation facility. Upon check-in, the initial
information that is stored is the name of participant, time and date of check-in, student
identification number, and membership status. At the administrative level, the system
allows for much more information to be gathered such as previous visits, transaction
listings, contact information, birthdates, and related accounts. This technology enables
workers to scan the student identification cards of the individuals using the facility and
allows the information to be stored where it can be used to study participation rates and
other significant data and outcomes.
Participants
This research study includes all Eastern Kentucky University students who
participated in any one or more of the campus recreation programs from the time period
between the 2011-2012 academic year and the 2012-2013 academic year. The rationale
for examining these particular time frames is that they represent the beginning of
academic school years in order to analyze the effect of campus recreation on student
retention.
Sample
The sample was extracted from existing data obtained from Eastern Kentucky
University’s Campus Recreation Database and Eastern Kentucky University’s Banner
system. Only full-time freshman students enrolled at the Richmond campus are analyzed.

Running head: EFFECT OF UNIVERSITY CAMPUS RECREATION PROGRAMS
38
A full-time student is defined as one enrolled in 12 or more credit hours. Students
attending the 2011-2012 academic year who come back in the 2012-2013 academic year
and students attending the 2012-2013 academic year who come back in 2013-2014 are
designated as retained. For the purposes of this study, a non-traditional student is defined
as 24 years old and older and a traditional student is defined as 24 years old and younger.
Data Collection
Data were collected from Eastern Kentucky University’s Campus Recreation
Database which houses data on all students who utilize the campus recreation facility and
programs offered, as well as data from Eastern Kentucky University’s Banner system.
All data were imported into SPSS for analysis.
Research Design and Analysis
The statistical analysis used to investigate research question one is an ANCOVA.
There are three separate ANCOVAs for each type of campus recreation activities in this
study—gym facility use, Adventure Programs and Intramural Sports. The statistical
analysis used to investigate research question two is a multiple regression. There are
three separate multiple regressions, one for each of the type of campus recreation
activities in this study—gym facility use, Adventure Programs and Intramural Sports.
The null hypothesis is that retention rates will not be affected by participation in campus
recreation programs. The alternate hypothesis is that participation in campus recreation
programs does affect retention rates. A multiple regression includes more than one
independent variable. In this study, four predictor variables are included. As a statistical
analysis, multiple regression attempts to model the relationship between two or more

Running head: EFFECT OF UNIVERSITY CAMPUS RECREATION PROGRAMS
39
explanatory variables and a response variable by fitting a linear equation to observed
data.
Variables
Three covariates were used in this study for research question one—first
generation status, gender, and non-traditional students. Students were coded first-
generation= 1 or non-first generation= 0. Gender was coded as male=1 and female= 0.
Non-traditional students were coded non-traditional students=1 and traditional
students=0. The covariates were chosen based on the impact they can have on student
retention as demonstrated in previous research. The independent groups are 0= non-
participant in recreational activities and 1= participant in recreational activities. There
are three separate ANCOVAs, one for each of the recreation activities in this study. The
dependent variable is retention for all three ANCOVAs in this study, coded as retained=
1 and not retained= 0.
Four predictor variables were used in this study for research question two—first
generation status, gender, non-traditional student, and total number of participation in
recreational activities. The fourth predictor changes in each regression—frequency of
participation in gym use, frequency of participation in Adventure Programs and
frequency of participation in Intramural Sports. First generation students were coded
first-generation= 1, non-first generation= 0. Gender was coded as male=1 and female= 0.
Non-traditional students were coded non-traditional students=1 and traditional
students=0. Variables were chosen based on the impact they can have on student
retention as outlined in prior research. The dependent variable for research question two
is retention, coded as retained= 1 and not retained= 0.

Running head: EFFECT OF UNIVERSITY CAMPUS RECREATION PROGRAMS
40
Limitations of the Study
There are several limitations that need to be acknowledged regarding this study.
One limitation to the study is the fact that the findings are specific to students at Eastern
Kentucky University. Due to the limited scope of the study, the results cannot be
generalized to other student populations. Although the study examines the various
activities offered through campus recreation, the study is limited to measuring the effect
of one campus recreation facility. Therefore, the results cannot be generalized to other
campus recreation facilities across various postsecondary institutions.
Another limitation to the study that should be acknowledged is Intramural Sports.
There is a record for each team that joined, but not on each game they played. Therefore,
the data may not accurately reflect participation rates if student identification cards are
not swiped or sign in rosters are not collected at each game.
Despite the limitations to this study, the findings offer beneficial information to
university administrators and researchers examining campus recreation and the effects the
programs have on student retention. The results of this study also provide valuable
information to those involved in the decision-making process on various student
programs on campus, specifically in regards to allocating funds for campus recreation.

Running head: EFFECT OF UNIVERSITY CAMPUS RECREATION PROGRAMS
41
IV. RESULTS
Results
The purpose of this study was to determine the effect a university campus
recreation center use has on student retention. Specifically, this study looked at the
various programs offered through campus recreation at Eastern Kentucky University to
examine the effect on retention for students in the 2011-2012 academic year, and the
2012-2013 academic year. Full-time freshman students enrolled at the Richmond campus
were analyzed.
This chapter reports the results from the data that were analyzed. The first section
presents crosstabulations for gym facility participation data by gender, non-traditional
status and first generation status. After that, a one-way Analysis of Co-Variance
(ANCOVA) was employed with gym visit as the independent variable and gender, non-
traditional, and first generation students as covariates. The purpose was to determine if
participation in gym use effected retention after controlling for the three covariates. A
multiple regression was run on the predictive ability of total number of participation in
gym visits to explain retention when the three student characteristics assessed are
included in the model.
The second and third sections present the results of Adventure Programs and
Intramural Sports in the same order of crosstabulations by gender, non-traditional status
and first generation status, followed by a one-way ANCOVA and multiple regression.

Running head: EFFECT OF UNIVERSITY CAMPUS RECREATION PROGRAMS
42
Differences in Gym Use by Student Characteristics
Differences in Gym Use by Gender
Gym Participation by Gender
To examine the gym facility participation by gender, a crosstabulation was
created. The crosstabulation in Table 4.1 combines both academic year 2011-2012 (n=
2294) and academic year 2012-2013 (n= 2173), and shows the number of female
freshman who visited the gym (51.9%) is greater than the number of males who visited
the gym (48.1%).
Table 4.1
Crosstabulation: Gym Visits by Gender
________________________________________________________________________
No Visit Visited Total
________________________________________________________________________
Gender Female Count 541 1840 2381
% within Gender 22.7% 77.3% 100%
% within Gym Visit 58.5% 51.9% 53.3%
Male Count 383 1703 2086
% within Gender 18.4% 81.6% 100%
% within Gym Visit 41.5% 48.1% 46.7%
Total Count 924 3543 4467
% within Gender 20.7% 79.3% 100%
% within Gym Visit 100% 100% 100%
________________________________________________________________________

Running head: EFFECT OF UNIVERSITY CAMPUS RECREATION PROGRAMS
43
Mean Gym Visits by Gender
The mean number of visits to the gym by gender was determined for both males
and females. Specifically, females (M = 12.94, SD = 18.50) visited the gym less than
males (M = 21.29, SD = 29.76) as displayed in Table 4.2.
Table 4.2
Mean Number of Gym Visits by Gender
________________________________________________________________________
Gender M N SD
________________________________________________________________________
Female 12.94 2381 18.501
Male 21.29 2086 29.768
Total 16.84 4467 24.768
________________________________________________________________________
Differences in Gym Use by First-Generation Status
Gym Participation by First-Generation Students
To examine the gym facility participation by first generation status, a
crosstabulation was created. The crosstabulation in Table 4.3 combines both academic
year 2011-2012 (n= 2294) and academic year 2012-2013 (n= 2173), and shows the
number of non-first generation freshman visited the gym (69.5%) more than the number
of first generation freshman who visited the gym (30.5%).

Running head: EFFECT OF UNIVERSITY CAMPUS RECREATION PROGRAMS
44
Table 4.3
Crosstabulation: Gym Visits by First Generation Status
________________________________________________________________________
No Visit Visited Total
________________________________________________________________________
First Generation Student
No Count 570 2461 3031
% within First Gen 18.8% 81.2% 100%
% within Gym Visit 61.7% 69.5% 67.9%
Yes Count 354 1082 2086
% within First Gen 24.7% 75.3% 100%
% within Gym Visit 38.3% 30.5% 2.1%
Total Count 924 3543 4467
% within First Gen 20.7% 79.3% 100%
% within Gym Visit 100% 100% 100%
________________________________________________________________________
Mean Gym Visits by First-Generation Students
The mean number of visits to the gym by first generation students was determined
for both first generation students and non-first generation students. Non-first generation
students (M = 17.89, SD = 25.59) visited the gym more than first generation students (M
= 14.62, SD = 22.77) as shown in Table 4.4.

Running head: EFFECT OF UNIVERSITY CAMPUS RECREATION PROGRAMS
45
Table 4.4
Mean Number of Gym Visits by First Generation Status
________________________________________________________________________
First Generation M N SD
________________________________________________________________________
No 17.89 3031 25.595
Yes 14.62 1436 22.775
Total 16.84 4467 24.768
________________________________________________________________________
Differences in Gym Use by Non-Traditional Status
Gym Participation by Non-Traditional Status
To examine the gym facility participation by non-traditional generation status, a
crosstabulation was created. The crosstabulation in Table 4.5 combines both academic
year 2011-2012 (n= 2294) and academic year 2012-2013 (n= 2173), and shows the
number of non-traditional freshman who visited the gym (1.2%) is less than the number
of traditional freshman students who visited the gym (98.8%).

Running head: EFFECT OF UNIVERSITY CAMPUS RECREATION PROGRAMS
46
Table 4.5
Crosstabulation: Gym Visits by Non-Traditional Status
________________________________________________________________________
No Visit Visited Total
________________________________________________________________________
Non-Traditional Student
No Count 857 3502 4359
% within Non-Trad 19.7% 80.3% 100%
% within Gym Visit 92.7% 98.8% 97.6%
Yes Count 67 41 108
% within Non-Trad 62.0% 38.0% 100%
% within Gym Visit 7.3% 1.2% 2.4%
Total Count 924 3543 4467
% within Non-Trad 20.7% 79.3% 100%
% within group 100% 100% 100%
________________________________________________________________________
Mean Gym Visits by Non-Traditional Students
The mean number of visits to the gym by non-traditional students was determined
for both non-traditional students and traditional students. Non-traditional students (M =
5.48, SD = 16.81) visited the gym less than traditional students (M = 17.12, SD = 24.87)
as shown in Table 4.6.
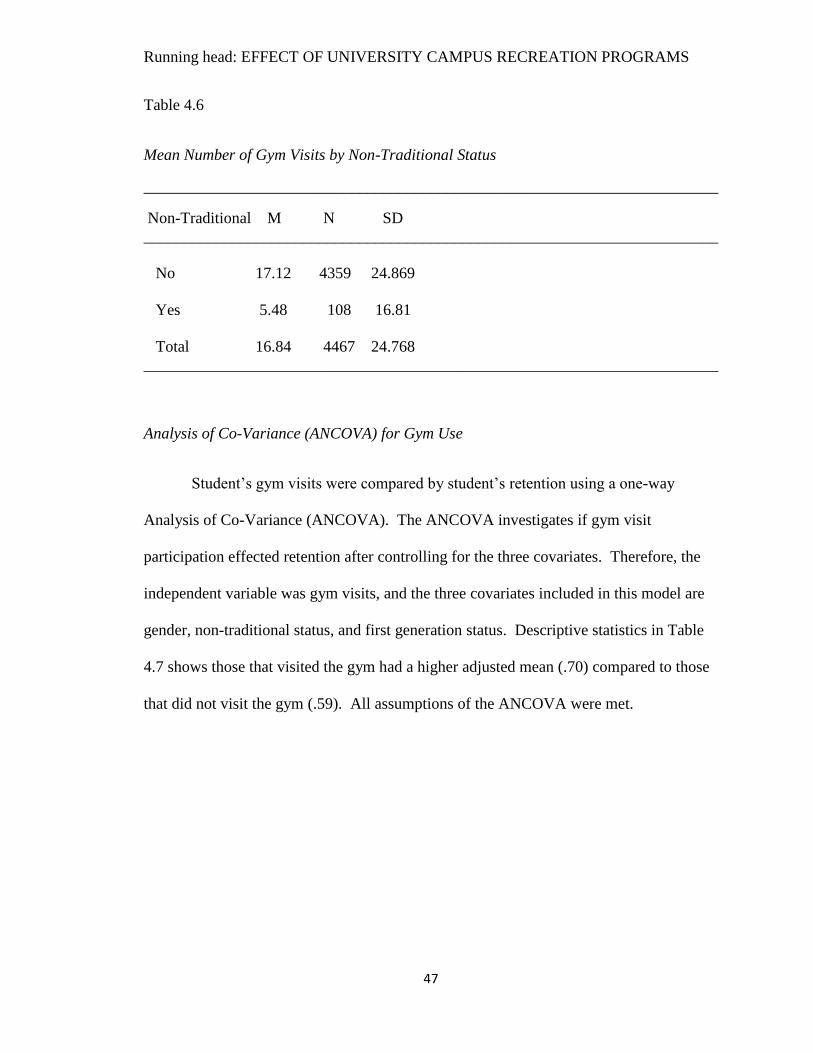
Running head: EFFECT OF UNIVERSITY CAMPUS RECREATION PROGRAMS
47
Table 4.6
Mean Number of Gym Visits by Non-Traditional Status
________________________________________________________________________
Non-Traditional M N SD
________________________________________________________________________
No 17.12 4359 24.869
Yes 5.48 108 16.81
Total 16.84 4467 24.768
________________________________________________________________________
Analysis of Co-Variance (ANCOVA) for Gym Use
Student’s gym visits were compared by student’s retention using a one-way
Analysis of Co-Variance (ANCOVA). The ANCOVA investigates if gym visit
participation effected retention after controlling for the three covariates. Therefore, the
independent variable was gym visits, and the three covariates included in this model are
gender, non-traditional status, and first generation status. Descriptive statistics in Table
4.7 shows those that visited the gym had a higher adjusted mean (.70) compared to those
that did not visit the gym (.59). All assumptions of the ANCOVA were met.

Running head: EFFECT OF UNIVERSITY CAMPUS RECREATION PROGRAMS
48
Table 4.7
Percent Retained by Participation by Gym Visits or Not
________________________________________________________________________
Gym Visits M SD N
________________________________________________________________________
No .59 .492 924
Yes .70 .459 3543
Total .68 .468 4467
________________________________________________________________________
Collectively, the variables account for 2.6% of the variance in student retention [F =
29.35, (4, 4462), p = .000, η² = .026]. Gender exhibited the largest effect (Partial η² =
.011) and accounted for the largest amount of variance in students’ retention yet still a
small amount. First generation was significant, but only accounted for a small amount of
variance in retention (η² = .007). Non-traditional was also significant, but only accounted
for a small amount of variance in retention (η² = .001). After controlling for gender, first-
generation and non-traditional students, gym visitation significantly affected retention but
explained only .9% of variance in student retention.

Running head: EFFECT OF UNIVERSITY CAMPUS RECREATION PROGRAMS
49
Table 4.8
Tests of Between-Subjects Effects: Gym Visits
Dependent Variable: Retention
________________________________________________________________________
Source Type III SS df MS F Sig. Partial Eta Squared
________________________________________________________________________
Corrected Model 25.068 a 4 6.267 29.35 .000 .026
Intercept 769.933 1 769.933 3605.43 .000 .447
Gender 10.721 1 10.721 50.20 .000 .011
First Generation 6.331 1 6.331 29.64 .000 .007
Non-Traditional .874 1 .874 4.09 .000 .001
Gym Visit 8.913 1 8.913 41.74 .000 .009
Error 952.851 4462 .214
Total 3021.000 4467
Corrected Total 977.919 4466
________________________________________________________________________ a. R Squared = .026 (Adjusted R Squared = .025)
The above significant test is a comparison of the estimated marginal or adjusted
means. The estimated marginal means shown in Table 4.9 reveal that students who visit
the gym have the highest mean (M=.699) compared to the adjusted mean of those who
did not visit the gym (M=.587).
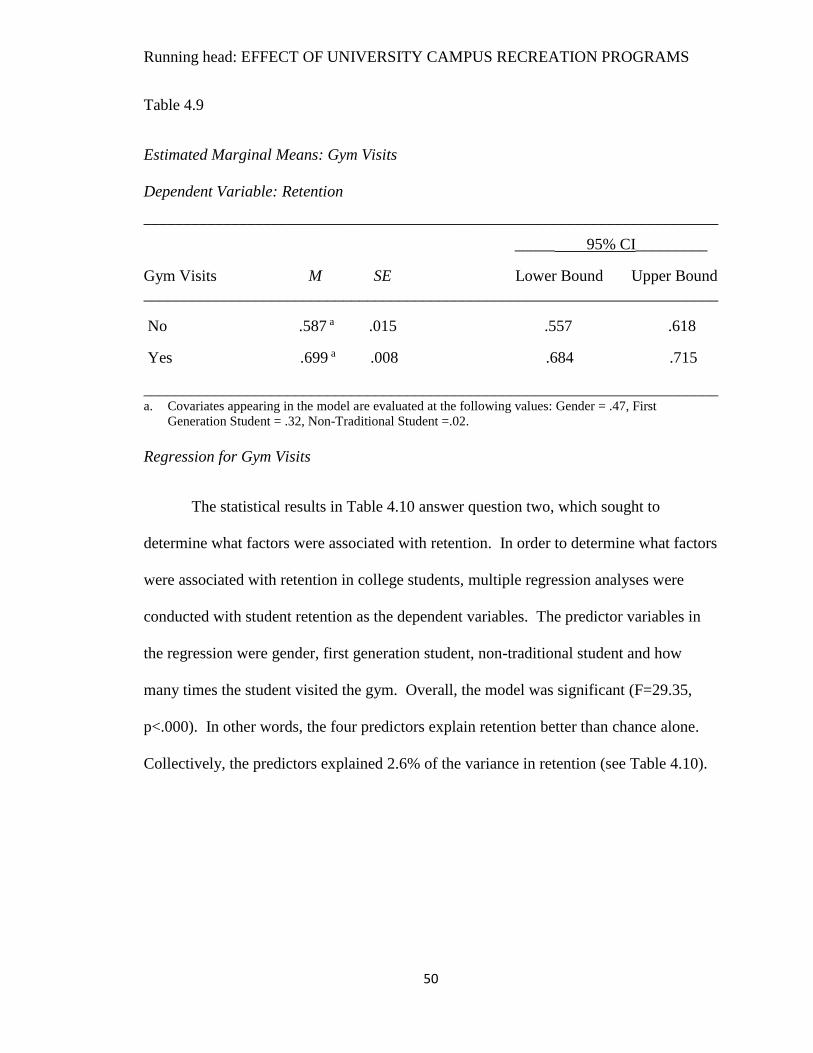
Running head: EFFECT OF UNIVERSITY CAMPUS RECREATION PROGRAMS
50
Table 4.9
Estimated Marginal Means: Gym Visits
Dependent Variable: Retention
________________________________________________________________________
_____ 95% CI_________
Gym Visits M SE Lower Bound Upper Bound
________________________________________________________________________
No .587 a .015 .557 .618
Yes .699 a .008 .684 .715
________________________________________________________________________ a. Covariates appearing in the model are evaluated at the following values: Gender = .47, First
Generation Student = .32, Non-Traditional Student =.02.
Regression for Gym Visits
The statistical results in Table 4.10 answer question two, which sought to
determine what factors were associated with retention. In order to determine what factors
were associated with retention in college students, multiple regression analyses were
conducted with student retention as the dependent variables. The predictor variables in
the regression were gender, first generation student, non-traditional student and how
many times the student visited the gym. Overall, the model was significant (F=29.35,
p<.000). In other words, the four predictors explain retention better than chance alone.
Collectively, the predictors explained 2.6% of the variance in retention (see Table 4.10).

Running head: EFFECT OF UNIVERSITY CAMPUS RECREATION PROGRAMS
51
Table 4.10
Regression: Retention
Variables Entered/Removeda
________________________________________________________________________
Model Variables Entered Variables Removed Method
________________________________________________________________________
1 Visited Gym in 2011-12 or 2013, Enter
Gender, First Generation Student,
Non-Traditional Studentb
_______________________________________________________________________ a. Dependent Variable: Retention
b. All Requested variables entered.
Model Summary
Model R R Square Adjusted R Square Std. Error of the Estimate
________________________________________________________________________
1 .160a .026 .025 .462
________________________________________________________________________ a. Predictors: (Constant), Visited the Gym in 2011-12 or 2013, Gender, First Generation Student, Non-
Traditional Student
______________________________________________________________________________________
ANOVAa
Model Sum of Squares df Mean Square F Sig.
________________________________________________________________________
Regression 25.068 4 6.267 29.347 .000b
Residual 952.851 4462 .214
Total 977.919 4466
________________________________________________________________________ a. Dependent Variable: Retention. b. Predictors: (Constant), Visited Gym in 2011-12 or 2013, Gender, First Generation Student, Non-
Traditional Student
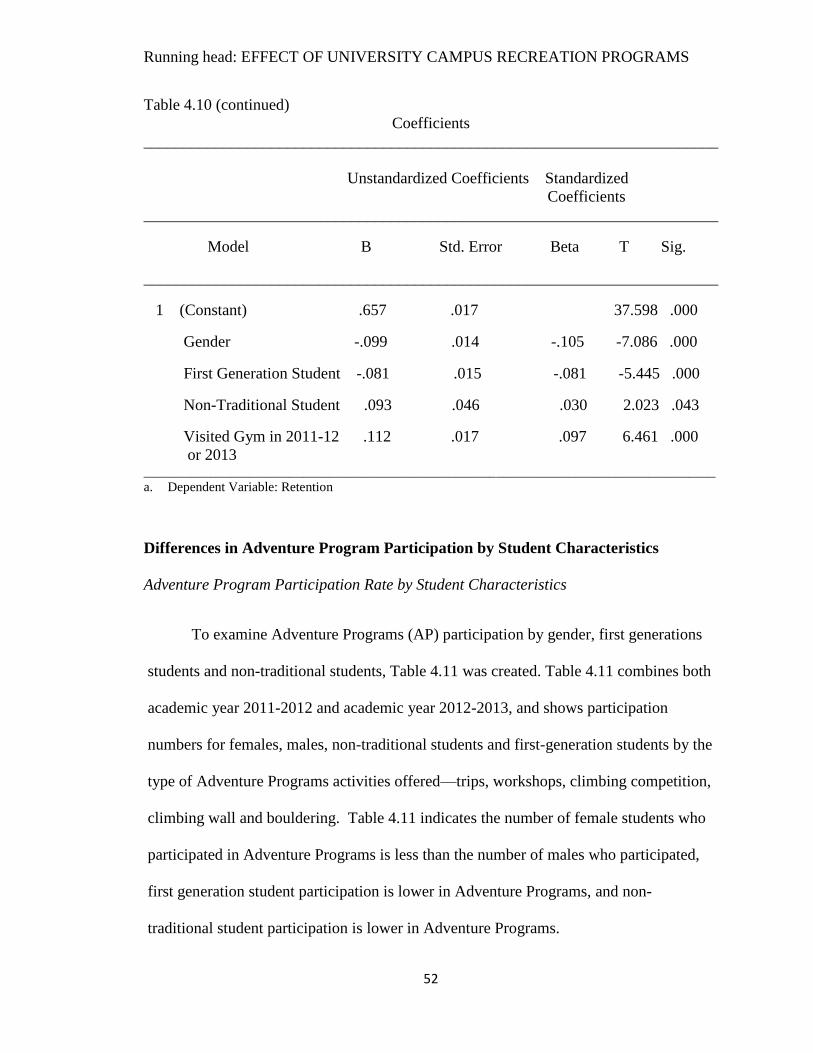
Running head: EFFECT OF UNIVERSITY CAMPUS RECREATION PROGRAMS
52
Table 4.10 (continued)
Coefficients
________________________________________________________________________
Unstandardized Coefficients Standardized
Coefficients
________________________________________________________________________
Model B Std. Error Beta T Sig.
________________________________________________________________________
1 (Constant) .657 .017 37.598 .000
Gender -.099 .014 -.105 -7.086 .000
First Generation Student -.081 .015 -.081 -5.445 .000
Non-Traditional Student .093 .046 .030 2.023 .043
Visited Gym in 2011-12 .112 .017 .097 6.461 .000
or 2013 ______________________________________________________________________________________
a. Dependent Variable: Retention
Differences in Adventure Program Participation by Student Characteristics
Adventure Program Participation Rate by Student Characteristics
To examine Adventure Programs (AP) participation by gender, first generations
students and non-traditional students, Table 4.11 was created. Table 4.11 combines both
academic year 2011-2012 and academic year 2012-2013, and shows participation
numbers for females, males, non-traditional students and first-generation students by the
type of Adventure Programs activities offered—trips, workshops, climbing competition,
climbing wall and bouldering. Table 4.11 indicates the number of female students who
participated in Adventure Programs is less than the number of males who participated,
first generation student participation is lower in Adventure Programs, and non-
traditional student participation is lower in Adventure Programs.

Running head: EFFECT OF UNIVERSITY CAMPUS RECREATION PROGRAMS
53
Table 4.11
Adventure Program Participation by Student Characteristics
________________________________________________________________________
Adventure Programs Female Male Non-Traditional First Generation
_______________________________________________________________________
AP Trips 14 (0.31%) 15 (0.33%) 0 7
AP Workshops 18 (0.40%) 37 (0.82%) 0 9
Climbing Competition 5 (0.31%) 15 (0.33%) 0 4
Climbing Wall 284 (6.3%) 310 (6.9%) 5 176
Bouldering 16 (0.35%) 44 (0.98%) 0 19
________________________________________________________________________
Differences in Adventure Programs by Gender
Adventure Programs Participation by Gender
To examine the participation by gender in Adventure Programs, a crosstabulation
was created. The crosstabulation in Table 4.12 combines academic year 2011-2012 and
academic year 2012-2013 and includes all of the activities offered through Adventure
Programs—trips, workshops, climbing competition, climbing wall and bouldering.
Table 4.12 shows of all participants in Adventure Programs 47.9% were females and
52.1% were males.

Running head: EFFECT OF UNIVERSITY CAMPUS RECREATION PROGRAMS
54
Table 4.12
Crosstabulation: Adventure Program Participation by Gender
________________________________________________________________________
No Yes Total
________________________________________________________________________
Gender Female Count 2098 294 2392
% within Gender 87.7% 12.3% 100%
% within AP 54.2% 47.9% 53.3%
Male Count 1773 320 2093
% within Gender 84.7% 15.3% 100%
% within AP 45.8% 52.1% 46.7%
Total Count 4871 614 4485
% within Gender 86.3% 13.7% 100%
% within AP 100% 100% 100%
________________________________________________________________________
Differences in Adventure Programs Participation by First-Generation Status
Adventure Programs Participation by First-Generation Students
To examine the Adventure Programs participation by first generation status, a
crosstabulation was created. The crosstabulation in Table 4.13 combines academic year
2011-2012 and academic year 2012-2013 and includes all of the activities offered
through Adventure Programs—trips, workshops, climbing competition, climbing wall

Running head: EFFECT OF UNIVERSITY CAMPUS RECREATION PROGRAMS
55
and bouldering. Table 4.13 shows of all participants in Adventure Programs 70.5%
were non-first generation students and 29.5% were first generation freshman.
Table 4.13
Crosstabulation: Adventure Programs Participation by First Generation Status
________________________________________________________________________
No Yes Total
________________________________________________________________________
First Generation Student
No Count 2608 433 3041
% within First Gen 85.8% 14.2% 100%
% within AP 67.4% 70.5% 67.8%
Yes Count 1263 181 1444
% within First Gen 87.5% 12.5% 100%
% within AP 32.6% 29.5% 32.2%
Total Count 3871 614 4485
% within Gender 86.3% 13.7% 100%
% within AP 100% 100% 100%
________________________________________________________________________
Differences in Adventure Programs Participation by Non-Traditional Status
Adventure Programs Participation by Non-Traditional Students
To examine the Adventure Programs participation by non-traditional students, a
crosstabulation was created. The crosstabulation in Table 4.14 combines academic year
2011-2012 academic year 2012-2013 and contains all of the activities offered through
Adventure Programs—trips, workshops, climbing competition, climbing wall and

Running head: EFFECT OF UNIVERSITY CAMPUS RECREATION PROGRAMS
56
bouldering. Table 4.14 indicates of all participants in Adventure Programs, 0.8% were
non-traditional students and 99.2% were traditional students.
Table 4.14
Crosstabulation: Adventure Program Participation by Non-Traditional Students
________________________________________________________________________
No Yes Total
________________________________________________________________________
Non-Traditional Student
No Count 3768 609 4377
% within Non Trad 86.1% 13.9% 100%
% within AP 97.3% 99.2% 97.6%
Yes Count 103 5 108
% within Non Trad 95.4% 4.6% 100%
% within AP 2.7% 0.8% 2.4%
Total Count 3871 614 4485
% within Non Trad 86.3% 13.7% 100%
% within AP 100% 100% 100%
________________________________________________________________________
Analysis of Co-Variance (ANCOVA) for Adventure Programs
Participation in Adventure Programs were compared by student’s retention using
a one-way Analysis of Co-Variance (ANCOVA). The ANCOVA investigates if
participation in Adventure Programs effected retention after controlling for the three
covariates. Therefore, the independent variable was AP participation and the three
covariates included in this model are gender, non-traditional status, and first generation

Running head: EFFECT OF UNIVERSITY CAMPUS RECREATION PROGRAMS
57
status. Descriptive statistics in Table 4.15 shows those who participated in Adventure
Programs had a higher adjusted mean (.77) compared to those who did not participate in
Adventure Programs (.66). All assumptions of the ANCOVA were met.
Table 4.15
Percent Retained by Participation in Adventure Programs or Not
________________________________________________________________________
Adventure Programs M SD N
Participant
________________________________________________________________________
No .66 .473 3871
Yes .77 .421 614
Total .68 .468 4485
________________________________________________________________________
Together, the variables account for 2.4% of the variance in student retention [F =
26.98, (4, 4480), p = .000, η² = .024]. Gender exhibited the largest effect (Partial η² =
.010) and accounted for the largest amount of variance in students’ retention. First
generation was significant, but only accounted for a small amount of variance in retention
(η² = .008). Non-traditional was not significant (η² = .000). Adventure Programs
participation was significant but explained only .7% of the variance in retention.

Running head: EFFECT OF UNIVERSITY CAMPUS RECREATION PROGRAMS
58
Table 4.16
Tests of Between-Subjects Effects: Adventure Programs
Dependent Variable: Retention
________________________________________________________________________
Source Type III SS df MS F Sig. Partial Eta Squared
________________________________________________________________________
Corrected Model 23.106 a 4 5.776 26.98 .000 .024
Intercept 780.461 1 780.461 3645.31 .000 .449
Gender 10.083 1 10.083 47.09 .000 .010
First Generation 7.308 1 7.308 34.13 .000 .008
Non-Traditional .325 1 .325 1.517 .218 .000
AP Participant 6.813 1 6.813 31.82 .000 .007
Error 959.168 4480 .214
Total 3032.000 4485
Corrected Total 982.273 4484
________________________________________________________________________ b. R Squared = .024 (Adjusted R Squared = .023)
The above significant test is a comparison of the estimated marginal or adjusted
means. The estimated marginal means shown in Table 4.17 reveal that students who
participated in Adventure Programs have the highest mean (M=.699) compared to the
adjusted mean of those who did not visit the gym (M=.587).
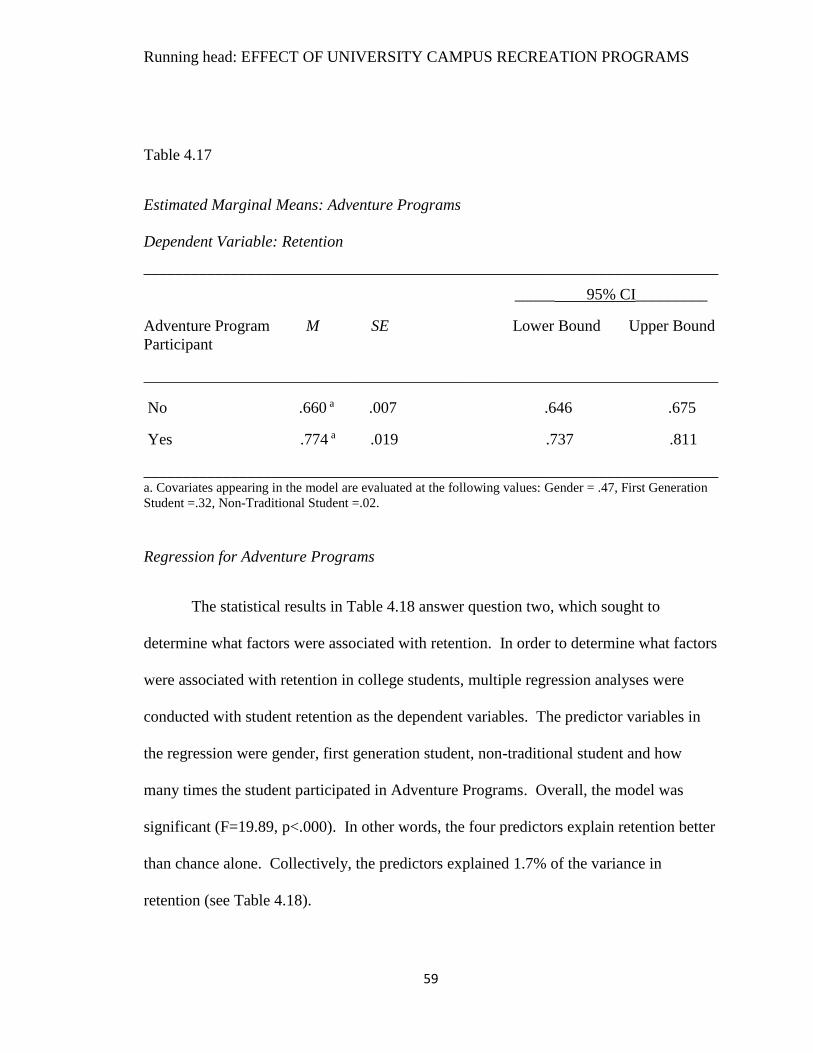
Running head: EFFECT OF UNIVERSITY CAMPUS RECREATION PROGRAMS
59
Table 4.17
Estimated Marginal Means: Adventure Programs
Dependent Variable: Retention
________________________________________________________________________
_____ 95% CI_________
Adventure Program M SE Lower Bound Upper Bound
Participant
________________________________________________________________________
No .660 a .007 .646 .675
Yes .774 a .019 .737 .811
________________________________________________________________________ a. Covariates appearing in the model are evaluated at the following values: Gender = .47, First Generation
Student =.32, Non-Traditional Student =.02.
Regression for Adventure Programs
The statistical results in Table 4.18 answer question two, which sought to
determine what factors were associated with retention. In order to determine what factors
were associated with retention in college students, multiple regression analyses were
conducted with student retention as the dependent variables. The predictor variables in
the regression were gender, first generation student, non-traditional student and how
many times the student participated in Adventure Programs. Overall, the model was
significant (F=19.89, p<.000). In other words, the four predictors explain retention better
than chance alone. Collectively, the predictors explained 1.7% of the variance in
retention (see Table 4.18).

Running head: EFFECT OF UNIVERSITY CAMPUS RECREATION PROGRAMS
60
Table 4.18
Regression: Retention
Model Summary
Model R R Square Adjusted R Square Std. Error of the Estimate
________________________________________________________________________
1 .132a .017 .017 .464
________________________________________________________________________ b. Predictors: (Constant), Total # of Participation in AP, First Generation Student, Non-Traditional
Student, Gender
______________________________________________________________________________________
ANOVAa
Model Sum of Squares df Mean Square F Sig.
________________________________________________________________________
Regression 17.145 4 4.286 19.896 .000b
Residual 965.128 4480 .215
Total 982.273 4484
________________________________________________________________________ c. Dependent Variable: Retention. d. Predictors: (Constant), Total # of Participation in AP, First Generation Student, Non-Traditional
Student, Gender
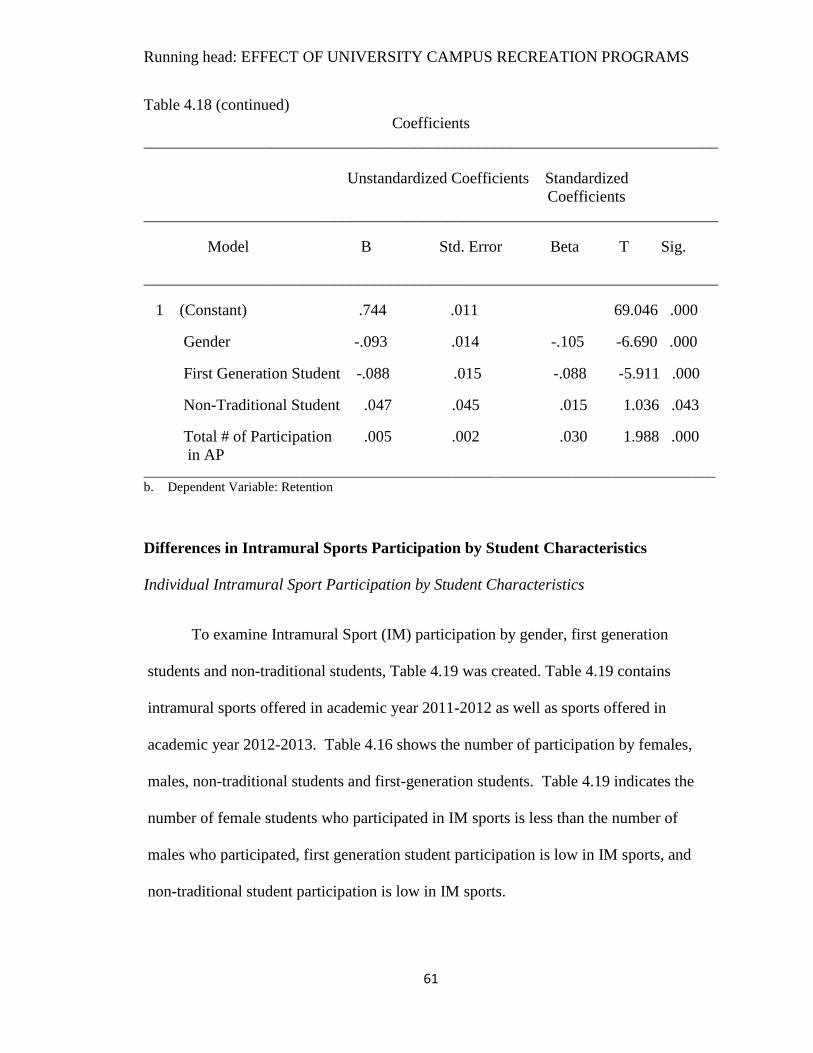
Running head: EFFECT OF UNIVERSITY CAMPUS RECREATION PROGRAMS
61
Table 4.18 (continued)
Coefficients
________________________________________________________________________
Unstandardized Coefficients Standardized
Coefficients
________________________________________________________________________
Model B Std. Error Beta T Sig.
________________________________________________________________________
1 (Constant) .744 .011 69.046 .000
Gender -.093 .014 -.105 -6.690 .000
First Generation Student -.088 .015 -.088 -5.911 .000
Non-Traditional Student .047 .045 .015 1.036 .043
Total # of Participation .005 .002 .030 1.988 .000
in AP ______________________________________________________________________________________
b. Dependent Variable: Retention
Differences in Intramural Sports Participation by Student Characteristics
Individual Intramural Sport Participation by Student Characteristics
To examine Intramural Sport (IM) participation by gender, first generation
students and non-traditional students, Table 4.19 was created. Table 4.19 contains
intramural sports offered in academic year 2011-2012 as well as sports offered in
academic year 2012-2013. Table 4.16 shows the number of participation by females,
males, non-traditional students and first-generation students. Table 4.19 indicates the
number of female students who participated in IM sports is less than the number of
males who participated, first generation student participation is low in IM sports, and
non-traditional student participation is low in IM sports.

Running head: EFFECT OF UNIVERSITY CAMPUS RECREATION PROGRAMS
62
Table 4.19
IM Sport Participation by Student Characteristics
_______________________________________________________________________
IM Sport Female Male Non-Traditional First Generation
Flag Football 11 44 (1.9%) 158 (6.8%) 2 (0.08%) 52 (2.3%)
Sand Volleyball 40 (1.7%) 23 (1%) 0 (0%) 17 (0.7%)
Madden 11 0 (0%) 5 (0.2%) 0 (0%) 2 (0.08%)
Wiffleball 11 1 (0.04%) 36 (1.5%) 2 (0.08%) 11 (0.48%)
Volleyball Indoors 11 50 (2.1%) 50 (2.1%) 0 (0%) 29 (1.3%)
Indoor Soccer 11 33 (1.4%) 82 (3.5%) 0 (0%) 30 (1.3%)
Softball 11 16 (0.7%) 53 (2.3%) 0 (0%) 16 (0.7%)
Go Pink Dodgeball 11 0 (0%) 6 (0.02%) 0 (0%) 1 (0.04%)
Tennis 11 2 (0.08%) 4 (0.17%) 0 (0%) 1 (0.04%)
Battleship 11 7 (0.3%) 3 (0.13%) 0 (0%) 1 (0.04%)
Spring Basketball 11 0 (0%) 1 (0.04%) 0 (0%) 1 (0.04%)
2 Person Golf 11 0 (0%) 1 (0.04%) 0 (0%) 1 (0.04%)
Outdoor Soccer 12 0 (0%) 1 (0.04%) 0 (0%) 0 (0%)
Basketball Teams 12 56 (2.5%) 141 (6.5%) 2 (0.09%) 51 (2.3%)
Volleyball 12 92 (4.2%) 41 (1.9%) 0 (0%) 41 (1.9%)
Outdoor Soccer 12 44 (2.0%) 72 (3.3%) 0 (0%) 27 (1.2%)
Softball 12 22 (1%) 44 (2%) 0 (0%) 19 (0.9%)
Wiffleball 12 2 (0.09%) 33 (1.5%) 0 (0%) 11 (0.5%)
Dodgeball 12 12 (0.5%) 70 (3.2%) 0 (0%) 14 (0.6%)
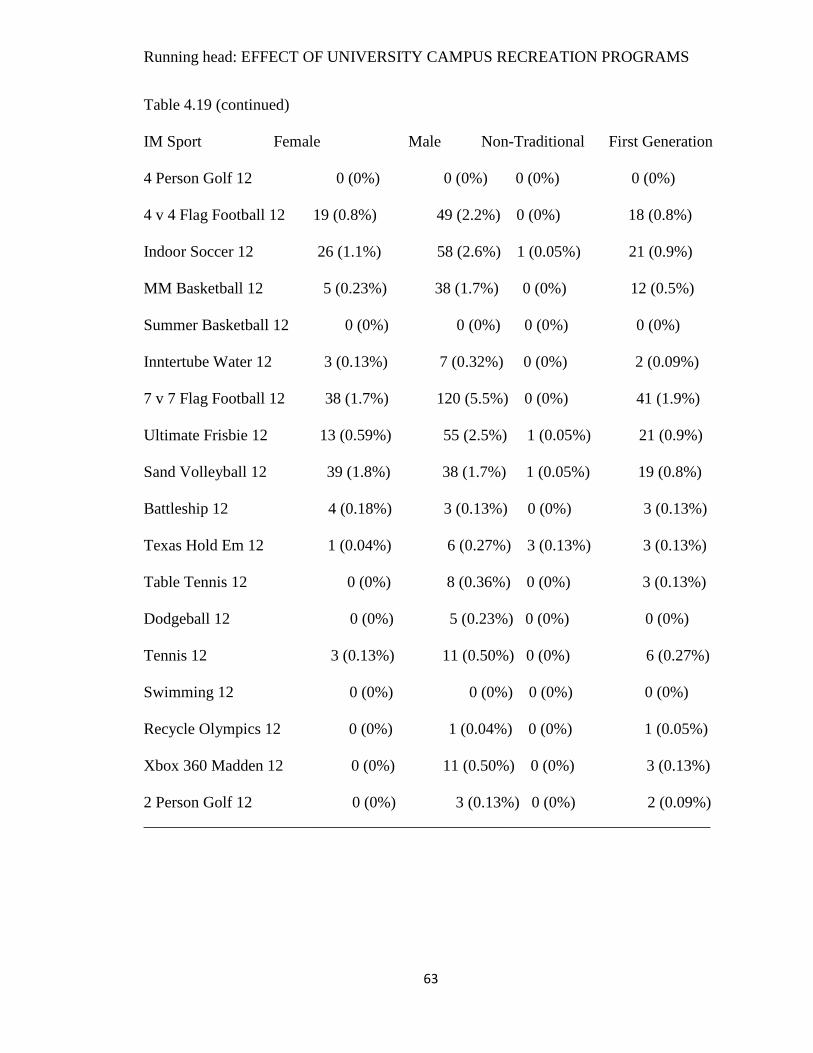
Running head: EFFECT OF UNIVERSITY CAMPUS RECREATION PROGRAMS
63
Table 4.19 (continued)
IM Sport Female Male Non-Traditional First Generation
4 Person Golf 12 0 (0%) 0 (0%) 0 (0%) 0 (0%)
4 v 4 Flag Football 12 19 (0.8%) 49 (2.2%) 0 (0%) 18 (0.8%)
Indoor Soccer 12 26 (1.1%) 58 (2.6%) 1 (0.05%) 21 (0.9%)
MM Basketball 12 5 (0.23%) 38 (1.7%) 0 (0%) 12 (0.5%)
Summer Basketball 12 0 (0%) 0 (0%) 0 (0%) 0 (0%)
Inntertube Water 12 3 (0.13%) 7 (0.32%) 0 (0%) 2 (0.09%)
7 v 7 Flag Football 12 38 (1.7%) 120 (5.5%) 0 (0%) 41 (1.9%)
Ultimate Frisbie 12 13 (0.59%) 55 (2.5%) 1 (0.05%) 21 (0.9%)
Sand Volleyball 12 39 (1.8%) 38 (1.7%) 1 (0.05%) 19 (0.8%)
Battleship 12 4 (0.18%) 3 (0.13%) 0 (0%) 3 (0.13%)
Texas Hold Em 12 1 (0.04%) 6 (0.27%) 3 (0.13%) 3 (0.13%)
Table Tennis 12 0 (0%) 8 (0.36%) 0 (0%) 3 (0.13%)
Dodgeball 12 0 (0%) 5 (0.23%) 0 (0%) 0 (0%)
Tennis 12 3 (0.13%) 11 (0.50%) 0 (0%) 6 (0.27%)
Swimming 12 0 (0%) 0 (0%) 0 (0%) 0 (0%)
Recycle Olympics 12 0 (0%) 1 (0.04%) 0 (0%) 1 (0.05%)
Xbox 360 Madden 12 0 (0%) 11 (0.50%) 0 (0%) 3 (0.13%)
2 Person Golf 12 0 (0%) 3 (0.13%) 0 (0%) 2 (0.09%)
_______________________________________________________________________

Running head: EFFECT OF UNIVERSITY CAMPUS RECREATION PROGRAMS
64
Differences in Intramural Sports Participation by Gender
Intramural Sports Participation by Gender
To examine the participation by gender in Intramural Sports, a crosstabulation
was created. The crosstabulation in Table 4.20 combines academic year 2011-2012 and
academic year 2012-2013 and includes all Intramural Sports offered during those years
(see Table 4.19 for sports). Table 4.20 shows of all students who participated in
Intramural Sports, 35.9% of females participated and 64.1% of males participated.
Table 4.20
Crosstabulation: Intramural Sports Participation by Gender
________________________________________________________________________
No Yes Total
________________________________________________________________________
Gender Female Count 2042 345 2387
% within Gender 85.5% 14.5% 100%
% within IM 58.1% 35.9% 53.3%
Male Count 1474 615 2089
% within Gender 70.6% 29.4% 100%
% within IM 41.9% 64.1% 46.7%
Total Count 3516 960 4476
% within Gender 78.6% 21.4% 100%
% within IM 100% 100% 100%
________________________________________________________________________

Running head: EFFECT OF UNIVERSITY CAMPUS RECREATION PROGRAMS
65
Differences in Intramural Sport Participation by First-Generation Status
Intramural Sports Participation by First-Generation Students
To examine the Intramural Sports participation by first generation status, a
crosstabulation was created. The crosstabulation in Table 4.21 combines academic year
2011-2012 and 2012-2013 and contains all of the Intramural Sports offered in both
years (see Table 4.19 for list of sports). Table 4.21 shows of all participation in
Intramural Sports, 27.1% were first generation students and 72.3% were non-first
generation freshman.
Table 4.21
Crosstabulation: Intramural Sports Participation by First Generation Status
________________________________________________________________________
No Yes Total
________________________________________________________________________
First Generation Student
No Count 2343 695 3038
% within First Gen 77.1% 22.9% 100%
% within IM 66.6% 72.3% 67.9%
Yes Count 1173 266 1439
% within First Gen 81.5% 18.5% 100%
% within IM 33.4% 27.7% 32.1%
Total Count 3516 961 4477
% within First Gen 78.5% 21.5% 100%
% within IM 100% 100% 100%

Running head: EFFECT OF UNIVERSITY CAMPUS RECREATION PROGRAMS
66
________________________________________________________________________
Differences in Intramural Sports Participation by Non-Traditional Status
Intramural Sports Participation by Non-Traditional Students
To examine the Intramural Sports participation by non-traditional students, a
crosstabulation was created. The crosstabulation in Table 4.22 combines academic year
2011-2012 academic year 2012-2013 and includes all of the Intramural Sports offered in
the duration of those years (see Table 4.19 for sports). Table 4.22 shows of all
participation in Intramural Sports, 0.8% were non-traditional students and 99.2% were
traditional students.
Table 4.22
Crosstabulation: Intramural Sports Participation by Non-Traditional Students
________________________________________________________________________
No Yes Total
________________________________________________________________________
Non-Traditional Student
No Count 3416 952 4368
% within Non Trad 78.2% 21.8% 100%
% within IM 97.2% 99.2% 97.6%
Yes Count 100 8 108
% within Non Trad 92.6% 7.4% 100%
% within IM 2.8% 0.8% 2.4%
Total Count 3516 960 4476
% within Non Trad 78.6% 21.4% 100%
% within IM 100% 100% 100%

Running head: EFFECT OF UNIVERSITY CAMPUS RECREATION PROGRAMS
67
________________________________________________________________________
Analysis of Co-Variance (ANCOVA) for Intramural Sports
Participation in Intramural Sports was compared by student’s retention using a
one-way Analysis of Co-Variance (ANCOVA). The ANCOVA investigates if
participation in Intramural Sports effected retention after controlling for the three
covariates. Therefore, the independent variable was Intramural Sports participation and
the three covariates included in this model are gender, non-traditional status, and first
generation status. Descriptive statistics in Table 4.23 shows those that participated in
Intramural Sports had a higher adjusted mean (.74) compared to those that did not
participate in Intramural Sports (.66). All assumptions of the ANCOVA were met.
Table 4.23
Percent Retained by Participation in Intramural Sports and Not
________________________________________________________________________
Intramural Sports M SD N
Participant
________________________________________________________________________
No .66 .473 3516
Yes .73 .445 960
Total .68 .468 4476
________________________________________________________________________
Collectively, the variables account for 2.2% of the variance in student retention [F =
25.15, (4, 4471), p = .000, η² = .022]. Gender exhibited the largest effect (Partial η² =
.012) and accounted for the largest amount of variance in students’ retention. First
generation was significant, but only accounted for a small amount of variance in retention

Running head: EFFECT OF UNIVERSITY CAMPUS RECREATION PROGRAMS
68
(η² = .007). Non-traditional was not significant (η² = .000). After controlling for gender,
first generation and non-traditional students, Intramural Sports participation was
significant buy explained only .6% of the variance in student retention.
Table 4.24
Tests of Between-Subjects Effects: Intramural Sports
Dependent Variable: Retention
________________________________________________________________________
Source Type III SS df MS F Sig. Partial Eta Squared
________________________________________________________________________
Corrected Model 25.580 a 4 5.395 25.15 .000 .022
Intercept 862.069 1 780.461 4018.90 .000 .473
Gender 11.795 1 10.083 54.99 .000 .012
First Generation 6.696 1 7.308 32.49 .000 .007
Non-Traditional .377 1 .325 1.76 .185 .000
IM Participation 5.392 1 6.813 25.14 .000 .006
Error 959.044 4471 .215
Total 3025.000 4476
Corrected Total 980.624 4465
________________________________________________________________________ c. R Squared = .022 (Adjusted R Squared = .021)
The above significant test is a comparison of the estimated marginal or adjusted
means. The estimated marginal means shown in Table 4.25 reveal that students who
participated in Intramural Sports have the highest mean (M=.744) compared to the
adjusted mean of those who did not participate in Intramural Sports (M=.657).

Running head: EFFECT OF UNIVERSITY CAMPUS RECREATION PROGRAMS
69
Table 4.25
Estimated Marginal Means: Intramural Sports
Dependent Variable: Retention
________________________________________________________________________
_____ 95% CI_________
Gym Visits M SE Lower Bound Upper Bound
No .657 a .008 .642 .673
Yes .744 a .015 .714 .773
________________________________________________________________________ a. Covariates appearing in the model are evaluated at the following values: Gender = .47, First Generation
Student =.32, Non-Traditional Student =.02.
Regression for Intramural Sports
The statistical results in Table 4.26 answer question two, which sought to
determine what factors were associated with retention. In order to determine what factors
were associated with retention in college students, multiple regression analyses were
conducted with student retention as the dependent variable. The predictor variables in the
regression were gender, first generation student, non-traditional student and how many
times the student participated in Intramural Sports. Overall, the model was significant
(F=25.30, p<.000). In other words, the four predictors explain retention better than
chance alone. Collectively, the predictors explained 2.2% of the variance in retention
(see Table 4.26).

Running head: EFFECT OF UNIVERSITY CAMPUS RECREATION PROGRAMS
70
Table 4.26
Regression: Retention
Model Summary
Model R R Square Adjusted R Square Std. Error of the Estimate
________________________________________________________________________
1 .149a .022 .021 .463
________________________________________________________________________ c. Predictors: (Constant), Total # of Teams, First Generation Student, Non-Traditional Student, Gender
______________________________________________________________________________________
ANOVAa
Model Sum of Squares df Mean Square F Sig.
________________________________________________________________________
Regression 21.704 4 5.426 25.299 .000b
Residual 958.921 4471 .214
Total 980.624 4475
________________________________________________________________________ e. Dependent Variable: Retention. f. Predictors: (Constant), Total # of Teams, First Generation Student, Non-Traditional Student, Gender

Running head: EFFECT OF UNIVERSITY CAMPUS RECREATION PROGRAMS
71
Table 4.26 (continued)
Coefficients
________________________________________________________________________
Unstandardized Coefficients Standardized
Coefficients
________________________________________________________________________
Model B Std. Error Beta T Sig.
________________________________________________________________________
1 (Constant) .736 .011 67.579 .000
Gender -.105 .014 -.112 -7.394 .000
First Generation Student -.085 .015 -.084 -5.698 .000
Non-Traditional Student .059 .045 .019 1.300 .194
Total # of Participation .034 .007 .076 5.071 .000
IM Sports ______________________________________________________________________________________
c. Dependent Variable: Retention
Chapter five contains an overview of the significant findings from the multiple
analyses from this study. Implications of findings are discussed in relation to suggestions
of how to improve retention rates through participation in campus recreation programs.

Running head: EFFECT OF UNIVERSITY CAMPUS RECREATION PROGRAMS
72
V. DISCUSSION
Overview
This chapter presents the findings of the two research questions guiding this
study, provides a summary of the study, a discussion of the variables assessed, and
implications for practice and future research. The results of this study provide valuable
information to help administrators make informed, educated decisions regarding funding
and resources allocated to programs based on their retention efforts and effectiveness.
Finally, this chapter concludes with defining the key points of the study and fills gaps in
existing literature on retention and campus recreation.
Summary of the Study
The primary objective of this study was to determine whether participation in
campus recreation programs at Eastern Kentucky University impacted student retention.
The study was designed to determine the overall influence of participation in campus
recreation programs, including general gym facility use, Adventure Programs and
Intramural Sports, on retention of first year, full-time freshman students on Richmond’s
campus. The analysis of the results revealed a statistical significance in the retention
rates of students who participated in campus recreation programs and offers reasoning to
sustain program offerings. Given the current budget and allocation of state funding for
higher education, it is important for colleges and universities to focus their efforts on
programs that offer positive influence on student retention. In addition to establishing the
relationship between campus recreation participation and retention, this study provides
information on which programs have the largest impact on retention.

Running head: EFFECT OF UNIVERSITY CAMPUS RECREATION PROGRAMS
73
Interpretation of Results
An ANCOVA was employed for each of the campus recreation activities in this
study—gym visits, Adventure Programs and Intramural Sports. The three covariates
used for the purpose of this study were gender, first generation students and non-
traditional students. The dependent variable in this study for all three ANCOVAs is
retention.
Research Question 1
Crosstabluations were created for each of the covariates, gender, first generation
students and non-traditional students. To examine participation by the covariates,
crosstabluations were created for each campus recreation program: gym facility use,
Adventure Programs and Intramural Sports. Data revealed that more females (51.9%)
visited the gym than males (48.1%), but that males (52.1%) participate more in
Adventure Programs than females (47.9%), and males (64.1%) participate in more
Intramural Sports than females (35.9%). As previous research has shown, women are
attending college at a higher rate and make up more than half of the undergraduate
population since 1981 (Fiegener, 2008), therefore a possible explanation of the number of
female gym visits as compared to males.
In examining gym use by first generation students, data revealed first generation
students (30.5%) visit the gym considerably less than non-first generation students
(69.5%), first generation students (29.5%) participate significantly less in Adventure
Programs than non-first generation students (70.5%), and first generation students
(27.7%) participate less in Intramural Sports than non-first generation students (72.3%).
Running head: EFFECT OF UNIVERSITY CAMPUS RECREATION PROGRAMS
74
These findings are consistent with previous research. First generation college students
tend to have fewer support systems and less of a connection to the university and campus
life (Ishitani, 2006; Lohfink & Paulsen, 2005; Lundberg, Schreiner, Hovaguimian, &
Miller, 2007), consequently impacting their participation in campus recreation programs.
Furthermore, results from the crosstabulations revealed that non-traditional
student (1.2%) visit gym significantly less than traditional students (98.8%), participation
Adventure Programs by non-traditional students (0.8%) is substantially less than
traditional students (99.2%), and non-traditional (0.8%) participation in Intramural Sports
is considerably less than traditional students (99.2%). Consistent with previous research,
non-traditional students tend to participate less in extracurricular activities and have a less
participation with the campus community (Noel-Levitz, 1993). Less participation in
extracurricular activities could contribute to why non-traditional students do not
participate as frequently as other freshman students.
Three separate ANCOVAs were run for the different campus recreation activities
examined in this study—gym facility use, participation in Adventure Programs and
participation in Intramural Sports. The purpose of the ANCOVA was to determine if
participation in the various campus recreation activities assessed effected retention after
controlling for the three covariates, gender, first generation status and non-traditional
status. Descriptive statistics for gym visits showed individuals who visited the gym had a
higher adjusted mean (.70) compared to those who did not visit the gym (.59).
Descriptive statistics for Adventure Programs indicated that those who participated in
Adventure Programs had a higher adjusted mean (.77) compared to those who did not
participate in Adventure Programs (.66). As with gym visits and Adventure Programs,
Running head: EFFECT OF UNIVERSITY CAMPUS RECREATION PROGRAMS
75
descriptive statistics for Intramural Sports showed those who participated had a higher
non-adjusted mean (.74) compared to those who did not participate (.66).
Collectively, the results indicated that gender, first generation, and non-traditional
students accounted for 2.6% of the variance in student retention for gym visits, 2.4% of
variance in retention for Adventure Programs and 2.2% of variance in student retention
for Intramural Sports. In combination, these data reveal that student participation in
campus recreation programs is associated with student retention.
Research Question 2
Three separate multiple regression analyses for gym visits, Adventure Programs
and Intramural Sports were assessed in this study. The predictive ability of total number
of participation in the three campus recreation programs were assessed to explain student
retention when the three student characteristics assessed are included in the model.
Results indicate that the predictor variables in this study explain 2.6% of the variance for
gym visits, 1.7% of the variance in retention for Adventure Programs and 2.2% of the
variance in for Intramural Sports. In essence, gender, first generation status and non-
traditional status were determined to have a significant effect upon retention rates.
Data revealed that retention rates were increased for students who participated in
campus recreation programs offered at EKU as compared to those who did not
participate. While this study only explains a small amount of the variance in student
retention, it shows just how complex retention is as an issue. There are numerous
programs out there whose intention is to aid in student retention thus making the issue of
retention very complex. Even though this study explains a small percentage in variance in
Running head: EFFECT OF UNIVERSITY CAMPUS RECREATION PROGRAMS
76
retention at EKU, there are several studies in the literature supporting the finding of
students being retained at a higher rate results if they participate in campus recreation
programs. Research shows that campus recreation activities contributes to higher
retention (Astin, 1984; Miller, 2011; Terenzini & Pascarella, 1977), and that college
retention can be linked to participation in extracurricular activities, including those
offered through campus recreation centers (Frauman, 2005). While this study explains a
small amount of variance in retention at EKU, doubling or even tripling the number of
freshman students who participate in campus recreation programs would have a
substantial monetary impact on the university’s budget. If participation in campus
recreation programs increased student attrition, the amount of tuition dollars alone from
those students who do not stop out would be considerable.
Implications for Policy and Practice
Results from this study show that campus recreation programs offered at EKU are
effective at positively impacting student retention for those who participate. Increased
student retention at colleges and universities is important and ultimately has a direct
impact on state funding and how resources are allocated. Therefore, engaging students
and promoting the facilities and programs offered through campus recreation is of value
to higher education institutions. As Fenzel (2001) indicates, becoming involved in co-
curricular activities during as early as the first six weeks of college provided significant
benefits to the student. Not only would increased involvement in campus recreation
activities benefit students in the first six weeks of college, universities would reap the
benefits as well from seeing an increase in student retention. While this study explains a
small amount of variance in retention, the tuition dollars from those students retained is

Running head: EFFECT OF UNIVERSITY CAMPUS RECREATION PROGRAMS
77
substantial. Based on EKU’s current tuition and enrollment, the university would have a
profit of approximately sixty million dollars if ten percent of students were retained.
Therefore, it is recommended that EKU budget funds for campus recreation, even if only
a small amount. Based on the results of this study, it is suggested that EKU would see a
return on their investment with higher retention rates for students participating in campus
recreation programs.
Participation in campus recreation activities were shown to positively impact
student retention. Gender was the most powerful predictor in all three regressions and
non-traditional students was the least powerful in the three regressions. Administrators
should consider increased marketing efforts to grow participation numbers, specifically
for first generation and non-traditional students. It would behoove campus recreation to
offer programs targeted towards the needs and wants of first generation and non-
traditional students. Previous literature has shown that non-traditional students tend to
participate less in extracurricular activities due to responsibilities of family and work
(Noel-Levitz, 1993) and that first generation college students tend to have fewer peer
support systems and less of a connection to the university and campus life (Ishitani, 2006;
Lohfink & Paulsen, 2005; Lundberg, Schreiner, Hovaguimian, & Miller, 2007 ).
Therefore, offering programs that appeal to non-traditional students’ work and family
life, and programs that assist in building a support system for first generation college
students could potentially help participation numbers and would benefit those students.
With increased accountably for colleges and universities to retain students, it is
essential that institutions focus their efforts on ensuring students succeed. Furthermore,
Kentucky’s Council on Postsecondary Education indicate that 56 percent of jobs in

Running head: EFFECT OF UNIVERSITY CAMPUS RECREATION PROGRAMS
78
Kentucky will require some college in 2020 (Gagliardi & Hiemstra, 2013), and 65
percent of jobs will require some form of postsecondary education nationally (Carnevale
& Smith, 2012). Therefore, universities should address retention rates in order to meet
the demands of a more credentialed workforce. Not only is it important to develop a
more credentialed workforce, but higher levels of education reduce the likelihood of
being unemployed, lead to better health outcomes and higher earnings (Gagliardi &
Hiemstra, 2013; Quarterly Wage Indicator, 2011). Participation in campus recreation
programs is a small step in the right direction.
With the complexity of retention, how do you measure retention with so many
programs targeted towards retention? Given what we know of the programs efforts, are
they additive or duplicative? What evidence should university administrators use to
make decisions regarding resource allocations? Should they look very specifically at
programs when allocating funds, or should they make cuts across the board? Should a
cost benefit analysis and effect size be taken into consideration? These are all questions
that arise out of retention being so complex and questions that university administrators
need to consider.
Future Research
This study indicated that Eastern Kentucky University’s campus recreation
programs positively impacts student retention and parallels other studies on student
retention and campus recreation. This study also adds to the applied body of research
developed on the effects of campus recreation center use on students (Artinger et al.,
2006; Blech, Gebel, & Mass, 2011; Dalgarn, 2001; Downs, 2003) and contributes to the
general knowledge base on the field of campus recreation. Additional research is needed

Running head: EFFECT OF UNIVERSITY CAMPUS RECREATION PROGRAMS
79
to specifically gather information about what programs and specific recreation activities
aid is student retention.
Future studies might include qualitative design that can provide additional context
on campus recreation programs. Methods such as focus groups, interviews or others
would provide valuable information on student’s opinions of what they would like
offered at the gym, in Adventure Programs and Intramural Sports and why they
participate or not. Specifically, focus groups or interviews with first-generation and non-
traditional students would provide insight on what they would like offered and would be
of value since the results of this study showed significantly low participation numbers.
Additional research would also help the university better understand the student
population and student demographics as far as gender, first generation and non-traditional
students. A more in depth understanding of the students who attend the university, their
interest and what programs and activities they would like offered may help the institution
better meet their needs.
Additionally, more studies must be conducted in order to inform resource
allocations due to decreased appropriations at the federal and state levels. Many post-
secondary institutions are facing increased levels of accountability for retention and
enrollment numbers as a result of the declining resources. Several states have even
moved to outcome based funding and many states are likely to head in the same direction.
With states heading towards the outcomes based funding model, student retention will
become an even more important and a strategic focal point as it will be an indicator of
awarded resources. Policymakers should compare retention rates by disaggregated
student characteristics since rates vary so widely by these characteristics, and

Running head: EFFECT OF UNIVERSITY CAMPUS RECREATION PROGRAMS
80
postsecondary institutions serve very different populations. Otherwise, the rich get
richer.
Another suggestion for future research would be to examine other variables for
their effect on retention. This study looked at gender, first generation and non-traditional
students, however, variables such as socioeconomic status, the students major, student’s
financial aid status, guardian’s education level, and whether the student is employed on
or off campus. These variables could potentially have an impact on a student’s
participation in campus recreation programs. Future research examining additional
variables would help researchers understand other aspects of why students participate or
do not participate in campus recreation programs.
This study examined the campus recreation programs of one regional
comprehensive university in Kentucky. Results of similar studies could reveal key
relationships between participation in campus recreation programs, as well as college and
success factors. Studies examining campus recreation programs at various other
institutions of a similar size would add to body of existing literature on campus recreation
programs and student retention. Furthermore, there are other campus life experiences and
events that could be included for a more comprehensive examination. Examples of these
activities include athletics, Greek life, student life events and various other clubs and
organizations.
While this study did not test Tinto’s (1993) entire model, does the model of
student departure capture the complexity of retention? There are numerous variables that
need to be considered, therefore the model might need to be modified. The theory of

Running head: EFFECT OF UNIVERSITY CAMPUS RECREATION PROGRAMS
81
student departure needs to be more complex with social components and perhaps across
the entire model. In addition, does Tinto’s (1993) model work equally at other
universities, such as a research one institution, compared to a rural, regional, highly first
generation university? Future research is needed to see if results would be the same.
Conclusion
Use of information from this study could assist the institution in having a better
understanding of the relationship between involvement in campus recreation programs
and the students’ college experience. Additionally, campus recreation programs offered
and the campus recreation facilities are considered to be key components of a student’s
decision to attend a certain institution (Haines, 2004; Kasin & Dzakira, 2001; Lamont,
1991; Zizzi, Ayers, & Watson, 2004). Previous literature shows that prospective students
often rank access to recreational sport and fitness facilities for personal use higher than
internships, cultural activities, or student organizations (NIRSA, 2004). Therefore,
ensuring the campus recreation facility provides students with the most updated
equipment and current trends in programs could contribute to a student’s choice to attend
EKU, consequently impacting the university’s enrollment numbers.
Promoting campus recreation programs during college visits and tours,
highlighting the facility to potential students and marketing what all they have to offer
could help in participation rates. Having special events during welcome week or student
orientations to showcase the facility and programs would also be beneficial. Students are
looking for ways to spend their free time, meet new people, try to stay in shape and stay
physically active. As Bryant et al. (1995) indicate, campus recreation facilities facilitate
social integration by creating large numbers of opportunities for members of a college

Running head: EFFECT OF UNIVERSITY CAMPUS RECREATION PROGRAMS
82
community to interact. Therefore, showcasing the facility and programs campus
recreation offers during the first weeks of school would be ideal.
With rising student loan debt, increased tuition costs and the number of recent
college graduates without jobs, it is essential for university administrators to understand
why college recreation centers are vital to student life as well as the overall benefits of
campus recreation. The long-term return on investment for students earning college
degrees, credentialing or certificates is better—higher earnings, lower unemployment and
better health outcomes. Participation in campus recreation programs is correlated with
overall college satisfaction and success and reinforces that participation in recreational
sports is an important determinant of overall college satisfaction and success (Downs,
2003). As this study shows, retention rates for those who participate in campus
recreation are higher than those who do not participate. Campus recreation programs are
aiding in student retention, serving a purpose and should be funded accordingly.

Running head: EFFECT OF UNIVERSITY CAMPUS RECREATION PROGRAMS
83
References
Artinger, L., Clapham, L., Hunt, C., Megis, M., Milord, N., Sampson, B., et al. (2006).
The social benefits of intramural sports. NASPA Journal, 43(1), 69-86.
Astin, A.W. (1975). Preventing students from dropping out. San Francisco: Jossey-Bass.
Astin, A.W. (1999). Student Involvement: A developmental theory for higher education.
Journal of College Student Development, 40(5), 518-529.
Aud, S., Hussar, W., Planty, M., Snyder, T., Bianco, K., Fox, M., & Drake, L. (2010).
The condition of education. (Report No. NCES 2010-028). Retrieved from
Institute of Education Sciences, National Center for Education Statistics website:
http://nces.ed.gov/pubs2010/2010028.pdf
Austin, M. L, Martin, B., Yoshino, A., Schanning, K., Ogle, D., & Mittelstaedt, R.
(2010). The Intersection of community and place in an outdoor orientation
program. Journal of Outdoor Recreation, Education, and Leadership, 2(1), 74-92.
Banta, T. W. (Ed.). (1991). Quality and importance of recreational services: Technical
manualand survey. Corvallis, OR: NIRSA.
Bean, J.P. (1980). Dropouts and turnover: The synthesis and test of causal model of
student attrition. Research in Higher Education, 12, 155-187.
Belch, H.A., Gebel, M., & Maas, G.M. (2001). Relationship between student recreation
complex use, academic performance, and persistence of first-time freshman.
NASPA Journal, 38(2), 254-268.

Running head: EFFECT OF UNIVERSITY CAMPUS RECREATION PROGRAMS
84
Borrego, A.M. (2002, July 12). Education Department to Emphasize Retention in Next
Higher Education Act. The Chronicle of Higher Education. Retrieved September
10, 2013, from http://chronicle.com/article/Education-Dept-to-Emphasize/18268/
Bourgeois, A., LeUnes, A., Burkett, S., Dragges-Bourgeois, T., Friend, J., & Meyers, M.
(1995, Spring). Factors influencing intramural sport participation. NIRSA
Journal, 44-48.
Buccholz, D. (1993). Evaluation of recreational sports facilities and programs at Arizona
State University. Unpublished master’s thesis, Arizona State University, 1993.
Bureau of Labor Statistics, U.S. Department of Labor, The Editor's Desk, The job market
for recent college graduates in the United States on the Internet at
http://www.bls.gov/opub/ted/2013/ted_20130405.htm (visited November 18,
2013).
Bushong, S. (2009). Freshman Retention Continues to Decline, Report Says. The
Chronicle of Higher Education. Retrieved September 25, 2013, from
http://chronicle.com/article/Freshman-Retention-Continues/42287/
Bryant, J. A., Banta, T. W., & Bradley, J. L. (1995). Assessment provides insight into the
impact and effectiveness of campus recreation programs. NASPA Journal, 32(2),
153-160.
Carnevale, A. P, & Smith, N. (2012) A decade behind: breaking out of the low-skill
trap in the southern economy. Georgetown University Center on Education and
the Workforce, 2012.

Running head: EFFECT OF UNIVERSITY CAMPUS RECREATION PROGRAMS
85
Chenoweth, E., & Galliher, R. V. (2004, October 15). Factors influencing college
aspirations of rural West Virginia high school students. Journal of Research in
Rural Education, 19(2). Retrieved from http://jrre.psu.edu/articles/19-2.pdf.
Choy, S.P., and Li, X. (2006). Dealing With Debt: 1992–93 Bachelor’s Degree
Recipients 10 Years Later (NCES 2006-156). National Center for Education
Statistics, Institute of Education Sciences, U.S. Department of Education.
Washington, DC.
Collins, J. R., Valerius, L., King, T. C., & Graham, A. P. (1997). The relationship
between college students' self-esteem and the frequency and importance of their
participation in recreational activities. NIRSA Journal, 25(2), 38-47.
Crews, D. J., & Landers, D. M. (1987). A meta-analytical review of aerobic fitness and
reactivity to psychosocial stressors. Medicine and Science in Sports and Exercise,
19, 114-130.
Dalgarn, M.K. (2001). The role of campus recreation center in creating a community.
NIRSA Journal, 25(1), 66-72.
Dennis, J. M., Phinney, J. S., & Chuateco, L. I. (2005). The role of motivation, parental
support, and peer support in the academic success of ethnic minority first
generation college students. Journal of College Student Development, 46(3), 223–
236.
Douglas, K., Collins, J. & Warren, C. (1997). Results from the 1995 national college
health risk behavior survey. Journal of American College Health, 46, 55-66.

Running head: EFFECT OF UNIVERSITY CAMPUS RECREATION PROGRAMS
86
Downs, P.E. (2003). Value of recreational sports on college campuses. Recreational
Sports Journal, 27(1), 9-64.
Fiegener, M. K. (2008). S& E Degrees: 1996-2006. National Science Foundation.
Retrieved May 2, 2014 from http://www.nsf.gov/statistics/nsf08321/content
Fenzel, L. M. (2001, April 10-14). Predictors of the adjustment of first-year students to
college:The role of early involvement and type of residence. Paper presented at
the Annual Meeting of the American Educational Research Association, Seattle,
WA.
Fontaine, K. (2000). Physical activity improves mental health. The Physician and Sports
Medicine, 28(10), 126-130.
Flora, C. B., & Flora, J. L. (2013). Rural communities: Legacy and change (4th ed.), pp.
1-26. Boulder, CO: Westview Press.
Frauman, E. (2005). Differences between participants and non-participants of campus
recreation offerings across demographic variables and perceptions of the college
experience. Recreational Sports Journal, 29(2), 156-165.
Gagliardi, J., & Hiemstra, H. (2013). College still pays (Policy Brief). Retrieved from
http://cpe.ky.gov/NR/rdonlyres/8DE2CF1E-51A2-4C27-8C2B-
41FB126252FE/0/CollegeStillPayspolicybrief.pdf.
Haines, D. (2001). Undergraduate benefits from university recreation. NIRSA Journal,25,
125-133.
Haines, D.J., & Fortman, T. (2008). The college recreational sports learning environment.
Recreational Sports Journal, 32(1), 52-61.

Running head: EFFECT OF UNIVERSITY CAMPUS RECREATION PROGRAMS
87
Harris, B. A. (2006-2007). The importance of creating a “sense of community”. Journal
of College Student Retention: Research, Theory & Practice, 8(1), 83-105.
Haskell, W. L., I-Min, L., Pate, R. R., Powell, K. E., Blair, S. N., Franklin, B. A., &
Bauman, A. (2007). Physical Activity and Public Health: Updated
Recommendation for Adults from the American College of Sports Medicine and
the American Heart Association. Medicine & Science In Sports & Exercise, 39(8),
1423-1434. doi:10.1249/rnss.0b013e3180616b27
Horn, L., Peter, K., and Rooney, K. (2002). Profile of Undergraduates in U.S.
Postsecondary Institutions: 1999–2000 (NCES 2002–168). U.S. Department of
Education, National Center for Education Statistics. Washington, DC: U.S.
Government Printing Office.
Ishitani, T. T. (2006). Studying attrition and degree completion behavior among
firstgeneration college students in the United States. Journal of Higher Education,
77(5), 861–885.
Iso-Ahola, S.E. & Park, C.J. (1996). Leisure-related social support and self-determination
as buffers of stress-illness relationship. Journal of Leisure Research, 28(3), 169-
187.
Jacobs, J., & Archie, T. (2008). Investigating sense of community in first-year college
students. Journal of Experiential Education, 30(3), 282-285.
Kanters, M.A. (2000). Recreational sport participation as a moderator of college stress.
NIRSA Journal, 24(2), 10-23.
Kasim, A., Dzakiria, H. (2001). Influence of recreation on educational aspiration. Asian
Pacific Journal of Tourism and Research, 6(2), 53-64.

Running head: EFFECT OF UNIVERSITY CAMPUS RECREATION PROGRAMS
88
Keating, X., Guan, J., Pinero, J., & Bridges, D. (2005). A meta-analysis of college
students' physical activity behaviors. Journal of American College Health, 54(2),
116-124.
King, E.J. (2000). Gender Equity in Higher Education. Are Male Students at a
Disadvantage? Washington, DC: American Council on Education, Center for
Policy Analysis.
Knapp, L.G., Kelly-Reid, J.E., & Ginder, S.A. (2012). Enrollment in postsecondary
institutions, fall 2010; financial statistics, fiscal year 2010; and graduation rates,
selected cohorts,2002-07 (NCES 2012-280). U.S. Department of Education.
Washington, DC: National Center for Education Statistics. Retrieved September
30, 2013 from http://nces.ed.gov/pubsearch.
Kurantowicz, E., & Nizinska, A. (2013). How students 'stay the course':
Retention practices in higher education. Studies In The Education Of Adults,
45(2), 135-147.
Lamont D. (1991). Undergraduate student recruitment and retention and the centralized
on-campus recreational sports facility. National Intramural Recreational Sport
Association Journal fall, 3-26.
Landers, D. (1997). The influence of exercise on mental health. Presidents council on
physical fitness and sports research digest, 2(12),.
Leppel, K. (2002). Similarities and differences in the college persistence of men and
women. Review of Higher Education, 25(4), 433-450.

Running head: EFFECT OF UNIVERSITY CAMPUS RECREATION PROGRAMS
89
Lohfink, M. M., & Paulsen, M. B. (2005). Comparing the determinants of persistence for
first-generation and continuing-generation students. Journal of College Student
Development, 46(4), 409–428.
Longwell-Grice, R., & Longwell-Grice, H. (2008). Testing Tinto: How do retention
theories work for first-generation, working-class students? Journal of College
Student Retention: Research, Theory & Practice, 9(4), 407–420.
Lundberg, C. A., Schreiner, L. A., Hovaguimian, K., & Miller, S. (2007). First-generation
status and student race/ethnicity as distinct predictors of student involvement and
learning. NASPA Journal, 44(1), 57-83.
Means, L. (1952). The organization and administration of intramural sports (2nd ed.).
Chicago, IL: Mosby.
Milem, J. F., & Berger, J. B. (1997). A modified model of college student persistence:
Exploring the relationship between Astin's Theory of Involvement and Tinto's
Theory of Student Departure. Journal of College Student Development, 30(4),
387-400.
Miller, J. (2011). Impact of a university recreation center on social belonging and student
retention. Recreation Sports Journal, 35, 117-129.
Miller, K. H., Ogletree, R. J., & Welshimer, K. (2002). Impact of activity behaviors on
physical activity identity and self-efficacy. American Journal of Health Behavior,
26(5), 323-330.
Moskal, P. D., Dziuban, C. D., & West, G. B. (1996, April 8-12). Scaling health risk
behaviors of college students. Paper presented at the Annual Meeting of the
American Educational Research Association, New York, NY.

Running head: EFFECT OF UNIVERSITY CAMPUS RECREATION PROGRAMS
90
National Center for Education Statistics, (2005). Gender differences in participation and
completion of undergraduate education and how they have changed over time.
Washington, D.C., U.S. Department of Education.
Naumann, W. C., Debora, B., & Gutkin, T. B. (2003). Identifying variables that predict
college success for first-generation college students. Journal of College
Admission, (181), 4.
Nesbitt, G.M. (1998). Social-emotional development and extracurricular involvement of
sport club participants. NIRSA Journal, 22(2), 6-9.
NIRSA (2008). Collegiate recreational and sports facilities construction report.
Corvalis, OR..
Nguyen, M. (2012). Degreeless in Debt: What Happens to Borrowers Who Drop Out.
Education Sector. Retrieved September 28, 2013, from
http://www.educationsector.org/sites/default/files/publications/DegreelessDebt_C
YCT_RELEASE.pdf.
Noel-Levitz. (1993). Tinto's theory. Retrieved from http://etorpy.com/Tinto.htm
Pascarella, E., & Terenzini, P. (1977). Patterns of student-faculty informal interaction
beyond the classroom and voluntary freshman attrition. Journal of Higher
Education, 48, 540-552.
Quarterly Wage Indicator (QWI) online data 2011, U.S. Census Bureau, Center for
Economic Studies.
Reynolds, G. L. (2007). The impact of facilities on recruitment and retention of students.
New Directions For Institutional Research, 2007(135), 63-80. doi:10.1002/ir.223.

Running head: EFFECT OF UNIVERSITY CAMPUS RECREATION PROGRAMS
91
Salamon, S. (2003). Newcomers to old towns: Suburbanization of the heartland, pp. 175-
195. Chicago: University of Chicago Press.
Schuetze, H., & Slowey, M. (2002, January 10). Participation and exclusion: A
comparative analysis of non-traditional students and lifelong learners in higher
education. Higher Education, 44(3), 309-327.
Seidman, A. (2006). Center for the study of college student retention. Retrieved from
http://www.cscsr.org/docs/College_Student_Retention_A_Primer2005_files.pdf.
Sieben, L. (2011). Retention Rates Improve at Community Colleges but Drop at Private
4-Year Institutions. The Chronicle of Higher Education. Retrieved September 26,
2013, from http://chronicle.com/blogs/ticker/retention-rates-improve-at-
community-colleges-but-drop-at-private-4-year-institutions/29882 .
Stewart, R. E. (1992). A brief history of the intramural movement. NIRSA Journal, 17(4),
12-14.
Strayhorn, T. L. (2009). An examination of the impact of first-year seminars on correlates
of college student retention. Journal of The First-Year Experience & Students in
Transition, 21(1), 9–27.
Taras, H. (2005). Physical activity and student performance at school. Journal of School
Health, 75(6), 214-218.
Taylor, H., Canning, W. F., Brailsford, P., & Rokosz, F. (2003). Financial issues in
campus recreation. New Directions for Student Services, (103), 73-86.

Running head: EFFECT OF UNIVERSITY CAMPUS RECREATION PROGRAMS
92
Terenizini, P. T., & Pascarella, E. T. (1977). Voluntary freshman attrition and patterns of
social and academic integration in a university: A test of a conceptual model.
Research in Higher Education, 6, 25-43.
Tinto, V. (1975). Dropout from higher education: A theoretical synthesis of recent
research. Review of Educational Research, 45, 89–125.
Tinto, V. (1987). Leaving college: Rethinking the causes and cures of student attrition.
Chicago: University of Chicago Press.
Tinto, V. (1993). Leaving college: Rethinking the causes and cures of student attrition.
(2nd ed.). Chicago, IL: The University of Chicago Press.
Tinto, V. (2007), Research and practice of student retention: what next? Journal of
College Student Retention, 8(1), 1-19.
U.S. Department of Health and Human Services. (2000, November). Healthy People
2010: Understanding and Improving Health. Washington, D.C.: U.S. Government
Printing Office.
U.S. Department of Health and Human Services. Physical Activity and Health: A Report
of the Surgeon General. Atlanta, GA: U.S. Department of Health and Human
Services, Centers for Disease Control and Prevention, National Center for
Chronic Disease Prevention and Health Promotion, 1996.
Wade, B.K. (1991, April). A profile of the real world of undergraduate students and how
they spend their discretionary time. Paper presented at the Annual Meeting of the
American Educational Research Association (Chicago, IL). (ERIC Document
Reproduction Service No. ED 333 776).

Running head: EFFECT OF UNIVERSITY CAMPUS RECREATION PROGRAMS
93
Webster, R. (1965). Philosophy of physical education. Dubuque, IO: WM.C. Brown and
Company.
Wei, C. C., & Horn, L. (2013). Federal student loan debt burden of noncompleters
(NCES 2013-155). Washington, DC: National Center for Education Statistics,
Institute of Education Sciences, U.S. Department of Education.
http://nces.ed.gov/pubsearch/pubsinfo.asp?pubid=2013155
Windschitl, M. R. (2008). The relationship of participation in recreational sports with
retention rates and academic success of first-year college students. (Order No.
3338990, University of Minnesota). ProQuest Dissertations and Theses, , 177.
Retrieved from
http://search.proquest.com/docview/275862447?accountid=10628. (275862447).
Wilson, P. (2009). History and evolution of campus recreation. Callendar, M. (2nd Ed.),
Campus recreation essentials for the professional (pp. 21-33). Champaign IL:
Human Kinetics.
Zizzi, S., Ayers, S. F., & Watson, J. (2004). Assessing the impact of new student
campus recreation centers. NASPA Journal (Online), 41(4), 588-630.

Running head: EFFECT OF UNIVERSITY CAMPUS RECREATION PROGRAMS
94
Appendices
Appendix A: Institutional Review Board Approval

Running head: EFFECT OF UNIVERSITY CAMPUS RECREATION PROGRAMS
95

Running head: EFFECT OF UNIVERSITY CAMPUS RECREATION PROGRAMS
96
Vita
Caelin Bryce Scott
DATE AND PLACE OF BIRTH
September 27, 1984—Danville, KY
EDUCATION
Ed.D., Educational Leadership & Policy Studies, Doctoral Candidate
Eastern Kentucky University
M.S., Recreation & Park Administration Eastern Kentucky University
B.S., Psychology
Eastern Kentucky University
ACAMEMIC/PROFESSIONAL POSITIONS
Adjunct Faculty (2011-present), Recreation & Park Administration Department, Eastern
Kentucky University, Richmond, KY.
Training Administrator (2013-present) Center for Career & Workforce Development,
Eastern Kentucky University, Richmond, KY.
Coordinator (2010-2013), Department of Conferencing & Events, Division of Continuing
Education & Outreach, Eastern Kentucky University, Richmond, KY.
Planner (2007-2010), Department of Conferencing & Events, Division of Continuing
Education & Outreach, Eastern Kentucky University, Richmond, KY.
Research Assistant (2007), Department of Psychology, Eastern Kentucky University,
Richmond, KY.
PROFESSIONAL CERTIFICATIONS AND AWARDS
Member of Inaugural class of the President’s Leadership in Action Academy, Eastern
Kentucky University, 2014
Leadership Madison County, Richmond, KY (Graduate, 2011-2012)
Outstanding Graduate Student Award, Department of Recreation & Park Administration,
Eastern Kentucky University, 2009-2010
Assisted in Developing First Year Orientation Program—Colonel Outdoor Recreation
Experience (CORE), Eastern Kentucky University, 2012
Certified Facilitator, Facilitation Center, Eastern Kentucky University
Earth Force Curriculum Training, Division of Natural Areas, Eastern Kentucky
University
Environmental Education Certification, Eastern Kentucky University