The Effect of Pre-Primary on Primary School Performancewebfac/lee/e251_Sp06/Gertler.pdf · The...
34
The Effect of Pre-Primary on Primary School Performance Samuel Berlinski University College London and Institute for Fiscal Studies Sebastian Galiani * Universidad de San Andres Paul Gertler UC Berkeley and The World Bank January 23, 2006 Preliminary. Don’t quote or circulate without permission. Abstract. Understanding the returns to investing in universal pre-primary is especially important for the large number of developing countries who have not yet implemented pre- primary, but are expanding secondary education. In this paper, we shed some light on this debate by investigating the effect of a large expansion of universal pre-primary school on subsequent primary school performance in Argentina. We estimate that one year of pre- primary school increase average third grade test scores by 8 percent and a quarter of a standard deviation. We also find that pre-primary school attendance positively affects student’s self-control in the third grade as measured by attention, class participation, and discipline. * Samuel Berlinski, Department of Economics, University College London, Gower Street, London WC1E 6BT, UK, Tel: (44-20) 7679-5847, [email protected] . Sebastian Galiani, Universidad de San Andres, Vito Dumas 284, (B1644BID) Victoria, Provincia de Buenos Aires, Argentina, Tel: (54- 11) 4725-7053, [email protected] . Paul Gertler, Haas Business School, University of California at Berkeley, Berkeley, CA 94720-1900, US, Tel: (510) 642-1418, [email protected] . We thank Pedro Carneiro, Steve Pischke and seminar participants at Fundacion Ramon Areces Scientific Meeting, LACEA, Universidad de Chile, Universidad de Montevideo, Universidad de San Andres, and Washington University in St. Louis for useful comments. We also thank Damián Bonari, Alfredo Dato, Irene Oiberman and Juan Sanguinetti for their contribution to our understanding of the program and for providing us with data.
-
Upload
duongthuan -
Category
Documents
-
view
218 -
download
0
Transcript of The Effect of Pre-Primary on Primary School Performancewebfac/lee/e251_Sp06/Gertler.pdf · The...
The Effect of Pre-Primary on Primary School Performance
Samuel Berlinski University College London and Institute for Fiscal Studies
Sebastian Galiani*
Universidad de San Andres
Paul Gertler UC Berkeley and The World Bank
January 23, 2006
Preliminary. Don’t quote or circulate without permission.
Abstract. Understanding the returns to investing in universal pre-primary is especially important for the large number of developing countries who have not yet implemented pre-primary, but are expanding secondary education. In this paper, we shed some light on this debate by investigating the effect of a large expansion of universal pre-primary school on subsequent primary school performance in Argentina. We estimate that one year of pre-primary school increase average third grade test scores by 8 percent and a quarter of a standard deviation. We also find that pre-primary school attendance positively affects student’s self-control in the third grade as measured by attention, class participation, and discipline.
* Samuel Berlinski, Department of Economics, University College London, Gower Street, London WC1E 6BT, UK, Tel: (44-20) 7679-5847, [email protected]. Sebastian Galiani, Universidad de San Andres, Vito Dumas 284, (B1644BID) Victoria, Provincia de Buenos Aires, Argentina, Tel: (54-11) 4725-7053, [email protected]. Paul Gertler, Haas Business School, University of California at Berkeley, Berkeley, CA 94720-1900, US, Tel: (510) 642-1418, [email protected]. We thank Pedro Carneiro, Steve Pischke and seminar participants at Fundacion Ramon Areces Scientific Meeting, LACEA, Universidad de Chile, Universidad de Montevideo, Universidad de San Andres, and Washington University in St. Louis for useful comments. We also thank Damián Bonari, Alfredo Dato, Irene Oiberman and Juan Sanguinetti for their contribution to our understanding of the program and for providing us with data.

1. Introduction
Most OECD and many middle income countries have turned to universal pre-primary
school in order to give children a better start to life (see OECD, 2000 and Myers, 1995).
While there is substantial empirical evidence that pre-primary school programs targeted to
disadvantaged children have significant benefits1, little is known about the benefits for the
population as a whole2. Indeed, there is some concern that separating pre-primary age
children from their mothers while mothers are working may have detrimental effects on
child development (see Ruhm, 2004). Understanding the returns to investing in universal
pre-primary is especially important for the large number of countries who have not yet
implemented pre-primary, but are expanding secondary education. In this paper, we attempt
to shed some light on this debate by investigating the effect of a large expansion of universal
pre-primary school on subsequent primary school performance in Argentina.
A large body of literature makes the case for investment in early childhood development.
Research in neuroscience, psychology and cognition has established that learning is easier in
early childhood than later in life, and that nutrition and cognitive stimulation early in life are
critical for long-term skill development (see, among others, Bransford, 1979; Shonkoff and
Phillips, 2000; Shore, 1997 and Sternberg, 1985). Becker (1964) points out that the returns to
investments in early childhood will be higher than those to investments made later in life
simply because beneficiaries have a longer time to reap the rewards. Carneiro and Heckman
(2003) additionally note that investments in human capital have dynamic complementarities,
so that “learning begets learning” (p.7). Currie (2001) suggests that it may be more effective
1 See, among others, Lee et al. 1990, Barnett, 1993, Barnett, 1995, Currie and Thomas 1995, Reynolds 1998, Karoly et al., 1998, Danzinger and Waldfogel, 2000; Currie, 2001, Garces, Thomas, and Currie 2002, Blau and Currie 2004, and, Schweinhart 2005. 2 The most recent findings on this area are by Cascio (2004) and Magnuson, Ruhm and Waldfogel (2005).
1

for a government to equalize initial endowments through early childhood development
programs than to compensate for differences in outcomes later in life. And she hypothesizes
that families may under-investment in early childhood because of market failures such as
liquidity constraints and information failures.
We take advantage of a large infrastructure program aimed at increasing school
attendance for children between the ages of 3 to 5. Between 1994 and 2000, Argentina
constructed enough classrooms for approximately 175,000 additional children to attend
preschool. The construction program attempted to compensate for existing differences in
enrollment rates by differentially expanding pre-primary school facilities in areas with low
enrollment rates.
By conditioning on region and cohort fixed effects, the construction program generated
plausible exogenous variation in the supply of school facilities. Using an identification
strategy similar to Rosenzweig and Wolpin (1988), Card and Krueger (1992), and Duflo
(2001), among others, we exploit the variation in treatment intensity across regions and
cohorts to estimate the effect of expanding pre-primary school facilities on subsequent
achievement in primary school.
Our results show that attending pre-primary school had a positive causal effect on
subsequent third grade standardized Spanish and Mathematics test scores. We estimate that
one year of pre-primary school increase average third grade test scores by 8 percent and a
quarter of a standard deviation. We also find that pre-primary school attendance positively
affected student’s self-control as measured by attention, class participation, and discipline (i.e.
lack of behavioral problems). The positive effect on self-control not only provides evidence
of possible pathways by which pre-primary might affect subsequent school performance, but
2

is important in its own right as behavioral skills are as important to future success in life as
are cognitive skills (Blau and Currie, 2003 and Heckman et al., 2000).
Our results not only strongly support the value of pre-primary education, but also sheld
light on the maternal work debate. In another paper, Galiani and Berlinski (2004) used the
expansion of the supply of pre-primary classrooms to identify the effect of pre-primary
attendance on maternal labor supply and find positive effects. Taking the two papers
together, imply that maternal work can have positive effects on child development if the
children are in cognitively stimulating environments while mothers are working.
The rest of the paper is organized as follows. In section 2 we describe the case for early
childhood education and review the available evidence. In Section 3, we introduce the basic
features of the construction program and background facts about the educational system in
Argentina. In section 4 we present the data used in the empirical analysis. In Section 5, we
discuss the empirical methodology. Section 6 presents the empirical results while in Section 7
we present our conclusions.
2. The School Construction Program
The public school system in Argentina provides 3 years of pre-primary education
covering ages 3 through 5. Pre-primary classes are almost always physically and
administratively attached to primary schools. They typically operate two shifts (morning and
afternoon) each for three and a half hours a day, five days a week over the 9 month school
year. The curricular content of pre-primary is designed to achieve two goals (Ministerio de
Educación, 1993):
1. Enhance educational achievements accomplished at home and develop new age-appropriate competences.
2. Early access to knowledge and skills that improve performance in the first years of primary education.
3

While primary school has been compulsory since 1885 (Tedesco, 1986), pre-primary
education only became compulsory in 1993 when the new Federal Education Law expanded
compulsory education to include the last year of pre-primary school through the first two
years of secondary school. However, since there were not enough physical spaces in pre-
primary classrooms to accommodate everyone instantaneously, the law allowed the
Government to phase in implementation over time (Llach et al., 1999).3 To implement the
law, the government began a massive public school construction program. From 1994 to
1999, the National Government financed the construction of 3,531 rooms. On average, each
room was 45 square meters constructed at average cost of $15,000 pesos.4 Given an average
class size of 25 students and 2 pre-primary shifts (i.e., 50 new places per room constructed),
the construction program created approximately 176,550 preschool places.
The government used a non-linear allocation rule based on an index of unsatisfied basic
needs constructed with data from the 1991 Census in order to target the pre-primary
construction program to poor areas with low pre-primary enrollment rates. In Table 1 we
present the number of pre-primary places created per child age 3-5 between 1993 and 1999
by province and the province’s share of total places constructed. In Figure 1, we plot share
of places constructed with 1991 enrollment rates and show that more places were
constructed in Provinces with low baseline pre-primary enrollment. In fact, the correlation
between provincial places and share of total places with 1991 pre-primary enrollment rates in
1991 is -0.68 and -0.53 respectively, which is consistent with the claim that the construction
program was targeted to areas with low pre-primary enrollment.
3 There is little effort to enforce the law as there is no penalty for non-compliers and primary school enrollment is not contingent on having attended pre-primary education. 4 At the time of construction the exchange rate was pegged one to one with the US dollar.
4

The expansion in pre-primary classrooms was coincident with a large increase in pre-
primary enrollment. In Table 2, we report pre-primary and primary school gross enrollment
rates by province using data from the 1991 and 2001 population censuses. While the
enrollment rate for pre-primary education in 1991 was 49 percent, it varied substantially
across regions with enrollment as high as 80 percent in the Autonomous City of Buenos
Aires and as low as 27 percent in the poor province of Chaco. The growth in enrollment
between 1991 and 2001 is noticeable, as the average enrollment rate increased to 64 percent
and the number of children attending pre-primary school climbed by 330,845. Comparing
1991 to 2001, all provinces increased enrollment in pre-primary education by at least 10
percentage points. In contrast, primary school enrollment increased negligibly from 97
percent in 1991 to 98 percent in 2001.
A substantive portion of the increase in enrollment can be explained by the newly
available places. In Table 3 we estimate the impact of a new place available on preschool
attendance for children age 3 to 5 using a two way fixed-effect error component model. We
construct province-year averages of pre-school enrollment using the ongoing household
survey for the period 1994-2000 for which pre-primary enrollment information is available.
We measure the number of places available each year as the stock of rooms constructed
times 50 normalized by the number of children aged 3 to 5 in each school cohort. We
assume that the places constructed during a given year can be used the next one. Thus,
rooms constructed in 1993 start to be used in 1994.
We find that one place constructed per child in preschool age increases the likelihood of
pre-primary school attendance by 0.786 percentage points. Furthermore, we cannot reject
the null hypothesis of full take-up of vacancies. Given that the average number of places
constructed per child over the period was 0.09, the average increase in the probability of pre-
5

primary school attendance as a consequence of the program is approximately 7 percentage
points. Hence, the program explains about half of the 15 percentage point’s increase in gross
enrollment experienced from 1991 to 2001 (see Table 2). Cohort effects and time-varying
idiosyncratic province factors explain the remaining. These results are, of course, similar to
those present by Berlinski and Galiani (2004) where the take-up rate and the maternal labor
supply effects are studied in detail.5
3. Student Performance
In this section we examine two related questions. First, we estimate the net effect of the
supply of pre-primary public school on subsequent school outcomes of children. These
reduced-form estimates, often referred to as “Intent-to-Treat” (IIT) effects, shed light on the
impact of the policy of expanding pre-primary school places. Second, we ask what was the
effect of attending pre-primary public school on subsequent school outcomes of children, or
the “Treatment-on-the-Treated” (TOT) effect. This second analysis sheds light on the
returns to pre-primary. We begin by describing the measurement of student performance
and the treatment effect. We then present our empirical strategy and results.
3.1 Measuring Student Performance
Our primary source of information on student performance is from the administrative
records of the Argentine National Education Ministry, specifically the Operativo Nacional de
Evaluación Educativa (National Educational Assessment Operation) or ONEE. Starting in
1994, the ONEE administered standardized achievement tests in Mathematics and Spanish
5 The results presented in Berlinski and Galiani (2004) are robust to the inclusion of idiosyncratic trends in province enrolment levels in pre-primary education (as in Duflo, 2001), time varying aggregate variables at the province level and household covariates.
6

to students, and questionnaire to teachers covering student behavior as well as teacher and
school characteristics.
The nationally administered standardized test scores are uniform and monotonic
measures of school performance. However, teachers could intentionally train students to
maximize test scores instead of teaching general skills and knowledge. In this case, the test
scores would not reflect school quality, but rather how well schools prepared students to
take the test. This, however, is unlikely in Argentina where there are no rewards or
punishments for teachers or schools based on test outcomes (Galiani et al., 2005). In fact,
the Government set-up the standardized tests to evaluate the overall functioning of the
school system, and the exams have no bearing on student progression or teacher
compensation.
In Table 3 we report the mean test scores for third-grade students (panel A) and for sixth
and seventh graders (panel B). The third grade students comprise the untreated cohorts of
1992, 1993 and 1994 and the potentially treated cohorts of 1995, 1996 and 1997. Third
graders had a mean of 61 on Mathematics and 63 on Spanish. And girls performed slightly
better than boys in Spanish, but not in Mathematics. The sixth and seventh graders could
not have been exposed to the treatment. Their scores are 53 for Mathematics and 56 for
Spanish, with girls again performing slightly better.
Since standardized test scores do not capture all of the dimensions of learning, the
ONEE complemented the student testing with a teacher questionnaire that collected
information about student behavior in the classroom. Specifically, teachers were asked
1. “How many of your students pay a lot of attention in class?”
2. “How many of your students are well disciplined in the classroom?”
3. “How many of your students regularly participate in class?”
4. “How many of your students put a large amount effort into to understanding your explanations?”
7

The possible answers to these questions are: (a) “Almost all”, (b) “More than half”, (c) "Half", (d)
"Less than half" and (e) “Very few”. Table 5 present the distribution of answers to these
questions.
The student tests and teacher surveys are administered to a randomly selected stratified
sample of primary schools across the country. The sample of schools changes every year, but
a large number appear in more than one wave and can be matched from wave to wave using
a unique school identifier. In addition, not all grades were surveyed every year. Specifically,
the student tests were administered to third-graders in 1995 through1999, to sixth-graders in
1996 and 1997 and then again in 1999 and 2000, and to seventh-graders in 1994 through
1997 and then again in 1999.6 Teachers’ questionnaires are administered in 1995, 1996, 1997
and 1999. Table A1 in the appendix summarizes the year and grades with available data at
both the teacher and student levels. Table A2 presents the definitions and sources of the
variables used the empirical analysis that follows.
3.2 Measuring Treatment Exposure
Recall that the pre-primary school construction program started in 1993. If we make the
reasonable assumption that the places constructed during a given year can only be used the
next one the construction program could only have affected the pre-primary enrollment of
third graders starting in 1997. Specifically, third graders in 1997 could have had at most one
year of exposure to the construction program (i.e. they could have attended kindergarten in
1994), third graders in 1998 could had two years of exposure, and third graders in 1999 could
have had 3 years of exposure7. Since only third graders could have been exposed to the
6 Individual and school level test score information after 2000 are not yet publicly available. 7 Of course, the relation between year in which a student take the exam and his primary school entry cohort depends on whether the students had repeated grades. Students that repeated grades are observed every year, we keep these students in our sample and assigned them to their respective primary school entry cohorts.
8
treatment, we limit the analysis to the years for which we have test score data for third
graders, 1995-1999. In this period then, third graders in 1995 and 1996 along all sixth and
seventh graders in all years could not have been exposed to the treatment.
We now describe how we measure exposure to the construction program using
information on the number of rooms constructed by year and municipality from the
Secretary of Infrastructure of the Argentine National Education Ministry. We first define
the accumulated stock of preschool places constructed (stock of preschool rooms
constructed x 50)8 in municipality j between 1993 (i.e., when the construction program
started) and year t-1, because rooms constructed in t-1 only become available in year t.
The construction program had different effects on the pre-primary of children
depending the age of the child when the rooms became available. Specifically, if a child was 3
years old when the rooms became available, the child could have enrolled for 3 years of pre-
primary. However, if the child was 5 or 4 years old, then he or she could have enrolled for at
most 2 or 3 years or pre-primary. In order to compute the exposure to treatment of each
child we need to know how the new rooms were allocated between ages 3, 4 and 5 in each
municipality and each year. Since we do not have this information, we assume that the stock
of constructed rooms is allocated based on the pre-treatment average allocation of places in
the 1991 Decennial Census of Population (i.e., 50 percent for children age 5, 36 percent for
children age 4 and 14 percent for children age 3).
Formally, denote cohort by the year students entered first-grade in primary school. Then,
we construct the stock of rooms available for children i from cohort c as:
Stock of Placescpj = (0.5 Stock5cpj + 0.36 Stock4cpj + 0.14 Stock3cpj)/Cohort Sizecpj
8 Each room adds 50 places as a room accommodates 25 children per shift with two shifts per day.
9

Where Stock5cpj is the stock of preschool places constructed in municipality j (in province p)
when the cohort c was 5 years old; and Stock4cpj and Stock3cpj are the stocks when it was 4
and 3 years old respectively. Finally, we normalize Stock of Placescpj dividing it by the size of
the respective cohort c in municipality j using data from the 1991 Decennial Census of
Population.
This variable measures the exposure to treatment for child i in cohort c being
administered third-grade tests in year t and residing in municipality j (in province p). We
denote this variable Stockcpj. The definition of Stock implicitly assumes that the effects of
attending pre-primary are homogenous across years. In order to test the robustness of this
measure, we created an alternative stock measure assuming that all rooms were allocated to
children age 5 (i.e., Stock of Placescpj = Stock5cpj). Since the correlation among the Stockh (h
=3, 4 and 5) measures is very high, we are unable to disentangle the separate effects by age.
3.3 Empirical strategy
We would, in principle, like to compare test scores of students who were offered a pre-
primary school place to the counterfactual—i.e. test scores for the same students if they were
not offered a place. Since the counterfactual is never observed and we do not have a
controlled randomized experiment, we turn to non-experimental methods. Specifically, we
exploit the variation introduced by the program’s expansion over time that generated
differences in exposure by cohort and municipality.
We estimate the following model
icpjsttpcpjcpjStockicpjstTS ελγµβα +++++= (1)
where:
• TSicpjst measures the test score of student i in cohort c residing in province p and
municipality j attending school s and taking the exam in year t.
10

• Stockcpj is the causing variable of interest and varies by cohort, municipality and year.
• µj is a municipality fixed-effect. These fixed effects control for the location
characteristics that are constant over time. In particular, they control for the fact that
that program allocation was systematically related to pre-treatment municipal
preschool attendance and poverty. We also estimate a less parsimonious specification
that conditions on school fixed-effects instead of municipality fixed effects.
• γcp is a full set of interactions between cohort and province dummies, which control
for unobserved differences across cohorts by province.
• λtp is a full set of province and year fixed effects, which control for time-varying
effects at the province level. These province-year effects control for differences in
provincial school policies and the difficulty of tests across years.
• εicpjst is a student specific error.
In the model above, the parameter β is the ITT effect of constructing an extra place per
child aged 3-5 on third-year test scores. As we cannot reject the null hypothesis that the take-
up rate is one, then the IIT estimate is also an estimate of the TOT effect, i.e., the effect of
attending pre-primary school on subsequent test scores.
3.4 Results
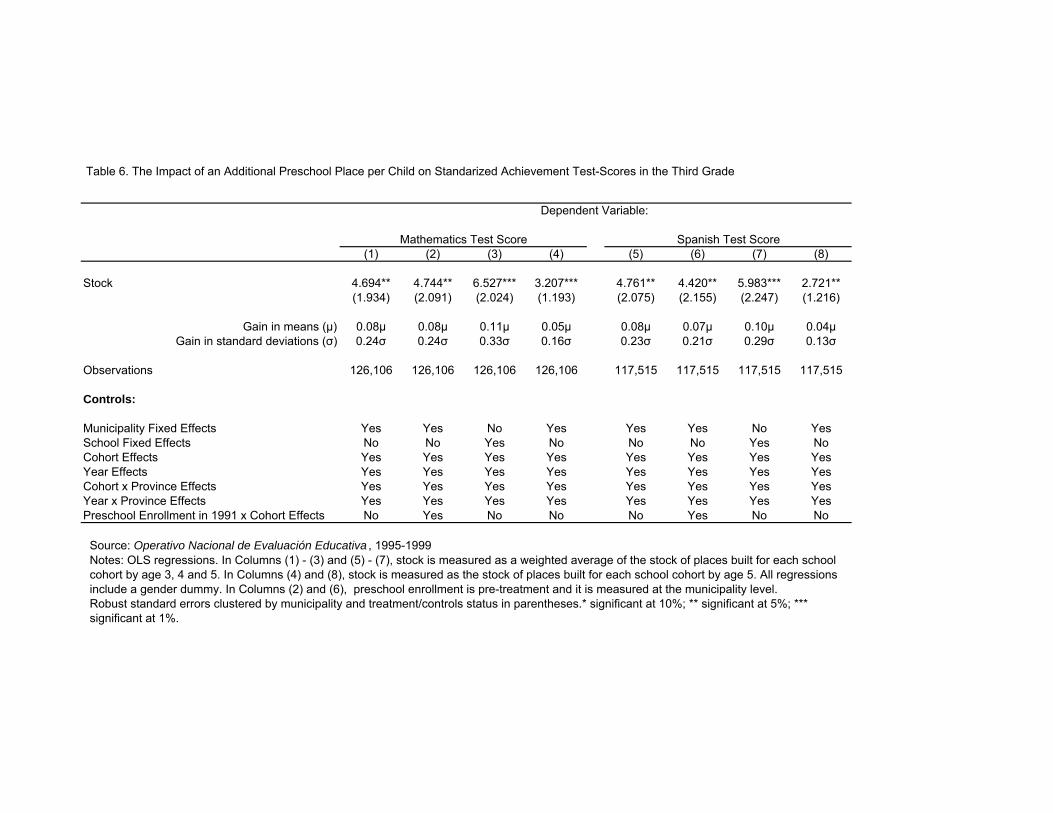
In Table 6, we look at the impact of the program, as measured by the variable Stock,
on Mathematics and Spanish Standardized Achievement test-scores. We report four columns
for each test. In the first and fifth columns, our preferred specifications, we condition on
municipality fixed effects, cohort effects, year effects and interactions between province and
year and province and cohort.9 We find that, by the third grade, an increase of one place in
9 Plain differences-in-differences estimates which do not control for Province-Year interactions and Province -Cohort interactions give statistically similar results to those that we present in Table 6.
11

preschool per child increases Mathematics test scores by 4.61 points and Spanish test scores
by 4.76 points. As we cannot reject the null hypothesis that the take-up rates of the newly
constructed places is perfect, these estimates imply that one year of preschool increases
performance by 8 percent of a mean and 23 percent of a standard deviation for both tests.
In the second and sixth columns of Table 6, we add to the previous model interactions
between pre-treatment (1991) preschool enrollment at the municipality level and cohort
dummies. The idea is to allow for idiosyncratic trends in municipality enrollment levels in
pre-primary education. Given that different municipalities start with different enrollment
rates, we may suspect that they naturally grow at different rates and these trends could be
systematically correlated with the construction program and the evolution of primary school
performance. The point estimates do not significantly change. Indeed, we cannot reject the
null hypothesis that the estimate in Columns (2) and (6) are the same than those in Columns
(1) and (5), respectively.
In the third and sixth columns we condition on school fixed effects instead of
municipality fixed effects. The estimates increase in size as a consequence of this but we
cannot reject the null hypothesis that the estimate in Columns (3) and (7) are statistically the
same from those in Columns (1) and (5), respectively.
Finally, we test the assumption used to construct the variable Stock – i.e. that half of the
construction is allocated to age 5 children, 36 percent to age 4 children and the rest to
children age 3. Although, this weighting scheme does not affect the exogeneity assumptions
of the experiment, it certainly affects the interpretation of our results.10 In Columns (4) and
(8) of Table 6, we look at the impact of assuming that all the construction was allocated to
age 5 children (Stock5). The estimated coefficients of these regressions reduce to about 45-30
12

percent of those in Columns (1) and (4) but still are statistically significant at conventional
levels. Under the null hypotheses behind the construction of the variable Stock, the variable
Stock5 over-estimates the exposure to the program of each potentially treated cohort (since
each cohort is assumed to have the maximum possible exposure under the assumption that
all the construction was allocated to age 5 children). Thus, we would expect the estimated
coefficients associated to Stock5 to be lower if Stock indeed accurately measures the true
exposure to treatment of the potentially treated cohorts. In fact, a back of the envelope
calculation suggest that this is the case since Stock5 is estimated to be approximately 1.38
times Stock.11
3.5 Gender and Poverty Differences in Impact
In this section, we test whether the gains from the program differ by gender and by
socio-economic status. In Table 7 we interact Stock with a gender variable that indicates
whether the person was female. Although the interactions are always positive, the null
hypothesis that these interactions are different from zero cannot be rejected. This suggests
that the gains from the program and preschool education at large are similar for boys and
girls.
In order to evaluate whether the gains of preschool vary by socio-economic status, we
interact the treatment variable with the percentage of household living in poverty in a given
municipality in 2001 minus the country median—18.1 percent. In panel B of Table 7, we
report the effect of the coefficient on Stock and the interaction term. The coefficient on Stock
is the gain at the median level of poverty. The impact at the median level of poverty is
10 The results we find are also robust to weighting the construction by the province or municipality share of preschool places rather than the national shares that we use. 11 This is obtained by noting that for the cohort of 1995, Stock5 is approximately 100% higher than Stock, for the cohort of 1996 it is 16% higher while for the cohort of 1997 they are approximately
13

positive and in general statistically significant. The gains from preschool education are bigger
for the students in the more disadvantaged municipalities. For example, for municipalities
where 26.2 households live in poverty (this corresponds to the 75 percentile of the poverty
distribution) the impact of moving stock from 0 to 1 is approximately 3.2 higher in language
and 1.6 points higher in mathematics with respect to the gain at the median level.
3.6 Behavioral Impact of the Preschool Expansion
There is a widespread belief among educators that the benefits of preschool
education are carried over to primary school. According to Currie (2001), teacher's
perceptions of the benefits of preschool education are related to the fact that preschool
education facilitates the process of socialization and self-control necessary to make the most
of classroom learning. In order to evaluate these hypotheses we study the responses from
teachers’ questionnaires delivered in 1995, 1996, 1997 and 1999.
We investigate the effect of the program on these indicators by estimating the following
model:
kcpjscpcpjStockkcpjsTE j εγµβα ++++= (2)
where TEkpjsc is the teacher evaluation of the students in class k, in school s in, municipality j,
in year t. Other variables in the regression are defined similarly than in equation (1). As the
teachers’ measures are reported at the class level we cannot separate year from cohort effects
as before.12 The specific dependent variables in these analyses are indicators of:
• Half or more of my students put effort in understand the explanations.
• Half or more of my students pay a lot of attention.
• Half or more of my students are very disciplined.
equal. Thus, assigning an equal weight to each cohort we estimate that Stock5 is approximately 38%
14

• Half or more of my students are very participative.
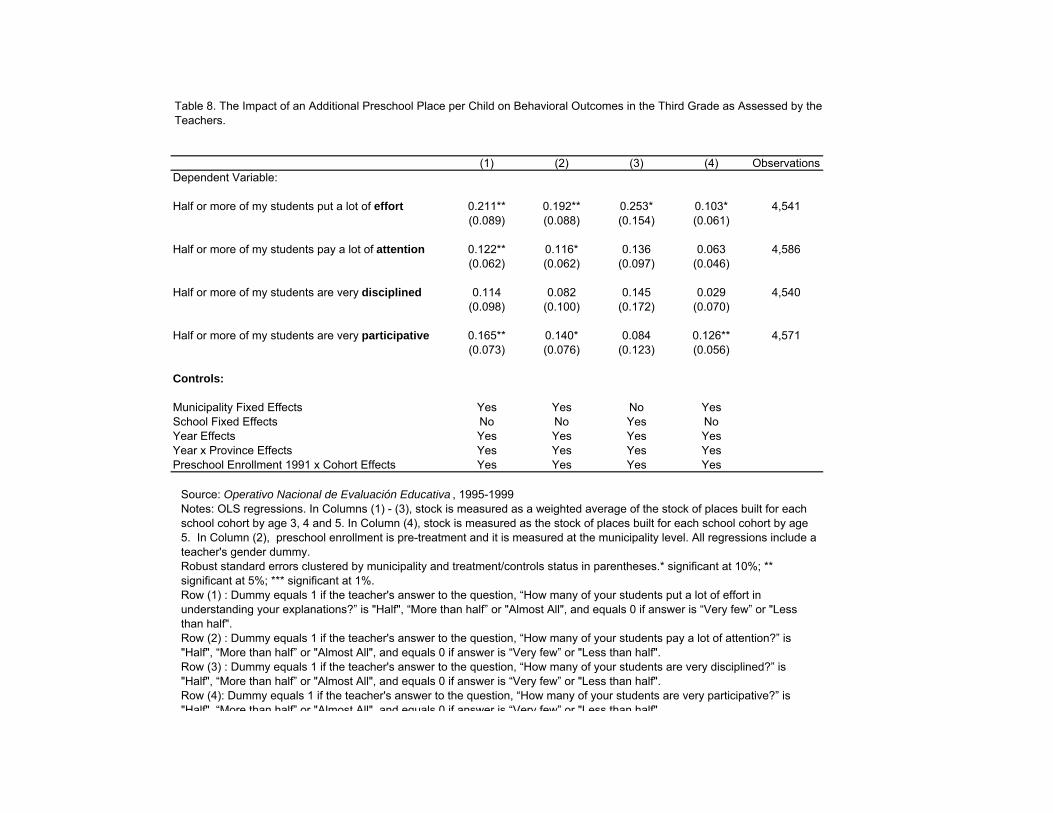
In Table 8, we report the results of regressing each of these dummy variables on Stock
assigning the Stock in 1999 to the 1997 cohort, the Stock in 1997 to 1995 cohort and zero the
other cohorts. There is one dependent variable for each of the four rows in this Table. In
the first, we condition on Municipality fixed effects, year effects and year by province effects.
In the second column, we add an interaction between preschool enrollment in 1991 and
cohort effects. In the third column, we condition on school fixed effects instead of
municipality fixed effects. Finally, in Column (4), we measure stock as the stock of places
built for each school cohort by age 5.
A common finding of this analysis is that effort, attention, discipline, and participation
are positively related to stock and consequently to pre-school attendance. In Column (1), our
preferred specification, we find that the probability that half or more of the student will put
effort increases by 21 percentage points if you increase Stock from 0 to 1. In other words, if
all students in a class are induced to attend a year of pre-primary school, the likelihood that
at least half of them puts effort in class increases by 21 percentage points. The results in
other columns and outcomes are consistent with these findings. Thus, we conclude that
attending pre-primary school improves the non-cognitive abilities of children.
4. Robustness Tests
4.1 Placebo Experiment
In order to test the causal interpretation of our results against alternative explanations,
we construct a placebo experiment. Specifically, we test whether the program is associated to
the test scores of sixth and seventh grade students in the same years we estimate equation (1)
higher than Stock 12 We assign the stock variable to the theoretical school cohort.
15
for third-grade students. Since none of the cohorts of students taking the exams in sixth and
seventh grade during the period studied could have been affected by the construction
program, the lack of association between stock and test scores in the context of conditional
model (1) for this subpopulation would be reassuring about the causal interpretation of β in
estimates for third-grade students. Contrary, the presence of association between these two
variables in the context of conditional model (1), would cast doubts about the causal
interpretation of β in estimates for third-grade students.
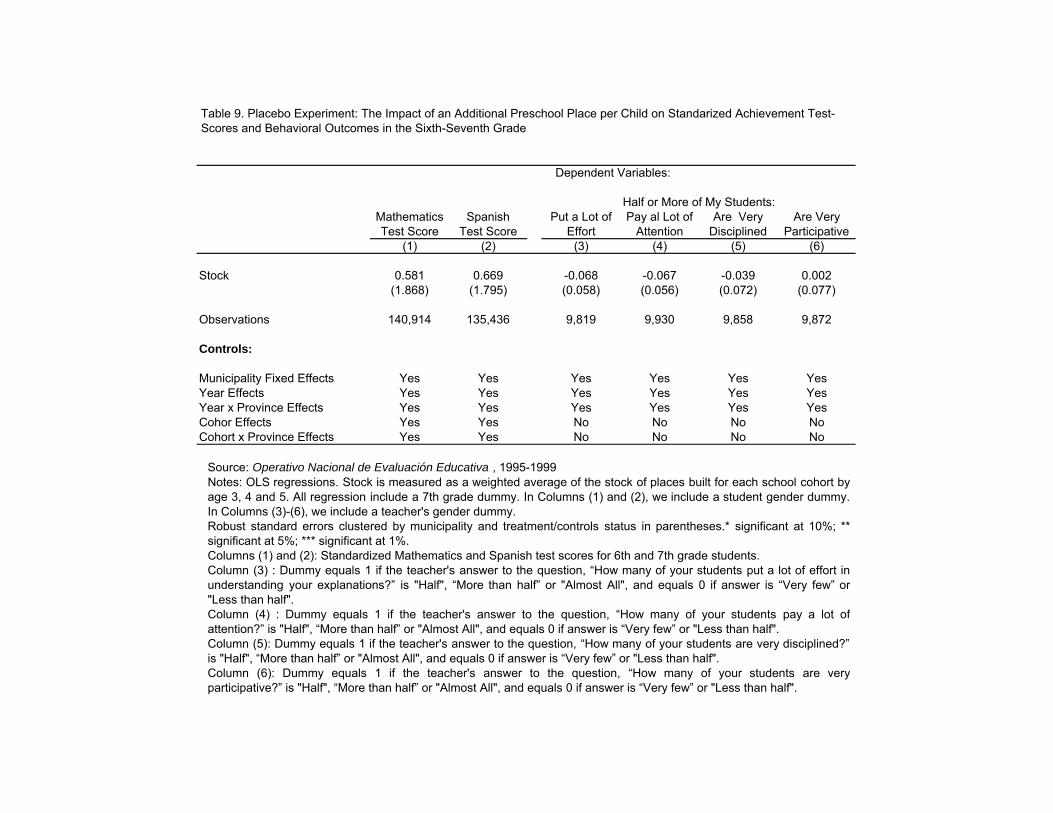
In Table 9, we look at the sixth and seventh grade students who took standardized
achievement tests in the same schools and years than the 3rd grade cohorts but where no
cohort of students was exposed to the treatment. We add four years to the primary school
cohorts of seventh graders and three years to the primary school cohorts of sixth graders to
create a false cohort. We assign the Stock variable to these students based on the false cohort.
In the first two columns of Table 9 we reproduce the test-scores regressions from Columns
(1) and (4) of Table 6 and in Columns (3) to (6) those from Column (1) of Table 8. We find
that the differences-in-differences estimates are 0.581 in Mathematics and 0.669 in Spanish
and are both not statistically different than zero13. Similarly we cannot reject the null that the
effects on behavioural outcomes are statistically significantly different than zero. All these
suggest that it is not the case that underlying municipality trends in test scores that are
systematically correlated with the program are driving our findings.
4.2 Selective Migration
Finally, another important threat to the validity of our estimates is potential migration of
students from the private to the public school system associated to the public preschool
16

expansion program. One explanation for our finding that the preschool expansion improves
primary school performance in public schools is that some students switch from the private
school system to the public school system because of the increasing availability of preschool
places in the public sector. In this case, the increase in test scores may be an artifact of the
change in the relative composition of students as opposed to the impact of pre-primary
education.
We examine whether the public preschool expansion affects the distribution of students
enrolled between public and private primary schools within a market –i.e. the municipality. If
there are no changes in relative enrollment rates then it is highly unlikely that selective
migration could bias our estimates. In order to test this, we estimate a regression model of
the following form:
cpjttpcpcpjStockcpjsthoolPrimary Sc Public in Studentsof Share j υλγµδα +++++=
where Share of Students Public Primary Schoolcpjst is the share of students in each cohort of
primary school in municipality j in province p in year t, and the variable Stock is defined as
before. We condition on municipality fixed effects and a full set of province-year and
province-cohort effects as well.
The dependent variable is constructed using administrative data on public and primary
school enrollment by municipality and grade. This information is available for the period
1994, 1996-2002. We use year and grade to define the primary school cohort. To respect the
cohorts we study in the test-scores section we restrict our estimations to observations for the
1992-1997 primary school cohorts. We report our findings in Table 10. In Column (1) we
look at all municipalities and in Column (2) we concentrate in those municipalities where
13 Because there is no test-score data for the 6th and 7th grade in 1998 we have run, for robustness purposes, all the regressions for 3rd graders without this year as well. The results do not differ
17

enrollment in private education is positive. We do not find any relationship between the
share of student in public primary school establishments and the public preschool expansion
program. Indeed, in all regression the coefficient δ is numerically equal to zero and
statistically insignificant. Accordingly, we do not find any evidence indicating that students
that would have attended private primary schools without the preschool expansion program
moved to public schools.
5. Concluding Remarks
Universal pre-primary education is expanding rapidly in developed and middle-income
countries (see OECD, 2000 and Myers, 1995). This paper provides causal evidence on the
impact of public pre-primary education on primary school performance by evaluating the
impact of dramatic preschool expansion program in Argentina, a middle-income and
predominantly urban developing country. Our results show that the pre-primary school
expansion had positive causal effect on third grade standardized Spanish and Mathematics
test scores. Moreover, we estimate that one year pre-primary school attendance increases
third grade performance by 8 percent of a mean and 25 of a standard deviation. We also find
that measures of curricular achievement, attention, participation, discipline, and effort are
positively affected by pre-primary school attendance.
significantly from those reported in Table 6.
18

References
Angrist, J. and A. Krueger, 1999, “Empirical Strategies in Labor Economics”, in O. Ashenfelter and D. Card (eds.) Handbook of Labor Economics, Volume 3A, Elsevier, North-Holland.
Berlinski, S. and S. Galiani, 2004, “The Effect of a Large Expansion of Pre-Primary School Facilities on Preschool Attendance and Maternal Employment”, Institute for Fiscal Studies Working Paper 0430.
Barnett, S., 1993, “Benefits of Compensatory Preschool Education”, Journal of Human Resources, 279-312.
Barnett, S., 1995, “Long-Term Effects of Early Childhood Programs on Cognitive and School Outcomes”, The Future of Children, 25-50.
Blau, D.M. and J. Currie, 2003, “Preschool, Day Care, and After School Care: Who’s Minding the Kids?” Mimeo.
Bransford, J.D., 1979, Human Cognition: Learning, Understanding, and Remembering, Wadsworth.
Carneiro, P. and J. Heckman, 2003, “Human Capital Policy”, in J. Heckman and A. Krueger (eds.) Inequality in America: What role for human capital policies?, MIT Press.
Cascio, E., 2004, “Schooling Attainment and the Introduction of Kindergartens into Public Schools”, mimeo.
Currie, J., 2001, “Early Childhood Education Programs”, Journal of Economic Perspectives 15, 213-238.
Danziger, S. and J. Waldfogel (2000): Securing the Future: Investing in Children from Birth to College, Russell Sage Foundation.
Duflo, E., 2001, “Schooling and Labor Market Consequences of School Construction in Indonesia: Evidence from an Unusual Policy Experiment”, American Economic Review 91, 795-813.
Galiani, S., P. Gertler and E. Schargrodsky, 2005, “School Decentralization: Helping the Good Get Better but Leaving the Rest Behind”, Mimeo.
Gilliam, W. and E. Zigler, 2001, “A Critical Meta-Analysis of All Evaluations of State-funded Preschool from 1977 to 1998: Implications for Policy, Service Delivery and Program Evaluation”, Early Childhood Research Quarterly 15, 441-473.
Heckman, J., 2000, “Policies to Foster Human Capital”, Research in Economics 54, 3-56. Heckman, J., J. Hsse and Y. Rubinstein, 2000, “The GED is a Mixed Signal: The Effect
of Cognitive and Non-Cognitive Skills on Human Capital and Labor Market Outcomes”, Mimeo.
Karoly, Lynn et al., 1998, Investing in our Children: What we Know and Don’t Know about the Costs and Benefits of Early Childhood Interventions, Santa Monica: RAND.
Llach, J., S. Montoya and F. Roldán, 1999, Educación para Todos, IERAL, Córdoba. Magnuson, A., C. Ruhm, and J. Waldfogel, 2005, "Does Prekindergarten Improve School
Preparation and Performance?", Economics of Education Review, forthcoming. Ministerio de Educación de la República Argentina, 1993, Resolución No 30/93 C.F.C. y
E. Ministerio de Educación de la República Argentina, 1994, Censo Educativo.
19
Ministerio de Educación de la República Argentina, 1996-2000, Anuario Estadístico. Myers, R., 1995, “Preschool Education in Latin America: Estate of Practice”, PREAL
Working Papers No. 1. OECD, 2002, “Strengthening Early Childhood Programs: A Policy Framework”, in
Education Policy Analysis, Paris. Rozensweig, M.R., and K.I. Wolpin (1988): “Evaluating the Effects of Optimally
Distributed Programs: Child Health and Family Planning Interventions”, American Economic Review 76, 470-482.
Ruhm, C., 2004 “Parental Employment and Child Cognitive Development”, Journal of Human Resources 39, 155-192.
Shonkoff, J. and D. Phillips (eds.), 2000, “From Neurons to Neighborhoods: The Science of Early Childhood Development”, National Academy Press, Washington D.C.
Shore, R., 1997, Re-thinking the Brain: New Insights into Early Development, Families and Work Institute, New York.
Sternberg, R., 1985, Beyond IQ: A Triarchic Theory of Human Intelligence, Cambridge University Press.
Tedesco, J., 1986, Educación y Sociedad en la Argentina (1880-1945), Buenos Aires: Editorial Solar.
20

Misiones
ChacoFormosa
Corrientes
Salta
Jujuy
San Juan
TucumánMendoza
Catamarca
Santiago del EsteroLa Pampa
Río Negro
Chubut
Neuquén
Entre Ríos
La Rioja
San Luis
Córdoba
Santa FeTierra del Fuego
Buenos AiresSanta CruzCiudad Autónoma de Buenos Aires
0.1
.2.3
.4P
resc
hool
Pla
ces
Con
stru
cted
per
Chi
ld b
y 20
00
.2 .4 .6 .8Preschool Enrollment in 1991
Figure 1. Preschool Construction and Pre-treatment Preschool Enrollment

Table A1: Years in Which Students Were Tested and Teachers Were Surveyed
Year 3rd Graders Tested 6th Graders Tested 7th Graders Tested Teacher Survey1994 X1995 X X X1996 X X X X1997 X X X X1998 X 1999 X X X X2000 X
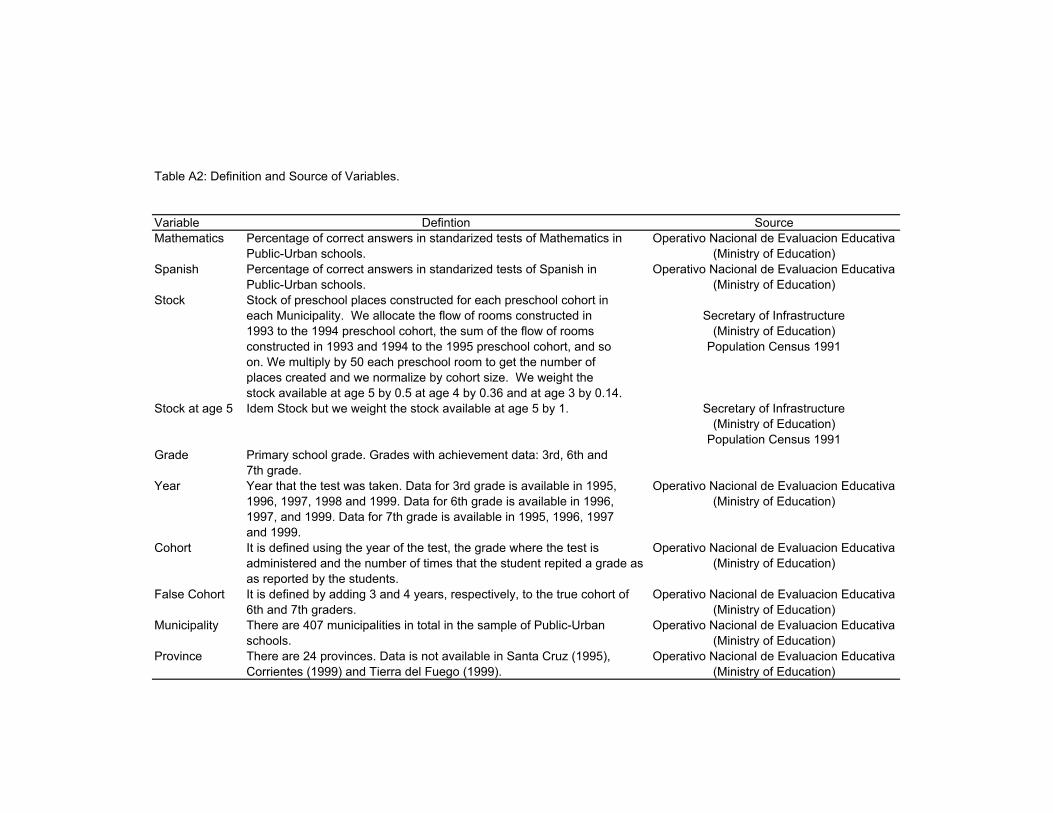
Table A2: Definition and Source of Variables.
Variable Defintion SourceMathematics Percentage of correct answers in standarized tests of Mathematics in Operativo Nacional de Evaluacion Educativa
Public-Urban schools. (Ministry of Education)Spanish Percentage of correct answers in standarized tests of Spanish in Operativo Nacional de Evaluacion Educativa
Public-Urban schools. (Ministry of Education)Stock Stock of preschool places constructed for each preschool cohort in
each Municipality. We allocate the flow of rooms constructed in Secretary of Infrastructure1993 to the 1994 preschool cohort, the sum of the flow of rooms (Ministry of Education)constructed in 1993 and 1994 to the 1995 preschool cohort, and so Population Census 1991on. We multiply by 50 each preschool room to get the number ofplaces created and we normalize by cohort size. We weight thestock available at age 5 by 0.5 at age 4 by 0.36 and at age 3 by 0.14.
Stock at age 5 Idem Stock but we weight the stock available at age 5 by 1. Secretary of Infrastructure(Ministry of Education)
Population Census 1991Grade Primary school grade. Grades with achievement data: 3rd, 6th and
7th grade.Year Year that the test was taken. Data for 3rd grade is available in 1995, Operativo Nacional de Evaluacion Educativa
1996, 1997, 1998 and 1999. Data for 6th grade is available in 1996, (Ministry of Education)1997, and 1999. Data for 7th grade is available in 1995, 1996, 1997and 1999.
Cohort It is defined using the year of the test, the grade where the test is Operativo Nacional de Evaluacion Educativaadministered and the number of times that the student repited a grade as (Ministry of Education)as reported by the students.
False Cohort It is defined by adding 3 and 4 years, respectively, to the true cohort of Operativo Nacional de Evaluacion Educativa6th and 7th graders. (Ministry of Education)
Municipality There are 407 municipalities in total in the sample of Public-Urban Operativo Nacional de Evaluacion Educativaschools. (Ministry of Education)
Province There are 24 provinces. Data is not available in Santa Cruz (1995), Operativo Nacional de Evaluacion EducativaCorrientes (1999) and Tierra del Fuego (1999). (Ministry of Education)

Pre-primary School Gross Share of Total Rooms ConstructedProvince Enrollment Rate: Ages 3-5 Rooms Constructed per Child
Misiones 0.23 0.07 0.19Chaco 0.27 0.09 0.23Formosa 0.31 0.04 0.21Corrientes 0.33 0.08 0.22Salta 0.33 0.05 0.13Jujuy 0.34 0.05 0.20San Juan 0.34 0.07 0.33Tucumán 0.35 0.07 0.15Catamarca 0.36 0.02 0.19Mendoza 0.36 0.07 0.13Santiago del Estero 0.36 0.04 0.15La Pampa 0.38 0.02 0.17Río Negro 0.42 0.03 0.12Chubut 0.43 0.03 0.20Entre Ríos 0.43 0.06 0.15Neuquén 0.43 0.02 0.09La Rioja 0.44 0.03 0.28San Luis 0.46 0.02 0.18Córdoba 0.49 0.02 0.02Santa Fe 0.52 0.08 0.09Tierra del Fuego 0.59 0.01 0.09Buenos Aires 0.60 0.03 0.01Santa Cruz 0.64 0.01 0.03Ciudad Autónoma de Buenos Aires 0.80 0.03 0.05
Total 0.49 1.00 0.09
Source: Minisitry of Education .
Table 1: Share of Rooms Constructed and Rooms Constructed per Children in Preschool age by Province: 1993-1999

Enrollment Rate: Age 7Province 1991 2001 1991 2001 1991 2001
Ciudad Autónoma de Buenos Aires 0.98 0.99 0.80 0.93 89,353 85,728Buenos Aires 0.98 0.99 0.60 0.76 442,757 558,623Catamarca 0.96 0.99 0.36 0.48 7,286 11,493Córdoba 0.98 0.99 0.49 0.67 78,538 110,322Corrientes 0.95 0.97 0.33 0.48 20,314 31,584Chaco 0.89 0.96 0.27 0.40 17,857 30,137Chubut 0.98 0.99 0.43 0.60 11,339 15,534Entre Ríos 0.97 0.99 0.43 0.59 28,913 41,301Formosa 0.95 0.98 0.31 0.42 10,365 15,964Jujuy 0.97 0.99 0.34 0.50 14,023 21,882La Pampa 0.97 0.99 0.38 0.49 6,297 8,175La Rioja 0.97 0.98 0.44 0.62 7,169 12,468Mendoza 0.97 0.99 0.36 0.50 33,583 46,089Misiones 0.93 0.95 0.23 0.40 15,437 29,789Neuquén 0.98 0.99 0.43 0.62 13,165 18,527Río Negro 0.97 0.99 0.42 0.63 15,736 21,421Salta 0.96 0.98 0.33 0.46 23,442 36,849San Juan 0.97 0.98 0.34 0.50 12,025 19,577San Luis 0.96 0.98 0.46 0.60 8,763 14,503Santa Cruz 0.99 1.00 0.64 0.73 7,603 9,406Santa Fe 0.98 0.99 0.52 0.72 86,246 112,520Santiago del Estero 0.94 0.97 0.36 0.50 18,775 30,018Tucumán 0.97 0.98 0.35 0.49 27,849 43,655Tierra del Fuego 0.99 1.00 0.59 0.83 3,477 5,590Total 0.97 0.98 0.49 0.64 1,000,310 1,331,155
Primary School Gross Pre-primary School Gross Pre-primary SchoolEnrollment Rate: Age 3- 5 Enrollment Level: Age 3- 5
Source: Censo de Poblacion y Vivienda , 1991 and 2001.
Table 2: Pre-primary and Primary School Participation in Argentina
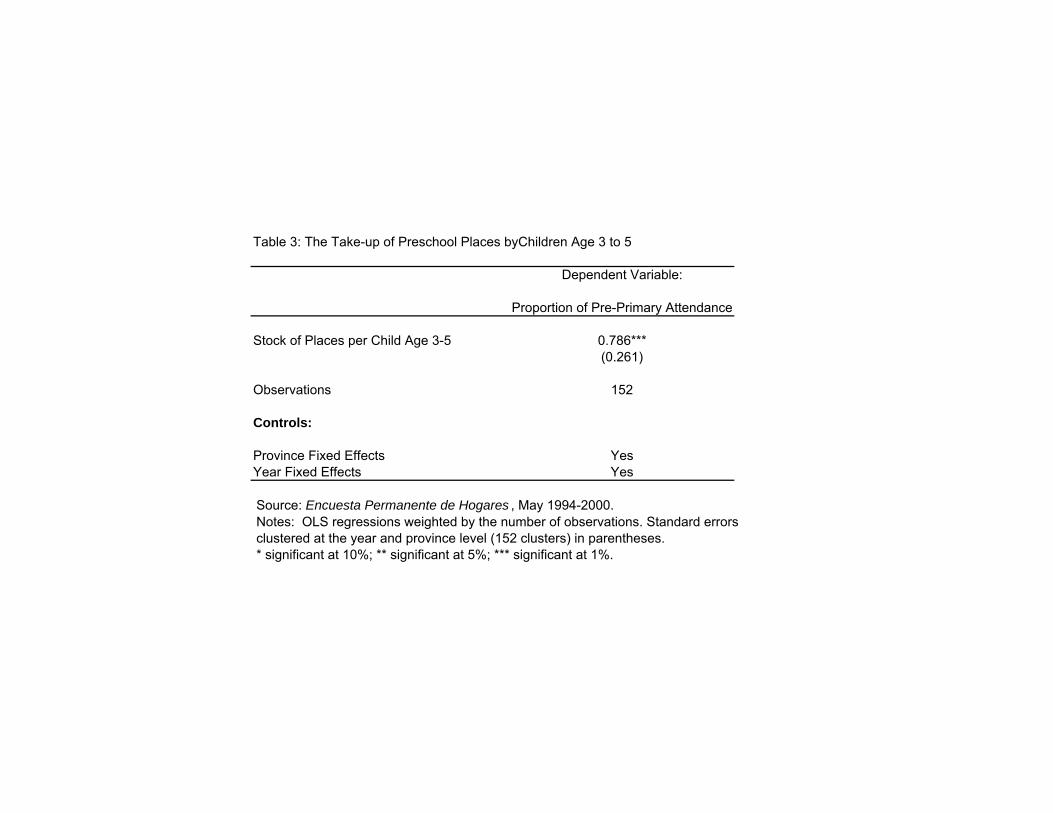
Table 3: The Take-up of Preschool Places byChildren Age 3 to 5
Dependent Variable:
Proportion of Pre-Primary Attendance
Stock of Places per Child Age 3-5 0.786***(0.261)
Observations 152
Controls:
Province Fixed Effects YesYear Fixed Effects Yes
Source: Encuesta Permanente de Hogares , May 1994-2000.Notes: OLS regressions weighted by the number of observations. Standard errors clustered at the year and province level (152 clusters) in parentheses.* significant at 10%; ** significant at 5%; *** significant at 1%.

Table 4. Summary Statistics for Test Scores.
Mathematics Spanish Mathematics Spanish Mathematics Spanish
Panel A: Third Grade Students
Test Score Mean 61.14 62.79 61.02 64.43 61.25 61.18Test Score Standard Deviation 19.70 20.41 19.80 20.31 19.59 20.38Number of Observations 126,106 117,515 62,628 58,408 63,478 59,107Number of Schools 3,035 3,024 3,023 3,005 3,027 3,015Number of Municipalities 417 417 417 417 417 417
Panel B: Sixth and Seventh Grade Students
Test Score Mean 53.18 55.86 52.87 58.24 53.5 53.41Test Score Standard Deviation 20.45 19.84 20.42 19.62 20.47 19.76Number of Observations 145,292 139,573 73,369 70,678 71,923 68,895Number of Schools 2,750 2,755 2,741 2,741 2,744 2,747Number of Municipalities 407 407 407 407 407 407
All Girls Boys
Source: Operativo Nacional de Evaluación Educativa , 1995-1999

Table 5. Summary Statistics for Behavioural Outcomes as Assessed by the Teachers
Very Few Less than Half More than Almost Half Half All Observations
Panel A: Third Grade Students
“How many of your students put a lot of effort 5.81% 7.11% 17.64% 32.68% 36.70% 4,572in understanding your explanations?"
“How many of your students pay a lot of attention?" 4.58% 5.54% 16.07% 33.45% 40.36% 4,586
“How many of your students are very disciplined?" 12.12% 12.31% 21.45% 29.54% 24.47% 4,540
“How many of your students are very participative?" 5.40% 11.11% 21.09% 30.89% 31.50% 4,577
Panel B: Sixth and Seventh Grade Students
“How many of your students put a lot of effort 6.84% 9.86% 19.75% 31.16% 32.39% 9,819in understanding your explanations?"
“How many of your students pay a lot of attention?" 6.23% 7.99% 17.26% 31.20% 37.32% 9,930
“How many of your students are very disciplined?" 12.82% 12.46% 20.21% 27.28% 27.24% 9,858
“How many of your students are very participative?" 9.52% 16.06% 25.53% 28.13% 20.75% 9,872
Source: Operativo Nacional de Evaluación Educativa , 1995-1999
(1) (2) (3) (4) (5) (6) (7) (8)
Stock 4.694** 4.744** 6.527*** 3.207*** 4.761** 4.420** 5.983*** 2.721**(1.934) (2.091) (2.024) (1.193) (2.075) (2.155) (2.247) (1.216)
Gain in means (µ) 0.08µ 0.08µ 0.11µ 0.05µ 0.08µ 0.07µ 0.10µ 0.04µGain in standard deviations (σ) 0.24σ 0.24σ 0.33σ 0.16σ 0.23σ 0.21σ 0.29σ 0.13σ
Observations 126,106 126,106 126,106 126,106 117,515 117,515 117,515 117,515
Controls:
Municipality Fixed Effects Yes Yes No Yes Yes Yes No YesSchool Fixed Effects No No Yes No No No Yes NoCohort Effects Yes Yes Yes Yes Yes Yes Yes YesYear Effects Yes Yes Yes Yes Yes Yes Yes YesCohort x Province Effects Yes Yes Yes Yes Yes Yes Yes YesYear x Province Effects Yes Yes Yes Yes Yes Yes Yes YesPreschool Enrollment in 1991 x Cohort Effects No Yes No No No Yes No No
Mathematics Test Score Spanish Test Score
Dependent Variable:
Source: Operativo Nacional de Evaluación Educativa , 1995-1999Notes: OLS regressions. In Columns (1) - (3) and (5) - (7), stock is measured as a weighted average of the stock of places built for each school cohort by age 3, 4 and 5. In Columns (4) and (8), stock is measured as the stock of places built for each school cohort by age 5. All regressions include a gender dummy. In Columns (2) and (6), preschool enrollment is pre-treatment and it is measured at the municipality level.Robust standard errors clustered by municipality and treatment/controls status in parentheses.* significant at 10%; ** significant at 5%; *** significant at 1%.
Table 6. The Impact of an Additional Preschool Place per Child on Standarized Achievement Test-Scores in the Third Grade

(1) (2) (3) (4)
Stock 4.242** 3.755* 4.014* 2.936(2.004) (2.169) (2.140) (2.227)
Stock x Girl 0.886 1.463(0.862) (0.907)
Stock x [% of poor househoulds in the municipality in 2001 - 18.1% (Median)] 0.201 0.388**(0.153) (0.159)
Observations 126,106 126,106 117,515 117,515
Controls:
Municipality Fixed Effects Yes Yes Yes YesCohort Effects Yes Yes Yes YesYear Effects Yes Yes Yes YesYear x Province Effects Yes Yes Yes YesCohort x Province Effects Yes Yes Yes Yes
Mathematics Test Score Spanish Test Score
Dependent Variable:
Source: Operativo Nacional de Evaluación Educativa, 1995-1999Notes: OLS regressions. Stock is measured as a weighted average of the stock of places built for each school cohort by age 3, 4 and 5. All regressions include a gender dummy. The median percentage of households per municipality living in poverty in 2001 was 18.1%, at the 25 quantile of the poverty distribution per municipality 10.8% of households were poor, and at the 75 quantile 26.3% of households were poor.Robust standard errors clustered by municipality and treatment/controls status in parentheses. * significant at 10%; **significant at 5%; *** significant at 1%.
Table 7. The impact of an Additional Preschool Place per child on Standarized Achievement Test-Scores in the Third Grade. Differences between Boys and Girls and by Poverty Level.
(1) (2) (3) (4) ObservationsDependent Variable:
Half or more of my students put a lot of effort 0.211** 0.192** 0.253* 0.103* 4,541(0.089) (0.088) (0.154) (0.061)
Half or more of my students pay a lot of attention 0.122** 0.116* 0.136 0.063 4,586(0.062) (0.062) (0.097) (0.046)
Half or more of my students are very disciplined 0.114 0.082 0.145 0.029 4,540(0.098) (0.100) (0.172) (0.070)
Half or more of my students are very participative 0.165** 0.140* 0.084 0.126** 4,571(0.073) (0.076) (0.123) (0.056)
Controls:
Municipality Fixed Effects Yes Yes No YesSchool Fixed Effects No No Yes NoYear Effects Yes Yes Yes YesYear x Province Effects Yes Yes Yes YesPreschool Enrollment 1991 x Cohort Effects Yes Yes Yes Yes
Source: Operativo Nacional de Evaluación Educativa , 1995-1999Notes: OLS regressions. In Columns (1) - (3), stock is measured as a weighted average of the stock of places built for each school cohort by age 3, 4 and 5. In Column (4), stock is measured as the stock of places built for each school cohort by age 5. In Column (2), preschool enrollment is pre-treatment and it is measured at the municipality level. All regressions include a teacher's gender dummy.Robust standard errors clustered by municipality and treatment/controls status in parentheses.* significant at 10%; ** significant at 5%; *** significant at 1%. Row (1) : Dummy equals 1 if the teacher's answer to the question, “How many of your students put a lot of effort in understanding your explanations?” is "Half", “More than half” or "Almost All", and equals 0 if answer is “Very few” or "Less than half".Row (2) : Dummy equals 1 if the teacher's answer to the question, “How many of your students pay a lot of attention?” is "Half", “More than half” or "Almost All", and equals 0 if answer is “Very few” or "Less than half".Row (3) : Dummy equals 1 if the teacher's answer to the question, “How many of your students are very disciplined?” is "Half", “More than half” or "Almost All", and equals 0 if answer is “Very few” or "Less than half".Row (4): Dummy equals 1 if the teacher's answer to the question, “How many of your students are very participative?” is "Half" “More than half” or "Almost All" and equals 0 if answer is “Very few” or "Less than half"
Table 8. The Impact of an Additional Preschool Place per Child on Behavioral Outcomes in the Third Grade as Assessed by the Teachers.
Mathematics Spanish Put a Lot of Pay al Lot of Are Very Are VeryTest Score Test Score Effort Attention Disciplined Participative
(1) (2) (3) (4) (5) (6)
Stock 0.581 0.669 -0.068 -0.067 -0.039 0.002(1.868) (1.795) (0.058) (0.056) (0.072) (0.077)
Observations 140,914 135,436 9,819 9,930 9,858 9,872
Controls:
Municipality Fixed Effects Yes Yes Yes Yes Yes YesYear Effects Yes Yes Yes Yes Yes YesYear x Province Effects Yes Yes Yes Yes Yes YesCohor Effects Yes Yes No No No NoCohort x Province Effects Yes Yes No No No No
Half or More of My Students:
Dependent Variables:
Source: Operativo Nacional de Evaluación Educativa , 1995-1999Notes: OLS regressions. Stock is measured as a weighted average of the stock of places built for each school cohort byage 3, 4 and 5. All regression include a 7th grade dummy. In Columns (1) and (2), we include a student gender dummy.In Columns (3)-(6), we include a teacher's gender dummy. Robust standard errors clustered by municipality and treatment/controls status in parentheses.* significant at 10%; **significant at 5%; *** significant at 1%. Columns (1) and (2): Standardized Mathematics and Spanish test scores for 6th and 7th grade students.Column (3) : Dummy equals 1 if the teacher's answer to the question, “How many of your students put a lot of effort inunderstanding your explanations?” is "Half", “More than half” or "Almost All", and equals 0 if answer is “Very few” or"Less than half".Column (4) : Dummy equals 1 if the teacher's answer to the question, “How many of your students pay a lot ofattention?” is "Half", “More than half” or "Almost All", and equals 0 if answer is “Very few” or "Less than half".Column (5): Dummy equals 1 if the teacher's answer to the question, “How many of your students are very disciplined?”is "Half", “More than half” or "Almost All", and equals 0 if answer is “Very few” or "Less than half".Column (6): Dummy equals 1 if the teacher's answer to the question, “How many of your students are veryparticipative?” is "Half", “More than half” or "Almost All", and equals 0 if answer is “Very few” or "Less than half".
Table 9. Placebo Experiment: The Impact of an Additional Preschool Place per Child on Standarized Achievement Test-Scores and Behavioral Outcomes in the Sixth-Seventh Grade

(1) (2)
Stock -0.0021255 0.000209(0.001736) (0.006459)
Observations 14,592 9,582
Controls:
Municipality Fixed Effects Yes YesCohort Effects Yes YesYear Effects Yes YesCohort x Province Effects Yes YesYear x Province Effects Yes Yes
in Public Schools
Dependent Variable:Share of Students
Source: Ministry of Education , 1994, 1995-2002Notes: OLS regressions. Stock is measured as a weighted average of the stock of placesbuilt for each school cohort by age 3, 4 and 5. In Column (1), we include all urbanMunicipalities. In Column (2), we only include those Municipalities with some students inprivate education. Robust standard errors clustered by municipality and treatment/controls status inparentheses. * significant at 10%; ** significant at 5%; *** significant at 1%.
Table 10. The impact of an Additional Preschool Place per child on The Share of Students in Public Primary Schools per Municipality.