The Effect of Pre-Primary Education on Primary School ...
41
THE WILLIAM DAVIDSON INSTITUTE AT THE UNIVERSITY OF MICHIGAN The Effect of Pre-Primary Education on Primary School Performance By: Samuel Berlinski, Sebastian Galiani and Paul Gertler William Davidson Institute Working Paper Number 838 July 2006
Transcript of The Effect of Pre-Primary Education on Primary School ...

THE WILLIAM DAVIDSON INSTITUTE AT THE UNIVERSITY OF MICHIGAN
The Effect of Pre-Primary Education on
Primary School Performance
By: Samuel Berlinski, Sebastian Galiani and Paul Gertler
William Davidson Institute Working Paper Number 838 July 2006

The Effect of Pre-Primary Education on Primary School Performance
Samuel Berlinski University College London and Institute for Fiscal Studies
Sebastian Galiani*
Washington University in St Louis
Paul Gertler UC Berkeley and The World Bank
This version: July 28, 2006 Abstract: Although the theoretical case for universal pre-primary education is strong, the empirical foundation is weak. In this paper, we contribute to the empirical case by investigating the effect of a large expansion of universal pre-primary education on subsequent primary school performance in Argentina. We estimate that one year of pre-primary school increases average third grade test scores by 8 percent of a mean or by 23 percent of the standard deviation of the distribution of test scores. We also find that pre-primary school attendance positively affects student’s self-control in the third grade as measured by behaviors such as attention, effort, class participation, and discipline. JEL: I2, J1 Keywords: Preschool, Pre-primary education, Primary school performance
* Samuel Berlinski, Department of Economics, University College London, Gower Street, London WC1E 6BT, UK, Tel: (44-20) 7679-5847, [email protected]. Sebastian Galiani, Department of Economics, Washington University in St Louis, Campus Box 1208, St Louis, MO 63130-4899, US, Tel: (1-314) 935-5670, [email protected]. Paul Gertler, Haas Business School, University of California at Berkeley, Berkeley, CA 94720-1900, US, Tel: (510) 642-1418, [email protected]. We thank Pedro Carneiro, Ernesto Schargrodsky, Steve Pischke and seminar participants at Fundacion Ramon Areces Scientific Meeting, IGIER-PIER International Conference, LACEA Meeting, NBER’s Children Meeting, Universidad de Chile, Universidad de Montevideo, Universidad de San Andres, Universita di Padova, UC Berkeley, UCLA, University of Columbia, and Washington University in St. Louis for useful comments. We also thank Damián Bonari, Alfredo Dato, Irene Oiberman and Juan Sanguinetti for their contribution to our understanding of the program and for providing us with data.

1
1. Introduction
Most OECD and many middle income countries have turned to universal pre-primary
education in order to give children a better start to life (Myers 1995, OECD 2002 and
UNESCO 2004). While there is substantial empirical evidence that pre-primary school
programs targeted to disadvantaged children have significant benefits,1 little is known
about the benefits for the population as a whole. Indeed, there is some concern that
separating pre-primary age children from their mothers while they are working may have
detrimental effects on child development (e.g. Baker et al., 2005 and Ruhm, 2004). In this
paper, we attempt to shed some light on this debate by investigating the effect of a large
expansion of universal pre-primary education on subsequent primary school performance
in Argentina.
A large body of literature makes the case for investment in early childhood
development. Research in neuroscience, psychology and cognition has established that
learning is easier in early childhood than later in life, and that nutrition and cognitive
stimulation early in life are critical for long-term skill development (see, among others,
Bransford, 1979; Shonkoff and Phillips, 2000; Shore, 1997 and Sternberg, 1985). Becker
(1964) points out that the returns to investments in early childhood are likely to be higher
than those to investments made later in life simply because beneficiaries have a longer
time to reap the rewards. Carneiro and Heckman (2003) additionally note that
investments in human capital have dynamic complementarities, so that “learning begets
learning” (p.7). Currie (2001) suggests that it may be more effective for a government to
equalize initial endowments through early childhood development programs than to

2
compensate for differences in outcomes later in life. And she hypothesizes that families
may under-invest in early childhood because of market failures such as liquidity
constraints and information failures.
We examine the returns to pre-primary education by taking advantage of a large
infrastructure program aimed at increasing school attendance for children between the
ages of 3 to 5. Between 1993 and 1999, Argentina constructed enough classrooms for
approximately 175,000 additional children to attend preschool. By conditioning on region
and cohort fixed effects, the construction program generated plausible exogenous
variation in the supply of school facilities. Using an identification strategy similar to
Rosenzweig and Wolpin (1988), Card and Krueger (1992), and Duflo (2001), among
others, we exploit the variation in treatment intensity across regions and cohorts to
estimate the effect of expanding pre-primary school facilities on subsequent achievement
in primary school.
Our results show that attending pre-primary school had a positive effect on
subsequent third grade standardized Spanish and Mathematics test scores. We estimate
that one year of pre-primary school increased average third grade test scores by 8 percent
of a mean or by 23 percent of the standard deviation of the distribution of test scores. We
also find that pre-primary school attendance positively affected student’s behavioral skills
such as attention, effort, class participation, and discipline. This positive effect on
behavioral skills provides evidence of possible pathways by which pre-primary might
affect subsequent primary school test performance as preschool education facilitates the
process of socialization and self-control necessary to make the most of classroom
1 See, among others, Barnett (1993), Barnett (1995), Currie and Thomas (1995), Reynolds (1998), Karoly et al. (1998), Danzinger and Waldfogel (2000), Currie (2001), Garces, Thomas, and Currie (2002), Blau and

3
learning (Currie, 2001). Moreover, behavioral skills are as important as cognitive skills to
future success in life (Blau and Currie, 2004, Heckman et al., 2006).
Our results contribute to a very small literature that has been limited to the US context.
In fact, to our knowledge, there have been only two studies of the effect of universal pre-
primary school. Cascio (2004) finds that the expansion of kindergarten financing in the
late 60s and early 70s reduced subsequent grade repetition in the Southern and Western
United States relative to the Northern States. And using data from the Early Childhood
Longitudinal Study, Magnuson, Ruhm and Waldfogel (2005) find that pre-primary
education is associated with higher reading and mathematics skills at primary school
entry, but that these correlations disappeared by the end of first grade. They also find that
when preschools are not located in public schools, pre-primary education is associated
with higher levels of behavioral problems.
The rest of the paper is organized as follows. In Section 2, we introduce the basic
features of the construction program and background facts about the educational system
in Argentina. In Section 3, we describe the enrollment effect of the program. In section 4
we present the data, the empirical methodology and our main results. In Section 5, we test
the robustness of the results in the paper. Finally, in section 6, we present our conclusions.
2. The School Construction Program
The public school system in Argentina provides 3 years of pre-primary education
covering ages 3 through 5. Pre-primary classes are almost always physically and
administratively attached to primary schools. They typically operate two shifts (morning
Currie (2004) and Schweinhart, et al. (2005).

4
and afternoon) each for three and a half hours a day, five days a week over the 9 month
school year.
According to Ministerio de Educación (1993), pre-primary education was intended to
achieve two goals:
1. Enhance educational achievements accomplished at home and develop new age-
appropriate competences.
2. Early access to knowledge and skills that improve performance in the first years of
primary education.
In order to achieve these goals, the curriculum was explicitly designed to develop: a)
communication skills, b) personal autonomy and behavioral skills, c) social skills, d)
logical and mathematical skills and e) emotional skills (Ministerio de Educación, 1993).
While primary school has been compulsory since 1885 (Tedesco, 1986), pre-primary
education only became compulsory in 1993 when the new Federal Education Law
expanded compulsory education to include the last year of pre-primary school through
the first two years of secondary school. However, since there were not enough physical
spaces in pre-primary classrooms to accommodate everyone instantaneously, the law
allowed the Government to phase in implementation over time (Llach et al., 1999).
To implement the law, the government began a massive public school construction
program. From 1993 to 1999, the National Government financed the construction of
3,531 rooms. On average, each room was 45 square meters constructed at an average cost
of $15,000 pesos.2 Given an average class size of 25 students and 2 pre-primary shifts
(i.e., 50 new places per room constructed), the construction program created
approximately 176,550 preschool places.

5
The government used a non-linear allocation rule based on an index of unsatisfied
basic needs constructed with data from the 1991 Census in order to target the
construction to poor areas with low pre-primary enrollment rates. This is evident in
Figure 1, where we plot the number of pre-primary place per child age 3-5 constructed in
a province between 1993 and 1999 against the 1991 gross enrollment rates. This figure
shows that more places were constructed in Provinces with low baseline pre-primary
enrollment. In Table 1 we present the number of pre-primary places created per child and
the province’s share of total places constructed sorted by 1991 pre-primary gross
enrollment rate. From these data, we find a correlation of -0.68 between provincial places
per child and the 1991 pre-primary enrollment rates in 1991, and a correlation of -0.52
between the shares of total places with 1991 pre-primary enrollment rates.
3. Enrollment and Take-up
The expansion in pre-primary classrooms was associated with a large increase in pre-
primary enrollment. In Table 2, we report pre-primary and primary school gross
enrollment rates by province using data from the 1991 and 2001 population censuses.
While the enrollment rate for pre-primary education in 1991 was 49 percent, it varied
substantially across regions with enrollment as high as 80 percent in the Autonomous
City of Buenos Aires and as low as 27 percent in the poor province of Chaco. The growth
in enrollment between 1991 and 2001 is noticeable, as the average enrollment rate
increased to 64 percent and the number of children attending pre-primary school climbed
by 330,845. Comparing 1991 to 2001, all provinces increased enrollment in pre-primary
2 At the time of construction the exchange rate was pegged one to one with the US dollar.
6
education by at least 10 percentage points. In contrast, primary school enrollment
increased negligibly from 97 percent in 1991 to 98 percent in 2001.
How much of the increase in enrollment was caused by the construction program? In
order to answer this question, we exploit data on preschool enrollment of children aged 3
to 5 from the Argentine household survey Encuesta Permanente de Hogares (EPH),
which is representative of 70 percent of the urban population of Argentina.3 The survey
has been conducted annually since 1974 in the Autonomous City of Buenos Aires and the
main urban centers (agglomerates) of each province (except for Rio Negro). Starting in
1994, the EPH began reporting in all provinces reliable school enrollment data for
children in preschool age. We use the May waves to construct annual pre-primary
enrollment rates for 1994-2000 at the provincial level, which is the lowest level
geographic identifier available in the survey.
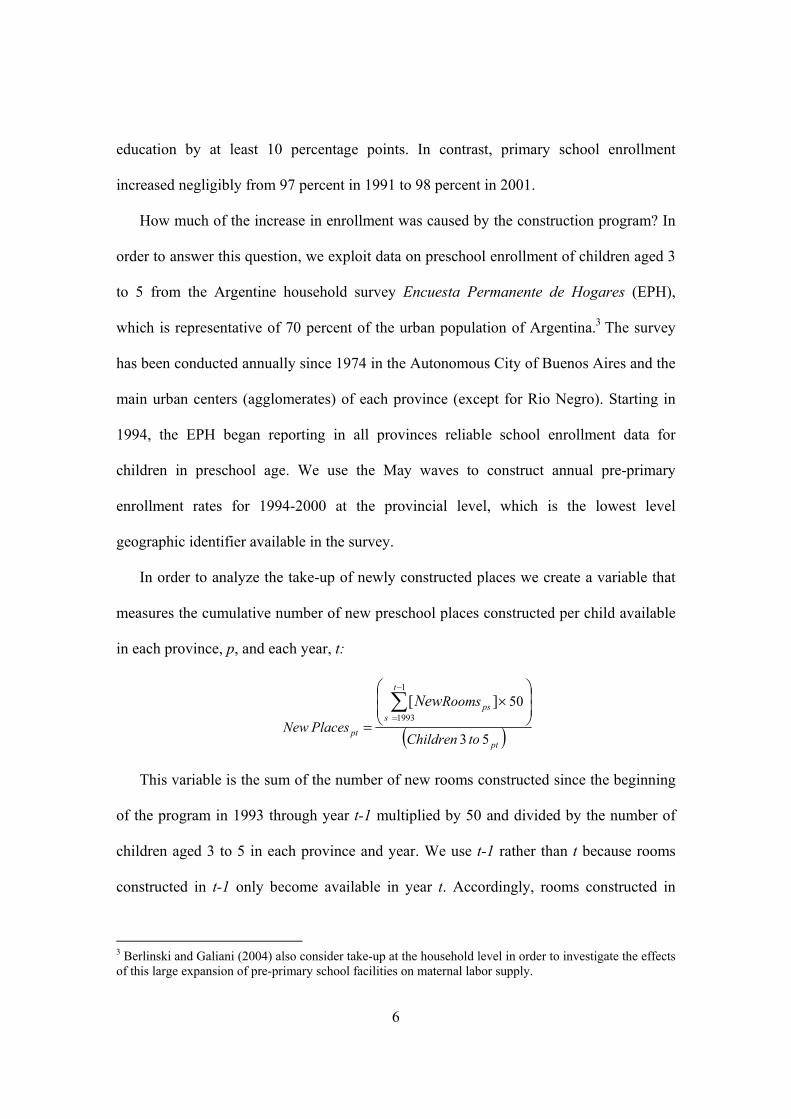
In order to analyze the take-up of newly constructed places we create a variable that
measures the cumulative number of new preschool places constructed per child available
in each province, p, and each year, t:
( )pt
t
sps
pt toChildren
Rooms
PlacesNew
New
5 3
50
1
1993][ ⎟
⎟⎠
⎞⎜⎜⎝
⎛×
=∑−
=
This variable is the sum of the number of new rooms constructed since the beginning
of the program in 1993 through year t-1 multiplied by 50 and divided by the number of
children aged 3 to 5 in each province and year. We use t-1 rather than t because rooms
constructed in t-1 only become available in year t. Accordingly, rooms constructed in
3 Berlinski and Galiani (2004) also consider take-up at the household level in order to investigate the effects of this large expansion of pre-primary school facilities on maternal labor supply.

7
1993 start to be used in 1994, rooms constructed in 1994 star to be used in 1995 and so
on. The cumulative number of rooms is multiplied by 50 to reflect the fact that a room
accommodates 25 children on average and is used for two shifts per day.
We estimate the following regression function:
pttpptNewPlacesptPE ελµβα ++++= (1)
where PEpt is the preschool enrollment rate for children aged 3 to 5 in province p in year t,
µp is a province fixed-effect, λt is a year fixed-effect common to all provinces and εpt is a
province specific error term. The parameter β is an estimate of the average effect of
constructing an extra place per child aged 3-5 on the preschool attendance rate. If the
parameter β is equal to one, then there was full take-up of newly constructed places.
In Column (1) of Table 3 we report the estimate of the effect of the construction
program on pre-primary enrollment controlling by province and year fixed effects. We
find that one place constructed per child in preschool age increases the likelihood of pre-
primary school attendance by 0.813. Moreover, we cannot reject the null hypothesis that
the coefficient is one and therefore that there was full take-up of newly constructed places.
Given that the average number of places constructed per child over the period was 0.09,
the average increase in pre-primary school attendance as a consequence of the program is
estimated to be approximately 7.317 percentage points. Hence, the program explains
about half of the 15 percentage point increase in the gross enrollment rate experienced
from 1991 to 2001.
The results in Column (1) are robust to the inclusion of other controls. For example,
in Column (2) we allow for idiosyncratic trends in province enrollment levels in pre-
primary education. Given that different provinces start with different enrollment rates,

8
they may naturally grow at different rates and these trends could be systematically
correlated with the construction program. As in Duflo (2001), we do this by interacting
the 1991 pre-primary enrollment rate for the 3-5 age groups in each province with year
dummies. In Column (3), we include yearly measures of province real GDP per capita as
it could have been the case that enrollment increased as a consequence of raising
provincial income and that this is correlated with the program. None of these added
variables are statistically significant and we cannot reject the null hypothesis that the
point estimates in Columns (2) and (3) are equal to the one in column (1).
4. The Impact on Student Performance
In this section we are interested in answering two related questions. First, what is the
net effect of the supply of pre-primary public school on subsequent school outcomes of
children? This reduced-form estimate, often referred to as the “Intention-to-Treat effect”
(ITT), sheds light on the impact of the policy of expanding pre-primary school places.
Second, we are interested in knowing the effect of attending pre-primary public school on
subsequent school outcomes of children, or the “Treatment-on-the-Treated” (TOT) effect.
This second analysis sheds light on the academic returns to pre-primary. However, since
we do not reject that the take-up rate of the newly constructed places is one, the intention-
to-treat estimates are also estimates the treatment-on-the-treated parameter. This implies
that we can interpret the estimated effect of making new places available on subsequent
primary school performance as the effect of attending pre-primary school on subsequent
performance.

9
4.1 Measuring Performance
Our primary source of information on student performance is from the administrative
records of the Argentine National Education Ministry, specifically the Operativo
Nacional de Evaluación Educativa (National Educational Assessment Operation) or
ONEE. Starting in 1994, the ONEE administered standardized achievement tests in
Mathematics and Spanish to students, and questionnaire to teachers covering student
behavior as well as teacher and school characteristics.
The nationally administered standardized test scores are uniform and monotonic
measures of school performance. However, teachers could intentionally train students to
maximize test scores instead of teaching general skills and knowledge. In this case, the
test scores would not reflect school quality, but rather how well schools prepared students
to take the test. This, however, is unlikely in Argentina where there are no rewards or
punishments for teachers or schools based on test outcomes (Galiani et al., 2005). In fact,
the Government set-up the standardized tests to evaluate the overall functioning of the
school system, and the exams have no bearing on student progression or teacher
compensation.
Since standardized test scores do not capture all of the dimensions of learning, the
ONEE complemented the student testing with a teacher questionnaire that collected
information about student behavior in the classroom. Specifically, teachers were asked
1. “How many of your students pay a lot of attention in class?”
2. “How many of your students put a large amount of effort into understanding your
explanations?”
3. “How many of your students are well disciplined in the classroom?”
4. “How many of your students regularly participate in class?”

10
The possible answers to these questions are: (a) “Almost all”, (b) “More than half”, (c)
"Half", (d) "Less than half" and (e) “Very few”.
The student tests and teacher surveys are administered to a randomly selected
stratified sample of primary schools across the country. The sample of schools changes
every year, but a large number appear in more than one wave and can be matched from
wave to wave using a unique school identifier. In addition, not all grades were surveyed
every year. Specifically, the student tests were administered to third-graders in 1995
through 1999, to sixth-graders in 1996 and 1997 and then again in 1999 and 2000, and to
seventh-graders in 1994 through 1997 and then again in 1999.4 Teachers’ questionnaires
were administered in 1995, 1996, 1997 and 1999. Table A1 in the appendix summarizes
the year and grades with available data at both the teacher and student levels. Table A2
presents the definitions and sources of the variables used in the empirical analysis that
follows.
4.2 Measuring Treatment Exposure
We now describe how we measure exposure to the construction program using
information on the number of rooms constructed by year and municipality from the
Secretary of Infrastructure of the Argentine National Education Ministry. As in section 3,
we define the stock of new preschool places available in year t as those constructed since
the beginning of program in 1993 in municipality j through year t-1. This gives us the
number of new places available to a child in year t because rooms constructed in t-1 only
become available in year t.
4 Individual and school level test score information after 2000 are not yet publicly available.

11
In order to compute the exposure to treatment of each child we need to know how the
new rooms were allocated between ages 3, 4 and 5 in each municipality and each year.
Since we do not have this information, we assume that the stock of constructed rooms is
allocated based on the pre-treatment distribution of places in the 1991 Decennial Census
of Population. Implicitly, this assumes that when a new place is constructed, there is a 50
percent chance that it will go to a 5 year old, a 36 percent chance that it will go to a 4 year
old and a 14 percent chance that it will go to a 3 year old.
Formally, denote cohort by the year students entered first-grade. Then, the stock of
new places available per child in cohort c is:
Stockcpj = (0.5 Stock5cpj + 0.36 Stock4cpj + 0.14 Stock3cpj)/Cohort Sizecpj
where Stock5cpj is the cumulative flow of new preschool places available in municipality j
(in province p) at the time the cohort c was 5 years old; and Stock4cpj and Stock3cpj are the
cumulative flows of new places available at the time cohort c was 4 and 3 years old
respectively. Again, the stock of new places is measured as the stock of rooms multiplied
by 50 to reflect that a room accommodates 25 children on average and is used for two
shifts per day. Finally, we normalize Stock of Placescpj dividing it by the size of the
respective cohort c in municipality j using data from the 1991 Decennial Census of
Population. Thus, Stockcpj measures the exposure to treatment for child i in cohort c being
administered third-grade tests in year t and residing in municipality j (in province p).
In order to test the robustness of this stock measure to the assumption that it was
distributed across the ages based on the distribution observed in the 1991 Census, we
created an alternative measure that assumes all new spaces were allocated to children age

12
5 (i.e., Stock of Placescpj = Stock5cpj). However, this measure overstates the availability of
new places for five year olds and should therefore attenuate the estimated impacts.
Recall that the pre-primary school construction program began in 1993. Since the new
places are usable starting the year after construction, the program could only have
affected the pre-primary enrollment of individuals that enter the third grade starting in
1997. Specifically, third graders in 1997 could have had at most one year of exposure to
the construction program (i.e., they could have attended kindergarten in 1994), third
graders in 1998 could had two years of exposure, and third graders in 1999 could have
had 3 years of exposure.5
Finally, the way in which we define Stock implicitly assumes that the effects of
attending pre-primary are homogenous across ages. We are unable to disentangle separate
effects of attending pre-primary by age because we only have one cohort with one year,
two years and three years of exposure, and because the correlation among the Stockh (h =3,
4 and 5) variables is extremely high.
4.3 Empirical Strategy
We would, in principle, like to compare test scores of students who were offered a
pre-primary school place to the counterfactual—i.e. test scores for the same students if
they were not offered a place. Since the counterfactual is never observed and we do not
have a controlled randomized experiment, we turn to non-experimental methods.
Specifically, we exploit the variation introduced by the program’s expansion over time
that generated differences in exposure by cohort and municipality.
5 Of course, the relation between year in which an individual is in the third grade and his or her primary school entry cohort depends on whether the individual had repeated grades. In fact, we observe in every

13
We estimate the following model
icpjsttpcpjcpjStockicpjstTS ελγµβα +++++= (2)
where:
• TSicpjst is the test score of student i in cohort c residing in province p and
municipality j attending school s and taking the exam in year t.
• Stockcpj is the number newly constructed places per child in cohort c living in
municipality j in province p.
• µj is a municipality fixed-effect. These fixed effects control for location
characteristics that are constant over time. In particular, they control for the fact
that the program allocation was systematically related to pre-treatment municipal
preschool attendance and poverty. We also estimate a less parsimonious
specification that conditions on school fixed-effects instead of municipality fixed
effects, which controls in addition for school characteristics that are fixed over
time.
• γcp is a full set of interactions between cohort and province dummies, which
control for unobserved differences across cohorts by province.
• λtp is a full set of province and year fixed effects, which control for time-varying
effects at the province level. These province-year effects control for factors such
as the differences in changes of provincial school policies and economic
conditions, and for the difficulty of tests across years.
• εicpjst is a student specific error term.
year individuals that repeated grades. We keep these individuals in our sample and assign them the Stock variable that corresponds to their respective primary school entry cohorts.

14
In the model above, the parameter β is the ITT effect of constructing an extra place per
child aged 3-5 on third-year test scores. Since we cannot reject the null hypothesis that
the take-up rate is one, the ITT estimate is also an estimate of the TOT effect, i.e., the
effect of attending one year of pre-primary school on subsequent test scores.
4.4 Test Score Results
We begin by examining the impact of the expansion of pre-primary spaces on the test
scores of third graders. Table 4 reports the mean test scores for third grade (panel A) and
for sixth and seventh grade (panel B) public-urban school students. The third grade
students comprise the untreated cohorts of 1992, 1993 and 1994 and the potentially
treated cohorts of 1995, 1996 and 1997. Third graders had a mean of 61 on Mathematics
and 63 on Spanish. Girls performed slightly better than boys in Spanish, but not in
Mathematics.
In Table 5, we report the estimated impact of the program on Mathematics and
Spanish test-scores. We report four different specifications for each test. In the first and
fifth columns, our preferred specifications, we condition on municipality fixed effects,
cohort effects, year effects and interactions between province and year and province and
cohort.6 We find that an increase of one preschool place per child increases Mathematics
test scores by 4.69 points and Spanish test scores by 4.76 points. As we cannot reject the
null hypothesis that the take-up rate of the newly constructed places is perfect, these
estimates imply that one year of preschool increases performance by 8 percent of the
mean or by 23 percent of the standard deviation of the distribution of test scores.
6 Plain differences-in-differences estimates which do not control for Province-Year interactions and Province -Cohort interactions give statistically similar results to those presented in Table 5.

15
In the second and sixth columns of Table 5, we add interactions between pre-
treatment (1991) preschool enrollment at the municipality level and cohort dummies to
the previous model. The idea is to allow for idiosyncratic trends in municipality
enrollment levels in pre-primary education. Municipalities start with different enrollment
rates and therefore school performance may naturally grow at different rates, which could
be systematically correlated with the construction program. However, the data reject this
hypothesis as the point estimates do not significantly change, and we cannot reject the
null hypothesis that the estimate in Columns (2) and (6) are the same as those in Columns
(1) and (5), respectively.
In the third and sixth columns we condition on school fixed effects instead of
municipality fixed effects. The estimates increase in size as a consequence of this but
again we cannot reject the null hypothesis that the estimate in Columns (3) and (7) are
statistically the same from those in Columns (1) and (5), respectively.
Finally, we test the assumption used to construct the variable Stock – i.e. that half of
the construction is allocated to age 5 children, 36 percent to age 4 children and the rest to
children age 3. First, we note that the results are robust to weighting the new construction
by the 1991 provincial or municipality distribution of preschool places rather than the
national shares. Second, Columns (4) and (8) of Table 5 report the estimated impact
assuming that all the construction was allocated to age 5 children (Stock5). The estimated
coefficients of these regressions are about 45-30 percent of those in Columns (1) and (5)
but still are statistically significant at conventional levels. Stock5 over-estimates the
exposure to the program of each potentially treated cohort, implying that the estimated
coefficients associated with Stock5 should be lower than Stock. In fact, a back of the

16
envelope calculation suggest that this is the case since Stock5 is estimated to be
approximately 1.38 times Stock.7
4.5 Gender and Poverty Differences
In this section, we analyze whether the gains from the program differ by gender and
socio-economic status. In Columns (1) and (3) of Table 6, we interact Stock with a gender
variable that indicates whether the child is female. Although the interactions are always
positive, the null hypothesis that these interactions are different from zero cannot be
rejected. This suggests that the gains from the program and preschool education are
similar for boys and girls.
In order to evaluate whether the gains from preschool vary by socio-economic status,
we interact the treatment variable with the percentage of household living in poverty in a
given municipality in 2001 minus the country median—18.1 percent. In Columns (2) and
(4) of Table 6, we report the effect of the coefficient on Stock and the interaction term.
The coefficient on Stock is the gain for a municipality with the median level of poverty.
The impact at the median level of poverty is positive. Moreover, the gains from preschool
education are bigger for the students living in more disadvantaged municipalities. For
example, for municipalities where 26.2 percent of the households live in poverty, which
corresponds to the 75 percentile of the poverty distribution, the impact of moving stock
from 0 to 1 is 3.2 points higher in Spanish and 1.6 points higher in mathematics.
7 This is obtained by noting that for the cohort of 1995, Stock5 is approximately 100% higher than Stock, for the cohort of 1996 it is 16% higher while for the cohort of 1997 they are approximately equal. Thus, assigning an equal weight to each cohort we estimate that Stock5 is approximately 38% higher than Stock.

17
4.6 Behavioral Results
Now we report the effect of the preschool expansion on teachers’ answers to
questions about classroom behavior from the teachers’ questionnaires. The specific
dependent variables in these analyses are indicators of:
• Half or more of my students pay a lot of attention in class.
• Half or more of my students put a large amount of effort into understanding
my explanations.
• Half or more of my students are well disciplined in the classroom.
• Half or more of my students regularly participate in class.
We present summary statistics for these questions and their answers in Table 7.
We investigate the effect of the program on these indicators of children behavior in
the third grade by estimating the following model:
ktpjstptpjStockktpjsTE j εγµβα ++++= (3)
where TEkpjsc is the teacher evaluation of third grade students in class k, in school s, in
municipality j, in province p, in year t. The other variables in the regression are defined
the same as in equation (2). Since the teachers’ measures are reported at the class level
we cannot include separate year-cohort effects8 as in equation (2).
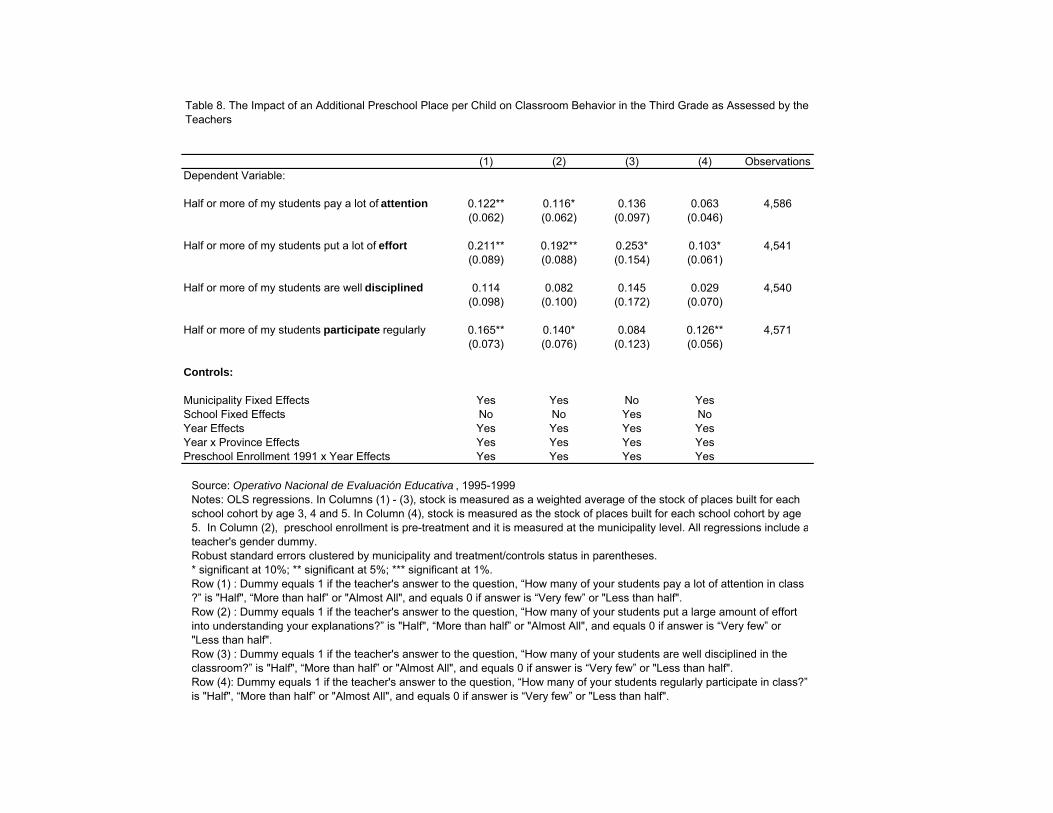
We report the results of these regressions in Table 8, where the rows reflect the
different dependent variables and columns the different specifications. In the first column,
we condition on Municipality fixed effects, year effects and year by province effects. In
8 We assign the Stock variable according to the theoretical school cohort. Thus, for those in the third grade in 1999 we assign the Stock of the 1997 primary school cohort and for those in the third grade in 1997 the Stock of the 1995 primary school cohort. Stock is zero for those in the third grade in 1996 and 1995 as they were not exposed to construction.

18
the second column, we add an interaction between preschool enrollment in 1991 and year
effects. In the third column, we condition on school fixed effects instead of municipality
fixed effects. Finally, in the fourth column, we measure stock as the stock of places built
for each school cohort by age 5.
Overall we find large positive effects of pre-primary education on third graders
attention, effort, discipline, and class participation. In Column (1), our preferred
specification, we find that the probability that half or more of the student will pay
attention increases by 12 percentage points if we increase Stock from 0 to 1. In other
words, if all students in a class are induced to attend a year of pre-primary school, the
likelihood that at least half of them participate in class increases by 12 percentage points.
The results in other columns and outcomes are consistent with these findings. Thus, we
conclude that attending pre-primary school improves the non-cognitive behavioral
abilities of children.
5. Robustness Tests
In this section, we turn to testing the robustness of our estimates to alternative
explanations. We have already controlled for time invariant differences between
municipalities, schools, and cohorts, and for time varying differences at the provincial
level such as school policy or changes in the economic environment. In this section we
consider two other robustness checks. The first relies on a false experiment that tests for
the presence of time varying factors at the municipality or school level that could have
affected primary school outcomes, while the second investigates whether the effects can
be explained by the migration of students from private to public schools.

19
5.1 Placebo Experiment
In order to test the causal interpretation of our results against possible omitted time-
varying municipality-level factors, we test whether the expansion of preschool places is
correlated with the performance of sixth and seventh grade students. During the period
studied (1995-1999), none of the cohorts of students in sixth and seventh grade could
have been affected by the construction program. The lack of a systematic association
between Stock and student performance for this subpopulation is consistent with the
causal interpretation of β being an estimate of the effect of the preschool expansion on
third grader performance. However, a positive association of the expansion with sixth and
seventh grader performance would suggest that the estimated effects could be driven by
changes in other municipality-level factors that were correlated with the expansion.
To implement this placebo test we re-estimate models (2) and (3) using the sixth and
seventh grade performance outcomes. We add four years to the primary school cohorts of
seventh graders and three years to the primary school cohorts of sixth graders to create a
false cohort. We assign the Stock variable to these students based on these false cohorts.
Table 9 presents the results. In the first two columns we present the results for
Mathematics and Spanish that correspond to the benchmark specification in equation (2)
for third graders (i.e., Columns (1) and (4) of Table 5). In Columns (3) to (6) of Table 9,
we present the results for Classroom Behavior that correspond to equation (3) for third
graders (i.e., Rows (1)-(4) of Column (1) of Table 8).

20
We find very small point estimates, which are not statistically different than zero, for
both Mathematics and Spanish.9 Similarly we cannot reject the null that the effects on the
behavioral measures are statistically significantly different than zero. These results
suggest that underlying municipality or school trends in test scores and classroom
behavior that are systematically correlated with the program are not driving our findings.
5.2 Selective Migration
Finally, another important threat to the validity of our estimates is potential migration
of students from the private to the public school system associated with the public
preschool expansion program. One possible explanation for our finding is that the
preschool expansion improved public primary school performance because the program
made some students to switch from the private school system to the public school system.
In this case, the increase in test scores may be an artifact of the change in the relative
composition of students as opposed to the impact of pre-primary education.
To test this hypothesis, we examine whether the public preschool expansion affected
the distribution of students enrolled between public and private primary schools within a
market –i.e. the municipality. If there are no changes in relative enrollment rates then it is
highly unlikely that selective migration could bias our estimates.
We estimate the following regression model:
cpjttpcpcpjStockcpjsthoolPrimary Sc Public in Studentsof Share j υλγµδα +++++= (4)
where Share of Students in Public Primary Schoolcpjst is the share of students in each
cohort who are in a public primary school in municipality j in province p in year t; and
9Because there is no test-score data for the sixth and seventh grade in 1998 we have run, for robustness purposes, all the regressions for third graders without this year as well. The results do not differ

21
the stock variable is defined as before. We also condition on municipality fixed effects
and a full set of province-year and province-cohort effects.
The dependent variable is constructed using administrative data on public and private
primary school enrollment by municipality and grade. This information is available for
the period 1994 (Ministerio de Educación de la República Argentina, 1994) and 1996-
2002 (Ministerio de Educación de la República Argentina, 1996-2002). We use year and
grade to define the primary school cohort. For coherence with the student performance
analysis, we restrict our estimation to observations for the 1992-1997 primary school
cohorts.
We report our findings in Table 10. In Column (1) we look at all municipalities and in
Column (2) only at those municipalities where enrollment in private education is positive.
We do not find any relationship between the share of student in public primary school
establishments and the public preschool expansion program. Indeed, in all regression the
coefficient δ is numerically equal to zero and statistically insignificant. Accordingly, we
do not find any evidence supporting the hypothesis that the preschool expansion program
moved students from private to public schools or vice-versa.
6. Concluding Remarks
Improving the quality of education has been a major preoccupation of policy makers
throughout the world. In this paper we present evidence that shows that investing in
universal pre-primary education could be an important part of a productive strategy to
achieve this goal. Specifically, we examined the impact of a massive pre-primary
education expansion in Argentina and found that attending pre-primary school had a large
significantly from those reported in Table 5.

22
positive effect on third grade standardized Spanish and Mathematics test scores and non-
cognitive behavioral skills.
We find that one year of pre-primary school attendance increased third grade
performance by 8 percent of the mean or by 23 percent of the standard deviation of the
distribution of test scores. We also find that measures of classroom attention, effort,
discipline, and participation are positively affected by pre-primary school attendance.
This positive effect on behavioral skills provides empirical evidence on some of the
pathways by which pre-primary affected subsequent primary school test performance
(Currie, 2001). Moreover, these behavioral skills are as important as cognitive skills to
future success in life (Blau and Currie, 2004, Heckman et al., 2006).
An important question is how an increase of one year of preschool education
compares in terms of cost-effectiveness with respect to other educational interventions?
One intervention where a considerable amount of causal evidence is now available is on
the impact of reducing class-size on standardized achievement tests scores. The
consensus estimates for randomized and natural experiments (see, for example, Finn and
Achilles (1990) for the United States, Angrist and Lavy (1999) for Israel, and Urquiola
(2006) for Bolivia) is that a reduction of class size of 10 students increases tests scores by
0.10σ to 0.35σ of the individual level distribution of tests scores. The average class size
in primary school in Argentina is 25 students10 (Ministerio de Educación de la República
Argentina, 1996-2002). Therefore, reducing class size by 10 students in each grade from
the first grade to the third grade would require (without discounting) a 1.20 teacher salary
in order to obtain the consensus gain of 0.10σ-0.35σ. In our case, one teacher (i.e., one
10Although class sizes seem relatively small it has to be remembered that most public schools operate in two shifts of four hours.

23
year of pre-primary education) will cause a gain of 0.23σ. Thus, in terms of variable costs
the preschool intervention seems comparable to a reduction of class size of 10 students.
Our evidence suggests that expanding pre-primary education is an effective
instrument to improve long-term academic performance. In addition, it provides a more
benign interpretation to the maternal work literature that claims that separating children
from their mothers early in life is detrimental to cognitive development. Specifically, it is
not separating young children from their mothers that matters, but rather what the
children do during separation. Our results imply that separating children age 3-5 from
their mothers can have positive effects if they are placed in a high quality pre-primary
education setting.

24
References
Angrist, J. and V. Lavy, 1999, “Using Maimonides’ Rule to Estimate the Effect of Class Size on Scholastic Achievement”, Quarterly Journal of Economics 114, 533-575.
Baker, M., J. Gruber, K. Milligan, 2005, “Universal Childcare, Maternal Labor Supply and Family Well-Being”, NBER Working Paper # 11832, Cambridge MA.
Barnett, S., 1993, “Benefits of Compensatory Preschool Education”, Journal of Human Resources, 279-312.
Barnett, S., 1995, “Long-Term Effects of Early Childhood Programs on Cognitive and School Outcomes”, The Future of Children, 25-50.
Becker, G., 1964, Human Capital: A Theoretical and Empirical Analysis with Special Reference to Education. New York: Columbia University Press
Berlinski, S. and S. Galiani, 2004, “The Effect of a Large Expansion of Pre-Primary School Facilities on Preschool Attendance and Maternal Employment”, Institute for Fiscal Studies Working Paper # 0430, London.
Blau, D.M. and J. Currie, 2004, “Preschool, Day Care, and After School Care: Who’s Minding the Kids?” NBER Working Paper # 10670, Cambridge MA.
Bransford, J.D., 1979, Human Cognition: Learning, Understanding, and Remembering, Wadsworth.
Card, D. and A. Krueger, 1992, “Does School Quality Matter? Returns to Education and the Characteristics of Public Schools in the United States”, Journal of Political Economy, 100, 1-40.
Carneiro, P. and J. Heckman, 2003, “Human Capital Policy”, in J. Heckman and A. Krueger (eds.) Inequality in America: What role for human capital policies?, MIT Press.
Cascio, E., 2004, “Schooling Attainment and the Introduction of Kindergartens into Public Schools”, mimeo.
Currie, J., 2001, “Early Childhood Education Programs”, Journal of Economic Perspectives 15, 213-238.
Currie, J. and D. Thomas, 1995, “Does Head Start Make a Difference?”, American Economic Review, 85, 341-364.
Danziger, S. and J. Waldfogel, 2000, Securing the Future: Investing in Children from Birth to College, Russell Sage Foundation.
Duflo, E., 2001, “Schooling and Labor Market Consequences of School Construction in Indonesia: Evidence from an Unusual Policy Experiment”, American Economic Review 91, 795-813.
Finn, J., and C. Achilles, 1990, “Answers and Questions about Class Size: A Statewide Experiment”, American Educational Research Journal, 557-577.
Galiani, S., P. Gertler and E. Schargrodsky, 2005, “School Decentralization: Helping the Good Get Better but Leaving the Rest Behind”, Mimeo.
Garces, E., D. Thomas and J. Currie, 2002, “Longer-Term Effects of Head Start”, American Economic Review, 92, 999-1012.
Heckman, J., 2000, “Policies to Foster Human Capital”, Research in Economics 54, 3-56.

25
Heckman, J., J. Stixrud and S. Urzua, 2006, “The Effects of Cognitive and Non-Cognitive Skills on Labor Market Outcomes and Social Behavior”, NBER Working Paper # 12006, Cambridge MA.
Karoly, Lynn et al., 1998, Investing in our Children: What we Know and Don’t Know about the Costs and Benefits of Early Childhood Interventions, Santa Monica: RAND.
Llach, J., S. Montoya and F. Roldán, 1999, Educación para Todos, IERAL, Córdoba. Magnuson, A., C. Ruhm, and J. Waldfogel, 2005, "Does Prekindergarten Improve
School Preparation and Performance?", Economics of Education Review, forthcoming. Ministerio de Educación de la República Argentina, 1993, Resolución No 30/93 C.F.C.
y E. Ministerio de Educación de la República Argentina, 1994, Censo Educativo. Ministerio de Educación de la República Argentina, 1996-2002, Anuario Estadístico. Myers, R., 1995, “Preschool Education in Latin America: Estate of Practice”, PREAL
Working Papers No. 1. OECD, 2002, “Strengthening Early Childhood Programs: A Policy Framework”, in
Education Policy Analysis, Paris. Reynolds, A., 1998, “Extended Early Childhood Intervention and School
Achievement: Age Thirteen Findings from the Chicago Longitudinal Study” Child Development, 69, 231-246.
Rozensweig, M.R., and K.I. Wolpin, 1988, “Evaluating the Effects of Optimally Distributed Programs: Child Health and Family Planning Interventions”, American Economic Review 76, 470-482.
Ruhm, C., 2004 “Parental Employment and Child Cognitive Development”, Journal of Human Resources 39, 155-192.
Schweinhart, L. J., Montie, J., Xiang, Z., Barnett, W. S., Belfield, C. R., Nores, M. 2005, “Lifetime effects: The High/Scope Perry Preschool study through age 40”, Monographs of the High/Scope Educational Research Foundation 14.
Shonkoff, J. and D. Phillips (eds.), 2000, “From Neurons to Neighborhoods: The Science of Early Childhood Development”, National Academy Press, Washington D.C.
Shore, R., 1997, Re-thinking the Brain: New Insights into Early Development, Families and Work Institute, New York.
Sternberg, R., 1985, Beyond IQ: A Triarchic Theory of Human Intelligence, Cambridge University Press.
Tedesco, J., 1986, Educación y Sociedad en la Argentina (1880-1945), Buenos Aires: Editorial Solar.
UNESCO, 2004, Global Education Digest 2004,UNESCO Institute for Statistics, Montreal/Paris.
Urquiola, M., 2006, “Identifying Class Size Effect in Developing Countries: Evidence from Rural Bolivia”, Review of Economics and Statistics 88, 171-177.

Misiones
ChacoFormosa
Salta
CorrientesJujuy
San Juan
TucumánMendoza
Catamarca
Santiago del EsteroLa Pampa
Río Negro
Neuquén
Chubut
Entre Ríos
La Rioja
San Luis
Córdoba
Santa FeTierra del Fuego
Buenos AiresSanta CruzCiudad Autónoma de Buenos Aires
0.1
.2.3
.4P
resc
hool
Pla
ces
Con
stru
cted
per
Chi
ld (1
993-
99)
.2 .4 .6 .8Preschool Enrollment in 1991
Figure 1. Preschool Construction and Pre-treatment Preschool Enrollment

Pre-primary School Gross Total Rooms Share of TotalProvince Enrollment Rate: Ages 3-5 Constructed per Child Rooms Constructed
(1991) (1993-1999) (1993-1999)
Misiones 0.23 0.19 0.07Chaco 0.27 0.23 0.09Formosa 0.31 0.21 0.04Corrientes 0.33 0.22 0.08Salta 0.33 0.13 0.05Jujuy 0.34 0.20 0.05San Juan 0.34 0.33 0.07Tucumán 0.35 0.15 0.07Catamarca 0.36 0.19 0.02Mendoza 0.36 0.13 0.07Santiago del Estero 0.36 0.15 0.04La Pampa 0.38 0.17 0.02Río Negro 0.42 0.12 0.03Chubut 0.43 0.20 0.03Entre Ríos 0.43 0.15 0.06Neuquén 0.43 0.09 0.02La Rioja 0.44 0.28 0.03San Luis 0.46 0.18 0.02Córdoba 0.49 0.02 0.02Santa Fe 0.52 0.09 0.08Tierra del Fuego 0.59 0.09 0.01Buenos Aires 0.60 0.01 0.03Santa Cruz 0.64 0.03 0.01Ciudad Autónoma de Buenos Aires 0.80 0.05 0.03
Total 0.49 0.09 1.00
Correlation with 1991 GrossSchool Enrollment 1.00 -0.68 -0.52
Source: Minisitry of Education and Censo de Poblacion y Vivienda 1991.
Table 1: Share of Rooms Constructed and Rooms Constructed per Children in Preschool age by Province: 1993-1999

Province Enrollment Rate: Age 7(1991) (2001) (1991) (2001) (1991) (2001)
Ciudad Autónoma de Buenos Aires 0.80 0.93 89,353 85,728 0.98 0.99Buenos Aires 0.60 0.76 442,757 558,623 0.98 0.99Catamarca 0.36 0.48 7,286 11,493 0.96 0.99Córdoba 0.49 0.67 78,538 110,322 0.98 0.99Corrientes 0.33 0.48 20,314 31,584 0.95 0.97Chaco 0.27 0.40 17,857 30,137 0.89 0.96Chubut 0.43 0.60 11,339 15,534 0.98 0.99Entre Ríos 0.43 0.59 28,913 41,301 0.97 0.99Formosa 0.31 0.42 10,365 15,964 0.95 0.98Jujuy 0.34 0.50 14,023 21,882 0.97 0.99La Pampa 0.38 0.49 6,297 8,175 0.97 0.99La Rioja 0.44 0.62 7,169 12,468 0.97 0.98Mendoza 0.36 0.50 33,583 46,089 0.97 0.99Misiones 0.23 0.40 15,437 29,789 0.93 0.95Neuquén 0.43 0.62 13,165 18,527 0.98 0.99Río Negro 0.42 0.63 15,736 21,421 0.97 0.99Salta 0.33 0.46 23,442 36,849 0.96 0.98San Juan 0.34 0.50 12,025 19,577 0.97 0.98San Luis 0.46 0.60 8,763 14,503 0.96 0.98Santa Cruz 0.64 0.73 7,603 9,406 0.99 1.00Santa Fe 0.52 0.72 86,246 112,520 0.98 0.99Santiago del Estero 0.36 0.50 18,775 30,018 0.94 0.97Tucumán 0.35 0.49 27,849 43,655 0.97 0.98Tierra del Fuego 0.59 0.83 3,477 5,590 0.99 1.00
Total 0.49 0.64 1,000,310 1,331,155 0.97 0.98
Primary School GrossPre-primary School Gross Pre-primary SchoolEnrollment Rate: Age 3- 5 Enrollment Level: Age 3- 5
Source: Censo de Poblacion y Vivienda , 1991 and 2001.
Table 2: Pre-primary and Primary School Enrollment in Argentina: 1991 and 2001
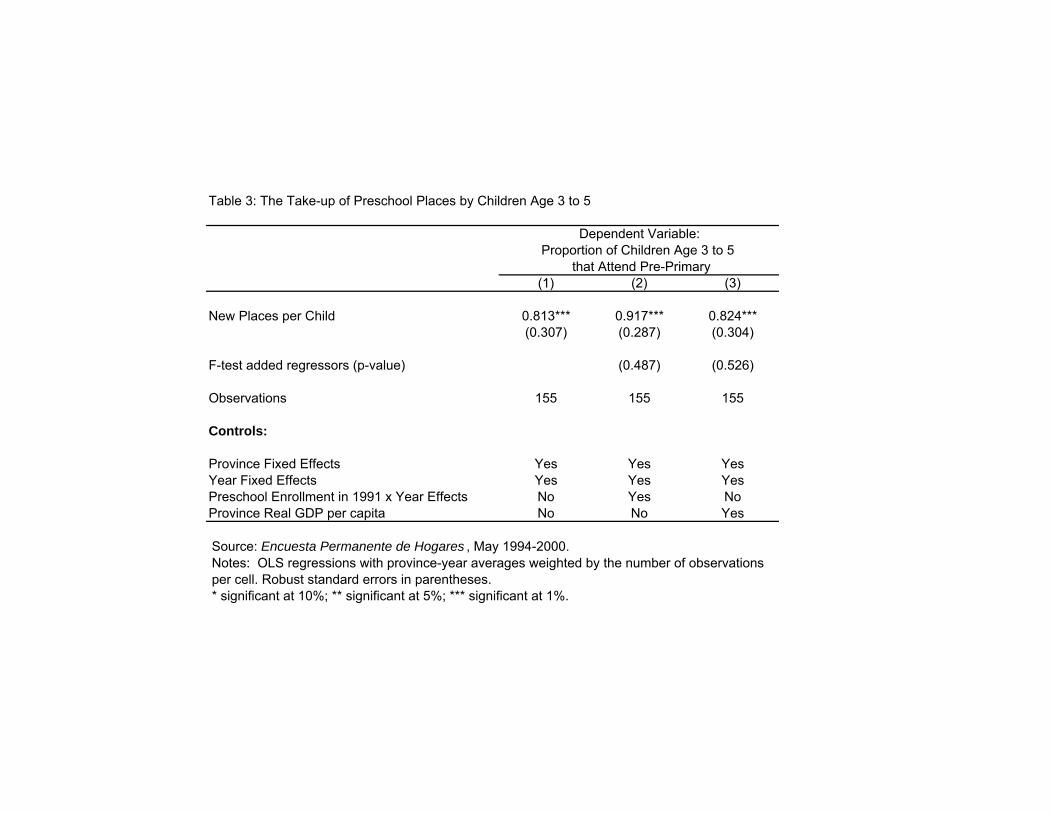
Table 3: The Take-up of Preschool Places by Children Age 3 to 5
(1) (2) (3)
New Places per Child 0.813*** 0.917*** 0.824***(0.307) (0.287) (0.304)
F-test added regressors (p-value) (0.487) (0.526)
Observations 155 155 155
Controls:
Province Fixed Effects Yes Yes YesYear Fixed Effects Yes Yes YesPreschool Enrollment in 1991 x Year Effects No Yes NoProvince Real GDP per capita No No Yes
Dependent Variable:Proportion of Children Age 3 to 5
that Attend Pre-Primary
Source: Encuesta Permanente de Hogares , May 1994-2000.Notes: OLS regressions with province-year averages weighted by the number of observations per cell. Robust standard errors in parentheses.* significant at 10%; ** significant at 5%; *** significant at 1%.

Table 4. Summary Statistics for Test Scores
Mathematics Spanish Mathematics Spanish Mathematics Spanish
Panel A: Third Grade Students
Test Score Mean 61.14 62.79 61.02 64.43 61.25 61.18Test Score Standard Deviation 19.70 20.41 19.80 20.31 19.59 20.38Number of Observations 126,106 117,515 62,628 58,408 63,478 59,107Number of Schools 3,035 3,024 3,023 3,005 3,027 3,015Number of Municipalities 417 417 417 417 417 417
Panel B: Sixth and Seventh Grade Students
Test Score Mean 53.18 55.86 52.87 58.24 53.5 53.41Test Score Standard Deviation 20.45 19.84 20.42 19.62 20.47 19.76Number of Observations 145,292 139,573 73,369 70,678 71,923 68,895Number of Schools 2,750 2,755 2,741 2,741 2,744 2,747Number of Municipalities 407 407 407 407 407 407
All Girls Boys
Source: Operativo Nacional de Evaluación Educativa , 1995-1999.

(1) (2) (3) (4) (5) (6) (7) (8)
Stock 4.694** 4.744** 6.527*** 3.207*** 4.761** 4.420** 5.983*** 2.721**(1.934) (2.091) (2.024) (1.193) (2.075) (2.155) (2.247) (1.216)
Gain in means (µ) 0.08µ 0.08µ 0.11µ 0.05µ 0.08µ 0.07µ 0.10µ 0.04µGain in standard deviations (σ) 0.24σ 0.24σ 0.33σ 0.16σ 0.23σ 0.21σ 0.29σ 0.13σ
Observations 126,106 126,106 126,106 126,106 117,515 117,515 117,515 117,515
Controls:
Municipality Fixed Effects Yes Yes No Yes Yes Yes No YesSchool Fixed Effects No No Yes No No No Yes NoCohort Effects Yes Yes Yes Yes Yes Yes Yes YesYear Effects Yes Yes Yes Yes Yes Yes Yes YesCohort x Province Effects Yes Yes Yes Yes Yes Yes Yes YesYear x Province Effects Yes Yes Yes Yes Yes Yes Yes YesPreschool Enrollment in 1991 x Cohort Effects No Yes No No No Yes No No
Mathematics Test Score Spanish Test Score
Dependent Variable:
Source: Operativo Nacional de Evaluación Educativa , 1995-1999.Notes: OLS regressions. In Columns (1) - (3) and (5) - (7), stock is measured as a weighted average of the stock of places built for each school cohort by age 3, 4 and 5. In Columns (4) and (8), stock is measured as the stock of places built for each school cohort by age 5. All regressions include a gender dummy. In Columns (2) and (6), preschool enrollment is pre-treatment and it is measured at the municipality level.Robust standard errors clustered by municipality and treatment/controls status in parentheses.* significant at 10%; ** significant at 5%; *** significant at 1%.
Table 5. The Impact of an Additional Preschool Place per Child on Standarized Achievement Test-Scores in the Third Grade

(1) (2) (3) (4)
Stock 4.242** 3.755* 4.014* 2.936(2.004) (2.169) (2.140) (2.227)
Stock x Girl 0.886 1.463(0.862) (0.907)
Stock x [% of poor househoulds in the municipality in 2001 - 18.1% (Median)] 0.201 0.388**(0.153) (0.159)
Observations 126,106 126,106 117,515 117,515
Controls:
Municipality Fixed Effects Yes Yes Yes YesCohort Effects Yes Yes Yes YesYear Effects Yes Yes Yes YesYear x Province Effects Yes Yes Yes YesCohort x Province Effects Yes Yes Yes Yes
Mathematics Test Score Spanish Test Score
Dependent Variable:
Source: Operativo Nacional de Evaluación Educativa, 1995-1999.Notes: OLS regressions. Stock is measured as a weighted average of the stock of places built for each school cohort by age 3, 4 and 5. All regressions include a gender dummy. The median percentage of households per municipality living in poverty in 2001 was 18.1%, at the 25 quantile of the municipality poverty distribution 10.8% of households were poor, and at the 75 quantile 26.3% of households were poor.Robust standard errors clustered by municipality and treatment/controls status in parentheses. * significant at 10%; **significant at 5%; *** significant at 1%.
Table 6. The impact of an Additional Preschool Place per child on Standarized Achievement Test-Scores in the Third Grade. Differences by Gender and Poverty Level
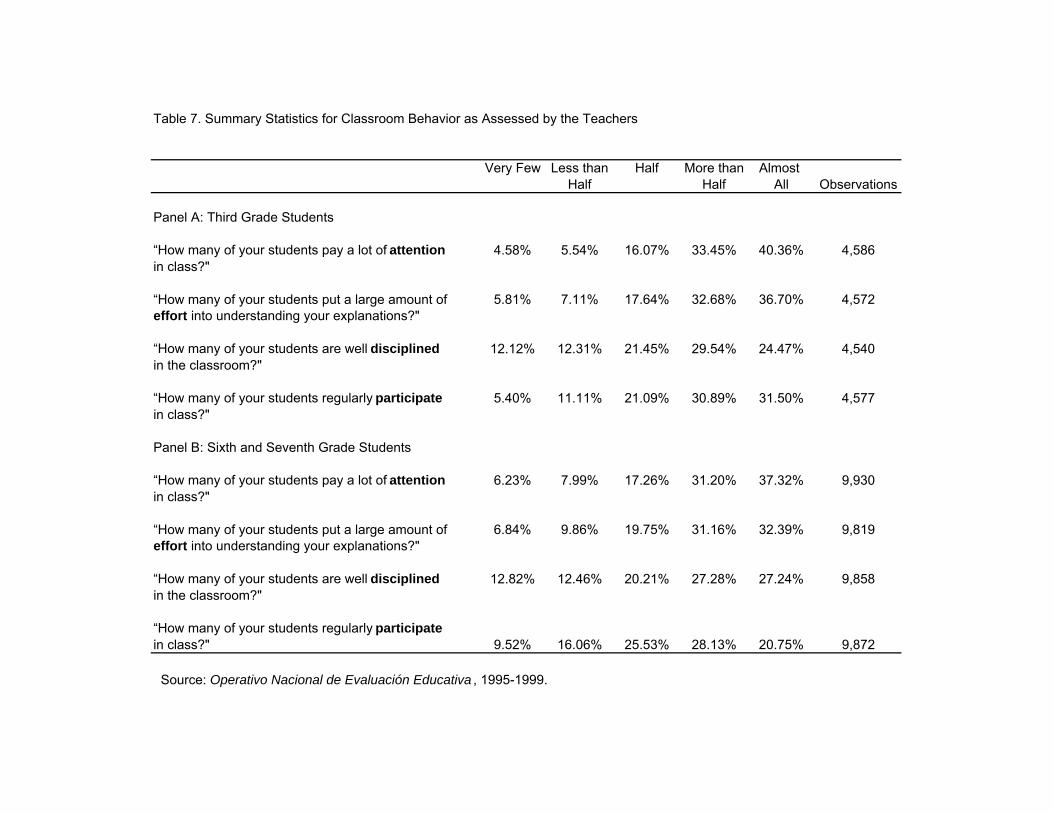
Table 7. Summary Statistics for Classroom Behavior as Assessed by the Teachers
Very Few Less than Half More than Almost Half Half All Observations
Panel A: Third Grade Students
“How many of your students pay a lot of attention 4.58% 5.54% 16.07% 33.45% 40.36% 4,586in class?"
“How many of your students put a large amount of 5.81% 7.11% 17.64% 32.68% 36.70% 4,572effort into understanding your explanations?"
“How many of your students are well disciplined 12.12% 12.31% 21.45% 29.54% 24.47% 4,540in the classroom?"
“How many of your students regularly participate 5.40% 11.11% 21.09% 30.89% 31.50% 4,577in class?"
Panel B: Sixth and Seventh Grade Students
“How many of your students pay a lot of attention 6.23% 7.99% 17.26% 31.20% 37.32% 9,930in class?"
“How many of your students put a large amount of 6.84% 9.86% 19.75% 31.16% 32.39% 9,819effort into understanding your explanations?"
“How many of your students are well disciplined 12.82% 12.46% 20.21% 27.28% 27.24% 9,858in the classroom?"
“How many of your students regularly participate in class?" 9.52% 16.06% 25.53% 28.13% 20.75% 9,872
Source: Operativo Nacional de Evaluación Educativa , 1995-1999.
(1) (2) (3) (4) ObservationsDependent Variable:
Half or more of my students pay a lot of attention 0.122** 0.116* 0.136 0.063 4,586(0.062) (0.062) (0.097) (0.046)
Half or more of my students put a lot of effort 0.211** 0.192** 0.253* 0.103* 4,541(0.089) (0.088) (0.154) (0.061)
Half or more of my students are well disciplined 0.114 0.082 0.145 0.029 4,540(0.098) (0.100) (0.172) (0.070)
Half or more of my students participate regularly 0.165** 0.140* 0.084 0.126** 4,571(0.073) (0.076) (0.123) (0.056)
Controls:
Municipality Fixed Effects Yes Yes No YesSchool Fixed Effects No No Yes NoYear Effects Yes Yes Yes YesYear x Province Effects Yes Yes Yes YesPreschool Enrollment 1991 x Year Effects Yes Yes Yes Yes
Source: Operativo Nacional de Evaluación Educativa , 1995-1999Notes: OLS regressions. In Columns (1) - (3), stock is measured as a weighted average of the stock of places built for each school cohort by age 3, 4 and 5. In Column (4), stock is measured as the stock of places built for each school cohort by age 5. In Column (2), preschool enrollment is pre-treatment and it is measured at the municipality level. All regressions include ateacher's gender dummy.Robust standard errors clustered by municipality and treatment/controls status in parentheses.* significant at 10%; ** significant at 5%; *** significant at 1%. Row (1) : Dummy equals 1 if the teacher's answer to the question, “How many of your students pay a lot of attention in class ?” is "Half", “More than half” or "Almost All", and equals 0 if answer is “Very few” or "Less than half".Row (2) : Dummy equals 1 if the teacher's answer to the question, “How many of your students put a large amount of effort into understanding your explanations?” is "Half", “More than half” or "Almost All", and equals 0 if answer is “Very few” or "Less than half".Row (3) : Dummy equals 1 if the teacher's answer to the question, “How many of your students are well disciplined in the classroom?” is "Half", “More than half” or "Almost All", and equals 0 if answer is “Very few” or "Less than half".Row (4): Dummy equals 1 if the teacher's answer to the question, “How many of your students regularly participate in class?” is "Half", “More than half” or "Almost All", and equals 0 if answer is “Very few” or "Less than half".
Table 8. The Impact of an Additional Preschool Place per Child on Classroom Behavior in the Third Grade as Assessed by the Teachers

Mathematics Spanish Pay al Lot of Put a Lot of Are Well ParticipateTest Score Test Score Attention Effort Disciplined Regularly
(1) (2) (3) (4) (5) (6)
Stock 0.581 0.669 -0.067 -0.068 -0.039 0.002(1.868) (1.795) (0.056) (0.058) (0.072) (0.077)
Observations 140,914 135,436 9,930 9,819 9,858 9,872
Controls:
Municipality Fixed Effects Yes Yes Yes Yes Yes YesYear Effects Yes Yes Yes Yes Yes YesYear x Province Effects Yes Yes Yes Yes Yes YesCohort Effects Yes Yes No No No NoCohort x Province Effects Yes Yes No No No No
Dependent Variables:
Source: Operativo Nacional de Evaluación Educativa , 1995-1999.Notes: OLS regressions. Stock is measured as a weighted average of the stock of places built for each school cohort by age 3, 4 and 5. All regression include a 7th grade dummy. In Columns (1) and (2), we include a student gender dummy. In Columns (3)-(6), we include a teacher's gender dummy. Robust standard errors clustered by municipality and treatment/controls status in parentheses.* significant at 10%; ** significant at 5%; *** significant at 1%. Columns (1) and (2): Standardized Mathematics and Spanish test scores for 6th and 7th grade students.Column (3) : Dummy equals 1 if the teacher's answer to the question, “How many of your students pay a lot of attention in class ?” is "Half", “More than half” or "Almost All", and equals 0 if answer is “Very few” or "Less than half".Column (4) : Dummy equals 1 if the teacher's answer to the question, ““How many of your students put a large amount ofeffort into understanding your explanations?” is "Half", “More than half” or "Almost All", and equals 0 if answer is “Very few” or "Less than half".Column (5): Dummy equals 1 if the teacher's answer to the question, “How many of your students are well disciplined in the classroom?” is "Half", “More than half” or "Almost All", and equals 0 if answer is “Very few” or "Less than half".Column (6): Dummy equals 1 if the teacher's answer to the question,“How many of your students regularly participate in class?” is "Half", “More than half” or "Almost All", and equals 0 if answer is “Very few” or "Less than half".
Table 9. Placebo Experiment: The Impact of an Additional Preschool Place per Child on Standarized Achievement Test-Scores and Classroom Behavior in the Sixth-Seventh Grade

(1) (2)
Stock -0.0021255 0.000209(0.001736) (0.006459)
Observations 14,592 9,582
Controls:
Municipality Fixed Effects Yes YesCohort Effects Yes YesYear Effects Yes YesCohort x Province Effects Yes YesYear x Province Effects Yes Yes
in Public Primary Schools
Dependent Variable:Share of Students
Source: Ministry of Education , 1994, 1995-2002.Notes: OLS regressions. Stock is measured as a weighted average of the stock of places built for each school cohort by age 3, 4 and 5. In Column (1), we include all urban Municipalities. In Column (2), we only include those Municipalities with some students in private education. Robust standard errors clustered by municipality and treatment/controls status in parentheses. * significant at 10%; ** significant at 5%; *** significant at 1%.
Table 10. The impact of an Additional Preschool Place per child on The Share of Students in Public Primary Schools per Municipality
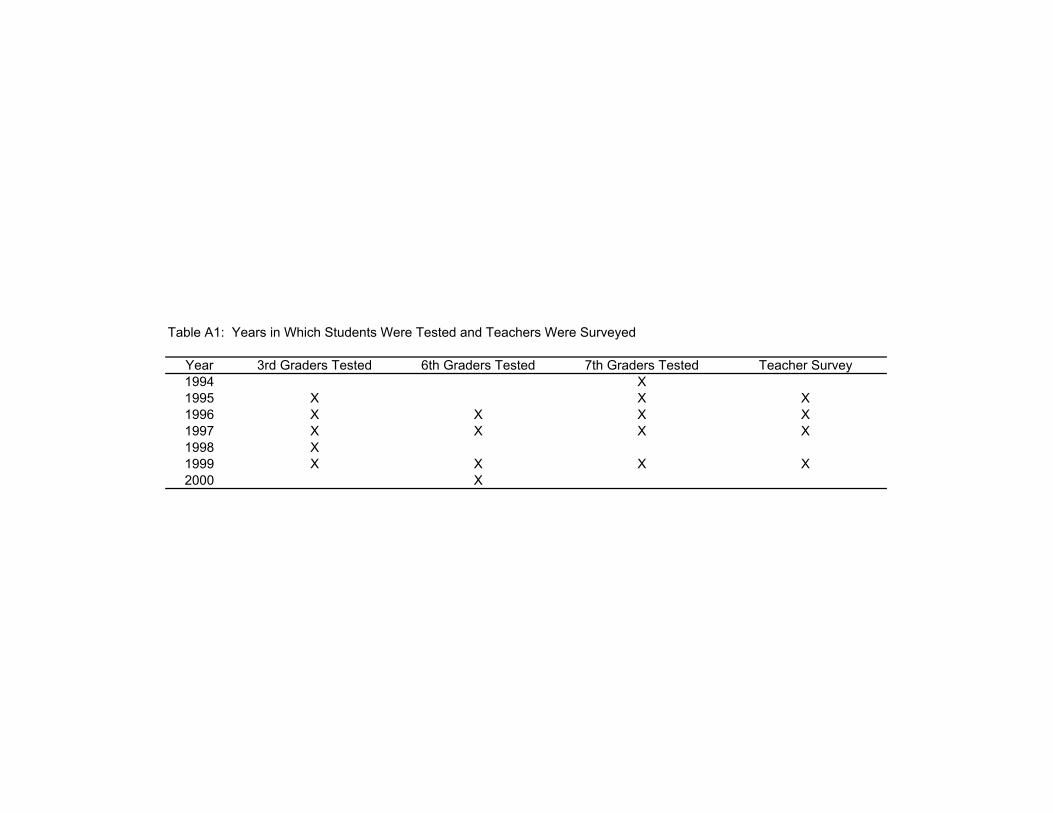
Table A1: Years in Which Students Were Tested and Teachers Were Surveyed
Year 3rd Graders Tested 6th Graders Tested 7th Graders Tested Teacher Survey1994 X1995 X X X1996 X X X X1997 X X X X1998 X 1999 X X X X2000 X
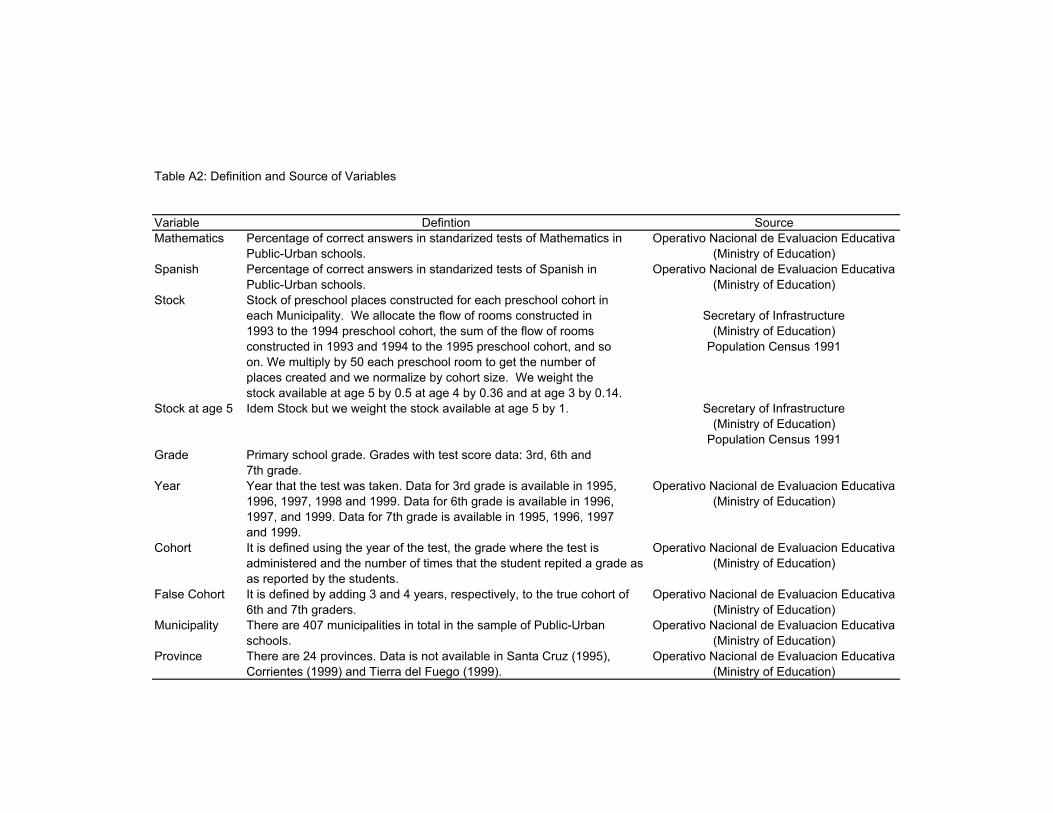
Table A2: Definition and Source of Variables
Variable Defintion SourceMathematics Percentage of correct answers in standarized tests of Mathematics in Operativo Nacional de Evaluacion Educativa
Public-Urban schools. (Ministry of Education)Spanish Percentage of correct answers in standarized tests of Spanish in Operativo Nacional de Evaluacion Educativa
Public-Urban schools. (Ministry of Education)Stock Stock of preschool places constructed for each preschool cohort in
each Municipality. We allocate the flow of rooms constructed in Secretary of Infrastructure1993 to the 1994 preschool cohort, the sum of the flow of rooms (Ministry of Education)constructed in 1993 and 1994 to the 1995 preschool cohort, and so Population Census 1991on. We multiply by 50 each preschool room to get the number ofplaces created and we normalize by cohort size. We weight thestock available at age 5 by 0.5 at age 4 by 0.36 and at age 3 by 0.14.
Stock at age 5 Idem Stock but we weight the stock available at age 5 by 1. Secretary of Infrastructure(Ministry of Education)
Population Census 1991Grade Primary school grade. Grades with test score data: 3rd, 6th and
7th grade.Year Year that the test was taken. Data for 3rd grade is available in 1995, Operativo Nacional de Evaluacion Educativa
1996, 1997, 1998 and 1999. Data for 6th grade is available in 1996, (Ministry of Education)1997, and 1999. Data for 7th grade is available in 1995, 1996, 1997and 1999.
Cohort It is defined using the year of the test, the grade where the test is Operativo Nacional de Evaluacion Educativaadministered and the number of times that the student repited a grade as (Ministry of Education)as reported by the students.
False Cohort It is defined by adding 3 and 4 years, respectively, to the true cohort of Operativo Nacional de Evaluacion Educativa6th and 7th graders. (Ministry of Education)
Municipality There are 407 municipalities in total in the sample of Public-Urban Operativo Nacional de Evaluacion Educativaschools. (Ministry of Education)
Province There are 24 provinces. Data is not available in Santa Cruz (1995), Operativo Nacional de Evaluacion EducativaCorrientes (1999) and Tierra del Fuego (1999). (Ministry of Education)

DAVIDSON INSTITUTE WORKING PAPER SERIES - Most Recent Papers The entire Working Paper Series may be downloaded free of charge at: www.wdi.umich.edu
CURRENT AS OF 9/8/06 Publication Authors Date No. 838: The Effect of Pre-Primary Education on Primary School Performance
Samuel Berlinski, Sebastian Galiani and Paul Gertler
July 2006
No. 837: Do Investors Value Insider Trading Laws? International Evidence
Laura Beny Aug 2006
No. 836: How corruption Hits People When They Are Down Jennifer Hunt Aug 2006
No. 835: Mirage at the Bottom of the Pyramid Aneel Karnani Aug 2006
No. 834: Ownership concentration and firm performance: Evidence from an emerging market
Irena Grosfeld June 2006
No. 833: Institutions, Networks and Entrepreneurship Development in Russia: An Exploration
Ruta Aidis and Saul Estrin June 2006
No. 832: Long & Short Run Linkages in CEE Stock Markets: Implications for Portfolio Diversification & Stock Market Integration
Manolis Syllignakis and Georgios Kouretas
July 2006
No. 831: Inequality, Fiscal Capacity and the Political Regime Lessons from the Post-Communist Transition
Christopher J. Gerry and Tomasz Mickiewicz
July 2006
No. 830: Business Groups in Emerging Markets - Financial Control and Sequential Investment
Christa Hainz June 2006
No. 829: Sophisticated Discipline in Nascent Deposit Markets: Evidence from Post-Communist Russia
Alexei Karas, William Pyle and Koen Schoors
June 2006
No. 828: Financial Deregulation and Financial Development, and Subsequent Impact on Economic Growth in the CzechRepublic, Hungary and Poland
Patricia McGrath June 2006
No. 827: The Determinants & Excessiveness of Current AccountDeficits in Eastern Europe & the Former Soviet Union
Aleksander Aristovnik June 2006
No. 826: Privatization with Government Control: Evidence from the Russian Oil Sector
Daniel Berkowitz and Yadviga Semikolenova
February 2006
No. 825: Corruption & Bureaucratic Structure in a Developing Economy John Bennett and Saul Estrin February 2006
No. 824: Regulatory Barriers & Entry in Developing Economies John Bennett and Saul Estrin March 2006
No. 823: Enterprise Restructuring in Belarus Marina Bakanova, Saul Estrin, Igor Pelipas and Sergei Pukovic
May 2006
No. 822: Reforms, Entry and Productivity: Some Evidence from the Indian Manufacturing Sector
Sumon Kumar Bhaumik, Shubhashis Gangopadhyay and Shagun Krishnan
March 2006
No. 821: Falling Walls and Lifting Curtains: Analysis of Border Effects in Transition Countries
Yener Kandogan March 2006
No. 820: Home versus Host Country Effects of FDI: Searching for New Evidence of Productivity Spillovers
Priit Vahter and Jaan Masso March 2006
No. 819: Earnings Inequality in India: Has the Rise of Caste and Religion Based Politics in India had an Impact?
Kumar S. Bhaumik and Manisha Chakrabarty
March 2006
No. 818: Financial Deregulation and Industrial Development: Subsequent Impacton Economic Growth in the Czech Republic, Hungary and Poland
Patricia McGrath February 2006
No. 817: The Politics of Institutional Renovation & Economic Upgrading: Lessons from the Argentine Wine Industry
Gerald Mc Dermott Dec 2005
No. 816: Worker Morale in Russia: An Exploratory Study Susan Linz, Linda Good & Patricia Huddleston
January 2006