The effect of tropical cyclone on the primary production ...
20
The effect of tropical cyclone on the The effect of tropical cyclone on the primary production enhancement primary production enhancement - - Some results from the W Some results from the W - - PASS PASS (Western Pacific Air (Western Pacific Air - - Sea interaction Sea interaction Study) project Study) project PICES MONITOR/BIO Workshop 5 October 27, 2007 Eko Siswanto, Joji Ishizaka, Mitsuhiro Toratani, Toru Hirawake and Sei-Ichi Saitoh
Transcript of The effect of tropical cyclone on the primary production ...

The effect of tropical cyclone on the The effect of tropical cyclone on the primary production enhancementprimary production enhancement-- Some results from the WSome results from the W--PASS PASS
(Western Pacific Air(Western Pacific Air--Sea interaction Sea interaction Study) projectStudy) project
PICES MONITOR/BIO Workshop 5October 27, 2007
Eko Siswanto, Joji Ishizaka, Mitsuhiro Toratani, Toru Hirawake and Sei-Ichi Saitoh

WW--PASS (Western Pacific AirPASS (Western Pacific Air--Sea interaction Study) projectSea interaction Study) project
Solas-Japan Chair: Mitsuo Uematsu
Linkages in Biogeochemical Cycles Between Surface Ocean and Lower Atmosphere
Background
The facts have been known:• Typhoon passage can enhance ocean phytoplankton
chlorophyll-a and primary production,• The northwest Pacific typhoon activities have been
known to be related to El Nino/La Nina events, but
Some information have not been documented yet, such as:
• How El Nino/La Nina events influence ocean primary production in the East China Sea through typhoon activity,
• Complete interannual and interdecadal variations in typhoon-enhanced ocean primary production,
• Estimation of typhoon contribution to summer-fall new production in the East China Sea.

Number of Typhoon per yearNumber of Typhoon per year
台風経路データ(気象業務支援センター)より
mean26.6

LiLife Time of Typhoonfe Time of Typhoon
(日
)
台風経路データ(気象業務支援センター)より
mean4.8 days

Spatial Pattern of Frequency Spatial Pattern of Frequency of Typhoon Passageof Typhoon Passage
(1951(1951--20052005))
Number of Typhoon
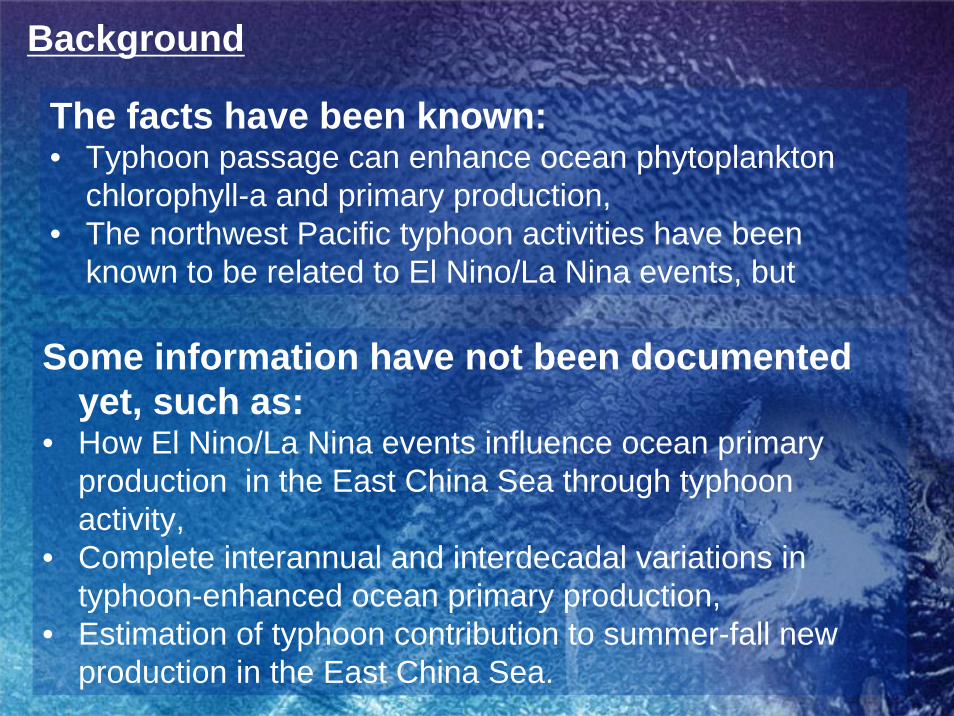
Study AreaStudy Area
East-China Sea
Western North Pacific

Interannual and Interdecadal Variations of Typhoon-Induced Primary Production:
A Case Study for The Outer Shelf of The East China Sea
Siswanto, E., J. Ishizaka, K. Yokouchi, K. Tanaka, C.K.Tan
Geophysical Research Letter, 34 (2007)

Study Area:• Area delineated with blue polygonal• The west border of the area (green contour)
is 0.37 mg m-3 chlorophyll-a (Chl-a) isoplethderived from summer mean SeaWiFS Chl-a
Satellite Data (1998 ~ 2004):• SeaWiFS Chl-a• SeawiFS photosynthetically available
radiation (PAR)• TRMM/TMI sea surface temperature (SST)
Typhoon Data:• 13 typhoons (red curves and circles) before
and after which clear SeaWiFS Chl-a data are available (from Japan Meteorological Agency)
• Typhoon variables: typhoon transit speed (TS) and maximum sustained wind (MSW)
Primary Production Model:• VGPM (Behrenfeld and Falkowski, 1997)
( ) irr0euBopt DChlZ
4.1PARPARP0.66125PP ×××⎥
⎦
⎤⎢⎣
⎡+
××=SST08.0e06.9=B
optP
Combined with specific PBopt model for the
ECS (Siswanto et al., 2006)
121 122 123 124 125 126 127 128 129 130
121 122 123 124 125 126 127 128 129 130
25
26
27
28
29
30
31
32
33
25
26
27
28
29
30
31
32
33
Lat
itude
(o N)
Longitude (oE)
200 m
100 m
100 m
Trajectories of 13 typhoons crossed the study area
Study Period:• Summer-fall period (June – October)
Materials and Methods

Pre- and post-typhoonSeaWiFS Chl-a images
Pre- and post-typhoonprimary productionimages

0
20
40
60
80
100
0 200 400 600 800 1000 1200
PP e
nhan
cem
ent (
Gg
C d
-1)
Mean BD (m)
0
20
40
60
80
100
0 2 4 6 8 10 12
Chl
-a (M
g) a
nd P
P (G
g C
d-1
) en
hanc
emen
ts
Mean TS (m s-1)
Sa00
Sa00
Td98 0
20
40
60
80
100
20 25 30 35 40 45 50
Chl
-a (M
g) a
nd P
P (G
g C
d-1
) e
nhan
cem
ents
Mean MSW (m s-1)
Sa00
Sa00
Td98
Chl-a, PP Enhancements Vs. Typhoon Variables, Bottom Depth (BD)
Intense typhoon (> 40 m/s)Weak typhoon (< 40 m/s)
PP enhancementChl-a enhancement
PP enhancement = -28.14 + 2.57 Mean MSW – 0.98 Mean TS – 0.04 Mean BD
0
20
40
60
80
100
0 20 40 60 80 100
Sate
llite
PP
enha
ncem
ent (
Gg
C d
-1)
Predicted PP enhancement (Gg C d-1)
Empirical relationship
R2 = 0.65, p < 0.001TS: Transit SpeedMSW: Maximum
Sustained WindBD: Bottom Depth
-7-6-5-4-3-2-101234567
Jan-
80M
ay-8
0Se
p-80
Jan-
81M
ay-8
1Se
p-81
Jan-
82M
ay-8
2Se
p-82
Jan-
83M
ay-8
3Se
p-83
Jan-
84M
ay-8
4Se
p-84
Jan-
85M
ay-8
5A
ug-8
5Se
p-85
Jan-
86M
ay-8
6Se
p-86
Jan-
87M
ay-8
7Se
p-87
Jan-
88M
ay-8
8Se
p-88
Jan-
89M
ay-8
9Se
p-89
Dec
-89
Apr
-90
Aug
-90
Dec
-90
Apr
-91
Aug
-91
Sep-
91Ja
n-92
May
-92
Sep-
92Ja
n-93
May
-93
Sep-
93Ja
n-94
May
-94
Aug
-94
Dec
-94
Apr
-95
Aug
-95
Dec
-95
Apr
-96
Aug
-96
Dec
-96
Apr
-97
Aug
-97
Nov
-97
Mar
-98
Jul-9
8O
ct-9
8Fe
b-99
Jun-
99Se
p-99
Dec
-99
Apr
-00
Aug
-00
Nov
-00
Mar
-01
Jul-0
1O
ct-0
1Fe
b-02
Jun-
02A
ug-0
2D
ec-0
2A
pr-0
3A
ug-0
3D
ec-0
3A
pr-0
4A
ug-0
4Se
p-04
Dec
-04
-70-60-50-40-30-20-10010203040506070
La Niña eventEl Niño eventPP enhancement deviation
Sout
hern
Osc
illat
ion
Inde
xPP enhancem
ent deviation (Gg
C d
-1)
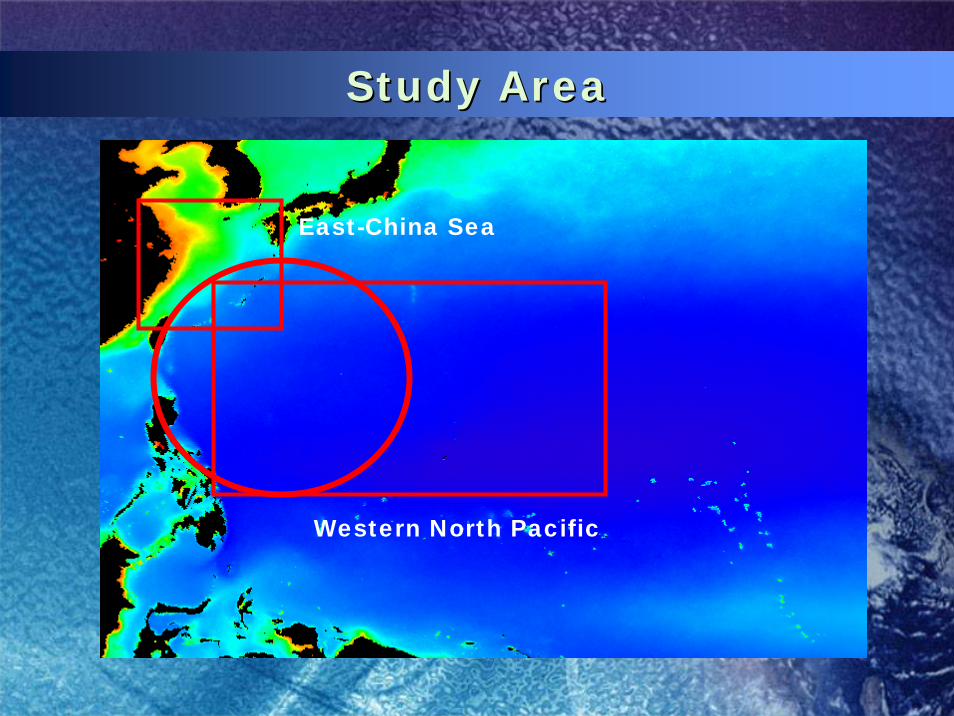
In general, PP enhancements inversely oscillated with SOI
0
10
20
30
40
50
60
70
20 25 30 35 40 45Ave
rage
PP
enha
ncem
ent (
Gg
C d
-1)
Average mean MSW (m s-1)
El NinoLa Nina
PP enhancements were higher during El Nino years associated with higher MSW
0
50
100
150
200
250
300
350
400
0 1 2 3 4 5 6 7 8 9
Tota
l PP
enha
ncem
ent (
Gg
C d
-1)
Number of typhoons
El NinoLa Nina
Total PP enhancements were not related to number of typhoons
Relation to El Nino/La Nina events
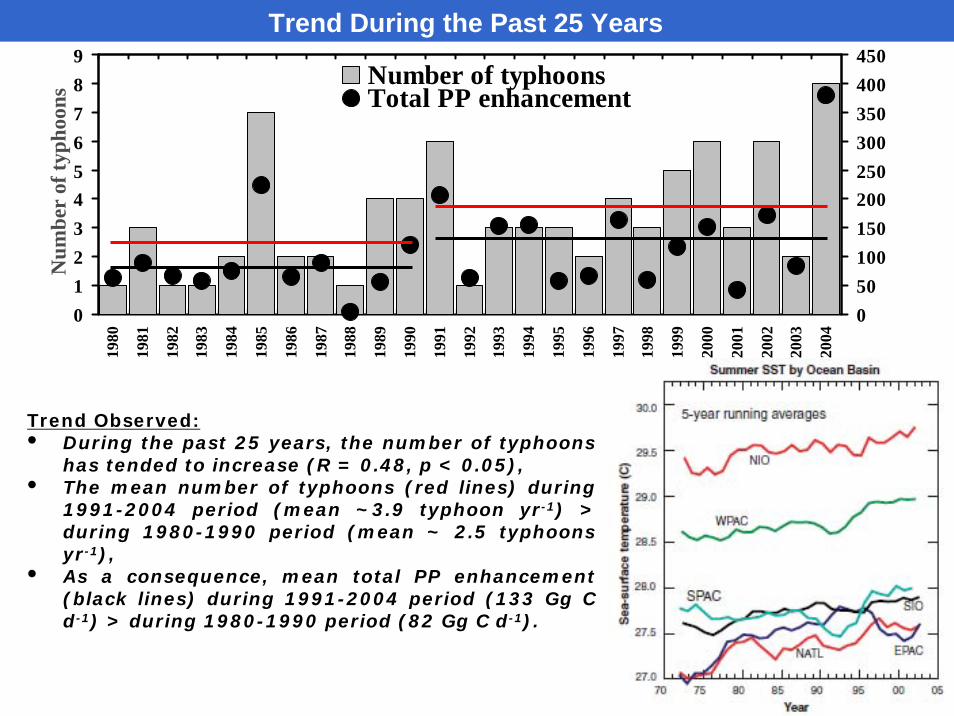
Trend During the Past 25 Years
0123456789
1980
1981
1982
1983
1984
1985
1986
1987
1988
1989
1990
1991
1992
1993
1994
1995
1996
1997
1998
1999
2000
2001
2002
2003
2004
050100150200250300350400450
Number of typhoonsTotal PP enhancement
Num
ber
of ty
phoo
ns
Year
Total PP enhancem
ent (Gg
C d
-1)
Trend Observed:• During the past 25 years, the number of typhoons
has tended to increase (R = 0.48, p < 0.05),• The mean number of typhoons (red lines) during
1991-2004 period (mean ~3.9 typhoon yr-1) > during 1980-1990 period (mean ~ 2.5 typhoons yr-1),
• As a consequence, mean total PP enhancement (black lines) during 1991-2004 period (133 Gg C d-1) > during 1980-1990 period (82 Gg C d-1).

Estimates of typhoon contribution on the summer-fall new production in the study region
Mean summer-fall primary production(1998 – 2004)
Mean summer-fall new production(1998 – 2004)
f-ratio = 0.15 (Chen et al., 2003)f-ratio = 0.1 (Eppley, 1989)
Estimates of summer-fall new production
Estimates of typhoon-induced new production
Typhoon-enhanced primary production
Pre-typhoon Post-typhoon
f-ratio = 0.6
Typhoon-induced new production
Typhoon contribution to summer-fall new production was lowest in 1988 (0.4%) and highest in 2004 (39.7%) (mean 13.7%),
Typhoon contribution to summer-fall new production was also higher during El Nino years (16.7%) than during La Nina years (7.2%).
NP/PP ratio

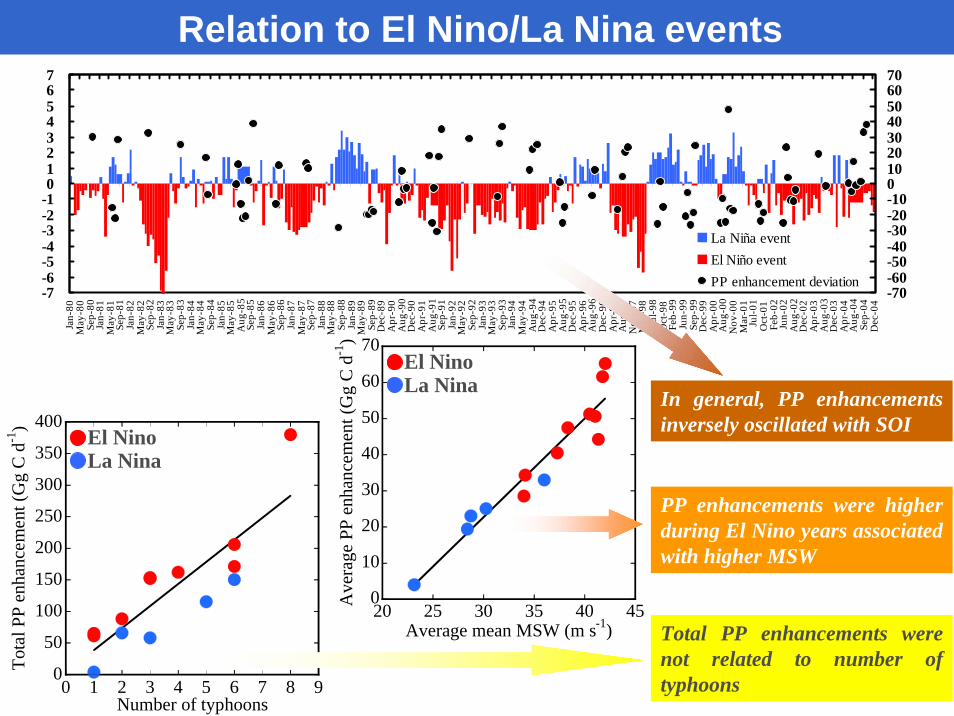
Study AreaStudy Area
East-China Sea
Western North Pacific

Number of Typhoon in 2003 = Number of Typhoon in 2003 = 2121
Trajectory of Typhoon in 2003

Typhoon No.0317 (2003)Typhoon No.0317 (2003)
デジタル台風 北本 朝展 @ 国立情報学研究所 (NII)http://agora.ex.nii.ac.jp/digital-typhoon/summary/wnp/s/200317.html.ja
2003-10-19 ~2003-10-26Minimum Pressure 940hPaMaximum Wind Speed 46.3m/sMean Speed 4.67m/s
SeaWiFS 8days Mean Chl-aOctober 24-31, 2003

Before and After Before and After ChlChl--aa iamgesiamges
October 8-15, 2003 October 24-31, 2003

Using typhoon variables and bottom depth, PP enhancements due to typhoon passage are possible to be estimated even without satellite ocean color data,In general, because typhoons tended to be more (less) intense during El Nino (La Nina) years, typhoon-enhanced PP was also higher (lower) during El Nino (La Nina) years,Typhoon-enhanced PP has also shown a tendency to be higher during 1991-2004 period than that during 1980-1990 period,Typhoon crossing the ECS might contribute within 0.4% - 39.7% of the summer-fall new production in the study region of ECS.
Summary

Thank you