THE EFFECT OF DIFFERENT EXERCISE REGIMENS ON …766681/FULLTEXT01.pdf · The effect of different...
69
From THE DEPARTMENT OF PHYSIOLOGY AND PHARMACOLOGY Karolinska Institutet, Stockholm, Sweden THE EFFECT OF DIFFERENT EXERCISE REGIMENS ON MITOCHONDRIAL BIOGENESIS AND PERFORMANCE Niklas Psilander Stockholm 2014
Transcript of THE EFFECT OF DIFFERENT EXERCISE REGIMENS ON …766681/FULLTEXT01.pdf · The effect of different...

From THE DEPARTMENT OF PHYSIOLOGY AND
PHARMACOLOGY
Karolinska Institutet, Stockholm, Sweden
THE EFFECT OF DIFFERENT EXERCISE
REGIMENS ON MITOCHONDRIAL
BIOGENESIS AND PERFORMANCE
Niklas Psilander
Stockholm 2014

All previously published papers were reproduced with permission from the publisher.
Published by Karolinska Institutet.
Printed by åtta.45 Tryckeri AB
© Niklas Psilander, 2014
ISBN 978-91-7549-774-7

The effect of different exercise regimens on
mitochondrial biogenesis and performance
THESIS FOR DOCTORAL DEGREE (Ph.D.)
By
Niklas Psilander, 19/12 -2014, GIH
Principal Supervisor:
Professor Kent Sahlin
The Swedish School of
Sport and Health Sciences
Department of Performance
and Training
Karolinska Institutet
Department of Physiology
and Pharmacology
Co-supervisor(s):
Professor Michail Tonkonogi
Högskolan Dalarna
Department of Idrotts- och
hälsovetenskap
Abram Katz
Ariel University
Department of Physiology
Division of Health Science
Opponent:
Professor Jostein Hallén
Norwegian School of Sport Sciences
Department of Physical Performance
Examination Board:
Associate Professor Thomas Gustafsson
Karolinska Institutet
Department of Laboratory Medicine
Professor emeritus Jan Henriksson
Karolinska Institutet
Department of Physiology
and Pharmacology
Professor emeritus Karin-Piehl Aulin
Sophiahemmet


ABSTRACT
Endurance training is a powerful tool to improve both health and performance. Physical
activity is now recognized as an effective treatment and prevention therapy for a wide range
of diseases. One of the most profound adaptations to endurance training is increased
mitochondrial function and content within the exercising muscles. Mitochondrial quality and
quantity are closely related to several of the positive health effects reported after training.
High mitochondrial content strongly correlates with muscle oxidative capacity and endurance
performance. Even though it is well known that endurance training increases mitochondrial
content, it is unclear which type of training is the most efficient to promote mitochondrial
biogenesis. Therefore, the basis for current exercise recommendations relative to
mitochondrial biogenesis is poor or absent. Thus, the main objective of this thesis was to
evaluate the effect of different training strategies on mitochondrial biogenesis.
Recent developments in molecular methods have made it possible to study the initial
adaptations to training through measurement of mRNA gene expression of exercise induced
genes. One such gene is transcriptional coactivator peroxisome proliferator–activated
receptor-γ coactivator-1α (PGC-1α). PGC-1α is a key regulator of mitochondrial biogenesis
and the expression of PGC-1α can therefore be used as a marker of this process.
The first four studies presented in this thesis are acute exercise studies where two different
exercise models were compared using a cross-over design. Muscle biopsies were obtained pre
and post exercise and analysed for gene expression and glycogen, apart from study II. The
final study was a long-term training study where muscle biopsies were obtained before and
after the training period and analysed for mitochondrial enzyme activities and protein content.
Study I: The expression of PGC-1α and related genes were examined after 90 min of
continuous and interval exercise in untrained subjects. The exercise protocols influenced the
expression of genes involved in mitochondrial biogenesis and oxidative metabolism in a
similar manner. Both interval and continuous exercise were potent training strategies for
relatively sedentary individuals.
Study II: The expression of PGC-1α and related genes were examined after low-volume
sprint interval (SIT) and high-volume interval (IE) exercise in highly trained cyclists. SIT
induced a similar increase in PGC-1α expression as IE despite a much lower time
commitment and work completed. Sprint interval exercise might, therefore, be a time
efficient training strategy for highly trained individuals.
Study III: The expression of PGC-1α and related genes, as well as the activity of upstream
proteins, were examined after concurrent (ER: cycling + leg press) and single-mode (E:
cycling only) exercise in untrained subjects. PGC-1α expression doubled after ER compared
with E. It was concluded that concurrent training might be beneficial for mitochondrial
biogenesis in untrained individuals.
Study IV: The expression of PGC-1α and related genes were examined after exercise
performed with low (LG) and normal (NG) muscle glycogen in well-trained cyclists. PGC-1α
expression increased approximately three times more after LG compared with NG. This
finding suggested that low glycogen exercise is a potent inducer of mitochondrial biogenesis
in well-trained individuals.
Study V: Mitochondrial enzyme activity, protein content and endurance performance were
examined after eight weeks of concurrent (ES: cycling + leg press) or single-mode (E:
cycling only) training in cyclists. ES did not affect enzyme activity, protein content or
endurance performance differently than E. The beneficial effect previously observed in
untrained subjects did not translate to higher numbers of mitochondria in trained individuals.
In three of the studies, I, III, and IV, both glycogen and PGC-1α expression were measured
after exercise. These data were then pooled and examined. The highest PGC-1α mRNA
expression levels were identified when glycogen levels were low, and vice versa. This
suggests that low glycogen might play an important role in the regulation of mitochondrial
biogenesis also during interval and concurrent strength and endurance exercise.
In conclusion, key markers of mitochondrial biogenesis can be effectively up-regulated by
interval, concurrent and low glycogen exercise. A possible explanation for this might be that
though the exercise protocols are quite divergent in nature, they all have a pronounced effect
on muscle glycogen and/or perturbation in energetic stress.

LIST OF SCIENTIFIC PAPERS
I. Wang L, PSILANDER N, Tonkonogi M, Ding S, Sahlin K. Similar
Expression of Oxidative Genes after Interval and Continuous
Exercise. Med Sci Sports Exerc. 2009 Dec;41(12):2136-44.
II. PSILANDER N, Wang L, Westergren J, Tonkonogi M, Sahlin K.
Mitochondrial gene expression in elite cyclists: effects of high
intensity exercis. Eur J Appl Physiol. 2010 Oct;110(3):597-606.
III. Wang L, Mascher H, PSILANDER N, Blomstrand E, Sahlin K.
Resistance exercise enhances the molecular signaling of
mitochondrial biogenesis induced by endurance. J Appl Physiol. 2011
Nov;111(5):1335-44.
IV. PSILANDER N, Frank P, Flockhart M, Sahlin K. Exercise with low
glycogen increases PGC-1a gene expression in human skeletal
muscle. Eur J Appl Physiol. 2013 Apr;113(4):951-63.
V. PSILANDER N, Frank P, Flockhart M, Sahlin K. Adding strength to
endurance training does not enhance aerobic capacity in cyclists.
Accepted for publication in Scand J Med Sci Sports 2014.

CONTENTS
Introduction ............................................................................................................................. 1
Background ............................................................................................................................. 3
Skeletal muscle cells (fibers) .......................................................................................... 3
The mitochondria ............................................................................................................ 4
Mitochondrial content/function and health .................................................................... 5
Mitochondrial content and endurance capacity .............................................................. 5
Mitochondrial biogenesis ................................................................................................ 6
Training strategies to promote mitochondrial biogenesis .............................................. 9
Aims ...................................................................................................................................... 11
Methods ................................................................................................................................. 13
Subjects .......................................................................................................................... 13
Intervention protocols ................................................................................................... 14
Exercise tests ................................................................................................................. 19
Biopsy sampling and preparation ................................................................................. 20
Blood analysis ............................................................................................................... 20
Muscle analysis ............................................................................................................. 21
Statistical analysis ......................................................................................................... 23
Methodological considerations ............................................................................................ 24
Wet vs. freeze-dry muscle ............................................................................................. 24
Biopsy sampling ............................................................................................................ 24
Results ................................................................................................................................... 26
High Intensity Interval Exercise (study I and II) .......................................................... 26
Concurrent exercise/training (study III and V) ............................................................ 28
Low glycogen exercise (study IV) ................................................................................ 33
Discussion ............................................................................................................................. 35
High intensity interval training (HIIT) ......................................................................... 35
Concurrent training ....................................................................................................... 36
Low glycogen training .................................................................................................. 37
Low glycogen, a major trigger for mitochondrial biogenesis? .................................... 40
How do endurance athletes train? ................................................................................. 41
PGC-1α mRNA, a valid marker of mitochondrial biogenesis? ................................... 42
Conclusions ........................................................................................................................... 44
Future perspectives ............................................................................................................... 45
Populärvetenskaplig sammanfattning .................................................................................. 46
Acknowledgements .............................................................................................................. 49
References ............................................................................................................................. 52

1
INTRODUCTION
It is well accepted that regular exercise has a positive effect on most organ systems and
reduces the risk of several chronic diseases such as type 2 diabetes, cancer and cardiovascular
disease. Exercise also increases endurance capacity. An untrained person who engages in
regular endurance exercise, such as running, will after a few weeks be able to comfortably
run a distance that before training was perceived as difficult. Increased endurance capacity is
not only important for performance and general well being, but also strongly correlates with a
reduced mortality risk (Blair et al., 1995; Kokkinos et al., 2008).
Skeletal muscles quickly adapt to exercise. Muscles from well-trained individuals have more
capillaries, mitochondria and improved capacity to store carbohydrates and oxidize fat. One
of the most profound effects of exercise is an increase in mitochondrial content (Holloszy,
1967). Increases up to 50% after only 6-8 weeks of training are not unusual in untrained
subjects (Henriksson, 1977; Tarnopolsky et al., 2007; Tonkonogi et al., 2000). However, little
is known about the optimal exercise prescription, and an ongoing debate of whether focus
should be on low intensity/long duration or on high intensity/short duration training exists
(Bishop et al., 2014).


3
BACKGROUND
Skeletal muscle cells (fibers) Skeletal muscles are made up of long and thin muscle fibers cells. Depending on the muscle,
individual fibers can have a length similar to the muscle in which they reside. The longest
muscle fibers are found in the thigh (Sartorius muscle) and can be over 40 cm long (Ward et
al., 2009). Several different types of skeletal muscle fibers exist. They are normally classified
as type I, type IIa and type IIx. The type I fibers have the slowest contraction speed and
lowest power output, but the highest endurance capacity. A major reason for this high
endurance capacity is that type I fibers have a high mitochondrial content, and can therefore
utilize oxygen to a greater extent during energy production (aerobic metabolism). Type IIx
fibers are the most explosive fibers, with the fastest contraction speed, but their endurance
capacity is low and they easily fatigue. Type IIx fibers have a relatively low mitochondrial
content and get most of their energy from anaerobic metabolism. The characteristics of type
IIa fibers are highly dependent on an individual's training status. In well trained subjects, type
IIa fibers have similar metabolic properties as type I fibers, whereas in sedentary subjects,
metabolically they fall between type I and IIx fibers (Saltin et al., 1977).
Muscle fiber type proportions differ both between individuals and muscle groups. Well-
trained subjects generally have a different fiber type profile when compared with untrained
subjects. Untrained individuals have approximately 50% type I, 35% type IIa and 15% type
IIx fibers in the thigh muscles, whereas endurance trained individuals typically have > 60%
type I, < 30% type IIa and < 5% type IIx, though there is individual variability (Saltin et al.,
1977). The reason for muscle composition differences is both genetic and a consequence of
training. It is well known that training can induce fiber type transformation, especially from
type IIx to IIa (Andersen and Henriksson, 1977).
Exercising muscles rarely use all of their muscle fibers. Type IIx fibers are only fully
recruited during high intensity exercise, such as supramaximal sprints, or at the end of
exhaustive training session when type I and IIa fibers run out of fuel (Gollnick et al., 1974;
Vollestad et al., 1984). Type I fibers are primarily responsible for muscle contractions during
intensities below ~60% of VO2max, whereas both type I and IIa fibers are recruited to a
similar extent during intensities above ~65%, in untrained and moderately trained subjects
(Scribbans et al., 2014; Vollestad and Blom, 1985).

4
The mitochondria Mitochondria are the power plants of the cell. They use carbohydrates, fat and proteins as fuel
and produce energy in the form of adenosine triphosphate (ATP). Mitochondria produce ATP
via oxidative phosphorylation, which requires oxygen. Energy is released when ATP is
converted to adenosine diphosphate (ADP) and adenosine monophosphate (AMP), and this
energy can be used for different cellular processes such as muscle contraction. The more
dependent a cell is on a high, constant energy supply, the more mitochondria it contains. For
example, cardiac muscle fibers can never rest and need a constant flow of ATP to keep the
heart beating. These fibers have a mitochondrial fraction of more than 25% (Barth et al.,
1992). Skeletal muscles of sedentary individuals have a mitochondrial content of 3-6%,
whereas well trained individuals can have a content of up to 12% (Hoppeler, 1986). The
mitochondrial content is normally ~20% lower in type IIa and ~50% lower in type IIx fibers,
when compared with type I fibers in untrained subjects (Hoppeler, 1986). The more trained a
person becomes, the less fiber types differ in mitochondrial content. Therefore, highly trained
individuals often have similar contents in type I and type IIa muscle fibers (Saltin et al.,
1977).
Figure 1. A. Mitochondria illustrated as an individual organelle. B. Three-dimensional reconstruction of
mitochondria from a mouse soleus muscle displaying how the mitochondria form a reticular network throughout
the muscle section. Michael Larsen is acknowledged for the 3D reconstruction and the picture was kindly
provided by Prof. Robert Boushel.
Mitochondria should not be considered individual structures, as often illustrated in the
literature (Fig. 1A), but rather as a reticular network within skeletal muscle cells (Fig. 1B)
(Ogata and Yamasaki, 1997). This network is dynamic in nature, with mitochondria joining
and separating from the network in processes termed fusion and fission (Bo et al., 2010). The
mitochondrial content within the cell at any one time is a balance between mitochondrial
biogenesis (growth) and mitophagy (degradation). As previously mentioned, mitochondrial
content increases rapidly with training, up to 50% after 6-8 weeks, but also rapidly decreases
when training stops. Only ~50% of the training induced increase remains two weeks after the
BA
Outer membrane
Inner membrane
Matrix

5
last exercise session. Further, six weeks after training ends, the mitochondrial content (SDH-
activity) is back to pre-training level (Henriksson and Reitman, 1977).
The mitochondrial reticulum is a very unique intracellular compartment because it contains
DNA (mtDNA). All other DNA is located in the nucleus and most mitochondrial genes are
actually found there. A possible explanation for this is that during evolution, approximately
1.5x10⁹ years ago, anaerobic eukaryotic cells absorbed aerobic bacteria and established an
endosymbiotic relationship (Cavalier-Smith, 1987; Gray et al., 1999). Thereafter, an
extensive transfer of genes to the nuclear genome took place and few genes remained
(Andersson et al., 2003). Despite low numbers, these genes are essential for proper function
of the oxidative phosphorylation process. To expand the mitochondrial reticulum, a
coordinated activation of both the mitochondrial and nuclear genome must take place
(Taanman, 1999). A key regulator of this process is the transcriptional coactivator PGC-1α
(peroxisome proliferative–activated receptor-γ coactivator 1α) that will be discussed in detail
below.
Mitochondrial content/function and health Disorders in muscle mitochondrial content or function are closely related to various chronic
diseases, and to numerous health issues that face our ageing population (Russell et al., 2014).
For example, reduced mitochondrial content and functionality might contribute to the onset
and/or severity of type 2 diabetes, sarcopenia, Alzheimer’s and amyotrophic lateral sclerosis
(ALS) (Calvani et al., 2013; Russell et al., 2014). Also, mitochondrial dysfunction seem to be
heavily implicated in the ageing process (Trifunovic and Larsson, 2008). Exercise is a
promising treatment for patients with mitochondrial dysfunction. Studies show that
prescribing regular exercise is an efficient way to improve cellular and whole body health
(van Tienen et al., 2012).
Mitochondrial content and endurance capacity There is a close relationship between mitochondrial content and endurance capacity. Highly
trained individuals have a mitochondrial content that is 3-4 times higher than that of
untrained (Costill et al., 1976; Hoppeler, 1990). But why is high mitochondrial content
important for endurance capacity?
Maximal oxygen consumption (VO2max) and the % of VO2max that can be sustained during
prolonged exercise (%VO2max) are two crucial factors for endurance performance. The
VO2max is the highest amount of oxygen that the body can utilize during exhaustive exercise.
Elite runners and cross-country skiers generally have a VO2max of 70-80 ml/kg/min
(Losnegard and Hallen, 2014). This can be compared with sedentary individuals that
normally range between 30-40 ml/kg/min (Ekblom-Bak et al., 2009). VO2max is mainly
determined by the capacity of the heart and blood to transport oxygen to the working
muscles. Mitochondrial content has minor effects on VO2max under normal conditions

6
(Bassett and Howley, 2000). Well-trained individuals not only have a high VO2max, but also
a high fractional utilization of VO2max (%VO2max). For example, elite marathon runners can
run a marathon at an average intensity corresponding to ~85% of their VO2max (Sjodin and
Svedenhag, 1985). On the other hand, untrained individuals can only exercise for a similar
period of time (~2 h) at 35-40% of their VO2max (Bassett and Howley, 2000). The
%VO2max is closely related to the muscles aerobic capacity and mitochondrial content. This
is because high mitochondrial content will increase fat utilization and reduce the formation of
lactic acid and other fatigue related substances at a given submaximal workload (Bassett and
Howley, 2000; Stisen et al., 2006). Coaches and athletes usually refer to this phenomenon as
improved lactate threshold because there is a strong relationship between a high %VO2max
and the exercise intensity at which lactate accumulation in the blood accelerates, as a result of
increasing lactate production and decreasing lactate removal (Miller et al., 2002).
Mitochondrial biogenesis The regulation of mitochondrial biogenesis is a complex process that not only requires the
synthesis of mitochondrial building blocks, but also the import and incorporation of these
proteins into the existing mitochondrial reticulum (Hood, 2009; Scarpulla, 2011). The
growing reticulum also requires regulation of factors controlling the fusion and fission
processes (Bo et al., 2010). How are all of these processes regulated and coordinated within
the skeletal muscle cell?
As previously mentioned, the genes that are needed to construct new mitochondria are
located both in the nuclear and mitochondrial genome. The genes located in the
mitochondrial genome are controlled by three transcription factors, mitochondrial
transcription factor A (TFAM), B1 (TFBM1) and B2 (TFBM2) (Kelly and Scarpulla, 2004).
The genes located on the nuclear genome are regulated by several different transcription
factors, of which the nuclear respiratory factors 1 and 2 (NRF-1 and 2) are central. These two
transcription factors regulate a large number of key mitochondrial proteins such as
cytochrome C, succinate dehydrogenase and cytochrome oxidase. In addition to these
proteins, the NRFs also regulates mitochondrial transcription factors and are thereby
indirectly involved in the regulation of the mitochondrial genome (Scarpulla, 2008).
PGC-1α has emerged as a key regulator of mitochondrial biogenesis since its discovery in
1998. PGC-1α belongs to a family of proteins that also includes PGC-1β and PGC-1-related
coactivator (PRC). These two family members have similarities and differences in function
when compared with PGC-1α, but their precise roles are still under investigation (Scarpulla,
2011). PGC-1α interacts with the majority of the transcription factors known to regulate
mitochondrial biogenesis (Kang and Li Ji, 2012). Included among these are the NRFs. PGC-
1α can thereby control the expression of several important genes located on both the nuclear
and mitochondrial genome. Recent studies also show that PGC-1α can bind to Tfam and
directly influence the transcription of genes located on the mtDNA (Aquilano et al., 2010).

7
PGC-1α not only regulates the synthesis of mitochondrial proteins, but is also involved in the
regulation of fusion and fission processes (Soriano et al., 2006).
Further evidence for the important role of PGC-1α in the regulation of mitochondrial
biogenesis comes from animal studies where the PGC-1α gene has been manipulated. If the
gene is "knocked out,” mice will have reduced muscle mitochondrial content and endurance
performance. If the gene is instead overexpressed, the mice will have increased mitochondrial
content and enhanced endurance performance (Calvo et al., 2008; Leone et al., 2005).
Even though PGC-1α is mostly associated with mitochondrial biogenesis, it has other
regulatory roles. For example, PGC-1α is known to bind to members of the peroxisomal
proliferator activator receptor family (PPARs) and can thereby regulate the expression of
genes involved in fat metabolism, such as cluster of differentiation 36 (CD36) and carnitine
palmitoyl transferase (CPT1) (Vega et al., 2000). PGC-1α also regulates carbohydrate
metabolism by binding to estrogen-related receptor-α (ERRα), a transcription factor that
controls the expression of the pyruvate dehydrogenase kinase 4 (PDK4) gene (Olesen et al.,
2010).
Exercise is a very potent stimulator of mitochondrial biogenesis and it does so mainly
through PGC-1α (Holloszy, 2008). Exercise both upregulates PGC-1α gene expression and
protein activity, as well as the migration of PGC-1α to the nucleus and mitochondria (Baar,
2014; Little et al., 2011). But how does exercise regulate PGC-1α?
Molecules and ions markedly affected by exercise are potent signaling substances that can
mediate disturbances in homeostasis to adaptive processes such as mitochondrial biogenesis.
During exercise there are increased intracellular levels of calcium ions (Ca2+
), energy
regulating molecules, such as ADP or AMP, free phosphate groups (Pi) and reactive oxygen
species (ROS) (Baar, 2014). These substances are potent signaling transducers and have been
shown to activate protein kinases such as calcium/calmodulin-dependent protein kinases
(CaMK), AMP-activated protein kinase (AMPK) and p38 mitogen-activated kinase (p38-
MAPK). These in turn are known to regulate both PGC-1α transcription and activity (Kang
and Li Ji, 2012). In addition, it has been suggested that extensive cross-talk exists between the
different protein kinases. Studies show that CaMK can alter PGC-1α expression indirectly
through regulation of p38-MAPK and AMPK (Fig. 2) (Zhang et al., 2014).

8
Figure 2. Simplified overview of exercise induced signaling pathways that regulate PGC-1α expression and
activity, as well as the subsequent PGC-1α induced mitochondrial biogenesis. ROS, reactive oxygen species; Cr,
creatine; Pi, unbound phosphate group; AMP, adenosine monophosphate; p38, p38 mitogen-activated kinase;
CaMK, calcium/calmodulin-dependent protein kinases; AMPK, AMP-activated protein kinase; PGC-1α,
peroxisome proliferative–activated receptor-γ coactivator 1α; NRF, nuclear respiratory factors; Tfam,
mitochondrial transcription factor A.
Even though up-stream regulators and down-stream targets of PGC-1α are still under intense
investigation, it is likely that PGC-1α has a key role in mitochondrial biogenesis. By
measuring the acute effects of exercise on PGC-1α expression, it is possible to take a
"shortcut" and to get information regarding how different exercise regimens affect
mitochondrial biogenesis without doing long-term training studies with measurement of
mitochondrial content.

9
Training strategies to promote mitochondrial biogenesis While there is agreement that exercise is a powerful stimulus to increase mitochondrial
content, the optimal training stimulus to induce mitochondrial biogenesis is under dispute
(Bishop et al., 2014). A common view has been that traditional endurance training promotes
muscle aerobic capacity and mitochondrial biogenesis, whereas sprint training promotes
strength and anaerobic capacity (Kubukeli et al., 2002). However, recent studies have
challenged this point of view. High intensity interval training (HIIT), in particular sprint
interval training (SIT), has been shown to be a time efficient strategy to promote
mitochondrial biogenesis (Barnett et al., 2004; Burgomaster et al., 2008; Gibala et al., 2006;
MacDougall et al., 1998). SIT is usually performed as very short sprints (20-30 s) at maximal
intensity ("all out" effort) repeated 4-8 times. Even though the energy production during a
single sprint is mainly anaerobic, repeated sprints will gradually increase the aerobic
contribution and a high muscular oxidative capacity becomes important. As few as 4-6 sprints
have been shown to increase mitochondrial biogenesis to a similar extent as long duration
cycling (90-120 min at 65% of VO2max) in untrained subjects (Gibala et al., 2006). However,
untrained subjects respond well to most types of training and it is possible that the intensity
and/or duration of exercise are of minor importance for this group, as long as the training is
undertaken regularly. In paper I, the effect of different training intensities on mitochondrial
biogenesis in untrained subjects was evaluated.
Compared with untrained subjects, muscles of well-trained individuals are highly adapted and
the response to exercise is therefore significantly reduced (Evertsen et al., 1999; Perry et al.,
2010). A relevant question is whether SIT can be an efficient training strategy for well trained
individuals even though the training duration is only a few minutes and members of this
group often train 10-20 hours per week? This question is addressed in paper II where we
studied the acute effects of SIT in elite cyclists.
Resistance training has traditionally been something that very few endurance athletes have
included in their training program. One reason for this is probably that many athletes are
afraid of gaining muscle mass and thereby body weight, which can have a negative impact on
performance in weight bearing endurance events. One other explanation might be that some
early studies showed that muscle hypertrophy dilutes muscle mitochondria content (Tesch,
1988). Today the majority of endurance athletes include resistance exercise in their training
programs. The reason for this is that several recent studies show that adding resistance to an
endurance training program can improve endurance performance, especially if heavy,
explosive resistance training is incorporated (Losnegard et al., 2011; Paavolainen et al., 1999;
Ronnestad et al., 2011; Storen et al., 2008). The mechanism behind this is not well
understood. It has been suggested that increased strength and power can result in attenuated
blood flow restriction, faster force development in each movement cycle or enhanced
neuromuscular function (Ronnestad and Mujika, 2013).

10
The effects of concurrent resistance and endurance training on mitochondrial biogenesis have
not been well studied. However, if resistance and endurance exercise are performed on
separate training sessions, the mechanism behind improved endurance performance does not
seem to be related to changes in mitochondrial content (Bell et al., 2000; Bishop et al., 1999;
Hickson et al., 1988). This might not be the case when resistance and endurance exercise are
combined within the same training session. Sale and colleagues observed enhanced CS-
activity, a marker of mitochondrial biogenesis, when resistance training was performed
immediately after endurance training (Sale et al., 1990). A possible explanation for this might
be that the molecular signals induced by endurance exercise are enhanced when resistance
exercise is performed in close proximity. This was investigated in paper III of this thesis.
Further, the study by Sale et al. only examined the effects of concurrent exercise on
physiological adaptations, and did not study at the effect of training on performance. Also,
that study examined untrained subjects and the effect of concurrent training on more trained
subjects is unknown. In paper V, the effects of endurance followed by resistance training on
both mitochondrial biogenesis and performance in trained cyclists were evaluated.
In the last 20-30 years, experts have recommended that endurance athletes consume large
quantities of carbohydrates before, during and after training and competition (Burke, 2010).
This was based on the perceived benefit of promoting daily muscle glycogen recovery so that
every training session could be performed under optimal conditions. Maximizing muscle
glycogen is a wise strategy before competition (Karlsson and Saltin, 1971), but there is little
evidence that training adaptations are enhanced by performing endurance training in a "high"
glycogen state. Instead, recent research in this area show that it is more beneficial (Hansen et
al., 2005), or at least not disadvantageous (Morton et al., 2009; Yeo et al., 2008), to undertake
most training in a "low" glycogen state. None of these studies have examined the acute effect
of low muscle glycogen on genes regulating mitochondrial biogenesis. Also, it is unclear if
the observed metabolic adaptations are related to exercise with low muscle glycogen or to
other factors related to the training programs, such as timing and intensity of exercise
sessions. Therefore, in paper IV, the acute effects of low glycogen exercise on PGC-1α and
other genes involved in mitochondrial biogenesis and CHO metabolism were studied.

11
AIMS
The overall objective of this thesis was to identify efficient training strategies to promote
mitochondrial biogenesis and endurance performance
The specific aims were to evaluate how major markers of mitochondrial biogenesis are
influenced by:
High intensity interval exercise
Muscle glycogen status during exercise
Concurrent strength and endurance training


13
METHODS
Subjects
Table 1. Summary of subject characteristics (mean ± SE)
Study Sex Number Age (yr) Height (cm) Weight (kg) VO2max (L min-1)
I M/F 9(7/2) 26 ± 1 174 ± 3 72 ± 5 3.0 ± 0,2
II M 10 25 ± 1 179 ± 2 70 ± 2 4.8 ± 0,1
III M/F 10(7/3) 26 ± 1 177 ± 3 72 ± 4 3.6 ± 0,1
IV M 10 28 ± 2 183 ± 2 75 ± 2 4.9 ± 0,1
V M 19 35 ± 2 185 ± 2 80 ± 2 4.5 ± 0,1
A total of 58 subjects were enrolled in the studies. Subjects were informed about the
experimental protocols and associated risks before written consent was given. Each study was
approved by the Regional Ethical Review Board in Stockholm and performed in accordance
with the principles outlined in the Declaration of Helsinki. Subjects in study II and IV were
highly trained cyclists that competed at a national elite level or had been competing at this
level during the preceding years in road or mountain biking. Subjects in Study V were
moderately trained cyclists some of whom competed or had been competing at the national
level. Subjects in study I and III were relatively untrained and had not been engaged in
programmed endurance or strength training during the 6-month period before the studies
were conducted.

14
Intervention protocols
Table 2. Summary of intervention protocols. FFA, free fatty acids; CS, citrate synthase; MHC, myosin heavy
chain, ROS, reactive oxygen species; LT4, work rate corresponding to 4 mmol lactate per L blood; TT40, 40
min time trial; CE, cycling economy; 1RM, one repetition maximum
Study Type Protocol Biopsies Analysis
I
Acute, cross-
over
Continuous vs.
interval exercise
(matched for total
work)
Before and 3 h after
exercise
In muscle: gene expression and
glycogen. In blood: lactate, glucose and
FFA
II Acute, cross-
over
Long interval (3 x 20
min) vs. sprint
interval (7 x 30 s)
exercise
Before and 3 h after
exercise
In muscle: gene expression, glycogen,
CS-activity and MHC content. In blood:
lactate
III Acute, cross-
over
Endurance vs.
concurrent exercise
(cycling only or
cycling + leg press)
Before, 1 and 3 h
after exercise
In muscle: gene expression, protein
phosphorylation and glycogen. In blood:
lactate, glucose and FFA
IV Acute, cross-
over
Low vs. normal
muscle glycogen
exercise
Before and 3 h after
exercise
In muscle: gene expression, protein
phosphorylation, respiration, ROS and
glycogen. In blood: lactate, glucose, FFA
and insulin
V 8 weeks, two
groups
Endurance vs.
concurrent exercise
(cycling only or
cycling + leg press)
Before and after the
training period
In muscle: enzyme activity and protein
content. In blood: hormones and lactate.
Performance tests: VO2max, LT4, TT40,
CE, Wingate and IRM leg press

15
Study I
Each subject participated in two experimental sessions, in randomized order, separated by an
interval of at least 2 weeks for men and 4 weeks in women (to minimize the possible
influence of the menstrual cycle) (Fig. 3). In one of these sessions, the subject cycled for 90
min at a constant work rate corresponding to 60% of VO2peak (CE) and in the other session
he/she performed IE involving cycling alternating for 12 s at 120% of VO2peak and for 18 s
at 20% of VO2peak. The work rate during the second exercise session was adjusted to match
the duration and the total work performed during the first session. The participants were
instructed to eat normally but to refrain from the consumption of alcohol, caffeine, and tea
during the 24-h period preceding the test, and not to do any strenuous exercise for 48 h before
the tests. Venous blood samples were drawn before exercise, during the final minutes of
exercise and 3 h after completion of cycling. Muscle biopsies were taken before beginning
the exercise (Pre) and 3 h after completion (3 h Post).
Figure 3. Schematic overview of the intervention protocol in study I.
Study II
The study was executed for 3 weeks in the middle of May, 6 weeks into the competition
season. All testing was performed 48–72 h after the weekends’ racing and the subjects were
only allowed to do recovery type exercises (heart rate < 120 bpm and duration < 1 h) during
this period. After a standardized warm-up ending at a power output corresponding to RER
1.0, the subjects performed two different interval exercise sessions, 1 week apart in a
counterbalanced fashion (Fig. 4). The SIE consisted of 7 x 30-s “all-out” Wingate type
intervals (separated by 4 min of active rest at 50 W) performed at ~110 rpm on the ergometer.
The IE consisted of 3 x 20-min intervals (separated by 4 min of active rest at 50 W), where
the subjects were instructed to ride as hard as possible (i.e., time trial effort). Capillary blood
lactate sampled from a fingertip directly after each interval, peak power and mean power
were measured during both SIE and IE. A total of four muscle biopsies were obtained over
the course of the experiment, two at each exercise trial. The first biopsy was obtained 15 min
prior to the exercise sessions and the second biopsy was obtained 3 h after completion. All
subjects kept a dietary record during the 48 h preceding the first trial, and were instructed to
duplicate this during the second trial.
Blod
3h PostPre
Biopsy
CE or IE cycling for
90 min

16
Figure 4. Schematic overview of the intervention protocol in study II.
Study III
An overview of the exercise protocol is shown in figure 5. On the morning of the
experimental day, subjects reported to the laboratory around 8 AM. After a 10-min rest in the
supine position, a blood sample was taken from an arm vein, and a muscle biopsy sample was
obtained from the middle portion of the vastus lateralis muscle of one leg. After a 5-min
warm-up on the cycle ergometer, the subjects exercised (60–70 rpm) for 60 min at a work
rate corresponding to 65% of VO2peak (3-min rest was allowed after 30 min of cycling; E),
or performed the same cycling exercise followed by one bout of resistance exercise after 15-
min rest (ER). The resistance exercise was performed in a leg press machine (243 Leg Press
45°, Gymleco, Stockholm, Sweden) and consisted of six sets of leg presses at workloads
corresponding to 70, 75, 80, 80, 75, and 70% of the individual 1 RM, with 3-min rest
between each set. During each set, subjects were encouraged to do as many repetitions as
possible up to 15. One hour after the cycling exercise (i.e., 20 min following resistance
exercise in the ER experiment), a second muscle biopsy and blood sample was taken [1 h
post exercise (Post)]. A third muscle and blood sample was taken 3 h after the cycling
exercise (3 h Post) (i.e., 2 h and 20 min following resistance exercise in the ER experiment).
The pre exercise (Pre) biopsy was taken from one leg, and both Post biopsies (1 h and 3 h
Post) were taken from the other leg. The leg chosen for the first biopsy sample was randomly
assigned. The food intake in the evening before the first experiment was recorded and then
duplicated during the evening before the second experiment. In addition, subjects were
instructed to fast for 12 h and refrain from heavy physical exercise for at least 2 days before
each trial. Subjects were fasted throughout the experiment.
IE: 3 x 20 min at ~85% of VO2max
Blod
3h PostPre
Biopsy
3h PostPre
SIE: 7 x 30 s at ~185% of VO2max
Blod
Biopsy

17
Figure 5. Schematic overview of the intervention protocol in study III.
Study IV
Subjects participated in two experimental sessions separated by at least 1 week in a crossover
design with randomized order (Fig. 6). In one of the sessions, subjects had a high CHO (NG)
diet and in the other a low CHO (LG) diet (see below for details). Both sessions included two
exercise tests separated by about 14 h. The purpose of the first exercise was to deplete muscle
glycogen (depletion exercise) and the second exercise to test the influence of low muscle
glycogen on the signaling response (test exercise). Subjects were instructed to refrain from
exhaustive exercise and alcohol during the 2 days prior to the experiment. Subjects arrived to
the laboratory in the afternoon. A blood sample was taken from an arm vein and a muscle
biopsy sample was obtained from the middle portion of the vastus lateralis muscle of one leg.
The depletion exercise was approx. 2.5 h long and included both continuous and interval
cycling. The test exercise was performed the following morning, about 14 h after the
depletion exercise, and included six intervals of 10 min cycling with 4 min active rest (100
W) between intervals. Capillary blood samples were collected from fingertips before test
exercise and during the last seconds of intervals 2, 4, and 6 and were analyzed for lactate and
glucose. Venous blood samples and muscle biopsies were obtained approximately 15 min
before and 3 h after the test exercise.
Subjects recorded their food intake during the 24-h period preceding the first experiment and
were instructed to duplicate this prior to the second experiment. During and after the
glycogen depletion exercise on day 1, and the following the test exercise on day 2, subjects
either consumed a high CHO (NG) or low CHO (LG) diet as shown in figure 4. The NG diet
included two high CHO meals and eight high CHO beverages plus a banana. The LG diet
included two low CHO meals. NG provided 88% of total energy intake from CHO, 6% from
protein and 6% from fat, while LG provided less than 1% of total energy intake from CHO,
22% from protein, and 77% from fat.
Biopsy and blood
15min ~20min
1h
~25min
Pre 1h Post
Cycling Leg PressRest Rest
1h
Biopsy and blood1h
Pre 3h Post
Endurance exercise (E)
1h Post
Cycling Rest
1h
Rest
2h
3h Post
Rest
2h
Endurance + resistance exercise (ER)

18
Figure 6. Schematic overview of the intervention protocol in study IV. B beverages containing CHO (NG
normal glycogen) or only water (LG low glycogen). Meals contained either high (NG) or low CHO (LG).
Muscle biopsies and venous blood samples were obtained approximately 15 min before the depletion (S1) and
test exercise (S2), as well as 3 h after the test
Study V
The subjects were instructed to continue their habitual cycle training but to exchange two
ordinary training sessions per week with supervised laboratory training. The first 8 supervised
training sessions consisted of 60 min of continuous cycling at a work rate corresponding to
90% of the mean power output during the 40 min time trail in the pre-test. The work rate was
then raised to 92.5% (sessions 9-12), and to 95% (sessions 13-16). Following 10-15 min rest
the subjects in the ES group performed strength training in a leg press machine (243 Leg
Press 45°, Gymleco, Stockholm, Sweden). The session started with a warm up set with 10
repetitions at 50% of 1 RM (determined in pre-test) followed by sets at 65, 70, 75, 75, 70, and
65% of 1 RM. The subjects were instructed to do as many repetitions as possible and if they
were able to complete 15 reps, the load was increased by 5% the next set. Instead of
resistance exercise, the E group cycled for 2.5-4 min corresponding to an equal amount of
energy expenditure.
The subjects were instructed to keep a balanced diet throughout the intervention and to avoid
diets with a low amount of calories or carbohydrates. The subjects recorded food intake
during the 36 h preceding pretests and were instructed to duplicate the diet prior to posttests.
Pre- and posttests were performed three hours after the last meal, at the same time of the day
for each subject.
S2 (~ 8:15 AM)
Depletion exercise:45 min at 75 % +
8x4 min at 88 % separatedby 4 min at 100 W+
45 min at 70 % of VO2max
Test exercise:6x10 min at
~64% of VO2max
separated by4 min at 100 W
S1 (~ 15:45 PM)
~3 h
B B B B B B B B
Meal~21:30
Meal~6:30
S3 (~ 12:45 PM)
~14 h~2.5 h ~1.5 h

19
Figure 7. Schematic overview of the intervention protocol in study V. LT4, work rate corresponding to 4 mmol
lactate per l blood; TT40, 40 min time trial; RT, resistance training; 1 RM, one repetition maximum.
Exercise tests
VO2max
The testing of VO2max was performed on an ergometer (Monark 839E, Monark Exercise,
Varberg, Sweden or SRM, Konigskamp, Germany) with a two stage incremental exercise
protocol. The first part (3-5 min cycling at 5-6 submaximal intensities) was used to establish
the relation between VO2 and work rate (W), and to get a rough estimate of the work rate
corresponding to VO2max. After 3-5 min of active rest, the work rate was increased rapidly
until voluntary exhaustion, with a protocol designed to elicit VO2max after 7–8 min. Oxygen
uptake was measured using an online system (Oxycon Pro, Erich Jaeger, Hoechberg,
Germany or AMIS 2001; Inovision A/S Odense, Denmark) and VO2max was defined as the
highest recorded oxygen uptake during 40-60 consecutive seconds. The following criteria
were used for attaining VO2max: RPE > 18, RER > 1.1, and a plateau of VO2 with increased
workload.
Lactate threshold
Lactate threshold was determined during incremental, submaximal ergometer exercise (the
first part of the above described VO2max protocol). Blood was sampled from a finger
capillary at the end of each work period and analyzed for lactate. LT4 was defined as the
interpolated workload corresponding to a blood lactate concentration of 4 mmol l-1
blood.
LT4
RT
TT40
RT
2-4 wks
Pre test
Day 1-2
TT40, Sprint
test, LT4,
VO2max,
1 RM test
Day 3-4
Biopsy,
Blood sample
Post test
Day 1-2
TT40, Sprint
test, LT4,
VO2max,
1 RM test
Day 3-4
Biopsy,
Blood sample
8 wks training3 days - 2 wks
Preliminary
tests

20
1RM
Maximal strength was measured in a leg press machine (243 Leg Press 45°, Gymleco,
Stockholm, Sweden). After warm up, the load was progressively increased until the subjects
could not perform more than one single repetition (turning point between the eccentric and
concentric phase was set at a knee angle of 90° degree). Most subjects reached their 1 RM
within five to seven trials. There was a 3-5 min rest between trials to avoid muscle fatigue.
Biopsy sampling and preparation Muscle samples were obtained from the middle portion of the vastus lateralis muscle at a
depth of 2-3 cm, about one-third of the distance from the upper margin of the patella to the
anterior superior iliac spine. After local anaesthesia (2-4 ml Carbocaine 20 mg ml-1; Astra
Zeneca, Södertälje, Sweden) an incision (0.5-1 cm) was made through the skin and fascia and
a muscle sample (50-100 mg) was obtained with the percutaneous needle biopsy technique
utilizing suction (Bergstrom, 1975). If more than one biopsy was obtained from the same
muscle, a new incision was created approximately 2-4 cm proximal to the previous one. The
samples were rapidly frozen in liquid nitrogen and stored at -80°C. The frozen samples were
thereafter freeze-dried, dissected free of blood and connective tissue, pulverized with forceps,
extensively mixed and finally divided into aliquots for subsequent analysis.
Blood analysis
Capillary blood samples
Capillary blood samples were collected from fingertips, and lactate and glucose were
analyzed using an automated analyzer (Biosen 5140, EKF Diagnostics, Barleben, Germany).
Venous plasma samples
To obtain plasma, blood (4 ml) from an antecubital vein was collected into heparinized tubes
and centrifuged at 1,500 g at 4 °C for 10 min. A commercially available colorimetric
enzymatic procedure (NEFA C test kit; Wako Chemicals GmbH, Neuss, Germany) was used
for determining free fatty acid concentrations. Lactate and glucose were analyzed by
enzymatic methods according to Bergmeyer and Bernt (Bergmeyer and Bernt, 1974). Insulin,
cortisol and testosterone were analyzed with ELISA kits (Mercodia, Uppsala, Sweden and
Calbiotech, CA, USA) using a plate reader (Tecan infinite F200 pro, Männedorf,
Switzerland).

21
Muscle analysis
RNA extraction and real-time PCR analysis
Total RNA was extracted from 2–5 mg freeze-dried muscle tissue using a glass (study I) or
Polytron PT 1600 E homogenizer (Kinematica, Lucerne, Switzerland) and a PureZOL RNA
isolation kit according to the manufacturer’s instructions (Bio-Rad Laboratories AB,
Sundbyberg, Sweden). The yield and quality of extracted RNA were estimated by
spectrometry and micro-gel electrophoresis (Experion, Bio-Rad, study II-IV). The 260/280
absorbance ratios were between 1.6 and 2.1 depending on the buffer used. The RNA quality
indicator values (RQI) from the micro-gel electrophoresis were greater than 0.7, verifying
high quality RNA samples. RNA (1 µg) was reverse transcribed to cDNA (20 µl) using the
iScript cDNA synthesis kit (Bio-Rad). Real-time RT-PCR was performed with an iCycler
(Bio-Rad) in a mixture containing 12.5 µl 2x SYBR Green Supermix (Bio-Rad), 0.5 µl of
both the forward and reverse primers (final concentrations 10 µM), and 11.5 µl template
cDNA. All reactions were performed in triplicate with GAPDH as the reference gene. β-actin
and cyclophilin were also used as reference genes in study I, but they were excluded because
their expression levels tended to increase with exercise whereas GAPDH was stable. This
finding that GAPDH is unaffected by exercise has been confirmed by others (Jemiolo and
Trappe, 2004). The melting curves of the PCR product showed only one peak, demonstrating
specificity of the primers and absence of contamination. The cDNA concentration, annealing
temperature and thermocycling conditions were optimized for each primer pair, and assay
sensitivity was high for all PCR products (RSq > 0.99, and efficiency > 90%). The
comparative critical threshold (CT) method could therefore be used to calculate changes in
mRNA levels (Livak and Schmittgen, 2001).
Enzyme activity
Muscle samples were homogenized using a bullet blender in a buffer (150 µl mg-1
) with the
following composition (in mM): 50 K2HPO4, 1 EDTA and 0.05% Triton X-100 adjusted to
pH 7.4. The homogenate was centrifuged at 10 000 rpm for 10 min and the supernatant was
collected and diluted x3. Citrate synthase (CS) activity was measured in a reagent solution (in
mM): 50 Tris-HCl, 0.2 DTNB and 0.1 acetyl-CoA. The reaction was initiated by adding
oxaloacetate (7 mM) and the change in absorbance at 412 nm was measured
spectrophotometrically at 25°C. Hydroxyacyl-CoA dehydrogenase (HAD) activity was
measured in a reagent solution (in mM): 65 Triethanolamine HCL, 0.3 EDTA and 0.3 NADH
adjusted to pH 7.0. The reaction was initiated by adding acetoacetyl coenzyme A (4 mM) and
the change in absorbance at 340 nm was measured spectrophotometrically at 25°C.
Western blot
The samples were homogenized using a bullet blender (Bullet Blender 1.5, Next Advance,
NY, USA) in ice-cold buffer (80 µl mg-1
) with the following composition (in mM): 2
HEPES, 1 EDTA, 5 EGTA, 10 MgCl2, 50 β-glycerophosphate, 1% TritonX-100, 1 Na3VO4,

22
2 Dithiothreitol, 20 ìg ml-1
Leupeptin, 50 ìg ml-1
Aprotinin, 1% Phosphatase inhibitor cocktail
(Sigma P-2850, St Louis, MO, USA), 40 ìg ìl-1
PMSF. The homogenates were centrifuged to
pellet the insoluble debris. Protein concentration was determined with the bicinchoninic acid
assay (Pierce Biotechnology, Rockford, IL, USA) by measuring the absorbance at 560 nm
with a plate reader (Tecan infinite F200 pro, Männedorf, Switzerland). The samples were
diluted with Laemmli sample buffer (Bio-Rad Laboratories, Richmond, CA, USA) and
homogenizing buffer (1:1) to a final protein concentration of 1.5 µg µl-1
and heated to 95°C
for 5 min to denature proteins. The diluted samples were stored at -20°C prior to analysis.
The proteins of the diluted samples were separated by SDS-PAGE (Criterion cell gradient
gels, Bio-Rad Laboratories) for 45 min at 300 V on ice and then transferred to polyvinylidine
fluoride membranes (Bio-Rad Laboratories) for 3 h at 300 mA on ice. The amount of protein
loaded to the membranes was kept constant for all samples and was verified by staining with
MemCodeTM Reversible Protein Stain Kit (Pierce Biotechnology). After blocking for 1 h at
room temperature in 5% non-fat milk, the membranes were incubated over-night with
primary antibodies. This was followed by 1 h incubation with anti-rabbit or anti-mouse HRP
(1:10 000) as the secondary antibody. The antibodies were visualized by chemiluminescent
detection on a Molecular Imager ChemiDocTM XRS system and the bands were analyzed
using Quantity One® version 4.6.3 software (Bio-Rad Laboratories).
Muscle glycogen content
Glycogen was analyzed in 1-2 mg of freeze-dried muscle according to the method previously
described by Harris et al. (Harris et al., 1974), which includes enzymatic hydrolysis of
glycogen followed by enzymatic analysis of glucose.
Fiber type composition
MHC composition was analyzed as described previously (Talmadge and Roy 1993), with
some minor modifications. Briefly, approximately 1 mg of freeze-dried muscle was
homogenized in a buffer containing 2 mM HEPES (pH 7.4), 1 mM EDTA, 5 mM EGTA, 10
mM MgCl2, 50 mM β-glycerophosphate, 1 mM N3VO4, 2 mM DTT, 1% Triton X-100, 20 µg
leupeptin and 50 µg aprotinin and 40 µg PMSF per mL, and 1% of a phosphatase inhibitor
cocktail (Sigma P-2850). The protein concentration was determined using a BCA protein
assay (Thermo Fisher ScientiWc Inc., Rockford, IL, USA), after which the muscle
homogenates were dissolved in a sample buffer (Laemmli, containing 5% β-
Mercaptoethanol; Bio-Rad Laboratories AB, Sundbyberg, Sweden) and brought to a final
protein concentration of 0.3 µg µl-1
by heating them for 10 min at 60°C. 20 µl of each sample
was heated for 5 min at 95°C and allowed to cool before loading onto a SDS–PAGE
separation and concentration gel containing 8 and 4% acrylamide, respectively. β-
Mercaptoethanol (at a final concentration of 0.16%) was added to the top running buffer, to
improve the sharpness of the bands. Electrophoresis was done on ice in a 4°C room for 24 h
at 145 V/12 mA and the bands on the gel were visualized and quantified by silver staining
(PlusOne Silver Staining Kit, Protein; Amersham Bioscience, GE Healthcare, Little Chalfont,
UK) and scanned with a Gel Doc 2000 apparatus. Finally, the relative amounts of the

23
different isozymes of MHC were determined utilizing the Quantity One software, version
4.6.3 (Bio-Rad Laboratories AB, Sundbyberg, Sweden).
Mitochondrial respiration and ROS production
Muscle samples (10-25 mg wet weight) were stored in an ice cold medium with the following
composition (in mM): 2.8 CaK2EGTA, 7.2 K2EGTA, 5.8 Na2ATP, 6.6 MgCl2, 20 Taurine, 15
Na2Phosphocreatine, 20 Imidazole, 0.5 Dithiothreitol and 50 MES adjusted to pH 7.1. The
specimen was split into 2-5 mg fiber bundles and each bundle was mechanically separated
using surgical needles into a network formation to expose fiber membranes to the
surrounding medium. The bundles were incubated with saponin (50 µg ml-1
), washed twice
and stored in a medium with the following composition (in mM): 0.5 EGTA, 3 MgCl2, 60 K-
lactobionate, 20 Taurine, 10 KH2PO4, 20 Hepes, 110 Sucrose and 1 g l-1
BSA adjusted to pH
7.1.
Mitochondrial respiration was measured in a Clark-type electrode (Hansatech instruments,
Kings Lynn, England) in a water-jacketed glass chamber at 25°C. Permeabilized muscle fiber
bundles (n = 8) were added to the storage medium supplemented with benzyltoluene
sulfonamide (45 µM) to prevent fiber contraction. The oxygen consumption was measured
after sequential additions of: octanoyl-carnitine (1.5 mM), ADP (5 mM), pyruvate (20 mM),
glutamate (5 mM), succinate (5 mM), and cytochrome c (10 µM).
The rate of mitochondrial H2O2 production was measured with Amplex red (Invitrogen,
Eugene, OR, USA), which, in the presence of peroxidase enzyme, reacts with H2O2 and
produces the red fluorescent compound Resorufin. Permeabilized fiber bundles (n = 8) were
added to the measuring medium (in mM): mannitol (225), sucrose (75), Tris-base (10),
K2HPO4 (10), EDTA (0.1), MgCl2 (0.08), BSA (2 g/l), horseradish peroxidase (13.5 U/ml),
benzyltoluene sulfonamide (45 µM) and superoxide dismutase (SOD; 45 U/ml) adjusted to
pH 7.1 and kept at 30°C. The change in fluorescence was recorded on a Hitachi f-2500
fluorescence spectrophotometer equipped with a magnetic stirrer (Tokyo, Japan) after
subsequent additions of: octanoyl-carnitine (1.5 mM), pyruvate (5 mM), succinate (5 mM)
and rotenone (0.5 µM).
Statistical analysis Values were expressed as mean ± SE and the threshold for significance was set at P < 0.05. A
paired t-test was used for normally distributed data to compare changes in dependent
variables within the same group at different conditions or at two time points. A nonparametric
Wilcoxon signed rank test replaced the t-test if the data was not normally distributed. A one-
way repeated-measure ANOVA, followed by a Newman Keul’s post-hoc test, was used to
compare within group changes over time when more than two time points were analyzed. A
two-way repeated-measure ANOVA, followed by a Fishers LSD or paired t-test, was used to
identify differences over time for two different conditions (e.g., E/ER, NG/LG, E/ES). A
Spearman’s correlation test was used to analyze correlations between variables.

24
METHODOLOGICAL CONSIDERATIONS
Wet vs. freeze-dry muscle Most studies use frozen muscle samples (“wet” muscle), freeze-dried muscle has been used in
studies performed by our laboratory. The reason for this is that the biopsies become less
sensitive to temperature and it is possible to remove non-muscle tissue. However, freeze-
drying might influence the yield and quality of the RNA extracted. To examine this, eight
biopsies were obtained. Each biopsy was divided into four pieces, of which two were freeze-
dried. RNA was extracted, and the yield and quality tested in a spectrophotometer
(absorbance at 280 and 260 nm) and micro-gel electrophoresis station (Experion, BioRad).
The yield was ~7% lower (Fig. 8) when the samples were freeze-dried, but the quality was
unaffected. Real-Time RT-PCR was performed but no difference in gene expression (PGC-
1α) was observed between the wet and freeze-dried samples. We therefore concluded that
freeze-dried muscle samples would not compromise RNA quality or PCR quantity and could
therefore be used for gene expression analysis.
Figure 8. mRNA yield in frozen (wet) and freeze-dried (dry) muscle samples obtained from the same biopsies.
Values are reported as means ± SE. *P < 0.01 vs. wet.
Biopsy sampling In all studies we used the percutaneous needle biopsy technique with suction (Fig. 9A, right)
(Bergstrom, 1975). This technique requires the cooperation of two people. One that takes the
biopsy and one that assists by handling the syringe and the suction. One problem with this
method is obtaining the correct suction pressure. If too much pressure is applied, blood and
muscle can be sucked up into the tube connected to the syringe. If too little pressure is
applied, the muscle might not be fully sucked into the biopsy needle. Another disadvantage
with this method is that the biopsy depth is difficult to standardize due to the sharp tip of the
needle and the location of the opening. The biopsy procedures performed during our trials
0,0
0,1
0,2
0,3
0,4
0,5
0,6
Wet Dry
0.6
0.3
0.5
0.2
0.1
0.4
0.0
Wet Dry
*
mR
NA
yie
ld µ
g m
g-1
wet
mu
scle
25
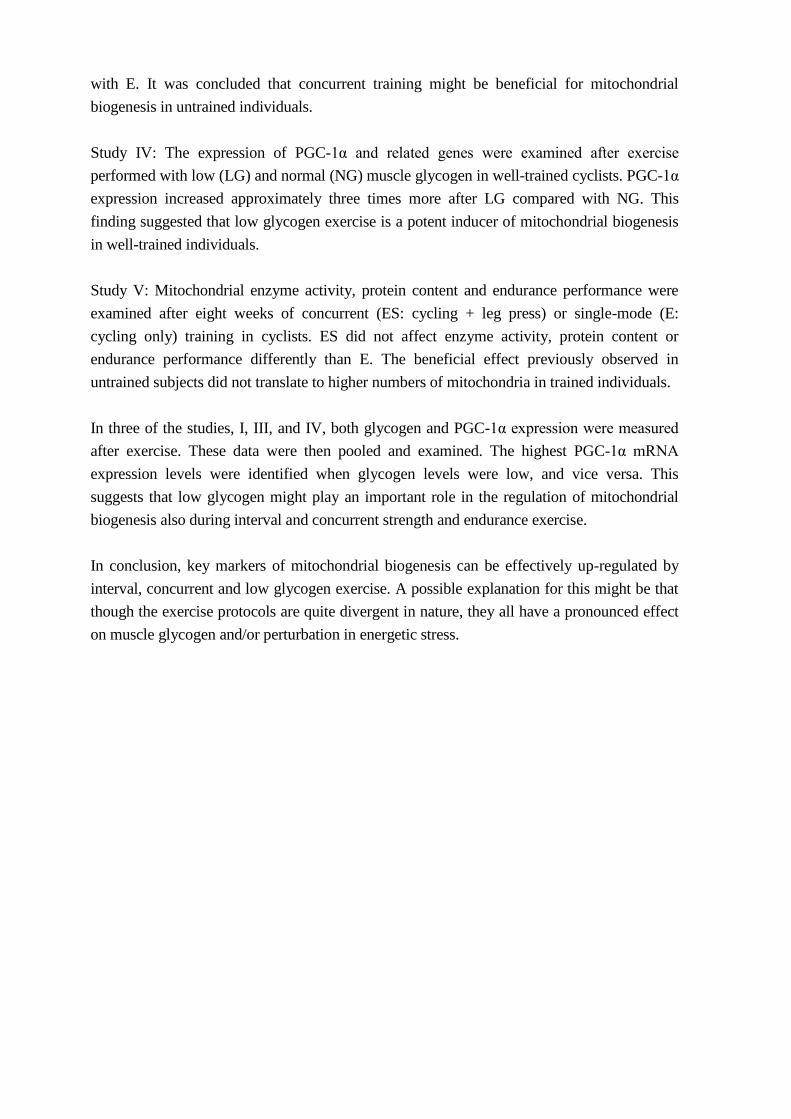
were completed by experienced professors and technicians, and the biopsy size and quality,
as well as the depth and location, were standardized.
There is also another biopsy technique available, the Weil–Blakesley chonchotome. Instead
of a biopsy needle, a special forceps is used and only one person is needed for the biopsy
procedure (Fig. 9A, left). The Weil–Blakesley chonchotome technique is easier and has a
higher success rate in some cases, with repeated attempts rarely needed. The disadvantage to
this method is that the maximal sample size is smaller compared with the percutaneous
needle biopsy technique (~100 mg vs. >200 mg), however the average sample size is usually
similar.
Observation and instruction in the Weil–Blakesley chonchotome technique occurred during
2012-2014 and the author obtained a total of ~30 biopsies during this period (Fig 9B). Future
studies will incorporate this method once the technique is fully mastered.
Figure 9. A. Percutaneous needle (right) and Weil–Blakesley chonchotome forceps (left). B. Muscle biopsy
obtained with Weil–Blakesley chonchotome technique from the Vastus Lateralis muscle (performed by the
author on the author).
A B

26
RESULTS
High Intensity Interval Exercise (study I and II) In Study I and II we investigated the acute effects of interval exercise on expression of genes
regulating mitochondrial biogenesis and metabolism. In study I we used untrained subjects
and compared interval exercise (90 min alternating between 120 and 20% of VO2max) with
continuous exercise (90 min at 60% of VO2max). The duration and work performed were
identical in the two trials. In study II, we used highly trained cyclists and compared low-
volume sprint interval exercise (7x30s at ~184% of VO2max) with high-volume interval
exercise (3x20 min at ~87% of VO2max).
Study I: interval (IE) vs. continuous (CE) exercise in untrained subjects
VO2 increased approximately six-fold during both CE and IE, and corresponded to 67 ± 2%
and 66 ± 2% of VO2max, respectively. Changes in lactate, glucose and free fatty acids were
also highly similar between the two exercise types (table 3). Muscle glycogen decreased 35%
during CE and 40% during IE, but no significant difference was observed between
conditions. There was also no difference in gene expression between the two exercise types.
Both IE and CE induced a marked increase in mRNA of key regulators of mitochondrial
biogenesis (Fig. 10).
Table 3. Concentration of blood lactate, blood glucose and plasma FFA
Variable Group Pre Post 3 h Post
Lactate (mmol L-1
) CE 1.11 ± 0.24 2.32 ± 0.28* 0.72 ± 0.06
IE 0.78 ± 0.13 2.17 ± 0.33* 0.70 ± 0.06
Glucose (mmol L-1
) CE 4.41 ± 0.11 3.70 ± 0.06* 4.07 ± 0.07*
IE 4.40 ± 0.10 3.85 ± 0.09* 3.99 ± 0.10**
FFA (mmol L-1
) CE 0.18 ± 0.03 0.60 ± 0.08* 0.59 ± 0.05*
IE 0.29 ± 0.05 0.78 ± 0.12* 0.78 ± 0.18*
*P < 0.05 and **P < 0.01 vs. Pre-exercise

27
Figure 10. Effect of continuous (CE) and interval exercise (IE) on mRNA levels of proteins regulating
mitochondrial biogenesis. White bars, pre-exercise; gray bars, 3 h post exercise; PGC-1α, peroxisome
proliferative–activated receptor-γ coactivator 1α; PGC-1β, peroxisome proliferative–activated receptor-γ
coactivator 1 β; PRC, PGC-1-related coactivator. Values are reported as means ± SE. *P < 0.05 vs. pre exercise.
Study II: Low-volume sprint interval exercise (SIE) vs. high-volume interval
exercise (IE) in well trained subjects
The total work during IE was eightfold higher than that during SIE, and the total exercise
duration 17-fold longer (table 4). As expected, the metabolic response was very different
between the two protocols, with very high lactate levels during SIE compared with IE (14.9
vs. 4.4 mmol L-1
). Even though the anaerobic energy production was high during SIE, there
was a strong correlation between the accumulated work produced during SIE and the subjects
VO2max (r = 0.87, P < 0.01). Already after the second bout of SIE the subjects, with a high
VO2max performed better. Muscle fiber composition did not correlate with any of the
measured physiological or metabolic parameters. Gene expression of major regulators of
mitochondrial biogenesis were increased to a similar extent after SIE and IE, with the
exception of Tfam which was more increased after SIE (Fig. 11).
Table 4 Summary of low-volume sprint interval exercise (SIE) and high-volume interval exercise (IE) protocols
SIE (7 x 30 s) IE (3 x 20 min)
Exercise intensity
(mean power)
643 ± 22 W
(~ 184% of VO2peak)
304 ± 12 W
(~ 87% of VO2peak)
Time commitment
including rest
27.5 min 68 min
Time commitment
excluding rest
3.5 min 60 min
Total work 135 ± 5 kJ 1094 ± 43 kJ
0
2
4
6
8
10
12
14
16
CE IE CE IE CE IE
PGC-1α PGC-1β PRC
mR
NA
exp
ress
ion
(fo
ldch
an
ge)
*
* *
*

28
Figure 11. Effect of low-volume sprint interval exercise (SIE) and high-volume interval exercise (IE) on mRNA
levels of genes regulating mitochondrial biogenesis. White bars, pre exercise; gray bars, 3 h post exercise; PGC-
1α, peroxisome proliferative–activated receptor-γ coactivator 1α; PRC, PGC-1-related coactivator. Tfam,
mitochondrial transcription factor A; NRF-2, nuclear respiratory factor 2. Values are reported as means ± SE. *P
< 0.05 vs. pre exercise; †P < 0.05 vs. IE.
Concurrent exercise/training (study III and V) In study III, we investigated the acute effects of concurrent endurance and resistance exercise
on genes and proteins regulating mitochondrial biogenesis. In study V, we investigated the
long-term effects of concurrent training on muscle oxidative capacity and endurance
performance. Both studies used a similar exercise protocol where cycling was immediately
followed by resistance exercise. The main difference between the studies, besides acute vs.
chronic adaptation, was that the subjects in study III were untrained, whereas trained cyclists
were evaluated in study V.
0
2
4
6
8
SIE IE
PGC-1α
mR
NA
-lev
el
(fo
ld c
ha
nge)
****
A
0
1
2
3
SIE IE
PRC
mR
NA
-lev
el
(fo
ld c
ha
nge)
**
**
B
0
1
2
3
SIE IE
Tfam
mR
NA
-lev
el
(fo
ld c
ha
nge)
*
†
C
0
1
2
3
SIE IE
NRF-2
mR
NA
-lev
el
(fo
ld c
ha
nge)
D

29
Study III: concurrent exercise in untrained subjects
The mRNA of key marker genes of mitochondrial biogenesis (PGC-1α, PRC) and substrate
regulation (PDK4) increased significantly after both models of exercise. After the endurance
only session (E), the mRNA of PGC-1α, PRC, and PDK4 was increased 10-, 2-, and 14-fold,
respectively. The adaptive response was, however, more pronounced after the endurance +
resistance session (ER), and 3 h post-exercise mRNA was about twofold higher after ER than
after E (Fig. 12).
Approximately 3-years after the study was completed, we did some complementary mRNA
measurements on the remaining cDNA samples. This analysis showed that the truncated
isoforms of PGC-1α were increased in a similar fashion as total PGC-1α 3 h post exercise
(Fig. 12).
Figure 12. Effects of concurrent endurance and resistance exercise (ER) and endurance exercise only (E) on
mRNA levels of genes regulating mitochondrial biogenesis and metabolism. Muscle samples were taken Pre, 1 h
and 3 h Post exercise. Values of the target genes were expressed in relation to the reference gene (GAPDH).
Values were mean ± SE for 10 subjects. PGC-1α, peroxisome proliferative–activated receptor-γ coactivator 1α;
PRC, PGC-1-related coactivator; PDK4, pyruvate dehydrogenase kinase isozyme 4. *P < 0.05 and **P < 0.01
vs. Pre. #P < 0.05 and
##P < 0.01, ER vs. E.
Muscle glycogen content was reduced by 58% (E) and 66% (ER) 1 h post exercise and
remained reduced 3 h post. There was no significant difference between exercise models in
muscle glycogen depletion. However, in both E and ER, there was a negative correlation
between muscle glycogen content and gene expression of PGC-1α (Fig. 13).
0
1
2
3
0
1
2
3
4
5
6
0
1
2
3
4
0
1
2
3
4
Pre-exercise 1 h post 3 h post
PG
C-1α
mR
NA
(AU
)
Pre-exercise 1 h post 3 h post
Tru
nc-
PG
C-1α
mR
NA
(AU
)
Pre-exercise 1 h post 3 h post
PR
C m
RN
A(A
U)
Pre-exercise 1 h post 3 h post
PD
K4 m
RN
A(A
U)
**
*
##
#
****
**
**
**
**
* *##
#
** **
*
##
0
1
2
3
4
5
6
7 E
ER

30
Figure 13. Correlation between exercise induced mRNA expression and muscle glycogen levels post exercise.
E, endurance exercise only (n = 9); ER, concurrent endurance and resistance exercise (n = 10). PGC-1α,
peroxisome proliferative–activated receptor-γ coactivator 1α.
Phosphorylation of the upstream regulator of mitochondrial biogenesis (AMPKThr172
)
increased similarly after E (56%) and ER (69%) at 1 h Post (P < 0.01), but was reversed at 3
h without difference between E and ER. Phosphorylation of p38 MAPK showed a
heterogeneous response with a large variability between subjects. There was a tendency
(main effect of time P = 0.051) for increased phosphorylation of p38 MAPK at 1 h in ER
(Fig. 14). p-CaMKII was not affected by exercise.
0
5
10
15
20
25
30
35
40
45
50 100 150 200 250 300 350 400 450 500
0
5
10
15
20
25
30
35
40
45
50 100 150 200 250 300 350 400 450 500
PG
C-1α
mR
NA
ex
press
ion
(fo
ldch
an
ge)
E-protocol
r = - 0.64
P < 0.05
ER-protocol
r = - 0.75
P < 0.01
Muscle glycogen 3 h post exercise (mmol kg -1 dw-1)
Glycogen pre-exercise
(mean value)
Glycogen pre-exercise
(mean value)

31
Figure 14. Effect of concurrent endurance and resistance exercise (ER) and endurance exercise only (E) on
phosphorylation levels of upstream modulators of mitochondrial biogenesis. Muscle samples were taken Pre, 1 h
and 3 h Post exercise. p-AMPK, AMP-activated protein kinase; p-p38 MAPK, mitogen-activated protein kinase.
Values are mean ± SE for 10 subjects. **P < 0.01 and (*
)P = 0.054 vs. Pre.
Study V: Concurrent training in well trained subjects
Muscle strength, measured as 1 RM during leg press, increased to a larger extent after
concurrent strength and endurance training (ES) (19 ± 2%), than after endurance training
alone (E) (3 ± 2%). Peak power during a 30 s Wingate test increased in ES (5 ± 2%) but not
in E (1 ± 2%).
VO2max increased similarly in both groups but time to exhaustion during the VO2max test
only increased in ES. Also, LT4 and mean power output during the TT40 only increased in E
(table 5). A trend towards increased CS activity was observed in E, but not in ES. HAD was
unaffected by training in both groups (Fig. 15)
0
1
2
3
4
5
6
7
8
****
Pre-exercise 1 h post 3 h post
p-A
MP
KT
hr
72
(AU
)
0
2
4
6
8
10
12
14
16
18
(*)
Pre-exercise 1 h post 3 h post
p-p
38
MA
PK
Th
r1
80/T
yr
18
2(A
U)
0
1
2
3
4
5
6
7 E
ER

32
Table 5. Effect of training on performance and performance related variables
E ES
Pre Post Pre Post
VO2max (ml min-1
kg-1
) 55 ± 1 58 ± 1** 57 ± 1 58 ± 1*
TTE- VO2max (s) 402 ± 14 423 ± 15 407 ± 22 443 ± 21**
LT4 (W) 287 ± 11 295 ± 11* 283 ± 9 286 ± 8
TT40 (W) 284 ± 11 294 ± 11* 282 ± 10 290 ± 10
E, endurance training only (n = 10); ES, endurance + strength training (n = 9). TTE, time to exhaustion during
the VO2max test; LT4, intensity at the 4 mmol lactate threshold; TT40, mean power output during the 40 min
time trial. Values are reported as means ± SE. *P < 0.05 and **P < 0.01 vs. Pre.
Figure 15. Effect of 8 weeks of training on mitochondrial enzyme activities. E, endurance training only (n = 10);
ES, endurance + strength training (n = 9). CS, citrate synthase; HAD, 3-hydroxyacyl-CoA dehydrogenase.
Values are reported as means ± SE. (*
)P = 0.06 vs. Pre.
0
10
20
30
40
0
50
100
150
200Pre
Post
E ES
(*)
CS
acti
vit
y (
mm
ol
kg
dw
-1m
in-1
)
E ES
HA
D a
cti
vit
y (
mm
ol
kg
dw
-1m
in-1
)

33
Low glycogen exercise (study IV)
Low glycogen exercise in well-trained subjects
In study IV, we investigated the acute effect of exercise, with low (LG) and normal (NG)
muscle glycogen, on genes and proteins regulating mitochondrial biogenesis. Muscle
glycogen content was reduced 14 h after the depletion exercise by 73% in LG and 26% in
NG, but was not further reduced by the subsequent test exercise (Fig. 16).
Figure 16. Muscle glycogen levels. Muscle samples were obtained in the afternoon before the depletion exercise
session on day 1 (pre-depletion exercise), before the test exercise the following morning on day 2 (pre-test
exercise) and 3 h after the test exercise on day 2 (post-test exercise). NG normal glycogen, LG low glycogen.
Values reported as the mean ± SE, n = 10. *P < 0.05 and **P < 0.01 vs. pre-depletion exercise, ##
P < 0.01 LG
versus NG.
Free fatty acids, measured in blood samples obtained approximately 15 min before the
muscle biopsies, were unchanged in NG but increased in LG (table 6). In the same samples,
blood glucose was slightly reduced in both NG and LG, with no difference between
conditions (table 6).
Table 6. Effect of exercise and diet on plasma FFA and glucose
Pre-depletion exercise Pre-test exercise Post-test exercise
FFA LG 0.31 ± 0.07 0.66 ± 0.05
**## 1.21 ± 0.18
**##††
NG 0.23 ± 0.04 0.10 ± 0.02 0.03 ± 0.01
Glu LG 6.0 ± 0.4 5.0 ± 0.1**
4.3 ± 0.2**
NG 5.8 ± 0.3 5.1 ± 0.1 5.0 ± 0.3*
Muscle and blood samples were obtained before the depletion exercise on day 1 (pre-depletion exercise), before
the test exercise on day 2 (pretest exercise) and 3 h after the test exercise on day 2 (post-test exercise). FFA
venous plasma free fatty acids (mmol L-1
), Glu venous plasma glucose (mmol L-1
), LG low glycogen, NG
normal glycogen. Values are reported as mean ± SE from 10 subjects. * P < 0.05 and ** P < 0.01 vs. pre-
depletion exercise, ††
P < 0.01 vs. pre-test exercise and ##
P < 0.01 LG vs. NG.
0
250
500
750
1000
**
**
**
**
####
Pre-depletion
exercise
Pre-test
exercise
Post-test
exercise
Mu
scle
gly
cog
en(m
mo
lk
g d
w-1
)
0
1
2
3
4
5
6 NG
LG

34
The mRNA content of major regulators of mitochondrial biogenesis and lipid metabolism
was increased to a greater extent after LG compared with NG (Fig. 17). However,
phosphorylation of proteins involved in the upstream signaling pathways of mitochondrial
biogenesis (AMPK and p38MAPK), as well as mitochondrial ROS-production, did not
change significantly 3 h after test exercise in any of the conditions.
Figure 17. Effect of low glycogen exercise (LG) and normal glycogen exercise (NG) on mRNA levels of
proteins regulating mitochondrial biogenesis and metabolism. Muscle samples were obtained before the
depletion exercise on day 1 (pre-depletion exercise), before the test exercise on day 2 (pre-test exercise) and 3 h
after the test exercise on day 2 (post-test exercise). Values were expressed in arbitrary units (AU) related to the
reference gene GAPDH, and are reported as mean ± SE, n = 10. PGC-1α, peroxisome proliferative–activated
receptor-γ coactivator 1α; PRC, PGC-1-related coactivator; PDK4 pyruvate dehydrogenase kinase isozyme 4;
COX I cytochrome c oxidase subunit I. *P < 0.05 and **P < 0.01 vs. pre-depletion exercise; ##
P < 0.01 LG vs.
NG; §§
P < 0.01 vs. pre-depletion exercise (time-dependent effect)
0
1
2
3
4
5
6
7NG
LG
##
**
*
PG
C1α
mR
NA
(A
U)
Pre-depletion
exercise
Pre-test
exercise
Post-test
exercise
0
1
2
3
4
5
6NG
LG
PR
C m
RN
A(A
U)
Pre-depletion
exercise
Pre-test
exercise
Post-test
exercise
0
1
2
3
4
5
6NG
LG
PD
K4 m
RN
A (A
U)
Pre-depletion
exercise
Pre-test
exercise
Post-test
exercise
##
**##
**
0
1
2
3 NG
LG
CO
X I
mR
NA
(A
U)
Pre-depletion
exercise
Pre-test
exercise
Post-test
exercise
##
**

35
DISCUSSION
High intensity interval training (HIIT) In studies I and II, we examined the effects of high intensity interval training on genes
regulating mitochondrial biogenesis and metabolism. In study I, the subjects were untrained,
whereas in study II they were highly trained cyclists. The major finding in study I was that
continuous (CE) and interval (IE) cycling exercise of the same duration and work increased
the expression of genes regulating mitochondrial biogenesis to a similar extent. The major
finding in study II was that low-volume sprint interval exercise (SIT) and high-volume
interval exercise (IE) had a similar effect on genes regulating mitochondrial biogenesis,
despite a large difference in time commitment and work.
In study I, we hypothesized that IE would increase the expression of genes regulating
mitochondrial biogenesis to a greater extent than CE, due to a more pronounced energetic
stress and type II fiber recruitment. This was however not the case. Both IE and CE induced a
~10-fold increase in PGC-1α expression. There were also no differences in mRNA levels of
the other PGC-family members (PRC and PGC-1β). It is possible that the exercise protocols
were too similar and did not induce a large enough difference in fiber recruitment pattern and
metabolic perturbation. Our data indirectly support this because changes in blood lactate and
glycogen did not differ between CE and IE. Also, in a follow-up study from our laboratory, it
was shown that PGC-1α expression increased to the same extent in type I and II muscle fibers
after CE and IE (Wang and Sahlin, 2012).
A similar observation was included in a recent study by Bartlett and colleagues (Bartlett et
al., 2012). Similarly, they compared the effect of work-matched exercise (6x3 min at 90% of
VO2max vs. 50 min at 70% of VO2max) and observed no difference in glycogen depletion or
PGC-1α expression. They also could not detect any difference in AMPK activation. Even
though they used an interval protocol that was more metabolically demanding than ours, the
end result was similar. This indicates that the work performed, rather than the intensity of
exercise, is important for mitochondrial biogenesis in untrained subjects. However, this
seems only to be true for exercise intensities that are relatively high (> 65-70% of VO2max).
When low intensity exercise (40% of VO2max) was compared with work matched high
intensity exercise (80% of VO2max), both a larger glycogen reduction and PGC-1α
expression was observed after the high intensity exercise session (Egan et al., 2010). A
possible explanation for this might be that 40% of VO2max is too low intensity to induce a
large energetic stress, especially in type II fibers. This idea is supported by the large
difference in glycogen utilization observed between the 40 and 80% trail (1.3 vs. 3.1 mmol
(kg dw)-1
min-1
).
Training prescriptions to induce mitochondrial biogenesis in untrained individuals therefore
seem to be relatively straight forward: if exercise duration is relatively long, there is no point

36
in exercising harder than 65-70% of VO2max. However, several studies show that if time is a
limiting factor, HIIT protocols, especially SIT, are the most time efficient training strategies
to promote mitochondrial biogenesis.
In study II we hypothesized that SIT would increase the expression of genes regulating
mitochondrial biogenesis to a similar extent as IE, despite much less time commitment and
work done. We based this hypothesis on previous studies where SIT has been shown to be a
time efficient training strategy to promote mitochondrial biogenesis and performance in
untrained subjects (Barnett et al., 2004; Burgomaster et al., 2008; Gibala et al., 2006;
MacDougall et al., 1998). Our results confirm and extend these findings by showing that SIT
is also a powerful inducer of PGC-1α in highly trained subjects, even when compared with a
very demanding exercise protocol such as IE. But how is it possible that 3.5 min of exercise
can induce such a pronounced increase in PGC-1α expression in elite cyclists that usually
train 2-3 h/day and have metabolic adaptations that are almost maximized? One explanation
could be that even highly trained athletes have a pool of fast type II fibers (e.g., type IIx) that
are rarely activated during conventional endurance training, e.g., the IE protocol, but becomes
activated during SIE. These fibers are very anaerobic in nature (low mitochondrial content)
and therefore have a high aerobic adaptation potential. The marked increase in PGC-1α levels
observed after SIE might therefore be reflected, in part, by enhanced transcription in these
fast fibers. This idea is supported by the observations by Henriksson and Reitman, that
mitochondrial content (SDH-activity) is increased to a larger extent in fast type II muscle
fibers compared to slow type I fibers after 8 weeks of HIIT (Henriksson and Reitman, 1976).
Concurrent training In study III and V, we examined the effect of concurrent endurance and resistance training on
regulators and markers of mitochondrial biogenesis. In study III, the subjects were untrained
whereas in study V, they were trained cyclists. The major finding in study III was that
concurrent exercise increased the expression of key regulators of mitochondrial biogenesis to
a much greater extent than endurance training alone. The major finding in study V was that
eight weeks of concurrent training did not increase CS-activity or improve cycle performance
more than endurance training alone.
In study III we hypothesized that adding resistance exercise directly after endurance exercise
would blunt the signaling pathways regulating mitochondrial biogenesis. This was based on
earlier findings that resistance training might interfere with the signaling pathways regulating
mitochondrial biogenesis (Atherton et al., 2005; Baar, 2006). We examined PGC-1α, as well
as upstream regulators (AMPK, p38MAPK, CaMK), downstream targets (PDK4 and SDH)
and key regulatory factors of protein synthesis (Akt, mTOR and S6K). In contrast to our
hypothesis, PGC-1α and PRC expression was enhanced almost 2-fold after the concurrent
exercise session (ER) compared with endurance only (E). However, the upstream regulators
of PGC-1α did not differ between conditions, and the exact mechanism responsible for the
enhanced expression of PGC-1α could therefore not be clarified. Nonetheless, the powerful
37
effect of ER on PGC-1α and PRC suggests that this might be an efficient training strategy to
promote mitochondrial biogenesis and muscle oxidative capacity in untrained individuals.
Study V was a follow-up on study III, where we wanted to investigate if long-term training
with a similar exercise model as in study III, e.g., endurance immediately followed by
strength, would enhance mitochondrial biogenesis and performance. But instead of using
untrained subjects, we recruited trained cyclists. The reason for this was that we wanted to
increase the impact of the study by making the results more useful to athletes and coaches.
We hypothesized that endurance + strength (ES) would be more efficient than endurance only
(E), based on our previous acute exercise study. However, eight weeks of ES training did not
improve mitochondrial biogenesis and performance more than E. In fact, only the E-group
had increased CS-activity, lactate threshold and time trial performance. However, these
changes were not significantly different from the ES-group.
There are several possible explanations for these conflicting results. Strength training alone
has been shown to induce mitochondrial biogenesis in the untrained, but not in the trained
state (Wilkinson et al., 2008). One explanation might be that the untrained subjects in study
III got an additive effect from the strength training, but the trained subjects in study V did
not. This additive effect could have been induced by the mammalian target of rapamycin
(mTOR) signaling pathway because mTOR was more activated in ER compared with E.
Even though mTOR is a major regulator of contractile protein synthesis, it has also been
shown to indirectly regulate PGC-1α expression (Cunningham et al., 2007).
Another possible explanation for divergent results between studies III and V is that the
observed increase in PGC-1α was not solely related to mitochondrial biogenesis. It has
recently been shown that PGC-1α exists in several isoforms (at least 4) with different roles in
the signaling cascades preceding muscle adaptation. In rat skeletal muscle, one of these
isoforms, PGC-1α4, has been shown to be more related to hypertrophy than to mitochondrial
biogenesis (Ruas et al., 2012). In study III, we used primers that measured all PGC-1α
isoforms and it is therefore possible that the enhanced PGC-1α expression was due to
increased PGC-1α4 expression induced by the resistance exercise. To address this possibility,
cDNA from study III was reanalyzed and the results showed that the expression of the
truncated isoforms of PGC-1α (PGC-1α4 and NT- PGC-1α) was ~3-fold higher after ER
compared with E. This suggests that the enhanced expression of total PGC-1α after ER could
be the result of increased expression of PGC-1α4 (or NT- PGC-1α). Recent human studies
report that up-regulation of PGC-1α4 is not solely related to resistance exercise and
hypertrophy (Lundberg et al., 2014; Ydfors et al., 2014). The precise role of PGC-1α4 and
other isoforms of PGC-1α in human skeletal muscle remodeling remains to be clarified.
Low glycogen training In study IV, we examined the effect of exercise with low muscle glycogen on key regulators
of mitochondrial biogenesis. The major finding was that exercise with low muscle glycogen

38
enhanced the expression of genes regulation mitochondrial biogenesis compared with normal
glycogen exercise.
In study IV, we hypothesized that exercising with low muscle glycogen levels would enhance
the expression of PGC-1α. This was based on earlier studies showing an enhanced activity of
both upstream (AMPK) and downstream (CS and SDH) targets of PGC-1α after training with
reduced muscle glycogen (Hansen et al., 2005; Morton et al., 2009; Yeo et al., 2010; Yeo et
al., 2008). However, several other parameters could have influenced the results in these long-
term training studies, especially since the reduction in glycogen was modest in two out of
three studies. It is therefore not possible to conclude if the enhanced mitochondrial biogenesis
(CS and SDH-activity) observed in these studies is an effect of low glycogen.
In line with our hypothesis, cycling with low muscle glycogen increased PGC-1α expression
to a greater extent than normal glycogen exercise (8- vs. 2.5-fold). This shows that exercise
with low glycogen is a very potent activator of the major regulator of mitochondrial
biogenesis. The previous observations of increased CS and SDH activity after long-term
training are therefore probably a result of an up-regulated AMPK- PGC-1α signaling pathway
induced by low glycogen exercise.
It has been suggested that a critically low level of glycogen might be needed to induce a
strong activation of metabolic genes by exercise (Pilegaard et al., 2002). Broberg and Sahlin
showed that very low glycogen levels are associated with reduced levels of high energy
phosphates and elevated AMP, which are known inducers of metabolic genes (Broberg and
Sahlin, 1989). Further evidence for this theory comes from a study by Cochran and
colleagues. They used a similar set-up as ours in study IV, but did not observe enhanced
PGC-1α expression (or AMPK activation), which might be explained by the relatively high
(200-300 mmol kg dw-1) glycogen levels during their “low” exercise session. Also, in a study
by Mathai et al. it was shown that the largest increase in PGC-1α protein abundance was
identified in subjects who had the largest reduction in glycogen during exercise (Mathai et al.,
2008).
The idea that glycogen needs to be critically low during exercise is also supported by data in
the present thesis. When PGC-1α expression was related to glycogen levels post exercise, a
strong negative correlation was observed in both the E and ER group (study III). Also, when
the results from study I, III and IV were merged into one figure, there seems to be a
relationship between glycogen levels and PGC-1α expression (Fig. 18). This was more
clearly visualized if these samples were divided into two groups based on their glycogen
content (Fig. 19). The low group (< 210 mmol kg-1
dw-1
, n = 28) had a ~13-fold increase in
PGC-1α expression whereas the high group (> 210 mmol kg-1
dw-1
, n = 29) only had a ~7-
fold increase. Taken together these studies and our data indicate that a "lower the better" rule
might be true when it comes to exercise, glycogen and PGC-1α expression.

39
Figure 18. Correlation between exercise induced mRNA expression and muscle glycogen levels post exercise.
Rectangles, study I (green: continuous exercise, purple: interval exercise); circles, study III (blue: endurance
exercise only, red: concurrent endurance and resistance exercise); triangles, study IV (blue: normal glycogen
exercise, orange: low glycogen exercise). PGC-1α, peroxisome proliferative–activated receptor-γ coactivator 1α.
Significant correlations for: red circles (r = -0.75, P < 0.01), blue circles (r = -0.64, P < 0.05) and green
rectangles (r = -0.65, P < 0.05). There is also a strong correlation for all data points (r = -0.45, P < 0.001),
however it is not statistically correct to do such an analysis and the trend line is only there to visualize a potential
relationship.
Figure 19. Average PGC-1α expression for samples with a muscle glycogen content < 210 mmol kg-1
dw-1
(n =
28) and > 210 mmol kg-1
dw-1
(n = 29). PGC-1α, peroxisome proliferative–activated receptor-γ coactivator 1α.
0
5
10
15
20
25
30
35
40
45
0 100 200 300 400 500 600 700
Muscle glycogen 3 h post exercise (mmol kg -1 dw-1)
PG
C-1α
mR
NA
ex
press
ion
(fo
ldch
an
ge)
0
2
4
6
8
10
12
14
16
18
Muscle glyogen < 210 Muscle glycogen > 210
PG
C-1α
mR
NA
ex
press
ion
(fo
ldch
an
ge)
Muscle glycogen < 210 Muscle glycogen > 210

40
Even though exercise with low glycogen seems to be important for mitochondrial biogenesis,
the long-term effect on performance is equivocal. Hansen and colleagues showed a marked
benefit of "training low" compared with "training high" (Hansen et al., 2005), whereas two
other studies did not show enhanced performance when training was committed with reduced
glycogen levels (Morton et al., 2009; Yeo et al., 2008). One explanation for these conflicting
results might be that the exercise protocols and performance tests used were quite different.
Also, the variability is much greater in performance tests compared with enzymatic
measurements, such as CS-activity. Another explanation could be that training with reduced
glycogen levels down-regulated carbohydrate metabolism, and that this had a negative effect
on performance in the studies by Morton et al. and Yeo et al. This idea is supported by an
investigation showing blunted pyruvate dehydrogenase (PDH) activity when exercise was
performed in a carbohydrate restricted state (Stellingwerff et al., 2006). Therefore, a critical
factor when designing endurance training programs might be to find an optimal balance
between "low" and "high" training sessions.
Low glycogen, a major trigger for mitochondrial biogenesis? One might speculate that low glycogen is a critical factor for inducing mitochondrial
biogenesis during most types of exercise, e.g., also during exercise that is normally not
associated with low glycogen, such as HIIT. Is it possible that the type of exercise is
secondary and its effect on glycogen primary? Could this also partly explain why subjects
accrue blunted responses when becoming more trained? It is well known that increased
fitness level is associated with elevated glycogen levels, as well as a glycogen sparing effect
during exercise (Burgomaster et al., 2008).
As previously discussed, HIIT is a time efficient training strategy to promote mitochondrial
biogenesis. HIIT is also a time efficient strategy to reduce muscle glycogen. A single 30 s all-
out sprint can reduce muscle glycogen by as much as 25% (Barnett et al., 2004) and 8x60 s
sprints can reduce glycogen by more than 75% (Gollnick et al., 1974). Further, HIIT seemed
to reduce glycogen to a greater extent in fast type II fibers than in type I (Thomson et al.,
1979). It has also been shown that HIIT increases mitochondrial biogenesis (SDH-activity)
more in type-II fibers than in type-I (Henriksson and Reitman, 1976). The efficacy of HIIT
training to induce mitochondrial biogenesis might therefore be a consequence of its ability to
effectively deplete some muscle fibers of their glycogen.
Elite endurance athletes generally have a very high percentage of type I fibers and elevated
glycogen levels compared with untrained subjects. If an individual, for example, has 80%
type I and 20% type II fibers, which is common among elite endurance athletes (Costill et al.,
1976), it would be wise to focus most training on something that maximizes adaptation in the
most abundant fiber types. Long duration training, rather than HIIT, is needed to induce
major glycogen depletion in type I muscle fibers (Gollnick et al., 1974; Thomson et al.,
1979). Elite endurance athletes do large quantities of LSD training, often two sessions per
day and 10-20 hour per week. Therefore, several training sessions will be undertaken with

41
low muscle glycogen. A large volume of LSD might be a particularly efficient training
strategy to promote mitochondrial biogenesis in individuals with a high percentage of type I
fibers.
Further support for the important role of glycogen as a regulator of mitochondrial biogenesis
comes from cell signaling studies. These studies show that glycogen can regulate AMPK
directly, not just indirectly, through fluctuations in ATP/AMP levels. Glycogen does this by
binding to the AMPK β subunit (McBride et al., 2009). AMPK cannot be activated when
bound to glycogen, but when glycogen is metabolized, as during exercise, AMPK is released
and AMP and upstream kinases can bind to and activate the enzyme. It has also been shown
in humans that exercise with low muscle glycogen is associated with greater AMPK activity,
less AMPK associated with glycogen, and greater AMPK translocation to the nucleus than
when muscle glycogen is high (Steinberg et al., 2006).
Altogether, the glycogen-AMPK-PGC-1α signaling pathway seems to be a key regulator of
mitochondrial biogenesis. However, the effect of low glycogen exercise needs to be further
investigated to clarify to what extent this pathway regulates mitochondrial biogenesis during
different exercise modalities.
How do endurance athletes train? Several studies show that HIIT efficiently improves and maintains performance in trained
subjects (Esfarjani and Laursen, 2007; Iaia et al., 2009; Laursen et al., 2002; Laursen et al.,
2005). But if HIIT is such a time efficient training strategy in both trained and untrained, why
do elite athletes train so little HIIT? Studies show that most elite endurance athletes train
more than 10 times per week and typically have an intensity distribution where 80% of their
training sessions are performed at low intensity (≤ 2 mM blood lactate) and 20% at higher
intensities (Seiler, 2010). This normally means that 2-3 sessions per week are performed at
high intensity and of these, only 1-2 are performed at a very high intensity, e.g., HIIT
(Laursen, 2010; Seiler, 2010). A possible explanation for this might be that athletes self-
organize their training towards a low intensity, high-volume approach to balances the
adaptive signaling and potentially maladaptive stress-inducing components appropriately
(Seiler, 2010). It has been shown that increased training intensity is associated with a
nonlinear increase in sympathetic stress. Highly trained subjects have rapid autonomic
nervous system recovery after long, slow distance sessions but a marked delay after short,
high-intensity sessions (Chwalbinska-Moneta et al., 1998; Seiler et al., 2007). Studies also
show that HIIT, in particular SIT, increase the risk of knee and hamstring injuries (Gabbett
and Ullah, 2012). The explanation for why elite athletes do not incorporate more HIIT might
be that they simply cannot tolerate more than a few such sessions per week without risking an
overtraining syndrome or injury.
An alternative explanation for the highly polarized training strategy among elite athletes
could be that an 80/20 distribution is particularly effective to induce training adaptations in

42
these individuals. As previously mentioned, elite athletes have a high percentage of type I
muscle fibers. It is possible that a large volume of LSD training is required to induce
homeostatic disturbance and adaptation in these fatigue resistance fibers. It is also possible
that a large volume of training is needed to optimize economy of movement and fiber
recruitment patterns (Santalla et al., 2009). However, overall endurance performance will not
be optimized solely by LSD and some high intensity training sessions are needed to
maximize neuronal and fast fiber adaptations, as well as VO2max. A recently published study
supports the use of a polarized training approach in well trained individuals (Stoggl and
Sperlich, 2014). In this study, four different training models were compared; HIIT, LSD,
lactate threshold training, and polarized training (POL). After 9 weeks of training the largest
increase in endurance performance (+ 17%) was observed in the POL group (68% LSD and
26% HIIT).
Even though an 80/20 distribution seems to be optimal for most endurance athletes, it might
not be for other less trained individuals. It is possible that a different intensity distribution is
more efficient for recreationally active persons that only train 2-3 times per week. However,
well controlled, long term training studies comparing POL with other training strategies in
this group of subjects have not yet been done.
PGC-1α mRNA, a valid marker of mitochondrial biogenesis? Gene expression, especially PGC-1α, has been used in the present thesis to evaluate the effect
of different training models on mitochondrial biogenesis. An important question is therefore,
how valid is PGC-1α expression as a marker for mitochondrial biogenesis? Although there is
no doubt about the importance of PGC-1α expression for mitochondrial biogenesis and
muscle oxidative capacity in cell and animal studies (Calvo et al., 2008; Leone et al., 2005;
Wu et al., 1999), a direct relationship is much more difficult to establish in humans. It has
been shown that repeated transient mRNA bursts precede mitochondrial biogenesis during
training in human skeletal muscle, and that the magnitude of mRNA expression seems to be
related to the magnitude of mitochondrial biogenesis (Perry et al., 2010). It has also been
shown that PGC-1α expression is intensity dependent, at least in trained subjects, with a
weaker response after exercise at 70% of VO2max compared with exercise at 85%
(Nordsborg et al., 2010). This is in line with long-term training studies showing that
intensities above 60-70% of VO2max normally are needed to induce mitochondrial
biogenesis (CS and SDH-activity) in well-trained subjects (Evertsen et al., 1999; Shepley et
al., 1992). Further support for a relationship between acute PGC-1α mRNA expression and a
chronic increase in mitochondrial content comes from study IV in the present thesis. Here we
show that well trained subjects exercising at ~65% of VO2max only get elevated mRNA
levels of PGC-1α when glycogen is low. This is in line with long-term studies showing that
mitochondrial content (CS, COX and SDH-activity) only increases after training with
reduced muscle glycogen (Hansen et al., 2005; Morton et al., 2009; Yeo et al., 2008).
43
Even though increased mRNA expression normally is associated with increased transcription
and protein content, several other factors will affect this process. Such factors include mRNA
stability, mRNA transport, translation efficiency, amino acid availability, protein assembly,
processing and stability. Also, more protein does not necessarily mean more active protein. It
is the amount of active protein that, in the end, affects the cellular processes. However, the
mRNA level of PGC-1α is not only a marker of protein content, but also a marker of protein
activity, because the activated protein regulates its own gene transcription (Benton et al.,
2008).
Taken together these findings support the validity of PGC-1α mRNA as a marker for
mitochondrial biogenesis. However, results from acute exercise studies should always be
verified in long-term training studies before a definitive conclusion can be drawn.

44
CONCLUSIONS
Untrained subjects Continuous and interval exercise have a similar effect on PGC-1α, and other genes
regulating mitochondrial biogenesis, if the duration and work done are the same
(study I)
Concurrent resistance and endurance exercise enhances the signaling pathway of
mitochondrial biogenesis (study III)
Trained subjects Sprint interval training is a powerful inducer of PGC-1α, and other genes regulating
mitochondrial biogenesis (study II)
Exercise with low muscle glycogen enhances the expression of PGC-1α, and other
genes regulating mitochondrial biogenesis (study IV)
Eight weeks of concurrent strength and endurance training does not enhance
mitochondrial content (CS-activity) or performance (study V)
General finding Intracellular glycogen levels during/after exercise might play a pivotal role for the
magnitude of the exercise induced increase in mitochondrial biogenesis regardless of
exercise mode

45
FUTURE PERSPECTIVES
The interest in sprint interval training (SIT) has increased considerably since Burgomaster
and colleagues published their first studies on the topic approximately eight years ago. A
large number of studies now show that SIT can improve both muscle oxidative capacity and
performance in untrained and recreationally active subjects. Studies also show that adding
SIT to the training program of well-trained subjects improves performance. However, to my
knowledge, study II is the only study to date that has examined the effect of SIT on factors
related to muscle oxidative capacity in highly trained individuals. A long-term training study
examining the effects of SIT on both mitochondrial biogenesis and performance in this group
would provide an answer to the important question; is the improvement in performance
observed in well trained subjects related to increased mitochondrial content?
PGC-1α mRNA is one of the best markers for evaluating the acute effect of exercise on
mitochondrial biogenesis. However, a long term study examining mitochondrial content after
training consisting of exercise sessions with a known "weak" vs. "strong" acute effect on
PGC-1α expression would provide more information about the validity of this marker. For
example, untrained subjects could perform work matched training for 8 weeks where one
group train at 40-50 % of VO2max (known to induce a weak effect on PGC-1α) and the other
group train at 70-80 % of VO2max (known to induce a strong effect on PGC-1α). After the
training period, mitochondrial content following the last training session and PGC-1α
expression after the first training session are compared and evaluated.
Essential amino acids, especially leucine, are critical for the activation of the signaling
pathway leading to muscle hypertrophy. However, the effect of amino acids on the regulation
of mitochondrial biogenesis has not been studied. It is possible that this process is also
affected by amino acid availability, especially in a fasted state. Therefore, a study examining
the acute effect of training on PGC-1α expression with and without amino acids would
provide further understanding of the mechanisms behind mitochondrial biogenesis.

46
POPULÄRVETENSKAPLIG SAMMANFATTNING
Bakgrund
Det är numera välkänt att fysisk aktivitet har en betydande inverkan på livslängd och hälsa.
Det finns ett brett vetenskapligt stöd för att regelbunden träning har en positiv effekt på
många av våra vanligaste folksjukdomar så som diabetes, hjärt- och kärlåkommor, vissa typer
av cancer, Alzeimer's och depression. Den mest hälsofrämjande träningsformen är
uthållighetsträning, dvs. träning som aktiverar en stor muskelmassa och ger en kraftigt
förhöjd puls. Förutom att denna träningsform effektivt motverkar många folksjukdomar så
medför den dessutom en ökad ork (prestation) både i vardagen och idrottsliga sammanhang.
En av de mest påtagliga anpassningar som sker i kroppen vid uthållighetsträning är en ökad
mängd mitokondrier i muskulaturen. Detta är förknippat med både god hälsa och prestation
och vältränade personer kan ha 3-4 gånger så många mitokondrier i sina muskler som
otränade.
Förenklat kan man säga att mitokondrierna är musklernas kraftverk där större delen av de
näringsämnen som vi får i oss via kosten (framförallt fett och kolhydrater) förbränns och
alstrar energi i from av ATP. ATP är den universala energimolekylen i våra celler och
används i nästan alla energikrävande processer i kroppen. En sådan mycket energikrävande
process är muskelarbete. En stor mängd mitokondrier är därför avgörande för hur hårt och
hur länge en muskel kan arbeta utan att bli trött. Man brukar säga att en vältränad muskel
med mycket mitokondrier har en hög aerob förmåga och uthållighetskapacitet.
Även om det sedan lång tid är klarlagt att uthållighetsträning stimulerar tillväxten av
mitokondrier så är det fortfarande oklart vilken typ av träning som är mest effektiv. En flitigt
diskuterad frågeställning är därför om träningen bör fokuseras på kvalitet (hög intensitet
under kort tid) eller kvantitet (låg/medelintensiv intensitet under lång tid).
En av anledningarna till att man inte har kommit längre inom detta område är begränsningar i
den traditionella metodiken där förändringar i muskulaturen enbart har kunnat mätas på
protein- och prestationsnivå. För att kunna detektera dessa förändringar krävs långa,
tidskrävande studier som är mycket kostsamma och svårkontrollerade. Med nya
molekylärbiologiska metoder finns det nu möjlighet att studera de initiala processerna som
styr muskelns anpassning till träning. Genom att analysera mRNA av gener som reglerar
tillväxten av mitokondrier kan man undersöka hur effektiv en viss typ av träning är efter
endast ett träningspass.
Den viktigaste genen för mitokondriell tillväxt är PGC-1α (transcriptional coactivator
peroxisome proliferator–activated receptor-γ coactivator-1α). PGC-1α är en nyckelspelare
som reglerar andra gener som behövs för att bygga fler och större mitokondrier. Djurstudier
visar att genmanipulerade råttor som har en ökad mängd PGC-1α i sina muskler har ett
mycket större antal mitokondrier samt är betydligt uthålligare än råttor med normala PGC-1α

47
nivåer. Både i djur- och humanstudier har man dessutom kunnat påvisa att uthållighetsarbete
ökar nivåerna av PGC-1α (både mRNA och protein). mRNA nivåerna, som är ett mått på
genens aktivering, brukar för PGC-1α vara som högst ca 3 h efter ett träningspass. Det är på
grund av detta som muskelproverna (biopsier) i denna avhandling oftast har tagits vid just
denna tidpunkt. Andra viktiga gener som styr mitokondriell tillväxt och som regleras av
PGC-1α är: peroxisome proliferator-activated receptor δ (PPARδ), mitochondrial
transcription factor A (Tfam) och nuclear respiratory factors 1 and 2 (NRF-1 and 2).
Målsättning
Målet med projektet som ligger till grund för denna avhandling var att jämföra olika typer av
träning för att undersöka vilken träningsform som är mest effektiv för att stimulera tillväxten
av mitokondrier i human skelettmuskulatur.
Resultat och konklusion
Otränade försökspersoner som vid ett tillfälle fick cykla 90 min på en konstant belastning och
vid ett annat tillfälle fick cykla 90 min i form av intervaller (dock samma totala arbete i båda
fallen) hade en likvärdig aktivering av PGC-1α-genen. Detta tyder på att om träningen är
långvarig och belastningen åtminstone är måttlig (> 60% av VO2max) så verkar
uthållighetsträningens karaktär vara av liten betydelse för otränade personer, dvs. det spelar
ingen roll om träningen utförs i form av intervaller eller på en konstant belastning. Orsaken
till detta är troligen att en måttlig belastning räcker för att ge en maximal adaptation hos en
otränad person.
Däremot så verkar den mitokondriella tillväxten hos otränade försökspersoner kunna
förstärkas då styrketräning läggs i direkt anslutning till ett uthållighetspass. Mängden PGC-1α
mRNA var ca dubbelt så hög i lårmuskulaturen efter ett kombinerat uthållighet- och
styrkearbete jämfört med ett renodlat uthållighetsarbete. Att träna styrka och kondition under
ett och samma träningspass verkar således vara fördelaktigt för att förbättra uthålligheten hos
otränade personer.
Resultaten i denna avhandling tyder dock på att tränade försökspersoner påverkas annorlunda
än otränade. Åtta veckors kombinerad uthållighet och styrka medförde nämligen inte någon
ökning av mängden mitokondrier eller prestationen hos cyklister jämfört med renodlad
uthållighetsträning. Orsaken till denna skillnad skulle kunna vara att otränade personer initialt
får en uthållighetseffekt av styrketräning på grund av deras låga träningsstatus. Cyklister
däremot har redan en så pass tränad muskulatur att styrketräning inte ger någon ytterligare
effekt på deras aeroba förmåga.
En träningsform som däremot verkar vara effektiv för vältränade är sprintintervaller.
Elitcyklister fick en mycket kraftig aktivering av PGC-1α-genen efter ett sprintintervallpass
(7 x 30 s). Ökningen var till och med lika stor som efter ett betydligt längre intervallpass (3 x
20 min) trots att det totala utförda arbetet var hela 17 gånger mindre. Detta skulle kunna bero

48
på att denna mycket högintensiva träningsform stimulerar delar i muskulaturen som
fortfarande har en viss anpassningspotential kvar och därmed kan påverkas relativt mycket av
träningen.
En annan träningsform som också hade stor effekt på vältränade var träning med lågt
muskelglykogen. En timmes cykelarbete med lågt glykogen medförde nämligen en betydligt
större ökning av PGC-1α mRNA hos cyklister än träning med normalt glykogen. Den
klassiska synen att uthållighetsträning alltid bör utföras med välfyllda glykogenlager kan
därför ifrågasättas. Det skulle kunna vara så att det är fördelaktigt att utföra vissa träningspass
"låg" för att maximera mitokondriell tillväxt, fettmetabolism och muskulär aerob förmåga.
Det kanske mest betydelsefulla fyndet i denna avhandling var att muskelglykogen verkar ha
en mycket central roll vid regleringen av mitokondriell tillväxt, oberoende av träningsstatus
och träningens karaktär. Personer som hade låga nivåer av glykogen i sin lårmuskulatur hade
nämligen den starkaste aktiveringen av PGC-1α och detta samband sågs både hos vältränade
och otränade försökspersonerna oberoende av om de tränat kontinuerligt, intervallbetonat
eller en kombination av uthållighet och styrka.
Det går således inte att säga att en viss intensitet, duration eller typ av träning är optimal för
att stimulera tillväxten av mitokondrier utan resultaten i denna avhandling tyder snarare på att
det avgörande är att träna så pass hårt eller länge att delar av muskulaturen mer eller mindre
töms på glykogen.

49
ACKNOWLEDGEMENTS
I am sincerely grateful to all of you who have supported and helped me throughout this
process. Especially, I would like to thank:
Kent Sahlin, my supervisor, for guiding and supporting me through this long process and
for your deep understanding of exercise physiology, both at an applied and biochemical
level. In particular you have helped me improve my scientific writing skills and to
understand the importance of keeping things simple and focused. I appreciate our clear and
straight forward communication and I will miss our lunch discussions about research,
training and other important issues such as how to build a "friggebod".
Michail Tonkongi, my co-supervisor, for helping me when I was new at the lab and for
contributing with your expertise during several of my research projects. You have an
energy and work capacity that is out of the ordinary and you have been a great inspiration
to me during these years.
Björn Ekblom, for our great lunch discussions and for teaching me the Weil–Blakesley
chonchotome biopsy technique. You always have time to answer my questions and your
expertise and passion for exercise physiology and training has been very inspiring and
helpful to me. You have made me realize that exercise physiology is like everything else, it
goes in circles, and several things that you and others discovered in the 60th
and 70th
are
now discovered anew.
Eva Blomstrand, for our discussions and your valuable help and advice. You were the first
person that I meet at the Åstrandslaboratory and the one who introduced me to Kent. This
thesis would probably not exist if it wasn't for you.
Per Frank, my coworker and friend, for all the good times we have had and hopefully will
have. I am very thankful that you shared your expertise in Western blot with me and put up
with all of my questions. I especially enjoy our time together at different conferences and
meetings where research sometimes had to step aside for more important things like beer
and training.
Marcus Moberg, William Apró, Daniele Cardinale, my roommates and friends, for the
great times we have had and hopefully will have. Marcus, you are one of the most helpful
persons that I have ever met and your patience is amazing. William, you have been a great
sparring partner throughout the years and I am glad to see that even you have come to the
realization that small children simply cannot be locked into a wardrobe when being
annoying. Daniele, you have a passion for exercise physiology that is extraordinary and
your energy and positive attitude makes our laboratory an even greater workplace.

50
Marjan Pontén, for all your help with analysis, lab work, orders, etc. You have been
highly involved in most of my studies and I am very grateful for all the time and effort you
have put in.
Li Wang, for all the time you spent with me doing Real Time PCR and for the great time
we had in the lab.
Mikael Flockhart, for your valuable contributions to our studies. Your applied training
experience and knowledge has improved the quality of our research considerably.
Mikael Mattsson, for sharing your training expertise and for helping me with lectures and
presentations. You inspired me to start training on a more regular basis, something that I
have enjoyed much.
Örjan Ekblom, for all great discussions about training and for being a very helpful and
inspiring person. Johnny Nilsson, for introducing me to GIH and for listening and helping
me with training ideas and equipment. Janne Carlstedt, for being my mentor and very
inspiring teacher in the physical training course at Bosön. Karin Söderlund, for your help
with analysis and providing me with useful information. Elin Ekblom, for helping me with
my lectures and always being hungry around 11 am. Gustav Olsson, for being great
company at lunches and after works and for your excellent music recommendations. Jane
Saler Eriksson, for your positive attitude and great company. Robert Boushel, for proof
reading and figure 1B in this thesis, taking the time to answer my questions and sharing
your amazing research expertise. Mats Börjesson, for helping me with future research
ideas and for being such a positive and inspiring person. Peter Schantz, for introducing me
to some of your early work and for being a very helpful and positive person. Eva
Andersson, for our biopsy discussions and self torture experiments. P-O Åstrand, for the
times that I have joined you and Björn for lunch and been part of your interesting
discussions. Maria Ekblom, for great discussions and help with biomechanical issues.
Jens Westergren, for your valuable contribution to our study in Falun. Henrik Mascher,
for our work together and for the good company at the lab and at conferences. Filip
Larsen, for always having challenging questions and interesting theories. Tomas Schiffer,
for playing Raised Fist really loud in the lab. Frida Björkman, for sharing your applied
training skills and horrible bicycle crash pictures. Kerstin Hamrin, for helping me with
lectures and other practical issues. Kristjan Odsson, for helping me with lectures and
articles. Dan Wiorek, for encouragement and guidance.
Bengt Saltin and Henriette Pilegaard, my former supervisors at CMRC, for introducing
me to the field of exercise physiology and for all the knowledge that I gained during my
years in Copenhagen.

51
All subjects in the studies and friends that I convinced to "donate" muscle to my research.
Especially Christian Jonhammar and my brother Andreas Psilander who several times
let me take biopsies from both their thigh and calf muscles. I strongly encourage you to
keep up the training so that I can harvest more nice muscle samples in the future.
My father Kurt Psilander, for your constant support and interest in my research. For
convincing me to study hard and to chose a scientific university education.
My parents in law, Göran and Monica Wik, for your fantastic support and help with both
children and everyday practicalities. Without your help this thesis would have been finished
in 2030.
My lovely wife Maria Psilander, for your outstanding “endurance performance” when
putting up with a tired and grumpy husband and at the same time give birth to three lively
and wonderful boys. You are the love of my life.
And finally the financial supporters of this thesis: The Swedish National Center for
Research in Sports, the Swedish Research Council and the Swedish School of Sport and
Health Sciences.

52
REFERENCES
Andersen, P., and Henriksson, J. (1977). Training induced changes in the subgroups of
human type II skeletal muscle fibres. Acta Physiol Scand 99, 123-125.
Andersson, S.G., Karlberg, O., Canback, B., and Kurland, C.G. (2003). On the origin of
mitochondria: a genomics perspective. Philosophical transactions of the Royal Society of
London. Series B, Biological sciences 358, 165-177; discussion 177-169.
Aquilano, K., Vigilanza, P., Baldelli, S., Pagliei, B., Rotilio, G., and Ciriolo, M.R. (2010).
Peroxisome proliferator-activated receptor gamma co-activator 1alpha (PGC-1alpha) and
sirtuin 1 (SIRT1) reside in mitochondria: possible direct function in mitochondrial
biogenesis. J Biol Chem 285, 21590-21599.
Atherton, P.J., Babraj, J., Smith, K., Singh, J., Rennie, M.J., and Wackerhage, H.
(2005). Selective activation of AMPK-PGC-1alpha or PKB-TSC2-mTOR signaling can
explain specific adaptive responses to endurance or resistance training-like electrical muscle
stimulation. FASEB journal : official publication of the Federation of American Societies for
Experimental Biology 19, 786-788.
Baar, K. (2006). Training for endurance and strength: lessons from cell signaling. Med Sci
Sports Exerc 38, 1939-1944.
Baar, K. (2014). Nutrition and the adaptation to endurance training. Sports Med 44 Suppl 1,
S5-12.
Barnett, C., Carey, M., Proietto, J., Cerin, E., Febbraio, M.A., and Jenkins, D. (2004).
Muscle metabolism during sprint exercise in man: influence of sprint training. Journal of
science and medicine in sport / Sports Medicine Australia 7, 314-322.
Barth, E., Stammler, G., Speiser, B., and Schaper, J. (1992). Ultrastructural quantitation
of mitochondria and myofilaments in cardiac muscle from 10 different animal species
including man. J Mol Cell Cardiol 24, 669-681.
Bartlett, J.D., Hwa Joo, C., Jeong, T.S., Louhelainen, J., Cochran, A.J., Gibala, M.J.,
Gregson, W., Close, G.L., Drust, B., and Morton, J.P. (2012). Matched work high-
intensity interval and continuous running induce similar increases in PGC-1alpha mRNA,
AMPK, p38, and p53 phosphorylation in human skeletal muscle. J Appl Physiol (1985) 112,
1135-1143.
Bassett, D.R., Jr., and Howley, E.T. (2000). Limiting factors for maximum oxygen uptake
and determinants of endurance performance. Med Sci Sports Exerc 32, 70-84.
Bell, G.J., Syrotuik, D., Martin, T.P., Burnham, R., and Quinney, H.A. (2000). Effect of
concurrent strength and endurance training on skeletal muscle properties and hormone
concentrations in humans. Eur J Appl Physiol 81, 418-427.
53
Benton, C.R., Wright, D.C., and Bonen, A. (2008). PGC-1alpha-mediated regulation of
gene expression and metabolism: implications for nutrition and exercise prescriptions.
Applied physiology, nutrition, and metabolism = Physiologie appliquee, nutrition et
metabolisme 33, 843-862.
Bergmeyer, H.U., and Bernt, E. (1974). UV-assay with pyruvate and NADH. In Methods
of enzymatic analysis. H.U. Bergmeyer, ed. (New York: Chemie Weinheim), pp. 574-579.
Bergstrom, J. (1975). Percutaneous needle biopsy of skeletal muscle in physiological and
clinical research. Scand J Clin Lab Invest 35, 609-616.
Bishop, D., Jenkins, D.G., Mackinnon, L.T., McEniery, M., and Carey, M.F. (1999). The
effects of strength training on endurance performance and muscle characteristics. Med Sci
Sports Exerc 31, 886-891.
Bishop, D.J., Granata, C., and Eynon, N. (2014). Can we optimise the exercise training
prescription to maximise improvements in mitochondria function and content? Biochim
Biophys Acta 1840, 1266-1275.
Blair, S.N., Kohl, H.W., 3rd, Barlow, C.E., Paffenbarger, R.S., Jr., Gibbons, L.W., and
Macera, C.A. (1995). Changes in physical fitness and all-cause mortality. A prospective
study of healthy and unhealthy men. Jama 273, 1093-1098.
Bo, H., Zhang, Y., and Ji, L.L. (2010). Redefining the role of mitochondria in exercise: a
dynamic remodeling. Ann N Y Acad Sci 1201, 121-128.
Broberg, S., and Sahlin, K. (1989). Adenine nucleotide degradation in human skeletal
muscle during prolonged exercise. Journal of applied physiology 67, 116-122.
Burgomaster, K.A., Howarth, K.R., Phillips, S.M., Rakobowchuk, M., Macdonald,
M.J., McGee, S.L., and Gibala, M.J. (2008). Similar metabolic adaptations during exercise
after low volume sprint interval and traditional endurance training in humans. J Physiol 586,
151-160.
Burke, L.M. (2010). Fueling strategies to optimize performance: training high or training
low? Scand J Med Sci Sports 20 Suppl 2, 48-58.
Calvani, R., Joseph, A.M., Adhihetty, P.J., Miccheli, A., Bossola, M., Leeuwenburgh, C.,
Bernabei, R., and Marzetti, E. (2013). Mitochondrial pathways in sarcopenia of aging and
disuse muscle atrophy. Biological chemistry 394, 393-414.
Calvo, J.A., Daniels, T.G., Wang, X., Paul, A., Lin, J., Spiegelman, B.M., Stevenson,
S.C., and Rangwala, S.M. (2008). Muscle-specific expression of PPARgamma coactivator-
1alpha improves exercise performance and increases peak oxygen uptake. Journal of applied
physiology 104, 1304-1312.
Cavalier-Smith, T. (1987). The origin of eukaryotic and archaebacterial cells. Ann N Y
Acad Sci 503, 17-54.

54
Chwalbinska-Moneta, J., Kaciuba-Uscilko, H., Krysztofiak, H., Ziemba, A.,
Krzeminski, K., Kruk, B., and Nazar, K. (1998). Relationship between EMG blood lactate,
and plasma catecholamine thresholds during graded exercise in men. Journal of physiology
and pharmacology : an official journal of the Polish Physiological Society 49, 433-441.
Costill, D.L., Fink, W.J., and Pollock, M.L. (1976). Muscle fiber composition and enzyme
activities of elite distance runners. Med Sci Sports 8, 96-100.
Cunningham, J.T., Rodgers, J.T., Arlow, D.H., Vazquez, F., Mootha, V.K., and
Puigserver, P. (2007). mTOR controls mitochondrial oxidative function through a YY1-
PGC-1alpha transcriptional complex. Nature 450, 736-740.
Egan, B., Carson, B.P., Garcia-Roves, P.M., Chibalin, A.V., Sarsfield, F.M., Barron, N.,
McCaffrey, N., Moyna, N.M., Zierath, J.R., and O'Gorman, D.J. (2010). Exercise
intensity-dependent regulation of peroxisome proliferator-activated receptor coactivator-1
mRNA abundance is associated with differential activation of upstream signalling kinases in
human skeletal muscle. J Physiol 588, 1779-1790.
Ekblom-Bak, E., Hellenius, M.L., Ekblom, O., Engstrom, L.M., and Ekblom, B. (2009).
Fitness and abdominal obesity are independently associated with cardiovascular risk. Journal
of internal medicine 266, 547-557.
Esfarjani, F., and Laursen, P.B. (2007). Manipulating high-intensity interval training:
effects on VO2max, the lactate threshold and 3000 m running performance in moderately
trained males. Journal of science and medicine in sport / Sports Medicine Australia 10, 27-35.
Evertsen, F., Medbo, J.I., Jebens, E., and Gjovaag, T.F. (1999). Effect of training on the
activity of five muscle enzymes studied on elite cross-country skiers. Acta Physiol Scand
167, 247-257.
Gabbett, T.J., and Ullah, S. (2012). Relationship between running loads and soft-tissue
injury in elite team sport athletes. J Strength Cond Res 26, 953-960.
Gibala, M.J., Little, J.P., van Essen, M., Wilkin, G.P., Burgomaster, K.A., Safdar, A.,
Raha, S., and Tarnopolsky, M.A. (2006). Short-term sprint interval versus traditional
endurance training: similar initial adaptations in human skeletal muscle and exercise
performance. J Physiol 575, 901-911.
Gollnick, P.D., Piehl, K., and Saltin, B. (1974). Selective glycogen depletion pattern in
human muscle fibres after exercise of varying intensity and at varying pedalling rates. J
Physiol 241, 45-57.
Gray, M.W., Burger, G., and Lang, B.F. (1999). Mitochondrial evolution. Science 283,
1476-1481.
Hansen, A.K., Fischer, C.P., Plomgaard, P., Andersen, J.L., Saltin, B., and Pedersen,
B.K. (2005). Skeletal muscle adaptation: training twice every second day vs. training once
daily. Journal of applied physiology 98, 93-99.

55
Harris, R.C., Hultman, E., and Nordesjo, L.O. (1974). Glycogen, glycolytic intermediates
and high-energy phosphates determined in biopsy samples of musculus quadriceps femoris of
man at rest. Methods and variance of values. Scand J Clin Lab Invest 33, 109-120.
Henriksson, J. (1977). Training induced adaptation of skeletal muscle and metabolism
during submaximal exercise. J Physiol 270, 661-675.
Henriksson, J., and Reitman, J.S. (1976). Quantitative measures of enzyme activities in
type I and type II muscle fibres of man after training. Acta Physiol Scand 97, 392-397.
Henriksson, J., and Reitman, J.S. (1977). Time course of changes in human skeletal muscle
succinate dehydrogenase and cytochrome oxidase activities and maximal oxygen uptake with
physical activity and inactivity. Acta Physiol Scand 99, 91-97.
Hickson, R.C., Dvorak, B.A., Gorostiaga, E.M., Kurowski, T.T., and Foster, C. (1988).
Potential for strength and endurance training to amplify endurance performance. Journal of
applied physiology 65, 2285-2290.
Holloszy, J.O. (1967). Biochemical adaptations in muscle. Effects of exercise on
mitochondrial oxygen uptake and respiratory enzyme activity in skeletal muscle. J Biol Chem
242, 2278-2282.
Holloszy, J.O. (2008). Regulation by exercise of skeletal muscle content of mitochondria and
GLUT4. Journal of physiology and pharmacology : an official journal of the Polish
Physiological Society 59 Suppl 7, 5-18.
Hood, D.A. (2009). Mechanisms of exercise-induced mitochondrial biogenesis in skeletal
muscle. Applied physiology, nutrition, and metabolism = Physiologie appliquee, nutrition et
metabolisme 34, 465-472.
Hoppeler, H. (1986). Exercise-induced ultrastructural changes in skeletal muscle. Int J
Sports Med 7, 187-204.
Hoppeler, H. (1990). The different relationship of VO2max to muscle mitochondria in
humans and quadrupedal animals. Respiration physiology 80, 137-145.
Iaia, F.M., Hellsten, Y., Nielsen, J.J., Fernstrom, M., Sahlin, K., and Bangsbo, J. (2009).
Four weeks of speed endurance training reduces energy expenditure during exercise and
maintains muscle oxidative capacity despite a reduction in training volume. J Appl Physiol
(1985) 106, 73-80.
Jemiolo, B., and Trappe, S. (2004). Single muscle fiber gene expression in human skeletal
muscle: validation of internal control with exercise. Biochem Biophys Res Commun 320,
1043-1050.
Kang, C., and Li Ji, L. (2012). Role of PGC-1alpha signaling in skeletal muscle health and
disease. Ann N Y Acad Sci 1271, 110-117.

56
Karlsson, J., and Saltin, B. (1971). Diet, muscle glycogen, and endurance performance.
Journal of applied physiology 31, 203-206.
Kelly, D.P., and Scarpulla, R.C. (2004). Transcriptional regulatory circuits controlling
mitochondrial biogenesis and function. Genes & development 18, 357-368.
Kokkinos, P., Myers, J., Kokkinos, J.P., Pittaras, A., Narayan, P., Manolis, A., Karasik,
P., Greenberg, M., Papademetriou, V., and Singh, S. (2008). Exercise capacity and
mortality in black and white men. Circulation 117, 614-622.
Kubukeli, Z.N., Noakes, T.D., and Dennis, S.C. (2002). Training techniques to improve
endurance exercise performances. Sports Med 32, 489-509.
Laursen, P.B. (2010). Training for intense exercise performance: high-intensity or high-
volume training? Scand J Med Sci Sports 20 Suppl 2, 1-10.
Laursen, P.B., Blanchard, M.A., and Jenkins, D.G. (2002). Acute high-intensity interval
training improves Tvent and peak power output in highly trained males. Can J Appl Physiol
27, 336-348.
Laursen, P.B., Shing, C.M., Peake, J.M., Coombes, J.S., and Jenkins, D.G. (2005).
Influence of high-intensity interval training on adaptations in well-trained cyclists. J Strength
Cond Res 19, 527-533.
Leone, T.C., Lehman, J.J., Finck, B.N., Schaeffer, P.J., Wende, A.R., Boudina, S.,
Courtois, M., Wozniak, D.F., Sambandam, N., Bernal-Mizrachi, C., et al. (2005). PGC-
1alpha deficiency causes multi-system energy metabolic derangements: muscle dysfunction,
abnormal weight control and hepatic steatosis. PLoS biology 3, e101.
Little, J.P., Safdar, A., Bishop, D., Tarnopolsky, M.A., and Gibala, M.J. (2011). An acute
bout of high-intensity interval training increases the nuclear abundance of PGC-1alpha and
activates mitochondrial biogenesis in human skeletal muscle. Am J Physiol Regul Integr
Comp Physiol 300, R1303-1310.
Livak, K.J., and Schmittgen, T.D. (2001). Analysis of relative gene expression data using
real-time quantitative PCR and the 2(-Delta Delta C(T)) Method. Methods 25, 402-408.
Losnegard, T., and Hallen, J. (2014). Physiological differences between sprint- and
distance-specialized cross-country skiers. Int J Sports Physiol Perform 9, 25-31.
Losnegard, T., Mikkelsen, K., Ronnestad, B.R., Hallen, J., Rud, B., and Raastad, T.
(2011). The effect of heavy strength training on muscle mass and physical performance in
elite cross country skiers. Scand J Med Sci Sports 21, 389-401.
Lundberg, T.R., Fernandez-Gonzalo, R., Norrbom, J., Fischer, H., Tesch, P.A., and
Gustafsson, T. (2014). Truncated splice variant PGC-1alpha4 is not associated with exercise-
induced human muscle hypertrophy. Acta physiologica.

57
MacDougall, J.D., Hicks, A.L., MacDonald, J.R., McKelvie, R.S., Green, H.J., and
Smith, K.M. (1998). Muscle performance and enzymatic adaptations to sprint interval
training. J Appl Physiol (1985) 84, 2138-2142.
Mathai, A.S., Bonen, A., Benton, C.R., Robinson, D.L., and Graham, T.E. (2008). Rapid
exercise-induced changes in PGC-1alpha mRNA and protein in human skeletal muscle.
Journal of applied physiology 105, 1098-1105.
McBride, A., Ghilagaber, S., Nikolaev, A., and Hardie, D.G. (2009). The glycogen-
binding domain on the AMPK beta subunit allows the kinase to act as a glycogen sensor. Cell
metabolism 9, 23-34.
Miller, B.F., Fattor, J.A., Jacobs, K.A., Horning, M.A., Navazio, F., Lindinger, M.I., and
Brooks, G.A. (2002). Lactate and glucose interactions during rest and exercise in men: effect
of exogenous lactate infusion. J Physiol 544, 963-975.
Morton, J.P., Croft, L., Bartlett, J.D., Maclaren, D.P., Reilly, T., Evans, L., McArdle,
A., and Drust, B. (2009). Reduced carbohydrate availability does not modulate training-
induced heat shock protein adaptations but does upregulate oxidative enzyme activity in
human skeletal muscle. J Appl Physiol (1985) 106, 1513-1521.
Nordsborg, N.B., Lundby, C., Leick, L., and Pilegaard, H. (2010). Relative workload
determines exercise-induced increases in PGC-1alpha mRNA. Med Sci Sports Exerc 42,
1477-1484.
Ogata, T., and Yamasaki, Y. (1997). Ultra-high-resolution scanning electron microscopy of
mitochondria and sarcoplasmic reticulum arrangement in human red, white, and intermediate
muscle fibers. The Anatomical record 248, 214-223.
Olesen, J., Kiilerich, K., and Pilegaard, H. (2010). PGC-1alpha-mediated adaptations in
skeletal muscle. Pflugers Archiv : European journal of physiology 460, 153-162.
Paavolainen, L., Hakkinen, K., Hamalainen, I., Nummela, A., and Rusko, H. (1999).
Explosive-strength training improves 5-km running time by improving running economy and
muscle power. J Appl Physiol (1985) 86, 1527-1533.
Perry, C.G., Lally, J., Holloway, G.P., Heigenhauser, G.J., Bonen, A., and Spriet, L.L.
(2010). Repeated transient mRNA bursts precede increases in transcriptional and
mitochondrial proteins during training in human skeletal muscle. J Physiol 588, 4795-4810.
Pilegaard, H., Keller, C., Steensberg, A., Helge, J.W., Pedersen, B.K., Saltin, B., and
Neufer Section Sign, P.D. (2002). Influence of pre-exercise muscle glycogen content on
exercise-induced transcriptional regulation of metabolic genes. J Physiol 541, 261-271.
Ronnestad, B.R., Hansen, E.A., and Raastad, T. (2011). Strength training improves 5-min
all-out performance following 185 min of cycling. Scand J Med Sci Sports 21, 250-259.

58
Ronnestad, B.R., and Mujika, I. (2013). Optimizing strength training for running and
cycling endurance performance: A review. Scand J Med Sci Sports.
Ruas, J.L., White, J.P., Rao, R.R., Kleiner, S., Brannan, K.T., Harrison, B.C., Greene,
N.P., Wu, J., Estall, J.L., Irving, B.A., et al. (2012). A PGC-1alpha isoform induced by
resistance training regulates skeletal muscle hypertrophy. Cell 151, 1319-1331.
Russell, A.P., Foletta, V.C., Snow, R.J., and Wadley, G.D. (2014). Skeletal muscle
mitochondria: a major player in exercise, health and disease. Biochim Biophys Acta 1840,
1276-1284.
Sale, D.G., Jacobs, I., MacDougall, J.D., and Garner, S. (1990). Comparison of two
regimens of concurrent strength and endurance training. Med Sci Sports Exerc 22, 348-356.
Saltin, B., Henriksson, J., Nygaard, E., Andersen, P., and Jansson, E. (1977). Fiber types
and metabolic potentials of skeletal muscles in sedentary man and endurance runners. Ann N
Y Acad Sci 301, 3-29.
Santalla, A., Naranjo, J., and Terrados, N. (2009). Muscle efficiency improves over time
in world-class cyclists. Med Sci Sports Exerc 41, 1096-1101.
Scarpulla, R.C. (2008). Nuclear control of respiratory chain expression by nuclear
respiratory factors and PGC-1-related coactivator. Ann N Y Acad Sci 1147, 321-334.
Scarpulla, R.C. (2011). Metabolic control of mitochondrial biogenesis through the PGC-1
family regulatory network. Biochim Biophys Acta 1813, 1269-1278.
Scribbans, T.D., Edgett, B.A., Vorobej, K., Mitchell, A.S., Joanisse, S.D., Matusiak, J.B.,
Parise, G., Quadrilatero, J., and Gurd, B.J. (2014). Fibre-specific responses to endurance
and low volume high intensity interval training: striking similarities in acute and chronic
adaptation. PloS one 9, e98119.
Seiler, S. (2010). What is best practice for training intensity and duration distribution in
endurance athletes? Int J Sports Physiol Perform 5, 276-291.
Seiler, S., Haugen, O., and Kuffel, E. (2007). Autonomic recovery after exercise in trained
athletes: intensity and duration effects. Med Sci Sports Exerc 39, 1366-1373.
Shepley, B., MacDougall, J.D., Cipriano, N., Sutton, J.R., Tarnopolsky, M.A., and
Coates, G. (1992). Physiological effects of tapering in highly trained athletes. J Appl Physiol
(1985) 72, 706-711.
Sjodin, B., and Svedenhag, J. (1985). Applied physiology of marathon running. Sports Med
2, 83-99.
Soriano, F.X., Liesa, M., Bach, D., Chan, D.C., Palacin, M., and Zorzano, A. (2006).
Evidence for a mitochondrial regulatory pathway defined by peroxisome proliferator-
activated receptor-gamma coactivator-1 alpha, estrogen-related receptor-alpha, and mitofusin
2. Diabetes 55, 1783-1791.

59
Steinberg, G.R., Watt, M.J., McGee, S.L., Chan, S., Hargreaves, M., Febbraio, M.A.,
Stapleton, D., and Kemp, B.E. (2006). Reduced glycogen availability is associated with
increased AMPKalpha2 activity, nuclear AMPKalpha2 protein abundance, and GLUT4
mRNA expression in contracting human skeletal muscle. Applied physiology, nutrition, and
metabolism = Physiologie appliquee, nutrition et metabolisme 31, 302-312.
Stellingwerff, T., Spriet, L.L., Watt, M.J., Kimber, N.E., Hargreaves, M., Hawley, J.A.,
and Burke, L.M. (2006). Decreased PDH activation and glycogenolysis during exercise
following fat adaptation with carbohydrate restoration. American journal of physiology.
Endocrinology and metabolism 290, E380-388.
Stisen, A.B., Stougaard, O., Langfort, J., Helge, J.W., Sahlin, K., and Madsen, K.
(2006). Maximal fat oxidation rates in endurance trained and untrained women. Eur J Appl
Physiol 98, 497-506.
Stoggl, T., and Sperlich, B. (2014). Polarized training has greater impact on key endurance
variables than threshold, high intensity, or high volume training. Frontiers in physiology 5,
33.
Storen, O., Helgerud, J., Stoa, E.M., and Hoff, J. (2008). Maximal strength training
improves running economy in distance runners. Med Sci Sports Exerc 40, 1087-1092.
Taanman, J.W. (1999). The mitochondrial genome: structure, transcription, translation and
replication. Biochim Biophys Acta 1410, 103-123.
Tarnopolsky, M.A., Rennie, C.D., Robertshaw, H.A., Fedak-Tarnopolsky, S.N., Devries,
M.C., and Hamadeh, M.J. (2007). Influence of endurance exercise training and sex on
intramyocellular lipid and mitochondrial ultrastructure, substrate use, and mitochondrial
enzyme activity. Am J Physiol Regul Integr Comp Physiol 292, R1271-1278.
Tesch, P.A. (1988). Skeletal muscle adaptations consequent to long-term heavy resistance
exercise. Med Sci Sports Exerc 20, S132-134.
Thomson, J.A., Green, H.J., and Houston, M.E. (1979). Muscle glycogen depletion
patterns in fast twitch fibre subgroups of man during submaximal and supramaximal exercise.
Pflugers Archiv : European journal of physiology 379, 105-108.
Tonkonogi, M., Walsh, B., Svensson, M., and Sahlin, K. (2000). Mitochondrial function
and antioxidative defence in human muscle: effects of endurance training and oxidative
stress. J Physiol 528 Pt 2, 379-388.
Trifunovic, A., and Larsson, N.G. (2008). Mitochondrial dysfunction as a cause of ageing.
Journal of internal medicine 263, 167-178.
van Tienen, F.H., Praet, S.F., de Feyter, H.M., van den Broek, N.M., Lindsey, P.J.,
Schoonderwoerd, K.G., de Coo, I.F., Nicolay, K., Prompers, J.J., Smeets, H.J., et al.
(2012). Physical activity is the key determinant of skeletal muscle mitochondrial function in
type 2 diabetes. The Journal of clinical endocrinology and metabolism 97, 3261-3269.

60
Wang, L., and Sahlin, K. (2012). The effect of continuous and interval exercise on PGC-
1alpha and PDK4 mRNA in type I and type II fibres of human skeletal muscle. Acta
physiologica 204, 525-532.
Ward, S.R., Eng, C.M., Smallwood, L.H., and Lieber, R.L. (2009). Are current
measurements of lower extremity muscle architecture accurate? Clinical orthopaedics and
related research 467, 1074-1082.
Vega, R.B., Huss, J.M., and Kelly, D.P. (2000). The coactivator PGC-1 cooperates with
peroxisome proliferator-activated receptor alpha in transcriptional control of nuclear genes
encoding mitochondrial fatty acid oxidation enzymes. Molecular and cellular biology 20,
1868-1876.
Wilkinson, S.B., Phillips, S.M., Atherton, P.J., Patel, R., Yarasheski, K.E., Tarnopolsky,
M.A., and Rennie, M.J. (2008). Differential effects of resistance and endurance exercise in
the fed state on signalling molecule phosphorylation and protein synthesis in human muscle. J
Physiol 586, 3701-3717.
Vollestad, N.K., and Blom, P.C. (1985). Effect of varying exercise intensity on glycogen
depletion in human muscle fibres. Acta Physiol Scand 125, 395-405.
Vollestad, N.K., Vaage, O., and Hermansen, L. (1984). Muscle glycogen depletion patterns
in type I and subgroups of type II fibres during prolonged severe exercise in man. Acta
Physiol Scand 122, 433-441.
Wu, Z., Puigserver, P., Andersson, U., Zhang, C., Adelmant, G., Mootha, V., Troy, A.,
Cinti, S., Lowell, B., Scarpulla, R.C., et al. (1999). Mechanisms controlling mitochondrial
biogenesis and respiration through the thermogenic coactivator PGC-1. Cell 98, 115-124.
Ydfors, M., Fischer, H., Mascher, H., Blomstrand, E., Norrbom, J., and Gustafsson, T.
(2014). The truncated splice variants, NT-PGC-1alpha and PGC-1alpha4, increase with both
endurance and resistance exercise in human skeletal muscle. Physiol Rep 1, e00140.
Yeo, W.K., McGee, S.L., Carey, A.L., Paton, C.D., Garnham, A.P., Hargreaves, M., and
Hawley, J.A. (2010). Acute signalling responses to intense endurance training commenced
with low or normal muscle glycogen. Experimental physiology 95, 351-358.
Yeo, W.K., Paton, C.D., Garnham, A.P., Burke, L.M., Carey, A.L., and Hawley, J.A.
(2008). Skeletal muscle adaptation and performance responses to once a day versus twice
every second day endurance training regimens. J Appl Physiol (1985) 105, 1462-1470.
Zhang, Y., Uguccioni, G., Ljubicic, V., Irrcher, I., Iqbal, S., Singh, K., Ding, S., and
Hood, D.A. (2014). Multiple signaling pathways regulate contractile activity-mediated PGC-
1alpha gene expression and activity in skeletal muscle cells. Physiol Rep 2.

61