THE EFFECT OF EXHAUSTIVE EXERCISE ON LYMPHOCYTE …
58
THE EFFECT OF EXHAUSTIVE EXERCISE ON LYMPHOCYTE APOPTOSIS ANANTHAN CHETTY Submitted in partial fulfilment of the requirements for the degree Master of Medical Science (Sports Medicine) In the Department of Physiology Faculty of Health Sciences University of Natal 2001.
Transcript of THE EFFECT OF EXHAUSTIVE EXERCISE ON LYMPHOCYTE …
THE EFFECT OF EXHAUSTIVE EXERCISE
ON LYMPHOCYTE APOPTOSIS
ANANTHAN CHETTY
Submitted in partial fulfilment of the requirements for the degree
Master of Medical Science (Sports Medicine)
In the Department of Physiology
Faculty of Health Sciences
University of Natal
2001.

DECLARATION
This study represents original work by the author and has not been submitted in any
form to another University. Where use was made of the work of others it has been
duly acknowledged.
The research was carried out in the Department of Physiology of the Nelson R
Mandela Medical School under the supervision of Professor Maurice Mars
ALL LITERARY RESOURCES HAVE BEEN CORRECTLY REFERENCED AND
ACKNOWLEDGED.
DURBAN ----------------------------------------DAY OF -------------------------------------2001
2

DEDICATION
This work is dedicated to my loving family who supported me throughout my efforts.
My patients and my colleagues
3

ACKNOWLEDGEMENTS
My sincere thanks and appreciation to the following:
Professor Maurice Mars, Acting Head of Department of Physiology, University of
Natal
Anil Chuturgoon, Head of Division of Biochemistry, Department of Physiology
University of Natal.
Atishkar Ramautar, Division of Biochemistry, Department of Physiology, University
of Natal.
4

TABLE OF CONTENTS
Page no.
LIST OF FIGURES AND TABLES 6
ETHICS 8
ABSTRACT 9
CHAPTER 1
INTRODUCTION 10
CHAPTER 2
THE COMET ASSAY 15
MATERIALS AND METHODS 16
RESULTS 21
CHAPTER 3
FLOW CYTOMETRY 24
MA TERlALS AND METHODS 32
RESULTS 34
CHAPTER 4
EXERCISE TESTING 39
MATERIALS AND METHODS 42
RESULTS 44
CHAPTER 5
DISCUSSION AND CONCLUSION 45
REFERENCES 54
5

LIST OF FIGURES AND TABLES
Page no.
Fig 1 Simplified scheme on possible signals affecting apoptosis after exercise 13
Fig 2 Schematic drawing of the SCGE assay 19
Fig 3 White blood cells exhibiting increased DNA migration 21
Fig 3a Basal cells 21
Fig 3b Cells immediately after exercise 21
Fig 3c Cells 24 hours after exercise 21
Fig 3d Cells 48 hours after exercise 21
Fig 4 Average of tail moments in all test subjects over time 23
Fig Sa Percentage of apoptotic cells in test subjects 35
Fig 5b Percentage of necrotic cells in test subjects 35
Fig Sa Percentage of apoptosis in subject before exercise 36
Fig 5b Percentage of necrosis in subject before exercise 36
Fig 5c Percentage of apoptosis in subject immediately after exercise 37
Fig 5d Percentage of necrotic cells in subject immediately after exercise 37
Fig 5e Percentage of apoptosis in test subject after 24 hours 38
Fig Sf Percentage of necrosis in subject after 24 hours 38
Fig 5g Percentage of apoptosis in subjects 48 hours after exercise 39
Fig 5h Percentage of necrosis in subject after 48 hours of exercise 39
6

Table 1 The tail moments are measured in microns and expressed as a
mean and one standard deviation. expressed as the mean and
one standard deviation.
Table 2 Percentages of apoptosis and necrosis in test subjects at various
Page no.
22
time intervals 25
Table 3 The exercise protocol used for exercise testing to determine V02max 43
Table 4 Physical characteristics and results of the V02max test 44
7

ETHICS
This study was performed with the approval of the Ethics Committee of The
University of Natal.
8

ABSTRACT
Post exercise lymphocytopenia is a well documented phenomenon. Studies have
reported exercise induced DNA damage in leucocytes and have postulated a possible
link to apoptosis. Five subjects of differing fitness levels underwent a ramped
treadmill test to exhaustion. Venous sampling was undertaken before, immediately
post exercise, and 24 and 48 hours after exercise. Single cell gel electrophoresis
showed evidence of single strand DNA breaks (as evidenced by an increase in tail
moment measurements using the comet assay) in 100% oflymphocytes immediately
after exercise, and in the 24 hour and 48 hour post exercise samples. Flowcytometric
analysis oflymphocytes revealed a minimal amount of both apoptosis and necrosis at
all time intervals. Lymphocyte apoptosis has again been demonstrated after exercise,
however the percentage of apoptosis was a maximum of 4.8% at 24 hours. These
findings may in part account for the exercise induced lymphocytopenia and reduced
immunity demonstrated by numerous previous other studies.
9
1.1 Introduction
CHAPTER 1
EXERCISE AND APOPTOSIS
Exercise immunology has generated tremendous interest in the sports medical
fraternity in recent times and is in fact a sub discipline on its own. The relationship
between exercise intensity and the risk of upper respiratory tract infections has been
modelled in the form of a J-shaped curve (Niemann, 1994). Moderate exercise is
associated with a below average risk for upper respiratory tract infections whereas
prolonged high intensity exercise has been associated with an above average risk of
URTI's. This is associated with leucocyte subset changes with an acute bout of
exercise, where the concentrations of neutrophils are seen to increase during and after
exercise whereas lymphocyte numbers increase during exercise and decrease within a
2-4 hour period after exercise thus creating what is termed an open window period for
infection. It is postulated that apoptosis is the phenomenon by which immune status is
compromised and further that a single bout of high intensity exercise causes apoptosis
by lymphocyte DNA damage (Mars et ai, 1998).
Apoptosis or programmed cell death which first appeared in biochemical literature in
1972, is a critical process for the normal development of multicellular organisms. The
process is characterized by a unique and distinct set of structural changes. These
changes exhibited by cells entering programmed death by development are also
shared by cells dying in a wide variety of circumstances outside of development: T
cell killing, negative selection within the immune system, atrophy induced by
10
endocrine and other physiological stimuli, normal cell turnover in many tissues, and
in tumours and normal tissues following exposure to the appropriate (low) doses of
ionising radiation, chemotherapy and even hypoxia (Wyllie et al., 1997).
Analysis of cells using electron microscopy has enabled elucidation of morphological
changes that occur during apoptosis. These include chromatin condensation,
cytoplasmic shrinkage and plasma membrane shrinkage (Strasser et al. , 2000). Blebs
form and bud of the cell. The blebs are membrane-invested extensions of cytosol that
are usually devoid of organelles and are reversibly extruded and resorbed (Wyllie et
al., 1997). Following this, the cells experience an irreversible condensation of
cytoplasm, accompanied by an increase in cell density, close aggregation of
cytoplasmic organelles and condensation of the nuclear chromatin to form dense
granular caps that underlie the nuclear membrane.
Apoptotic cells are rapidly phagocytosed by their viable neighbours or specialist
phagocytes. Another characteristic feature of apoptosis is that the dying cells
disappear rapidly from the tissue without the generation of any inflammatory
response. Visible changes of a cell undergoing apoptosis using light microscopy,
occur within a few hours at most.
All of these changes contrast the features of necrosis. Changes associated with a cell
undergoing necrotic death are, the swelling of the cell, cytosolic as well as nuclear
structural changes as well as a conservation of euchromatin and nuclear pores. The
cell ultimately ruptures and the cytosolic contents are released into the extracellular
11

space, where a significant percentage of these elicit an inflammatory reaction
including chemotaxis of neutrophil polymorphs.
Over the past few years the field of apoptosis has found application many different
areas and ahs been reported in several thousand of scientific publications. Recent
advances have revealed that mitochondria probably playa central regulatory role in
the field of apoptosis particularly through the cytochrome c pathway. The release of
cytochrome c from mitochondria into the cytosol is an early apoptotic event.
Cytosolic cytochrome c will bind to apoptosis protease-activating factor (Apaf-l) and
ATP. This complex is capable of activating caspase-9, which is responsible for
initiating the proteolytic cascade of events resulting in apoptosis (Green and Reed,
1998). Also, mitochondria and radical species are intimately involved in the
programmed cell death that occurs during aging and exercise. Increased oxidative
stress from radical oxygen species and reactive nitrogen species changes the cellular
redox potentials, depletes glutathione, and decreases reducing equivalents like NADP
and NADPH. These intracellular changes are sufficient to induce the formation of
mitochondrial permeability transition pores, leading to the subsequent release of
cytochrome c and the activation of the caspase cascade.
12
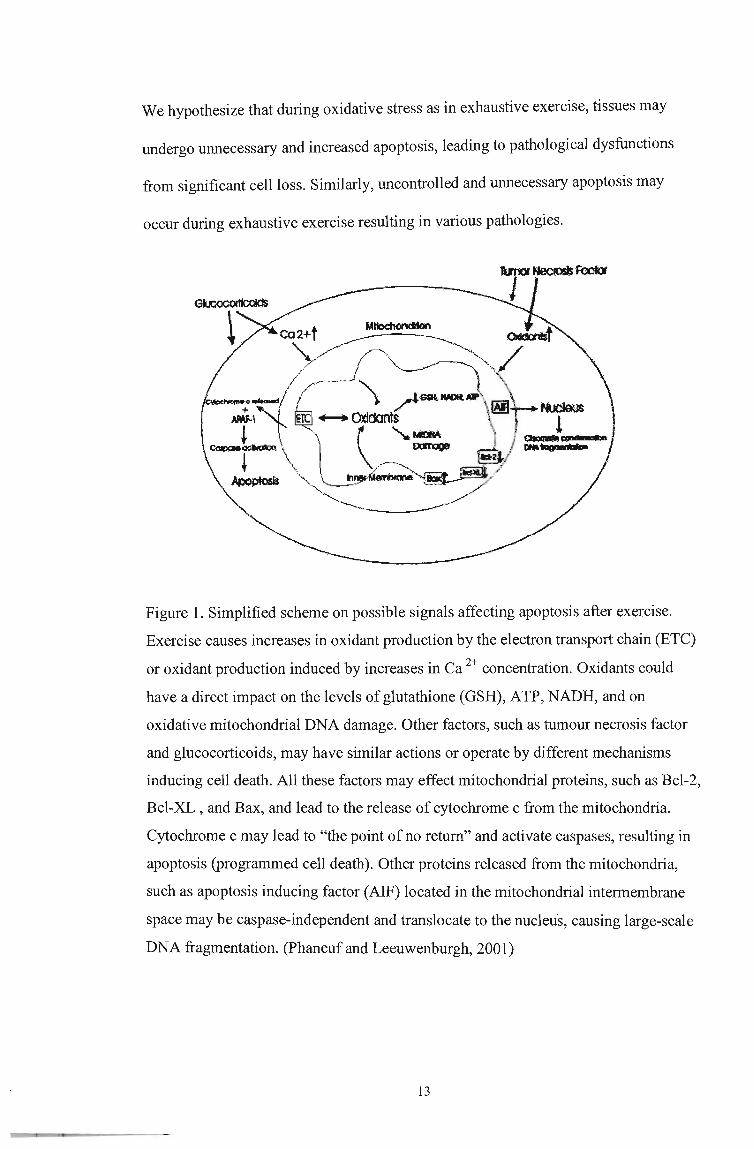
We hypothesize that during oxidative stress as in exhaustive exercise, tissues may
undergo unnecessary and increased apoptosis, leading to pathological dysfunctions
from significant cell loss. Similarly, uncontrolled and unnecessary apoptosis may
occur during exhaustive exercise resulting in various pathologies.
Figure 1. Simplified scheme on possible signals affecting apoptosis after exercise.
Exercise causes increases in oxidant production by the electron transport chain (ETC)
or oxidant production induced by increases in Ca 2+ concentration. Oxidants could
have a direct impact on the levels of glutathione (GSH), ATP, NADH, and on
oxidative mitochondrial DNA damage. Other factors, such as tumour necrosis factor
and glucocorticoids, may have similar actions or operate by different mechanisms
inducing cell death. All these factors may effect mitochondrial proteins, such as Bcl-2,
Bcl-XL , and Bax, and lead to the release of cytochrome c from the mitochondria.
Cytochrome c may lead to "the point of no return" and activate caspases, resulting in
apoptosis (programmed cell death). Other proteins released from the mitochondria,
such as apoptosis inducing factor (AIF) located in the mitochondrial intermembrane
space may be caspase-independent and translocate to the nucleus, causing large-scale
DNA fragmentation. (Phaneuf and Leeuwenburgh, 200 1)
13
To date only one study by Mars et al. , (1998) has demonstrated a possible link to
lymphocyte DNA damage (apoptosis) associated with a single bout of high intensity.
The object of our study was to determine the effect of a single bout of high intensity
exercise on lymphocyte DNA.
14

2.1 Introduction
CHAPTER 2
THE COMET ASSAY
The single cell gel electrophoresis assay is an attractive and unique technique being
employed increasingly in biological systems for the evaluation of DNA damage
(Allah et at., 1999). It is a rapid sensitive and relatively inexpensive method of
determining DNA damage on a single cell basis.
Techniques, which permit the sensitive detection of DNA damage in studies of
environmental toxicology, are constantly sought after. The effects of environmental
toxicants are often tissue and cell type specific and therefore require detection of
DNA damage in individual cells (Singh et at., 1988).
This assay has previously been used in both in vitro and in vivo studies to investigate
the effects of various agents on DNA damage in a number of mammalian cells
(Hartmann et at., 1994). Due to its simplicity, sensitivity and requirement for small
sample amounts the SCGE technique has found widespread applications in
genotoxicity testing DNA damage and repair studies, and biomonitoring.
The SCGE technique has been successfully used in screening human blood samples
for susceptibility to radiation and various chemical mutagens (Vijayalaxmi et at.,
1992). It has also been applied to the study of peripheral blood cells from volunteers
after physical exercise. The results exhibited a substantial increase in DNA damage
15
after specific time intervals after physical exercise (Hartmann et ai., 1994). Concordet
et aI., (1993) linked exercise and leucocyte apoptosis in their study which used DNA
agarose gel electrophoresis to investigate exercise induced thymocyte involution in
rats. In this study glucocorticoid receptor mediated thymocyte apoptosis was shown to
occur following 2.5-5 hour treadmill runs to exhaustion.
The detection of the DNA breaks are facilitated by alkaline electrophoresis of cells
embedded in agarose and lysis by detergents of high salt concentration (Vijayalaxmi
et ai., 1992). Breaks in DNA strands migrate in the direction ofthe anode producing
an image resembling that of a comet. Furthermore in addition to measuring DNA
strand breakage the alkali comet assay measures alkali labile sites of intermediates in
base or nucleotide - excision repair (Gedik et ai., 1992; Green et ai., 1992). The
sensitivity of the comet assay in the evaluation of DNA damage depends on accurate
and reproducible measurement of DNA in the comet head and tail regions (Olive et
ai., 1992).
The aim of the present study was to assess whether a single bout of high intensity
exercise causes lymphocyte DNA damage in healthy individuals and to assess
whether there is any correlation between DNA damage and apoptosis
2.2 Materials and Method
The chemicals used in the experiments were purchased from the following suppliers:
Low melting point agarose and ethidium bromide from Roche biochemicals; Triton X
from Sigma Chemicals Co. Ltd., US; Tris and Dimethyl Sulphoxide (DMSO) from
16
Merck; Ethylenediaminetetra-acetic Acid (EDTA) and Sodium Chloride (NaCI) from
Capital Suppliers; Sodium Hydroxide (NaOH) from Saarchem.
2.2.1 Blood preparation and treatments
Whole blood was collected in EDT A Vacutainer tubes by venopuncture from donors.
Blood samples were immediately processed for the SCGE assay.
2.2.2 Slide Preparation
The procedure described for the SCGE assay by Singh et at., (1988) was followed
with minor modifications: 200 microlitres of 0.75% agarose diluted in Ca++ and Mg++
free PBS buffer was added to frosted microscope slides, immediately covered with
coverslips and kept for 10 minutes in a refrigerator to solidify. Coverslips were
subsequently removed and 10j..l1 of whole blood mixed with 90j..l1 of 0.5% low melting
point agarose (LMPA) at 37% were added to the first layer. The slides were
immediately covered with a coverslip and kept in the refrigerator for another 5
minutes to solidify the LMP A. The coverslips were again removed and a final top
layer of 75j..l1 of 0.5% LMPA at 37°C was added and again refrigerated for a further 5
minutes. Coverslips were then carefully removed and the slides were immersed in a
trough of cold lysing solution (2.5 M NaCI, 100mM EDT A, I % Triton X-I 00, 1 %
Tris and 10% Dimethyl sulphoxide) which was fre~hly made up. Slides were kept at
4°C for 1 hour.
17

2.2.3 Electrophoresis
After the lysis step the slides were removed and placed in an electrophoresis tank. The
tank was carefully filled with freshly made alkaline buffer (300mM NaOH and ImM
EDTA, pH 13.0) to a level of approximately 0.30mm above the slides. Slides were
allowed to stand in the electrophoresis buffer for 20 minutes to allow for DNA
unwinding before electrophoresis. Electrophoresis was conducted for the next 35
minutes at 25v and 300mA using a BioRad compact power supplier. The above steps
were conducted in dim light to prevent additional DNA damage.
2.2.4 Staining
After electrophoresis the slides were removed and washed with 0.4% Tris pH 7.5.
This was done to remove alkali and detergents that would interfere with the ethidium
bromide staining. The slides were allowed to stand in Tris for 5 minutes and this step
was repeated thrice. Finally, the slides were stained by placing 40fll of20flg/ml
ethidium bromide solution on each slide and then covering them with a coverslip. A
schematic drawing of the SCGE assay is shown in figure 2.
18
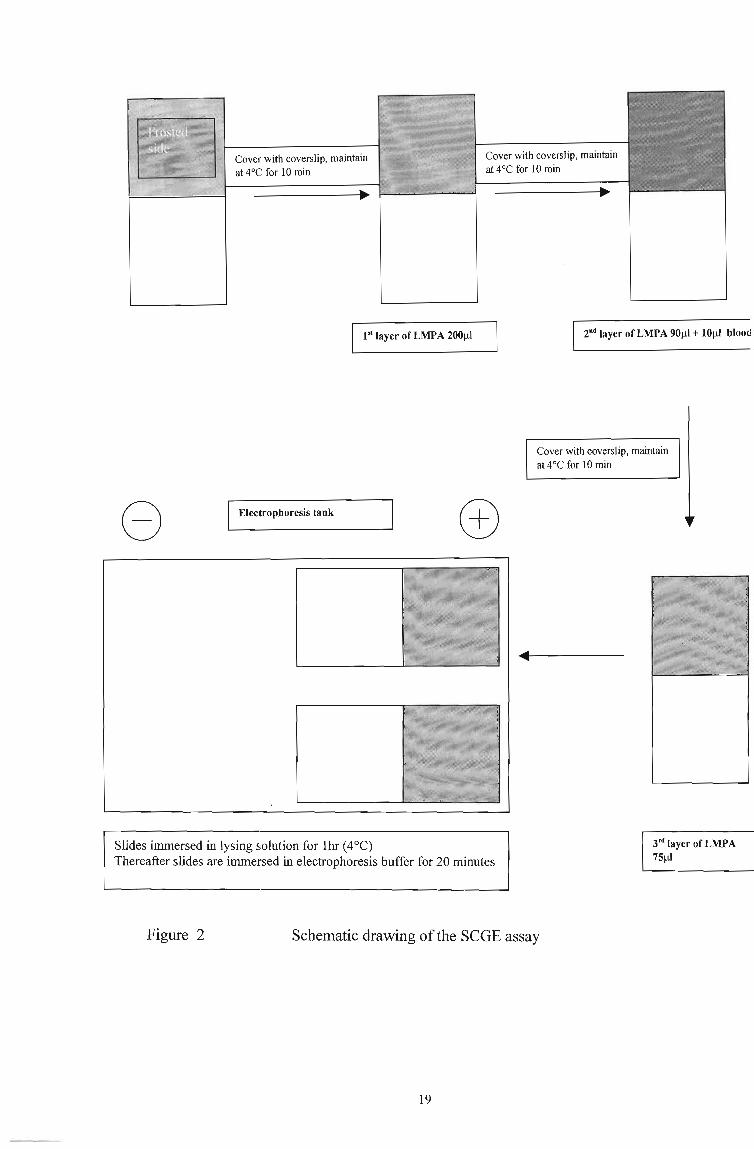
8
Cover with coverslip, maintain at 4°C for 10 min
1 st layer of LMP A 200111
Electrophoresis tank
Slides immersed in lysing solution for Ihr (4°C) Thereafter slides are immersed in electrophoresis buffer for 20 minutes
Cover with coverslip, maintain at 4°C for 10 min
2nd layer ofLMPA 90111 + 10111 blood
Cover with coverslip, maintain at 4°C for 10 min
3'd layer ofLMPA 75111
Figure 2 Schematic drawing of the SCGE assay
19
2.2.5 Image analysis
Observations of cells were made using a Nikon E-400 fluorescent microscope,
equipped with an excitation filter of 450-490nm and a barrier filter of 520nm. Images
of single cells were taken at 200x magnification using Scion image software. DNA
migration lengths were determined on a negative image by measuring the nuclear
DNA and the migrating DNA in 50 randomly selected cells (25 from each replicate).
2.2.6 Statistical analysis
Data were represented as the mean tail moment for the cells plus or minus the
standard deviation within the various time intervals. Time intervals were compared
using nonparametric analysis of variance with post hoc testing using Dunn's multiple
comparisons test.
20
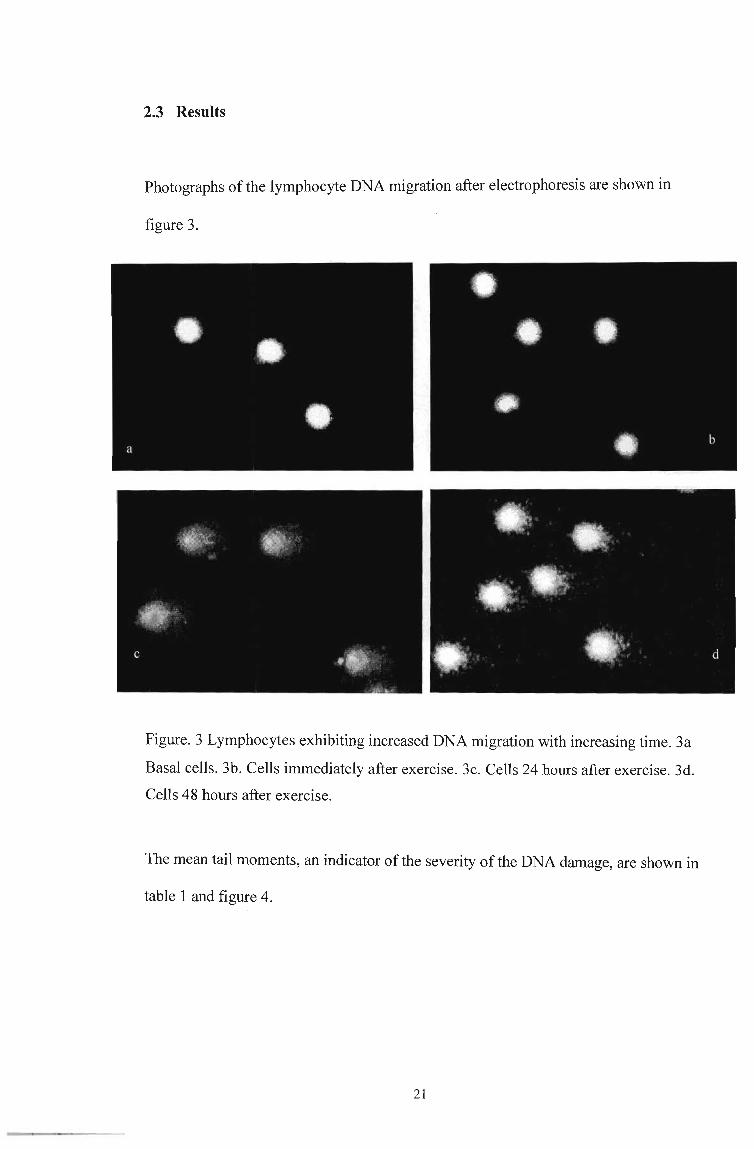
2.3 Results
Photographs ofthe lymphocyte DNA migration after electrophoresis are shown in
figure 3.
Figure. 3 Lymphocytes exhibiting increased DNA migration with increasing time. 3a
Basal cells. 3b. Cells immediately after exercise. 3c. Cells 24 hours after exercise. 3d.
Cells 48 hours after exercise.
The mean tail moments, an indicator of the severity of the DNA damage, are shown in
table 1 and figure 4.
21

Table 1. The tail moments are measured in microns and expressed as a mean and one
standard deviation. expressed as the mean and one standard deviation. Demonstration
of DNA damage induced in human lymphocytes by exercise using the SCGE
technique. Data are based on 50 randomly counted cells (25 from each of two
replicate slides) per time interval.
Pre- Post- hr after 48hr after exercise exercise exercise exercise
Su ect 1 .5 32.7 + 2.7 38.5 + 3.8 26.1+ 2.0 - -
Subject 2 36.3 + 2.7 37.6 + 6.7 52.6 + 4.7 90.0 + 13.0 - -
Subject 3 36.8 + 3.3 36.9 + 4.3 52.4 + 4.4 68.4+ 10.1 - - - -
Subject 4 42.4 7.1 32.4 + 2.8 49.4 + 6.0 84.9 + 9.6 - - -
Subject 5 35 3 35.6 + 3.2 51.0 + 3.6 40.1 + 6.8 - - -
The mean data for each time point for all subjects were compared using a
nonparametric analysis of variance (AN OVA) (Kruskal- Wallis test) with post hoc
testing using Dunn's multiple comparisons test. Non-parametric tests were used
because the Bartlett's test showed the standard deviations to be significantly different
(p<O.OOOl) and the data sets were shown to be non Gaussian in distribution according
to the method of Kolmogorov and Smimov.
22

100
90
80
Ei 70 e .... 60 = ...
50 Ei 0 * ~ 40 .;
30 ,....
20
10
0
I o Pre I!!I Post 0 24 hr Post .48 hr Post I
Figure 4. Average of tail moments in all test subjects over time.
ANOVA was significant (p<O.OOOl). Post hoc testing showed significant
increases in mean tail moments, 24 and 48 hours after testing (** =
p<O.OOl) and a significant decrease immediately after exercise (* =
p<O.Ol). There was no difference between the 24 hour and 48 hour post
exercise samples.
23

3.1 Introduction
CHAPTER 3
FLOW CYTOMETRY
Cytometry refers to the measurement of physical and/ or chemical characteristics of
cells. Flow cytometry is a process in which such measurements are made while the
cells or particles pass, preferably in a single file, through the measuring apparatus in a
fluid stream (Shapiro, 1988).
A number of physical factors such as acoustic, electronic, optical as well as radiation
sensors have, at one time or the other been incorporated into flow cytometers. Optical
measurements are the most common at present. It is often useful to employ flow
cytometry even in dealing with highly homogenous populations of particles for the
purpose of counting the number of particles present in a given volume of sample.
Most of the present interest in, and applications of, flow cytometers, however derive
from the utility of the apparatus for the definition and quantification of heterogeneity
in cell popUlations (Shapiro, 1988).
Amongst the most demanding applications of flow cytometry are the identification
and subsequent characterization of sUbpopulations of cells. Both flow sorting and
multi-parameter analysis are used for this purpose. Flow sorting utilizes electrical
and/or mechanical means to divert cells with pre-selected characteristics from the
main stream, and can be used to isolate pure populations of viable cells with more
24
homogenous characteristics than could be obtained by any other means. Flow sorting
is particularly useful in circumstances in which further characterization of the selected
cells requires short- or long-term maintenance in culture or analytical procedures
which cannot be accomplished by flow cytometry. In other cases, multi-parameter
analysis may allow the desired information about a cell population to be obtained
without physically isolating the cells (Shapiro, 1988).
Multi-parameter analysis in which values of one (or more) parameter(s) are examined
to determine whether to include or exclude values of another parameter from the same
cell in a tabulation or distribution, is referred to as gated analysis.
When several parameters are measured, it is frequently possible to identify cell
subpopulations without demonstrating the presence of cell-specific chemical markers.
The relative light scattering and colour discriminated fluorescence of the microscopic
particles is measured and analysis and differentiation of cells is based on size and
granularity, and whether the cell is carrying fluorescent molecules either in the form
of antibodies or dyes. The result of the cell passing through the laser beam is a
scattering of light in all directions and that light scattered in the forward direction is
proportional to the square of a sphere and so to the size of the cell or the particle.
Light may enter the cell and be reflected and refracted by the nuclear contents of the
cell, thus the 900 light scatter may be considered proportional to the granularity of the
cell.
In blood leucocyte populations containing lymphocytes, monocytes, and granulocytes,
measurements of light scattered by cells at two different angles (less than 20,
25
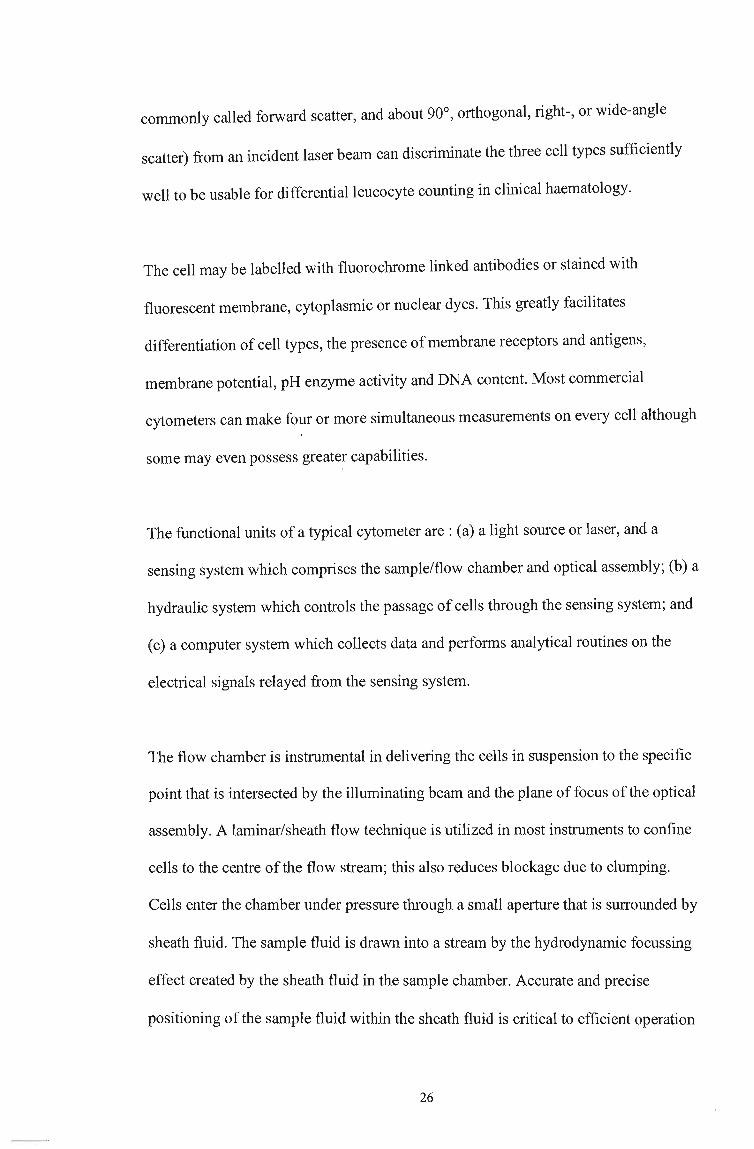
commonly called forward scatter, and about 90°, orthogonal, right-, or wide-angle
scatter) from an incident laser beam can discriminate the three cell types sufficiently
well to be usable for differential leucocyte counting in clinical haematology.
The cell may be labelled with fluorochrome linked antibodies or stained with
fluorescent membrane, cytoplasmic or nuclear dyes. This greatly facilitates
differentiation of cell types, the presence of membrane receptors and antigens,
membrane potential, pH enzyme activity and DNA content. Most commercial
cytometers can make four or more simultaneous measurements on every cell although
some may even possess greater capabilities.
The functional units of a typical cytometer are: (a) a light source or laser, and a
sensing system which comprises the samplelflow chamber and optical assembly; (b) a
hydraulic system which controls the passage of cells through the sensing system; and
(c) a computer system which collects data and performs analytical routines on the
electrical signals relayed from the sensing system.
The flow chamber is instrumental in delivering the cells in suspension to the specific
point that is intersected by the illuminating beam and the plane of focus of the optical
assembly. A laminar/sheath flow technique is utilized in most instruments to confine
cells to the centre of the flow stream; this also reduces blockage due to clumping.
Cells enter the chamber under pressure through a small aperture that is surrounded by
sheath fluid. The sample fluid is drawn into a stream by the hydrodynamic focussing
effect created by the sheath fluid in the sample chamber. Accurate and precise
positioning of the sample fluid within the sheath fluid is critical to efficient operation
26

of the flow cytometer and adjustment of the relative sheath and sample pressures
ensures that cells pass one by one through the detection point (Shapiro, 1988).
In laser based flow cytometers, where fluorescence is measured at right angles to the
illuminating beam, chambers may comprise flattened cuvettes to minimize unwanted
light reflections. Water cooled laser sources in the range 50mW to 5W output power
have been used for fluorescence and light scatter measurements. Air-cooled lasers
with a maximum of 100m W output are now more commonly used in commercial
instruments.
The advantage of lasers is that they are capable of producing an intense beam of
monochromatic light which in some systems may be tuned to several different
wavelength. The most commonly used lasers in flow cytometry are: argon lasers,
which produces light between the wavelengths 351 and 528nm: krypton lasers, which
produce light between 350 and 799nm; helium-neon lasers, which produce lines at
325-441nm (Shapiro, 1988).
3.2 Fluorescence analysis
Fluorescence is excited as cells pass through the laser excitation beam, and this
fluorescence is collected by optics at 90° to the incident beam. A barrier blocks laser
excitation illumination, while dichroic mirrors and appropriate filters serve to select
the required wavelengths of fluorescence for measurement. Photo-multiplier tubes are
used to convert the photons of light falling upon the detectors to an electrical impulse,
and this signal is processed by an analogue-digital A-D converter, which changes the
27
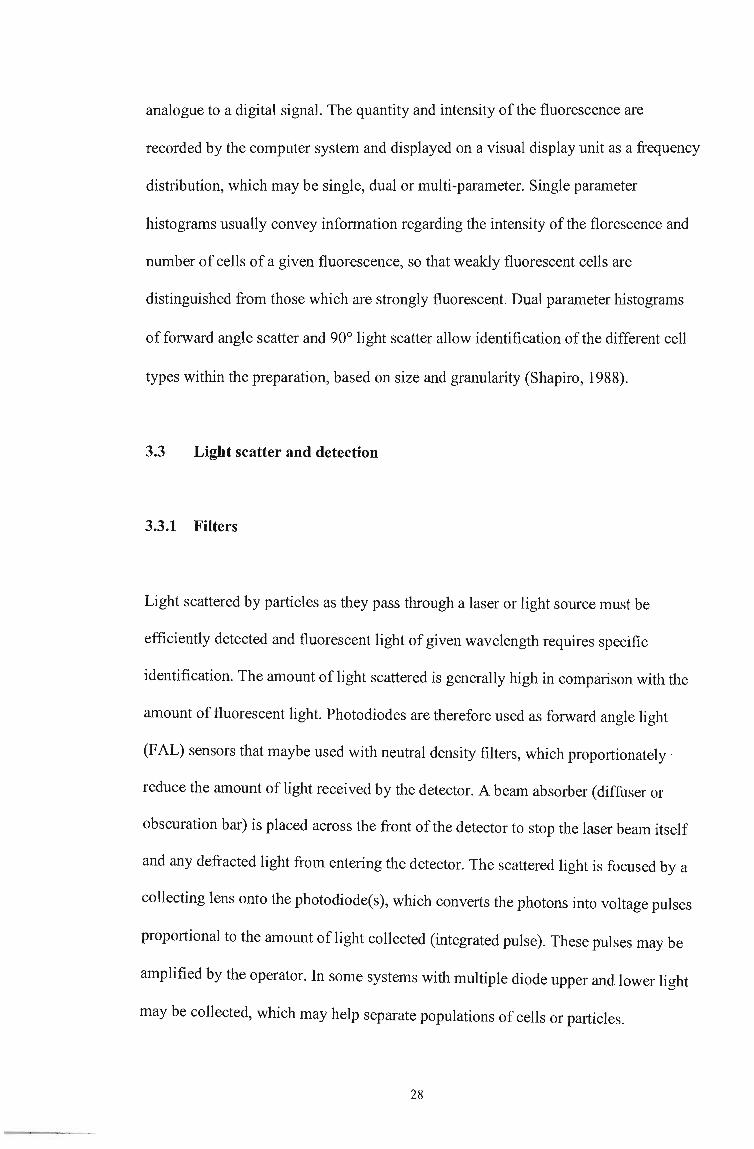
analogue to a digital signal. The quantity and intensity of the fluorescence are
recorded by the computer system and displayed on a visual display unit as a frequency
distribution, which may be single, dual or multi-parameter. Single parameter
histograms usually convey information regarding the intensity of the florescence and
number of cells of a given fluorescence, so that weakly fluorescent cells are
distinguished from those which are strongly fluorescent. Dual parameter histograms
of forward angle scatter and 90° light scatter allow identification of the different cell
types within the preparation, based on size and granularity (Shapiro, 1988).
3.3 Light scatter and detection
3.3.1 Filters
Light scattered by particles as they pass through a laser or light source must be
efficiently detected and fluorescent light of given wavelength requires specific
identification. The amount of light scattered is generally high in comparison with the
amount of fluorescent light. Photodiodes are therefore used as forward angle light
(F AL) sensors that maybe used with neutral density filters, which proportionately
reduce the amount oflight received by the detector. A beam absorber (diffuser or
obscuration bar) is placed across the front of the detector to stop the laser beam itself
and any defracted light from entering the detector. The scattered light is focused by a
collecting lens onto the photodiode(s), which converts the photons into voltage pulses
proportional to the amount oflight collected (integrated pulse). These pulses may be
amplified by the operator. In some systems with multiple diode upper and lower light
may be collected, which may help separate populations of cells or particles.
28

Fluorescence detectors are usually placed at right angles to the laser beam and sample
stream. Stray light is excluded by an obscuration bar in front of an asperic (objective)
lens, which collects the light and refracts it into a parallel beam. To detect the
components of the beam, filters and mirrors are used to remove unwanted
wavelengths oflight and direct light to the correct detector(s).
Typically, the first filter used eliminates laser light that still may have passed through.
This light may then be diverted to a beam splitter or a dichroic mirror. This mirror
reflects light in one band of wavelengths (usually long) while allowing another band
to pass through (usually short) it should be noted that there is no direct cut-offhere
between reflection and transmission. There is a middle band of wavelengths that will
do both. For this reason, the colour components are passed through other filters before
entering the director. These filters remove the unwanted wavelengths and allow the
desired wavelengths to pass to the director. These filters are called band-pass and are
designated by whether they transmit long wavelengths (long pass) or shorter
wavelengths (short pass). They may be tenned by the centre wavelength and band
widths. The sensors used are photon multiplier tubes (PMTs). These tubes serve as
detectors and also amplifiers of the weak fluorescent signals. These tubes have their
own high voltage powers supplies, which provide the boost needed to amplify the
signal internally within the PMT. The amount of high voltage and therefore the
amplification is adjustable by the operator. A second amplification, also operator
controlled, may be made on the PMT signal external to the PMT. PMTs are used only
under weak light conditions as they may be damaged by high intensity light such as
nonnal room light.
29

3.3.1.1 Filter sets.
Filters are used in sets, usually pairs of band-pass filters with a dichroic filter or beam
splitter. Filter 1 is an excitation filter which is used to select a specific wavelength
from the broad spectrum of light to produce a monochromatic illumination
corresponding to the flourophor's absorption band. Filter 2 is an emission filter which
blocks the excitation and emission filters. Such light originating from the light source
would either be erroneously observed as fluorescence or would make a coloured,
rather than black, background. This is termed spectral overlap or filter crosstalk. This
very low transmission may be measured spectrophotometric ally and should not
exceed 0.0001% or 10-6 (Shapiro, 1988).
3.3.2 Detection of apoptotic cells by light scatter analysis
The intersection of a cell with the light of a laser beam in a flow cytometer results in
light scatter. Analysis ofthis scattered light provides information on the cell size and
structure.
The forward light scatter is associated with cell size while the light measured at right
angle to the laser beam (side scatter) correlates with granularity, refractiveness, and
the ability of the intracellular structures to reflect the light (Gorczyca et at., 2000).
During the process of death this inherent ability of the cell to scatter light is altered.
This is reflected in the morphological changes such as cell swelling or shrinkage,
30
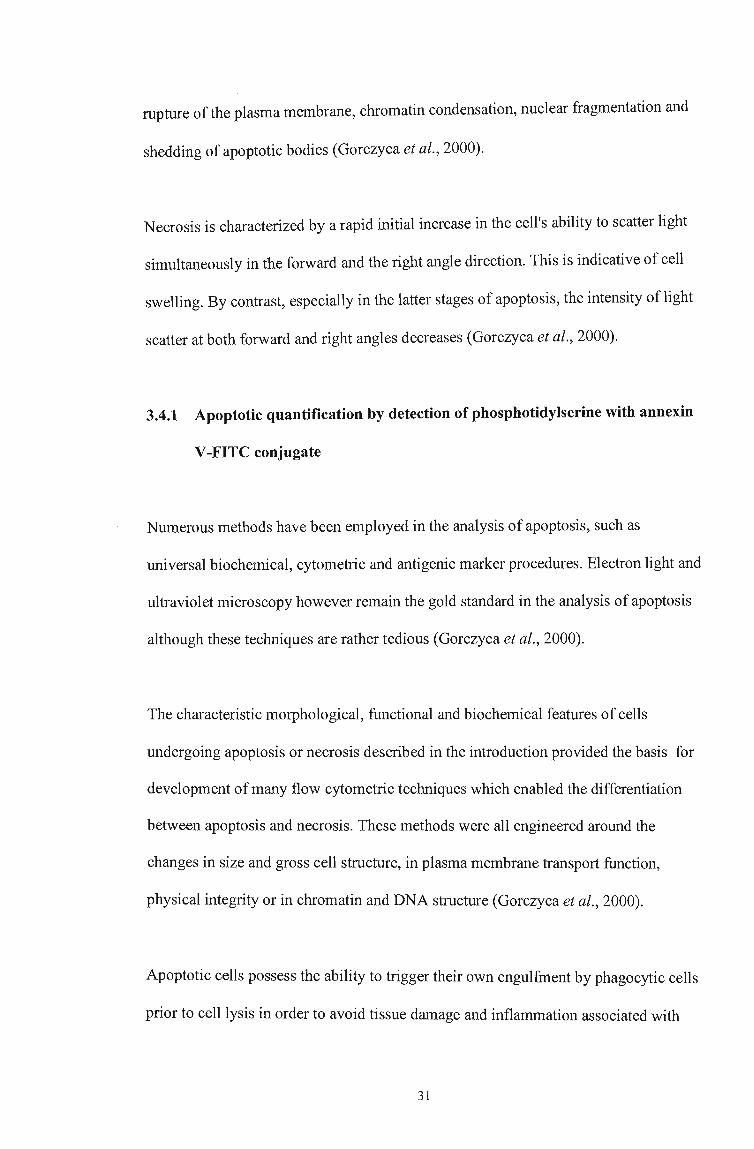
rupture of the plasma membrane, chromatin condensation, nuclear fragmentation and
shedding of apoptotic bodies (Gorczyca et al., 2000).
Necrosis is characterized by a rapid initial increase in the cell's ability to scatter light
simultaneously in the forward and the right angle direction. This is indicative of cell
swelling. By contrast, especially in the latter stages of apoptosis, the intensity of light
scatter at both forward and right angles decreases (Gorczyca et al., 2000).
3.4.1 Apoptotic quantification by detection of phosphotidylserine with annexin
V -FITC conjugate
Numerous methods have been employed in the analysis of apoptosis, such as
universal biochemical, cytometric and antigenic marker procedures. Electron light and
ultraviolet microscopy however remain the gold standard in the analysis of apoptosis
although these techniques are rather tedious (Gorczyca et al., 2000).
The characteristic morphological, functional and biochemical features of cells
undergoing apoptosis or necrosis described in the introduction provided the basis for
development of many flow cytometric techniques which enabled the differentiation
between apoptosis and necrosis. These methods were all engineered around the
changes in size and gross cell structure, in plasma membrane transport function,
physical integrity or in chromatin and DNA structure (Gorczyca et ai., 2000).
Apoptotic cells possess the ability to trigger their own engulfment by phagocytic cells
prior to cell lysis in order to avoid tissue damage and inflammation associated with
31

necrosis. Timeous generation of recognition signals on the surface of apoptosing cells
is therefore a key event in the apoptotic program (Verhoeven et at., 1995).
Phospholipids found within the plasma membrane are asymmetrically distributed
between the inner and outer leaflets of the plasma membrane. In live cells
phosphatidylserine (PS) is almost exclusively observed on the inner surface ofthe
membrane.
It has recently been shown that the loss of phospholipid asymmetry leading to
exposure of PS on the outside of the plasma membrane is an early event in apoptosis.
3.5 Materials and method
3.5.1 Blood preparation and treatments
Whole blood was collected in lithium heparin Vacutainer tubes by venopuncture from
subjects. Blood samples were immediately processed for flow cytometric analysis.
3.5.2 Lymphocyte isolation
4ml of whole blood was diluted to 10ml using phosphate buffered saline. Diluted
blood was then carefully layered horizontally onto 5ml ofhistopaque in a sterile 15ml
Sterilin tube. Samples were then centrifuged for 30 minutes at 1500 rpm at 25°C. The
resulting cell interfaceibufty coat layer was separated using a sterile pasteur pipette.
The bufty coat layer was then pipetted into a new Sterilin tube, topped up to 10mi
32
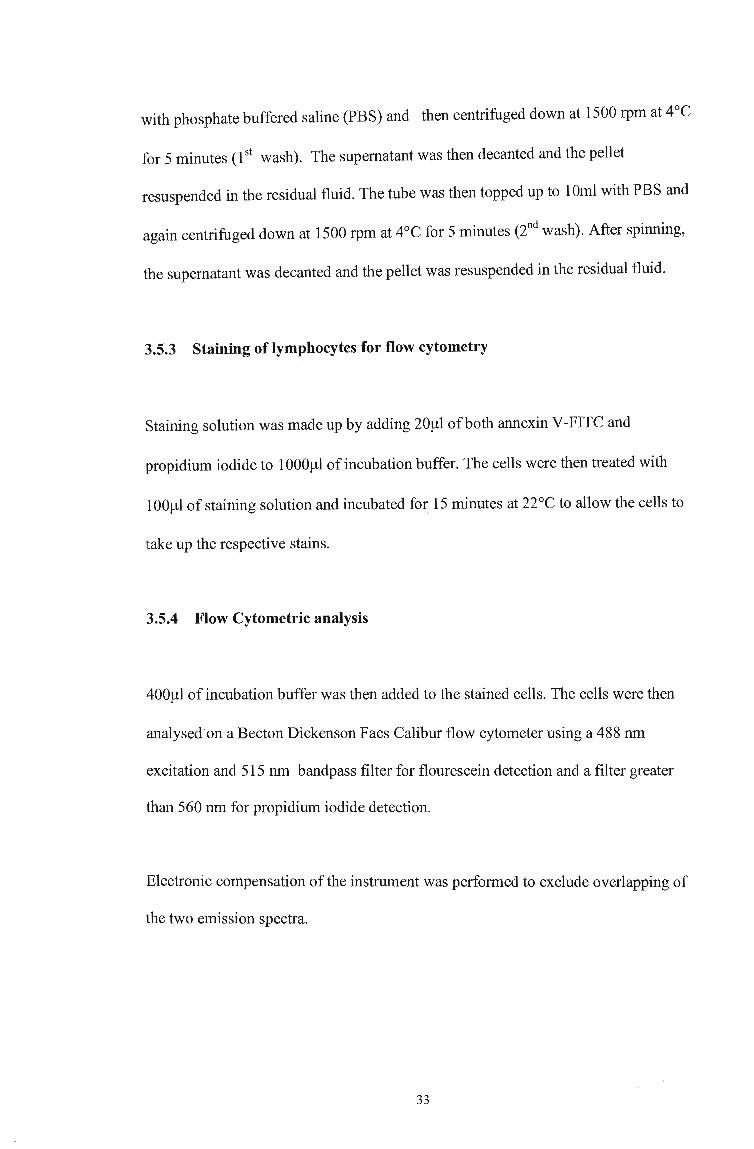
with phosphate buffered saline (PBS) and then centrifuged down at 1500 rpm at 4°C
for 5 minutes (1 st wash). The supernatant was then decanted and the pellet
resuspended in the residual fluid. The tube was then topped up to 10ml with PBS and
again centrifuged down at 1500 rpm at 4°C for 5 minutes (2nd wash). After spinning,
the supernatant was decanted and the pellet was resuspended in the residual fluid.
3.5.3 Staining of lymphocytes for flow cytometry
Staining solution was made up by adding 20)!l of both annexin V-FITC and
propidium iodide to 1000)!l of incubation buffer. The cells were then treated with
100)!l of staining solution and incubated for 15 minutes at 22°C to allow the cells to
take up the respective stains.
3.5.4 Flow Cytometric analysis
400)!l of incubation buffer was then added to the stained cells. The cells were then
analysed on a Becton Dickenson Facs Calibur flow cytometer using a 488 nm
excitation and 515 nm bandpass filter for flourescein detection and a filter greater
than 560 nm for propidium iodide detection.
Electronic compensation of the instrument was performed to exclude overlapping of
the two emission spectra.
33
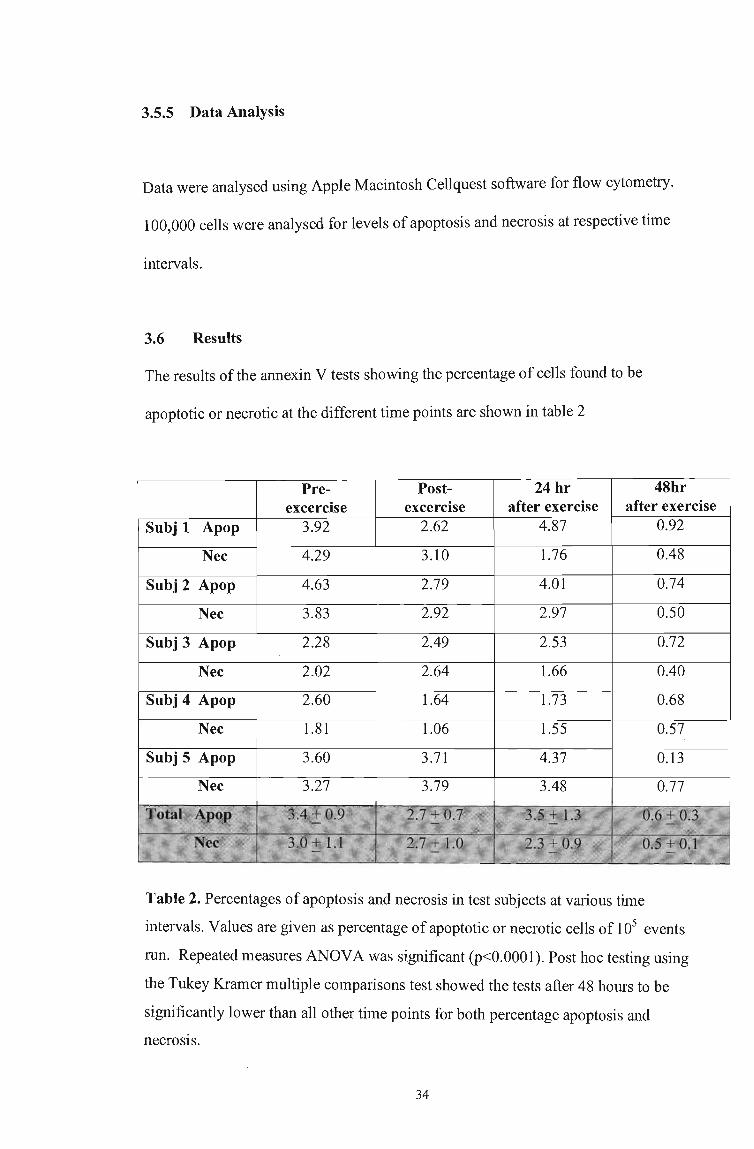
3.5.5 Data Analysis
Data were analysed using Apple Macintosh Cellquest software for flow cytometry.
100,000 cells were analysed for levels of apoptosis and necrosis at respective time
intervals.
3.6 Results
The results of the annexin V tests showing the percentage of cells found to be
apoptotic or necrotic at the different time points are shown in table 2
Pre- Post- 24 hr 48hr exeercise exeercise after exercise after exercise
Subj 1 Apop 3.92 4.87 0.92
Nee 4.29 3.10 1.76 0.48
Subj 2 Apop 4.63 2.79 4.01 0.74
Nee 3.83 2.92 2.97 0.50
Subj 3 Apop 2.28 2.49 2.53 0.72
Nee 2.02 2.64 1.66 0.40
Apop 2.60 1.64 1.73 0.68
Nee 1.81 1.06 1.55 0.57
Subj 5 Apop 3.60 3.71 4.37 0.13
Nee 3.27 3.79 3.48 0.77
Table 2. Percentages of apoptosis and necrosis in test subjects at various time
intervals. Values are given as percentage of apoptotic or necrotic cells of 105 events
run. Repeated measures ANOVA was significant (p<0.0001). Post hoc testing using
the Tukey Kramer multiple comparisons test showed the tests after 48 hours to be
significantly lower than all other time points for both percentage apoptosis and
necrosis.
34
o N
ANNEXIN
M1 = 96.15 M2 = 3.83
M2
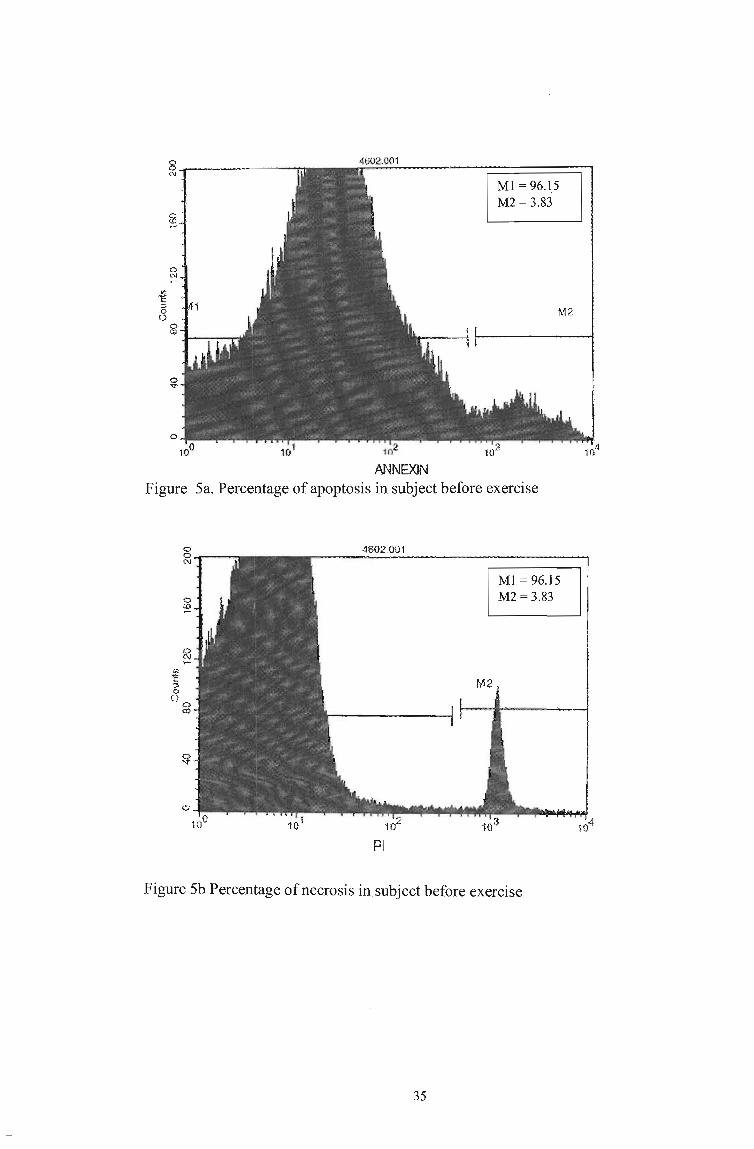
Figure 5a. Percentage of apoptosis in subject before exercise
4002" .. 001
PI
M2
M1 = 96.15 M2 = 3.83
Figure 5b Percentage of necrosis in subject before exercise
35
t:> 0 N
fiS
0 N 'f'"
~ :::l
8 M 1
ANNEXIN
Ml = 96.97 M2 =2.79
M2
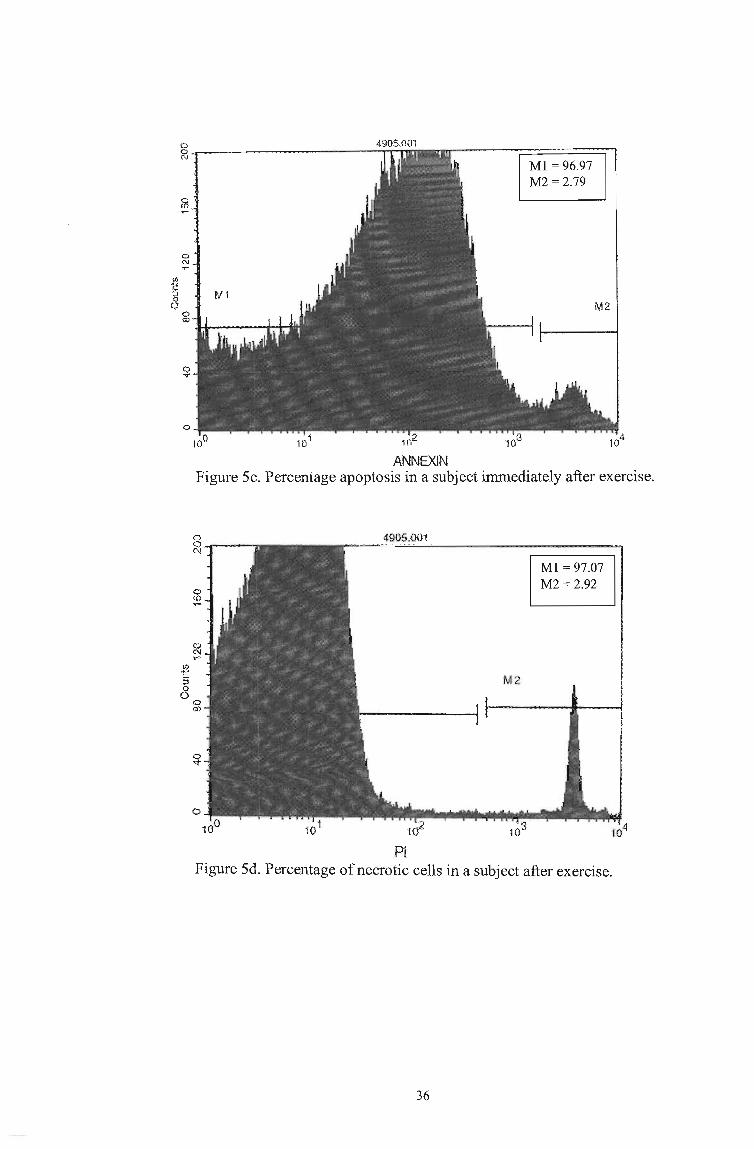
Figure 5c. Percentage apoptosis in a subject immediately after exercise.
8~--C\j
PI
M2
Ml = 97.07 M2 = 2.92
Figure 5d. Percentage of necrotic cells in a subject after exercise.
36

g~------N
5602001
ANNEXIN
M1 = 95.88 M2 = 4.01
Figure 5e. Percentage of apoptosis in test subject, 24 hours after exercise
5602 .. 001
PI
M.2
M1 = 97.00 M2 = 2.97
Figure 5f. Percentage necrosis in test subject, 24 hours after exercise.
37
o C\I ...
ANNEXIN
Ml = 99.18 M2 = 0.74
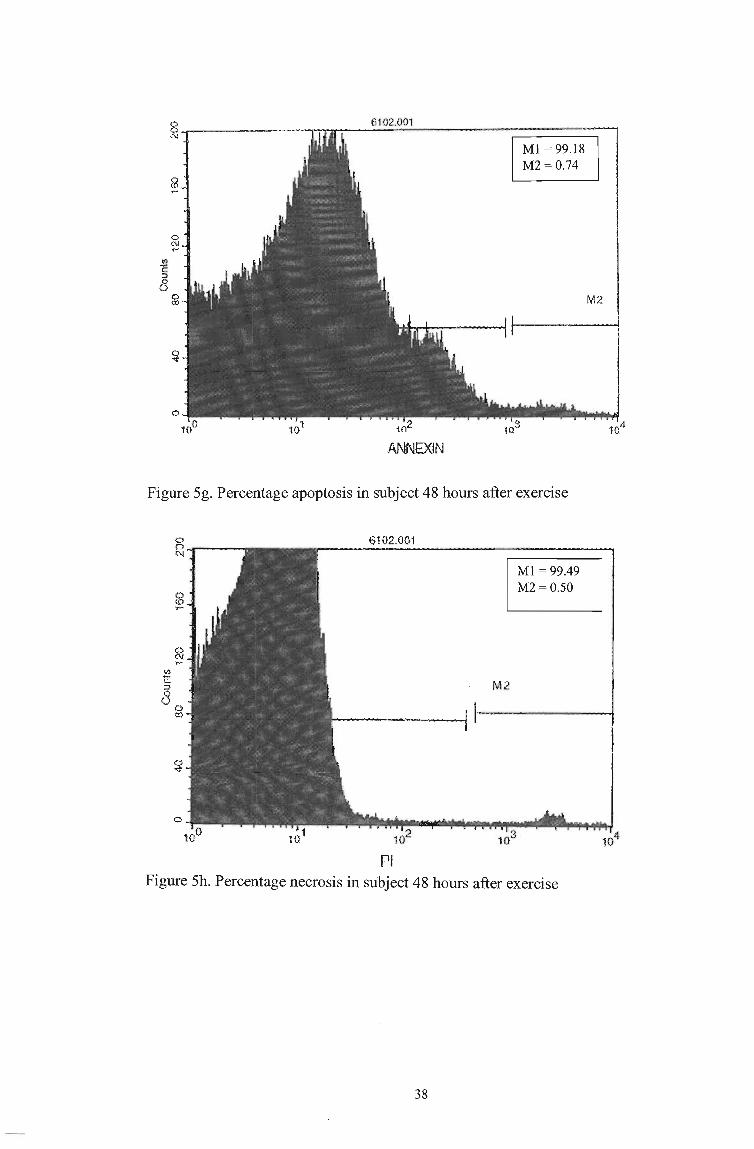
Figure Sg. Percentage apoptosis in subject 48 hours after exercise
M2
Pi
Ml = 99.49 M2 = 0.50
Figure Sh. Percentage necrosis in subject 48 hours after exercise
38
M2.
CHAPTER 4
EXERCISE TESTING
4.1 Maximum oxygen (V02max) testing
Measurement of the maximum uptake of oxygen by an athlete is probably the best
method of predicting the aerobic athletic potential of a specific individual in sports
physiology. The measurement of maximum oxygen uptake enables one to assess the
capacity to transport and utilize oxygen. This involves the functional capacities of the
heart, lungs, muscle and mitochondria.
4.1.1 Defmition OfV02max testing
The point in time where oxygen uptake eventually plateaus irrespective of an increase
in workload is referred to as V02max. For subjects who do not develop an oxygen
consumption plateau an exercising respiratory exchange ratio of 1.15 is taken to
indicate that maximum oxygen consumption has occurred. The ability of an
individual to execute work thereafter is a result of the energy transfer reactions of
glycolysis. This however leads to an increase in hydrogen ions and the reduction of
pyruvate to lactate. Under these conditions exhaustion soon ensues.
The V02max of marathon runners is approximately 45% greater than that of untrained
persons. It has been suggested that the reason for this greater V02max of marathon
runners is partly due to genetics. Those individuals with greater chest sizes in relation
39
to their body size and stronger respiratory muscles select themselves to become
marathon runners (Guyton, 1991). It is more likely that successful marathon runners
have a high percentage of oxidative type 1 and type 11 a fibres.
4.1.2 The relation between cardiovascular performance and V02max
During strenuous exercise both the heart rate and the stroke volume are increased to
approximately 90% of their maximal levels. The cardiovascular system is much more
rate limiting on the V02max than the respiratory system. This would explain the 40
percent advantage in maximum cardiac output that a marathon runner has over an
untrained person (Guyton, 1991).
It was previously thought that the best indicator of cardiorespiratory endurance /
physical fitness / athletic potential is the V02 max (maximum aerobic capacity). Later
research now seems to favour the maximum work rate, the running speed at the lactate
turnpoint together with running economy as being more important. The very best
predictor of performance at even ultra-long distances is the 10 km running time
(Noakes, 1990).
The V02max is an indirect measure of athletic potential because in effect what is
measured is the oxygen consumption at the peak achieved work rate or running
velocity. There is strong support for the view that /V02max is a genetically
predetermined value. However it has been shown that the V02max is trainable in terms
of increases that have been recorded from 4% to 93%. An average increase of 15% to
20% is more typical for the average sedentary individual and this far greater than that
40
seen in active athletes. The reasons for increased /V02max is controversial and can be
summarized into two theories.
Theory 1 is the utilization theory - in which there is said to be limitation of oxidative
enzymes in the muscle mitochondria. Mitochondrial oxidative enzymes have been
shown to substantially increase with endurance training both in number and size.
Theory 2 is the presentation theory, which is the limitation of oxygen delivery. This
proposes that central and peripheral circulatory factors are responsible for the increase
in V02max. More specifically the central factors are an increase in blood volume /
cardiac output (via an increase in stroke volume) and an increased perfusion of active
muscles as a result of increased capillary density and an increased arterio-venous
difference.
Prolonged endurance training of the V02max allows an athlete to compete at a higher
percent of his V02max. Similarly, with training, the lactate threshold increases thus
enabling the athlete to compete at a higher intensity before reaching the lactate
threshold.
Factors determining NO+ are hereditary (25% -50% influence), age related decline,
gender, responders and non-responders which is genetically determined and sports
specific training.
Running economy which accounts for the differences in V02max between athletes
running at similar speeds is influenced by running experience, body mass, stride
41
length, age, (adults are more economical than children), gender (males are more
economic than females), clothing (aerodrag), hair length, shoe weight and lace, shoe
type (air soles are more beneficial) wind speed, (head wind and drafting), running
uphill or downhill (running downhill is more economical).
In conclusion it can be stated that successful endurance athletes require muscles that
have superior contractility, thus allowing an athlete to achieve a higher work rate
because of a higher oxygen consumpOtion (V02max) but the exact V02max that each
athlete achieves is however greatly influenced by his / her running economy. Athletes
who exhibit high V02max values and poor performance may be less economical than
those athletes with lower V02max values and good performances.
4.2 Materials and method
4.2.1 Measurement of maximal oxygen uptake
The most common tests are methods which recruit large muscle groups maintaining
intensity and duration for as long as is required to induce maximal aerobic energy
transfer.
The method employed in this study involved treadmill running. The treadmill used
was a Powerjog treadmill, model EGIO which has a maximal speed of25 km.h-1 and a
maximum gradient of 25%. Measurement of the athletes' oxygen consumption was
measured using computerised open circuit spirometry (Oxycon Gamma Spirometer).
42
The computer program used to generate printouts ofV02max etc. was the Oxycon
Ergospirometry program.
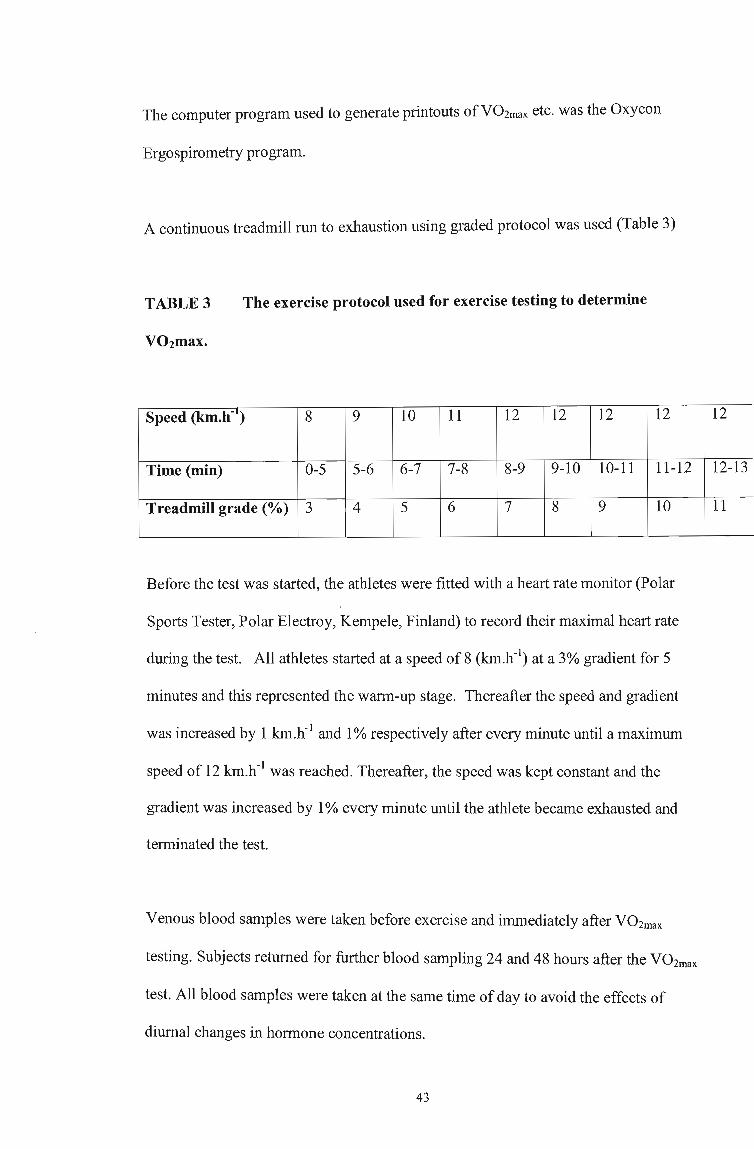
A continuous treadmill run to exhaustion using graded protocol was used (Table 3)
TABLE 3 The exercise protocol used for exercise testing to determine
Speed (km.h-~) 8 9 10 11 12 12 12 12
Time (min) 0-5 5-6 6-7 7-8 8-9 9-10 10-11 11-12
Treadmill grade (0/0) 3 4 5 6 7 8 9 10
Before the test was started, the athletes were fitted with a heart rate monitor (Polar
Sports Tester, Polar Electroy, Kempele, Finland) to record their maximal heart rate
during the test. All athletes started at a speed of8 (km.h-1) at a 3% gradient for 5
minutes and this represented the warm-up stage. Thereafter the speed and gradient
was increased by 1 km.h-1 and 1 % respectively after every minute until a maximum
speed of 12 km.h-1 was reached. Thereafter, the speed was kept constant and the
gradient was increased by 1 % every minute until the athlete became exhausted and
terminated the test.
Venous blood samples were taken before exercise and immediately after V02max
testing. Subjects returned for further blood sampling 24 and 48 hours after the V02max
test. All blood samples were taken at the same time of day to avoid the effects of
diurnal changes in hormone concentrations.
43
12
12-13
11
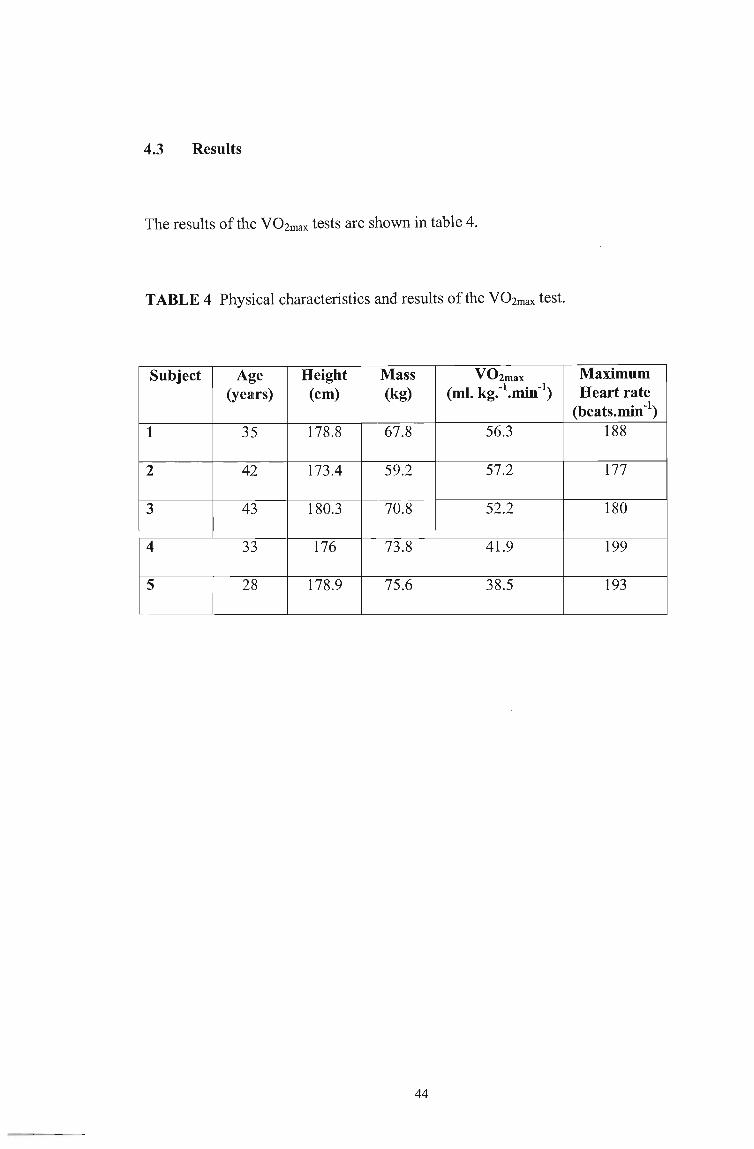
4.3 Results
The results of the VOZmax tests are shown in table 4.
TABLE 4 Physical characteristics and results of the V02max test.
Subject Age Height Mass V02max Maximum (years) (cm) (kg) ( I k -1 . -1) Heart rate m. g .. mIn
(beats. min-I)
1 35 178.8 67.8 56.3 188
2 42 173.4 59.2 57.2 177
3 43 180.3 70.8 52.2 180
4 33 176 73.8 41.9 199
5 28 178.9 75.6 38.5 193
44
CHAPTERS
DISCUSSION AND CONCLUSION
It was found that all five volunteers exhibited an increase in DNA migration after 24
hours of exercise. The degree of DNA migration between individuals varied greatly as
we expected. Before the run the subjects showed no sign of DNA damage. Peripheral
blood cells exhibited negligible or almost no DNA damage immediately after
exercise. There was substantially increased DNA damage 24 and 48 hours after
exercise.
It is therefore evident from the results that there was no DNA migration before the
exercise whereas after the run most of the cells exhibited increased DNA migration.
The point in time when oxygen uptake plateaus and shows no further increase, or
increases only marginally « 1 OOmllmin) with an increase in work load is referred to
as the maximum oxygen uptake, maximum oxygen consumption, maximum aerobic
power or simply the V02max . The additional work that an individual is thereafter able
to achieve is a result of energy transfer reactions of glycolysis which results in the
accumulation of hydrogen ions and reduction of pyruvate to lactate.
The concentrations of lactate were not quantified in this study. Lactic acid
concentrations in other studies however revealed that the values decrease rapidly to
control levels after 1 hour of exercising. This therefore excludes the possibility that
the cytotoxic effects in the SCGE assay are due to acidic conditions (Hartmann et al. ,
1994).
45

Apoptosis induced by the single bout of exercise is possibly a nonnal regulatory
process that serves to remove certain damaged cells without a pronounced
inflammatory response, therefore ensuring optimal body function (Phaneuf et at.,
2001). DNA fragmentation is invariably a process that characterizes apoptosis in its
latter stages. This biochemical process is responsible for the cleavage of DNA by
endonucleases to fragments of approximately 180-200 bps. These results have
relevance in that DNA damaged (apoptotic) lymphocytes are not functional to allow,
for example, viral replication and nonnal immune function.
Apoptosis due to strenuous exercise would therefore be readily detectable by the
SCGE technique which is sensitive in the detection of single stranded DNA breaks.
This is clearly evident in the results summarized in table 1.
The most significant observation from the flow cytometric results in all test subjects,
is a substantial decrease in both apoptotic and necrotic cells after 48 hours when
compared to all other time intervals. As expected once again as in the SCGE assay
there is a great degree of variability among the test subjects. This is probably best
explained by the difference in individual immune status of each test subject at the
respective times. Three of the test subjects showed a marked increase in levels of
apoptosis after 24 hours while the other two remained almost the same. This is
followed by a sharp decrease in apoptotic cells among all the test subjects. Cells
actively undergoing apoptosis possess the ability to trigger their own engulfment by
phagocytic cells prior to cell lysis. This is due to the generation of recognition signals
on the surface of apoptosing cells (Padok et at., 1992a; Savill et at., 1993 and Fadok
et at., 1992b).
46
In most of the cells where macrophage recognition has been studied, two such signals
have been identified. The first of these signals is the exposure of a ligand for the
vitronectin receptor (Hall et ai., 1994; Fadok et ai., 1992a and Savill et ai., 1993). The
second of these signals is the relocation of PS to the outer leaflet of the cell membrane
(Fadok et ai., 1992; Savill et ai., 1993 and Fadok et ai., 1992). In studies conducted,
the ability of macro phages to recognize exposed PS is indicated by the ability ofPS
vesicles to specifically inhibit the phagocytosis of apoptotic lymphocytes with
phosphatydylserine exposed on their surfaces (Fadok et ai., 1992). Increased
phagocytic activity due'to these recognition signals could possibly explain the sharp
decrease in apoptotic cells after 48 hours.
The increase in apoptotic levels in test subjects after 24 hours can possibly be
attributed to physical stress induced glucocorticoid receptor-mediated apoptosis
(Concordet et ai. , 1993). It is possible that the apoptosis induced by the single bout of
exercise is a normal regulatory process that serves to remove certain damaged cells
without a pronounced inflammatory response, therefore ensuring optimal body
function (Phaneuf et ai., 2001).
The results ofthe necrotic cells by contrast exhibit a significantly lower percentage of
cells 24 and 48 hours later as compared to the basal and immediately post exercise
values.
Subjects 1,2 and 3 are marathon runners. Subject 4 is a regular indoor soccer player
(twice a week) while person 5 leads a relatively sedentary lifestyle. From the results
47
in table 3 it can be seen that ultradistance runners like subjects 1-3 specializing in
races such as the comrades marathon have significantly higher V02max values than
subject 5 who do not train as regularly.
A large number of studies have been conducted with the aim of elucidating the effects
of high intensity exercise on the immune system. The result is a well documented
paradox between exercise intensity a~d the incidence of illness, where moderate
exercise is generally beneficial to immunity, while prolonged intense exercise may be
immunosuppressive (Pyne et at., 1998).
It is well known that various types of stresses, such as heat, anxiety, and physical
stress, can influence immune system function (Concordet et at. , 1993; Mars et at.,
1998). For example, acute exercise stress is associated with a lower lymphocyte
functional response. In Nieman's "J-shaped model," it is suggested that exercise can
enhance or reduce immunity depending on the frequency, duration, and intensity of
the exercise (Nieman 1994).
The response of blood leucocytes to a bout of acute exercise are highly stereotyped.
The concentrations of neutrophils seen to increase during and after exercise whereas
lymphocyte concentrations increase during exercise and decrease after exercise. The
proliferative response of cells to mitogens decreases during and after exercise while
the degree of lymphocyte apoptosis increases during and after exercise.
Strenuous exercise stimulates a variety of signals, such as increases in glucocorticoid
(OC) secretion, intracellular calcium levels, and reactive oxygen species, which can
48
potentially induce apoptosis (Carraro and Franceschi 1997). In addition, glutathione
depletion, thiol oxidation, DNA damage, and hypoxia have been reported during
exercise and may likely contribute to programmed cell death. It has been proposed
that apoptotic cell death induced by exercise in very metabolically active tissues, such
as the heart and skeletal muscle, may be a normal process to remove partially
damaged cells. Certain forms of exercise however, may cause mechanical damage,
followed by an inflammatory response, leading to excessive apoptosis.
Mitochondria have primarily been seen as powerhouses for energy production;
however, it is now clear that excessive free radical production and the loss of
mitochondrial membrane potentials can lead to apoptotic cellular events, including
cytochrome c release or decreased Bcl-2 expression. One ofthe first papers to suggest
that apoptosis may playa role in post-exercised animals was by Concordet et at.
(1993). In this study, rats ran to exhaustion on a treadmill. The T-cells in their
thymuses showed signs of programmed cell death (increased DNA fragmentation)
immediately after and 24-h post exercise. Moreover, RU-486 (a potent glucocorticoid
receptor antagonist) administered 2 hours and 0 hours before the run partially
inhibited thymocyte DNA fragmentation. This suggests a relationship between
physical stress and glucocorticoid receptor-mediated apoptosis of rat thymocytes.
Damage of myocyte mitochondria due to oxidants and a variety of other factors, such
as loss of mitochondrial membrane integrity, could possibly be inducers of apoptosis
during exercise. Investigations of apoptosis in skeletal muscle myocytes of
dystrophin-deficient (mdx) mice subjected to spontaneous exercise have been
conducted. Muscle analysis revealed increases of apoptotic myonuclei after exercise
49
detected by the TUNEL method using electron microscopy. It is not clear from these
studies, however, whether these cells were lost entirely by an apoptotic process.
Moreover, expression of ubi quit in (a protein expressed during apoptosis that
covalently links to proteins and tags them for degradation) correlated with exercise
and with positive myonuclei. Furthermore, this study demonstrated a decrease in
mitochondrial Bcl-2, which may be due to exercise-induced apoptosis in the muscle of
mdx mice (Sandri et ai., 1997).
It was also found that after spontaneous wheel-running, both normal and dystrophin
-deficient muscles of mice showed increases in fragmented DNA using the TUNEL
method and gel electrophoresis. Ubiquitin increased in muscles of both dystrophic and
control exercised mice. In this study, tissues were collected two days after the exercise
bout. The apoptotic events observed might very well reflect factors released due to
inflammatory processes caused by mechanical damage to metabolically active tissues
(Sandri et at., 1995). It is thus conceivable that factors stimulating apoptosis during or
immediately following exercise may be different from those involved 24-48 h post-
exerCIse.
Human studies on the effects of apoptosis and exhaustive exercise are scarce. One
study investigating human subjects exercising on a treadmill until exhaustion found
DNA strand breaks in lymphocytes immediately after exercise, but not 24 and 48-
hours post-exercise (Mars et at., 1998). Moreover, flow cytometry revealed
lymphocyte apoptosis in 63% oflymphocytes immediately after exercise and in
86.2% oflymphocytes 24 hours after exercise. Although these events could possibly
explain the greater incidence of upper respiratory tract infections in highly trained
50
athletes following exhaustive training periods the results are questionable. Firstly
changes of a cell undergoing apoptosis occur only after a few hours at most. It is
therefore inconceivable that 63% oflymphocytes were apoptotic immediately after
exercise as phosphatidylserine relocation to the outer leaflet of the cell, which is the
basis for flow cytometric determination of apoptosis, would invariably take much
longer to manifest itself. A further explanation for the divergent results could be
explained by the difference in gating of the lymphocyte populations carried out by the
different studies and the different methods of analysing apoptosis.
Exercise training is believed to result in a variety of adaptations that may be beneficial
in attenuating apoptosis. It has been shown that several critical antioxidants and
antioxidant enzymes are up-regulated with exercise training, thus providing additional
free radical protection in myocytes (Leeuwenburgh et at., 1997; Powers et at., 1993;
Sen et at., 1992). It has therefore been proposed that animals that are exercise-trained
should show increased resistance to apoptosis.
Skeletal muscle inactivity due to chronic heart failure could potentially also influence
apoptosis. Indeed, recent research showed that apoptosis occurs in skeletal muscle
myocytes in about 50% of patients with chronic heart failure possibly due to inactivity
(Adams et at., 1999). Importantly, patients with apoptosis-positive skeletal muscle
myocytes exhibited a significantly lower V02max, a higher iNOS expression, and
lower Bcl-2 expression as compared with biopsies of healthy patients. Future research
is needed to determine the molecular signals enhancing skeletal muscle apoptosis in
order to develop a therapeutic rationale for muscle fibre protection and restoration of
contractile force.
51
The possibility that mitochondrial-produced oxidants during exercise have a direct
effect on apoptosis has not yet been directly investigated. It seems very plausible that
disturbances in mitochondrial homeostasis, i.e., DNA damage, inner mitochondrial
membrane damage, and increases in calcium, could eventually result in the release of
pro-apoptotic factors, such as cytochrome c from the intermembrane space. Thus,
alteration in anti-apoptotic factors, such as Bcl-2 and Bcl-XL with aging and exercise,
could increase the likelihood ofan induction of mitochondrial-mediated programmed
cell death.
The results of the experiments conducted exhibit a lack of correlation, which may be
explained by the different sensitivities of the test for different aspects of cell death.
The SCGE assay has been effective in detecting DNA strand breaks induced by
ionising radiation, radiomimetic chemicals and oxygen radicals (Vijayalaxmi et al.,
1992; Mackelvey- Martin et aI. , 1993). The cause ofthe DNA damage in the SCGE
assay is not entirely clear but oxidative stress is a strong possibility. The assay has
been proven to be highly sensitive (Olive et al., 1990) and thus the results presented
have to be taken as an indication that physical activity under certain circumstances
causes DNA damage.
The percentages of apoptotic and necrotic cells in the flow cytometric results are not
as high as those anticipated although it is possible to extrapolate certain trends
amongst the various test subjects.
52

There are a number of issues within the sports discipline that warrant experimental
and clinical investigation. It is important to achieve reliable and sensitive diagnostic
technology for the rapid assessment of immune status and associated risk of
susceptibility to illness in the sports field. This area is in desperate need of further
investigation because a functional loss of specific immune cells may explain the
higher incidence of respiratory tract infections seen in highly-trained athletes.
It is in this regard that we believe that the SCGE assay could be applied being a rapid
sensitive and relatively inexpensive method of determining DNA damage on a single
cell basis. The results presented here have direct implications for the use of the SCGE
assay in studies with human blood cells. This may be beneficial in terms of coaches
and athletes being better able to plan training and competitive schedules and in the
determination and prevention of the so called "overtrained" athlete who is apparently
more susceptible to UR TIs as a result of possibly being immuno depressed.
53
REFERENCES
1. Abd-Allah G.A., R.I. EI-Fayoumi, M.l Smith, R.A. Heckmann and K.L.O'Neil,
(1999) A comparative evaluation of aflatoxin B 1 genotoxicity in fish models using
the comet assay, Mutation Research, 446, 181-188.
2. Carraro U and C. Franceschi. (1997) Apoptosis of skeletal and cardiac muscles
and physical exercise. Aging. 1-2: 19-34.
3. Concordet J. P. and A. Ferry, (1993) Physiological programmed cell death in
thymocytes is induced by physical stress ( exercise), American Journal of
Physiology, 265, C626-C629.
4. Fadok V. A., J. S. Savill, C. Haslett, D.L. Bratton, D. E. Doherty, P. A. Campbell
and P. M. Henson, (1992a) Different populations of macro phages use either the
vitronectin receptor or the phosphatydylserine receptor to recognize and remove
apoptotic cells, Journal of Immunology, 149,4029-4035.
5. Fadok V. A., D. R. Voelker, P. A. Campbell, J. J. Cohen, D.L. Bratton and P. M.
Henson, (1992b) Exposure of phosphatydylserine on the surface of apoptotic
lymphocytes triggers specific recognition and removal by macrophages, Journal
of Immunology, 48, 2207-2216.
6. Gedik C.M., S.W.B. Ewen and A.R, Collins, (1992) Single-cell gel
electrophoresis applied to the analysis of UV -C damage and its repair in human
cells, International Journal of Radiation Biology, 62, 315-320.
7. Gorcyca W., M. R. Melamed and Z. Darzynkiewicz, (2000) Analysis of apoptosis
by flow cytometry, Flow Cytometry Protocols (From Methods in Molecular
Biology: Vol 91), 217-238.
54
8. Green M. H. L., J.E. Lowe, S.A. Harcourt, P. Akinluyi, T. Rowe, A.V. Anstey and
C.F. Arlett, (1992) UV -C sensitivity of stimulated and unstimulated human
lymphocytes from normal and xeroderma pigmentosum donors in the comet
assay: A potential diagnostic technique, Mutation Research, 273,137-144.
9. Green D. R., and J. C. Reed, (1998) Mitochondria and apoptosis. Science
281:1309 -1312.
10. Guyton A. C., (1991), Respiration in Exercise, Textbook of Medical Physiology,
8,945-947.
11. Hall S. E., J. S. Savill, P. M. Henson and C. Haslett, (1994) Apoptotic neutrophils
are phagocytosed by fibroblasts with participation of the fibroblast vitronectin
receptor and involvement of a mannose/fucose-specific lectin, Journal of
Immunology, 153,3218-3227.
12. Hartmann A. , U. Plappert, K. Raddatz, M. Grunert-Fuchs and G. Speit, (1994)
Does physical activity induce DNA damage, Mutagenesis, 9, 269-272.
13. Leeuwenburgh c.; J Hollander.; R Fiebig.; S Leichtweis.; M Griffith.; LL Ji.,
(1997) Adaptations of glutathione antioxidant system to endurance training are
tissue and muscle fiber specific. American Journal of Physiology 272,363-369.
14. Li P.; D Nijhawan.; I. Budihardjo; SM. Srinivasula; M. Ahmad; ES. Alnernri; X.
Wang, (1997) Cytochrome c and dATP-dependent formation of Apaf-I1caspase-9
complex initiates an apoptotic protease cascade. Cell 91:479-489.
15. Mackelvey-Martin V.J., M. H. L. Green, P, Schmezer, B.L. Pool-Zobel, M. P.
Demeo and A. Collins, (1993) The single cell gel electrophoresis assay (comet
assay): A European review, Mutation Research, 288, 47-63.
55

16. Mars M., S. Govender, A. Weston, V. Naicker, A. Chuturgoon, (1998) High
intensity exercise: a cause oflymphocyte apoptosis? Biochemical Biophysical
Research Communications, 249: 366-70.
17. Marzo, I, (1998) The permeability transition pore complex: a target for apoptosis
regulation by caspases and bcl-2-related proteins. Journal of Experimental
Medicine, 187: 1261-1271.
18. Nieman, D.C., (1994) Exercise, infection, and immunity. International Journal of
Sports Medicine, 15:S131-S141.
19. Noakes T, 1990, The Lore of Running, Oxford University Press 25-28.
20. Olive P. L., D. Wlodek, R.E. Durand and J.P. Banath, (1992), Factors influencing
DNA migration from individual cells subjected to gel electrophoresis,
Experimental Cell Research, 198,259-26.
21. PhaneufS. and C. Leeuwenburgh, (2001), Apoptosis and Exercise, Medicine and
Science in Sports and Exercise, 33, 393-396.
22. Powers, S. K. D. Criswell, 1. Lawler, D. Martin, F.K. Lieu, L.L. li, R.A. Herb,
(1993), Rigorous exercise training increases superoxide dismutase activity in
ventricular myocardium. American Journal oj Physiology 265 :H2094-8.
23. Pyne D. B. and M. Gleeson, (1998), Effects of intensive exercise training on
immunity in athletes, International Journal ojSports Medicine, 19, S183-S194.
24. Sandri M.; U. Carraro, M. Podhorska-Okolov, C. Rizzi, P. Arslan, D. Monti, C.
Franceschi, (1995) Apoptosis, DNA damage and ubiquitin expression in normal
and mdx muscle fibers after exercise. FEBS Lett, 373, 291-5.
25. Sandri M., M. Podhorska-Okolow, V. Geromel, C. Rizzi, P. Arslan, C. Franceschi,
U. Carraro, (1997) Exercise induces myonuclear ubiquitination and apoptosis in
56
dystrophin-deficient muscle of mice. Journal of Neuropa tho logy and
Experimental Neurology, 56:45-57.
26. Savill 1. S., V. A. Fadok, P. M. Henson and C. Haslett, (1993) Phagocyte
recognition of cells undergoing apoptosis, Immunology Today, 14, 131-136.
27. Sen C.K., E. Marin, M. Kretzschmar, O. Hanninen, (1992) Skeletal muscle and
liver glutathione homeostasis in response to training, exercise, and
immobilization. Journal of Applied Physiology, 73. 1265-1272.
28. Shapiro H. M., (1988) Learning about flow cytometry, Practical Flow
Cytometry, 2, 6-9.
29. Singh N.P., M.T. Macoy, R.R. Tice and E.L. Schneider, (1988) A simple
technique for the quantification of low levels of DNA damage in individual cells,
Experimental Cell Research, 175, 184-191.
30. Susin S.A., N. Zamzami, M. Castedo, E. Daugas, H.G.Wang, S. Geley, F. Fassy,
J.C. Reed, G. Kroemer, (1997) The central executioner of apoptosis: multiple
connections between protease activation and mitochondria in Fasl APO-lICD95-
and ceramide-induced apoptosis. Journal of Experimental Medicine, 186: 25-37.
31. Strasser A., L. O. Connor and V.M. Dixit, (2000) Apoptosis signaling, Annual
Reviews in Biochemistry, 69, 217-245.
32. Verhoeven B., R. A. Schlegel and P Williamson., (1995), Mechanisms of
phosphatydy1serine exposure, a phagocyte recognition signal, on apoptotic T
lymphocytes, Journal of Experimental Medicine, 182, 1597-1601.
33. Vijayalaxmi R., R. Tice and G.H.S. Strauss, (1992), Assessment of radiation
induced DNA damage in human blood lymphocytes using the single-cell gel
electrophoresis technique, Mutation Research, 271, 243-252.
57

34. Wyllie A. H., (1997), Apoptosis an overview, British Medical Bulletin, 53,451-
465.
58