The Effect of Carbon Taxes on Agricultural Trade · EFFECT OF CARBON TAXES ON AGRICULTURAL TRADE 3...
23
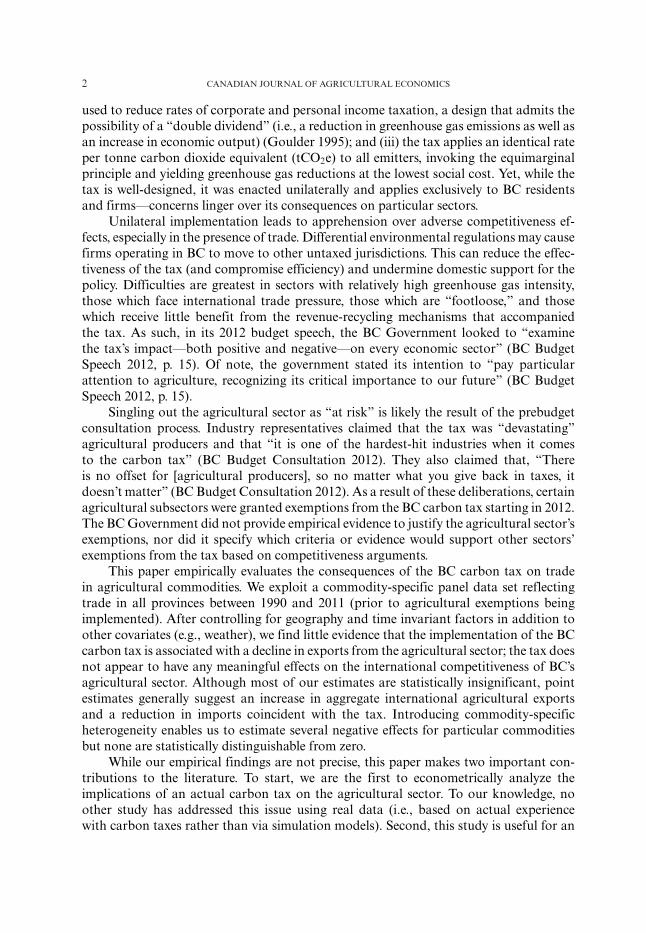
The Effect of Carbon Taxes on Agricultural Trade Nicholas Rivers 1 and Brandon Schaufele 2 1 Graduate School of Public and International Affairs and Institute of the Environment, University of Ottawa, 120 University, Ottawa, ON K1N 6N5, Canada (phone: 613-562-5800, ext. 4676; fax: 613-562-5241; e-mail: [email protected]). 2 Department of Economics and Institute of the Environment, University of Ottawa, 120 University, Ottawa, ON K1N 6N5, Canada (corresponding author: phone: 613-286-1423; fax: 613-562-5873; e-mail: [email protected]). This study evaluates the implications of an existing carbon tax on international trade in the agricultural sector. Applying uniformly to all fossil fuels combusted within its borders, the province of British Columbia unilaterally introduced a carbon tax on July 1, 2008. In 2012, the province granted an exemption from the tax to certain agricultural sectors. Using commodity-specific trade flows and exploiting cross-provincial and intertemporal variation, we find little evidence that the carbon tax is associated with any meaningful effects on agricultural trade despite the sector being singled out as “at risk” by the provincial government. Our findings suggest that there is not compelling evidence to support exempting the agricultural sector from the tax. Discussion of potential policy remedies to address the tax’s potential effects on firm profitability and international competitiveness is also included. Dans la pr´ esente ´ etude, nous examinons les r´ epercussions qu’une taxe sur le carbone existante exerce sur le commerce international du secteur agricole. Le 1 er juillet 2008, la Colombie-Britannique a assujetti unilat´ eralement tous les combustibles fossiles utilis´ es sur son territoire ` a une taxe sur le carbone. En 2012, la province a accord´ e une exon´ eration de cette taxe ` a certaines activit´ es agricoles. Un examen des flux commerciaux de certaines marchandises de base ainsi que des variations interprovinciales et inter-temporelles fournit peu d’´ el´ ements voulant que la taxe sur le carbone entraˆ ıne des r´ epercussions importantes sur le commerce agricole malgr´ e le fait que le gouvernement de cette province ait qualifi´ e le secteur comme ´ etant « ` a risque». Les r´ esultats de notre ´ etude permettent de penser qu’il n’existe aucune raison imp´ erieuse d’appuyer l’exon´ eration de cette taxe au secteur agricole. Nous avons ´ egalement abord´ e la question des solutions politiques qui pourraient att´ enuer les r´ epercussions potentielles de la taxe sur la rentabilit´ e et la comp´ etitivit´ e internationale des entreprises. INTRODUCTION British Columbia (BC) introduced a carbon tax on all fossil fuels purchased in the province on July 1, 2008. Carbon taxes are considered to be among the most efficient market-based instruments to reduce greenhouse gas emissions: They raise revenue which can be used for productive purposes such as reducing other tax distortions (Goulder et al 1997), provide strong incentives for technological innovation (Fischer and Newell 2008), and have small transaction costs (Stavins 1995). Further, BC’s carbon tax combines a unique set of policy characteristics, placing it among the best designed environmental policies in the world: (i) the carbon tax is coupled with targeted rebates to low-income and remote households, alleviating concerns over the regressivity; (ii) revenue from the carbon tax is Canadian Journal of Agricultural Economics 00 (2014) 1–23 DOI: 10.1111/cjag.12048 1
Transcript of The Effect of Carbon Taxes on Agricultural Trade · EFFECT OF CARBON TAXES ON AGRICULTURAL TRADE 3...
The Effect of Carbon Taxes on Agricultural Trade
Nicholas Rivers1 and Brandon Schaufele2
1Graduate School of Public and International Affairs and Institute of the Environment,University of Ottawa, 120 University, Ottawa, ON K1N 6N5, Canada (phone:
613-562-5800, ext. 4676; fax: 613-562-5241;e-mail: [email protected]).
2Department of Economics and Institute of the Environment, University of Ottawa, 120University, Ottawa, ON K1N 6N5, Canada (corresponding author: phone: 613-286-1423;
fax: 613-562-5873; e-mail: [email protected]).
This study evaluates the implications of an existing carbon tax on international trade in the agriculturalsector. Applying uniformly to all fossil fuels combusted within its borders, the province of BritishColumbia unilaterally introduced a carbon tax on July 1, 2008. In 2012, the province granted anexemption from the tax to certain agricultural sectors. Using commodity-specific trade flows andexploiting cross-provincial and intertemporal variation, we find little evidence that the carbon tax isassociated with any meaningful effects on agricultural trade despite the sector being singled out as“at risk” by the provincial government. Our findings suggest that there is not compelling evidenceto support exempting the agricultural sector from the tax. Discussion of potential policy remediesto address the tax’s potential effects on firm profitability and international competitiveness is alsoincluded.
Dans la presente etude, nous examinons les repercussions qu’une taxe sur le carbone existante exerce surle commerce international du secteur agricole. Le 1er juillet 2008, la Colombie-Britannique a assujettiunilateralement tous les combustibles fossiles utilises sur son territoire a une taxe sur le carbone. En2012, la province a accorde une exoneration de cette taxe a certaines activites agricoles. Un examendes flux commerciaux de certaines marchandises de base ainsi que des variations interprovinciales etinter-temporelles fournit peu d’elements voulant que la taxe sur le carbone entraıne des repercussionsimportantes sur le commerce agricole malgre le fait que le gouvernement de cette province ait qualifie lesecteur comme etant «a risque». Les resultats de notre etude permettent de penser qu’il n’existe aucuneraison imperieuse d’appuyer l’exoneration de cette taxe au secteur agricole. Nous avons egalementaborde la question des solutions politiques qui pourraient attenuer les repercussions potentielles de lataxe sur la rentabilite et la competitivite internationale des entreprises.
INTRODUCTION
British Columbia (BC) introduced a carbon tax on all fossil fuels purchased in the provinceon July 1, 2008. Carbon taxes are considered to be among the most efficient market-basedinstruments to reduce greenhouse gas emissions: They raise revenue which can be usedfor productive purposes such as reducing other tax distortions (Goulder et al 1997),provide strong incentives for technological innovation (Fischer and Newell 2008), andhave small transaction costs (Stavins 1995). Further, BC’s carbon tax combines a uniqueset of policy characteristics, placing it among the best designed environmental policies inthe world: (i) the carbon tax is coupled with targeted rebates to low-income and remotehouseholds, alleviating concerns over the regressivity; (ii) revenue from the carbon tax is
Canadian Journal of Agricultural Economics 00 (2014) 1–23
DOI: 10.1111/cjag.12048
1
2 CANADIAN JOURNAL OF AGRICULTURAL ECONOMICS
used to reduce rates of corporate and personal income taxation, a design that admits thepossibility of a “double dividend” (i.e., a reduction in greenhouse gas emissions as well asan increase in economic output) (Goulder 1995); and (iii) the tax applies an identical rateper tonne carbon dioxide equivalent (tCO2e) to all emitters, invoking the equimarginalprinciple and yielding greenhouse gas reductions at the lowest social cost. Yet, while thetax is well-designed, it was enacted unilaterally and applies exclusively to BC residentsand firms—concerns linger over its consequences on particular sectors.
Unilateral implementation leads to apprehension over adverse competitiveness ef-fects, especially in the presence of trade. Differential environmental regulations may causefirms operating in BC to move to other untaxed jurisdictions. This can reduce the effec-tiveness of the tax (and compromise efficiency) and undermine domestic support for thepolicy. Difficulties are greatest in sectors with relatively high greenhouse gas intensity,those which face international trade pressure, those which are “footloose,” and thosewhich receive little benefit from the revenue-recycling mechanisms that accompaniedthe tax. As such, in its 2012 budget speech, the BC Government looked to “examinethe tax’s impact—both positive and negative—on every economic sector” (BC BudgetSpeech 2012, p. 15). Of note, the government stated its intention to “pay particularattention to agriculture, recognizing its critical importance to our future” (BC BudgetSpeech 2012, p. 15).
Singling out the agricultural sector as “at risk” is likely the result of the prebudgetconsultation process. Industry representatives claimed that the tax was “devastating”agricultural producers and that “it is one of the hardest-hit industries when it comesto the carbon tax” (BC Budget Consultation 2012). They also claimed that, “Thereis no offset for [agricultural producers], so no matter what you give back in taxes, itdoesn’t matter” (BC Budget Consultation 2012). As a result of these deliberations, certainagricultural subsectors were granted exemptions from the BC carbon tax starting in 2012.The BC Government did not provide empirical evidence to justify the agricultural sector’sexemptions, nor did it specify which criteria or evidence would support other sectors’exemptions from the tax based on competitiveness arguments.
This paper empirically evaluates the consequences of the BC carbon tax on tradein agricultural commodities. We exploit a commodity-specific panel data set reflectingtrade in all provinces between 1990 and 2011 (prior to agricultural exemptions beingimplemented). After controlling for geography and time invariant factors in addition toother covariates (e.g., weather), we find little evidence that the implementation of the BCcarbon tax is associated with a decline in exports from the agricultural sector; the tax doesnot appear to have any meaningful effects on the international competitiveness of BC’sagricultural sector. Although most of our estimates are statistically insignificant, pointestimates generally suggest an increase in aggregate international agricultural exportsand a reduction in imports coincident with the tax. Introducing commodity-specificheterogeneity enables us to estimate several negative effects for particular commoditiesbut none are statistically distinguishable from zero.
While our empirical findings are not precise, this paper makes two important con-tributions to the literature. To start, we are the first to econometrically analyze theimplications of an actual carbon tax on the agricultural sector. To our knowledge, noother study has addressed this issue using real data (i.e., based on actual experiencewith carbon taxes rather than via simulation models). Second, this study is useful for an
EFFECT OF CARBON TAXES ON AGRICULTURAL TRADE 3
ongoing and timely policy discussion. Climate policies, including BC’s Climate ActionPlan, continue to be debated by national and subnational governments. Overall, ourfindings suggest that exemptions granted to the agricultural sector are not supported bythe empirical evidence. While public pressure may induce governments to compensatesectors following the introduction of similar taxes, these provisions may be inefficient andunnecessary. Consequently, we discuss alternative rebating schemes which would alleviatecompetitiveness pressures at a lower efficiency cost than sector-specific exemptions.
The remainder of the paper is structured as follows. The second section describesthe BC carbon tax, with a particular focus on the use of revenues raised as a result ofthe tax. The third section presents our empirical analysis. The fourth section reviewsmechanisms that could be used to mitigate any potential negative impacts of a carbon taxon international trade and profitability of the agricultural sector in BC. The last sectionconcludes.
OVERVIEW OF THE BC CARBON TAX
The introduction of the BC carbon tax surprised the majority of province’s residents(Harrison 2012). Announced by the province’s Finance Minister in her February 2008budget speech, the tax was implemented very quickly. By July 1, 2008, BC became thefirst jurisdiction in North America to tax fossil fuels based on carbon content at anequivalent level.1 Only during the second half of 2007 did the government begin to hint thatenvironmental pricing was possible. Even then, there was no public acknowledgement thatcarbon taxes were a prospective option until a speech late in October 2007. Early reactionsto the carbon tax were positive and polls showed that a majority of voters supported thepolicy (Harrison 2012). Residents appear to have understood the impetus for the tax andaccepted that it was a well-designed policy. The most notable demonstration of popularsupport was when the Liberal Party of BC, the political party that introduced the tax,was granted a third consecutive majority government in a post-carbon tax election.
The carbon tax is comprehensively applied to all greenhouse gas emissions generatedfrom burning fossil fuels, with the effective tax rate for each fuel type based on its carboncontent. The tax rate started at $10 per tCO2e in July 2008 and increased by $5 pertonne every year reaching $30/tCO2e by July 2012 (BC Ministry of Finance 2011). At$10/tCO2e, the tax represents an increase of 2.69 ¢/liter of diesel and at $30/tCO2e thisincreases to 7.67 ¢/liter. Increasing the level of the tax through time allows producers togradually adjust their fuel usage and change their habits. This feature of the policy alsofacilitates investment planning by firms and individuals, since a fixed five-year scheduleof tax rates was legislatively mandated. Initially, the BC carbon tax was implemented withno exemptions granted to any groups or industries.
Generating an estimated $960 million in 2011–12 (BC Ministry of Finance 2012), theBC carbon tax was introduced as revenue neutral. Revenue neutrality entails returning allcarbon tax revenues to residents via adjustments to personal and corporate taxes as well asvia lump-sum transfers. The generated revenue lowered each of personal, corporate, andsmall business income tax rates. It also reduced school property taxes for land classified
1 The city of Boulder, Colorado and the province of Quebec implemented carbon taxes in 2007, butat much lower levels than in BC.
4 CANADIAN JOURNAL OF AGRICULTURAL ECONOMICS
as “farm,” gave industries property tax credits, and provided transfers to lower-incomefamilies and northern and rural homeowners (BC Ministry of Finance 2012). The BCgovernment, for example, lowered the rate of tax on the bottom two personal income taxbrackets and introduced a series of lump-sum transfers to protect low-income and ruralhouseholds. Low-income households receive quarterly rebates, which, for a family of four,equal approximately $300 per year. Beginning in 2011 northern and rural homeownersreceived a further benefit of up to $200.
Despite these tax shifts, there is a perception that the carbon tax is reducing the BCagricultural sector’s competitiveness and profitability while dramatically increasing theirenergy costs. The carbon tax was introduced during an uncertain period for producers.A high Canadian dollar, volatile commodity prices, and lack of trade protection havebeen called a “perfect storm” for the farming community. The coincident timing of thesechallenges with the introduction of the carbon tax may have led farmers to target andblame the carbon tax for the difficulties in the sector (BC Budget Consultation 2012).
A major reason for the agricultural sector’s dislike of the carbon tax is the perceiveddifficulties in adapting to the new tax by decreasing fuel use in the short run. Heatinggreenhouses and harvesting crops with machinery are essential to the proper functioningof farms. An increase in the price of fuels leads to an increase in energy costs that couldlead to adverse results for the industry: decreasing profits, reduction of planted acres, adecline in net exports, or even farms leaving the BC market altogether.
As a result of these perceived challenges, in 2012 the government granted BC’s high-tech greenhouse vegetable and horticulture growers a one-time, $7.6 million reprieve fromthe carbon tax, “allowing producers to focus on maintaining their competitive edge” (BCMinistry of Agriculture 2012). This was followed in the 2013 Budget by a permanentgrant program for commercial greenhouse growers (vegetable, floriculture, wholesaleproduction, and forest seedling nurseries) that is set at 80% of the carbon tax paid onnatural gas and propane for heating and CO2 production. Forthcoming legislation willalso exempt farmers from carbon tax on the purchase of colored gasoline and diesel usedfor farm purposes starting in January 2014.
The objective of these exemptions is to enable BC growers to better compete withproducers in the United States and Mexico. However, as exemptions can impose largeefficiency costs (Bohringer and Rutherford 1997), they should only be considered whenthere is compelling evidence that a sector is being displaced by output from other regions.To our knowledge, this evidence was never produced when justifying the exemption toBC’s agriculture sector. The objective of this study is to quantify impacts on internationalagricultural trade attributable to the carbon tax. In other words, we aim to estimatethe extent to which the carbon tax affected the international competitiveness of BC’sagricultural sector and to evaluate whether exemptions can be justified empirically.
EMPIRICAL ANALYSIS
The empirical analysis is divided into several subsections. First, we examine whether BC’sagricultural sector should be considered carbon intensive compared to other traded goodssectors operating within the province. Next, we present our econometric methodology,data, and estimate a series of models focusing on the effect of the carbon tax on agriculturalexports and imports. Finally, we discuss our results in light of the agricultural sector’s taxexemption.
EFFECT OF CARBON TAXES ON AGRICULTURAL TRADE 5
Is BC’s Agricultural Sector Carbon Intensive?The introduction of unilateral environmental regulations increases domestic costs of pro-ducing pollution-intensive goods and may induce comparatively disadvantaged dirty goodproduction to shift from a regulated jurisdiction to an unregulated jurisdiction. This coreprediction comes from the canonical Heckscher–Ohlin model of comparative advantage(McGuire 1982; Copeland and Taylor 2004). In a small open economy, environmentalregulation reduces output and net exports from the dirty sector in the regulating economy.However, even though unilateral environmental regulation reduces output and net exportsin the dirty sector—as factors shift out of the dirty sector into the clean sector—outputand net exports in the clean sector potentially increase. As such, it is useful to categorizesectors as “clean” or “dirty” according to carbon intensity in order to predict whether agiven sector is likely to expand or contract in response to a carbon tax.
While classifying clean and dirty commodities is straightforward in theory, it is lessso in practice. Multiple sectors produce a range of outputs; some goods are producedexclusively for domestic markets, while others are exported. The Heckscher–Ohlin theoryis based on homogeneous goods, yet, in reality, consumers have preferences over theorigin of goods, particular brands, or other heterogeneous characteristics—in general,tradable goods cannot be considered homogeneous (e.g., Carter et al 2006). As a first-order approximation however, it is possible to pinpoint sectors, based on the structure ofBC’s economy, that have the largest probability of being adversely affected following theintroduction of a unilateral carbon tax.
Data on fossil fuel usage by sector and trade by commodity are available fromStatistics Canada’s System of National Accounts (see Supplementary Material). Fromthese data, it is possible to obtain the cost share of direct fossil fuel inputs required toproduce a unit of each commodity, as well as the trade intensity of each commodity.
Figure 1 plots the trade intensity (horizontal axis) for each commodity in StatisticsCanada’s S-Level database against the cost share of fossil fuel in its production (ver-tical axis) (national accounts data are available at different levels of aggregation, withthe S-Level the only level of aggregation publicly available for provincial data). Thesetwo measures are directly relevant to the Heckscher–Ohlin model of comparative advan-tage. Commodities that are not highly traded are unlikely to experience large changes inimports or exports as a result of unilateral environmental policy. Similarly, sectors thatdo not consume substantial amounts of fossil fuels are unlikely to experience large costincreases due to the carbon tax, thus will not experience major changes in their ability tocompete with foreign producers. Commodities that use a high proportion of fossil fuelsin production and those that are highly traded are most susceptible to pressures frominternational competition.
Energy-intensive and trade-exposed thresholds have been widely used in policy for-mation. For example, the Waxman–Markey cap and trade bill, a prominent piece ofU.S. legislation, defined a sector as energy intensive and trade exposed if energy expen-ditures represented more than 5% of total costs, and if trade intensity was greater than15%.2 Figure 1 demonstrates that most commodities produced in BC have both low trade
2 Trade intensity, as defined in the Waxman–Markey bill and adopted here, is (imports+exports)/(imports+domestic output). Trade intensity for the United States as a whole is muchlower than for a Canadian province due to differences in size.
6 CANADIAN JOURNAL OF AGRICULTURAL ECONOMICS
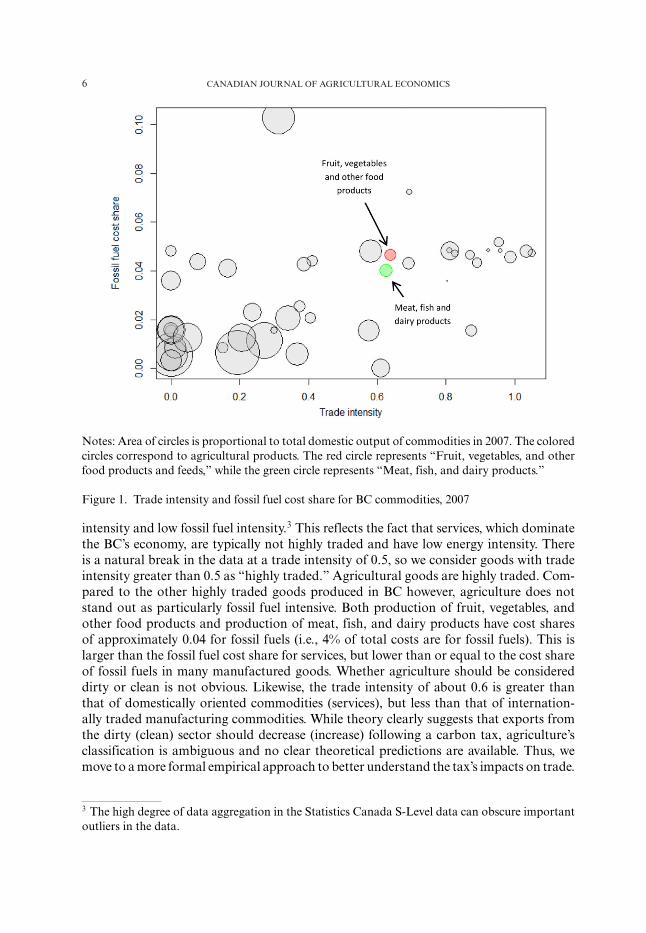
Notes: Area of circles is proportional to total domestic output of commodities in 2007. The coloredcircles correspond to agricultural products. The red circle represents “Fruit, vegetables, and otherfood products and feeds,” while the green circle represents “Meat, fish, and dairy products.”
Figure 1. Trade intensity and fossil fuel cost share for BC commodities, 2007
intensity and low fossil fuel intensity.3 This reflects the fact that services, which dominatethe BC’s economy, are typically not highly traded and have low energy intensity. Thereis a natural break in the data at a trade intensity of 0.5, so we consider goods with tradeintensity greater than 0.5 as “highly traded.” Agricultural goods are highly traded. Com-pared to the other highly traded goods produced in BC however, agriculture does notstand out as particularly fossil fuel intensive. Both production of fruit, vegetables, andother food products and production of meat, fish, and dairy products have cost sharesof approximately 0.04 for fossil fuels (i.e., 4% of total costs are for fossil fuels). This islarger than the fossil fuel cost share for services, but lower than or equal to the cost shareof fossil fuels in many manufactured goods. Whether agriculture should be considereddirty or clean is not obvious. Likewise, the trade intensity of about 0.6 is greater thanthat of domestically oriented commodities (services), but less than that of internation-ally traded manufacturing commodities. While theory clearly suggests that exports fromthe dirty (clean) sector should decrease (increase) following a carbon tax, agriculture’sclassification is ambiguous and no clear theoretical predictions are available. Thus, wemove to a more formal empirical approach to better understand the tax’s impacts on trade.
3 The high degree of data aggregation in the Statistics Canada S-Level data can obscure importantoutliers in the data.
EFFECT OF CARBON TAXES ON AGRICULTURAL TRADE 7
Estimating the Effect of the Carbon Tax on Agricultural TradeJaffe et al (1995, p. 157) conducted a review of econometric studies and concluded that“there is relatively little evidence to support the hypothesis that environmental regulationshave had a large impact on competitiveness.” Several deficiencies plagued the earlyanalysis however—endogeneity of pollution regulations and unobserved heterogeneityare most prominent. After correcting for these issues, environmental regulation hasbeen shown to have a modest effect on trade, investment, and plant location decisions(Edgerington and Minier 2003; Levinson and Taylor 2008; Kellenberg 2009; Hanna2010; Copeland 2012). Levinson and Taylor (2008), for example, estimate that a doublingin pollution abatement expenditures in response to more stringent U.S. environmentalregulation between 1977 and 1986 led to an increase in net imports of pollution-intensivegoods from Mexico of around 40%.
There are two reasons why a prospective negative relationship between exports andenvironmental regulation is important for policy makers. First, out-migration of pollutingindustries, from regulated to unregulated jurisdictions, works against the objectives of thepolicy—emissions in the unregulated jurisdiction are unaffected by the policy. Trade-related “leakage” is often perceived as unavoidable, but most estimates find that it is smallto moderate relative to the effect of the policy (Felder and Rutherford 1993; Elliot et al2010). Still, emissions leakage is a concern. Second, if unilateral environmental policycauses a shift of economic activity to other countries, there may be a decline in domesticwelfare associated with losses in industry competitiveness. Adverse competitiveness effectsoccupy a central position in many policy discussions.
Competitiveness is an imprecisely defined term, loosely used to refer to profits, em-ployment, and trade among other things. In an effort to examine the impact of the BCcarbon tax on “agricultural competitiveness,” we construct a data set covering interna-tional trade and output in agricultural commodities in all Canadian provinces and thenestimate whether the introduction of the BC carbon tax is associated with a measurablechange in trade patterns. To do so, we build on the framework introduced in Levinsonand Taylor (2008). Specifically, we start from a partial equilibrium model of world tradein the presence of environmental regulations:
Xijt = β0 + β1sjt + β2cijt + β3cXijt + β4τijt + β5τ
Xijt + εijt
where Xijt is exports or imports of good i from region j,4 sjt is region j’s share of worldincome,5 cijt is a unit cost function for production of good i in region j at time t, τ ijt is
4 In some of our estimates, we follow Levinson and Taylor (2008) by normalizing exports andimports by the size of the domestic industry. This is a convention in the international trade literatureto accommodate the significant differences in industry size (Leamer and Levinsohn 1995). Inparticular, it ensures that any omitted variables that are correlated with industry size do not enterthe error term and cause bias in estimation results. It has the additional benefit of making thedependent variable more likely to be stationary as it is a share rather than a level. We also estimatethe equation where the dependent variable is not normalized.5 The intuition for the inclusion of the variable sjt is apparent from the derivation presented inLevinson and Taylor (2008): if the regulating country’s share of world income is larger than itsshare of world production, then (assuming identical technologies and preferences) it will havepositive net imports and vice versa.
8 CANADIAN JOURNAL OF AGRICULTURAL ECONOMICS
the environmental policy in region j for good i at time t, and the superscript X indicatesa foreign variable.
We do not however observe home costs, foreign costs, or foreign environmentalpolicies. As in Levinson and Taylor (2008), we accommodate these unobservables with aset of interacted time and region fixed effects controlling for factors that would otherwiseconfound our analysis. We specify and estimate the following model:
Xijt = aτjt + bij + dit + f(tjt, pjt
) + εijt
The good-region fixed effect, bij, captures comparative advantage. Comparative ad-vantage refers to slowly moving stocks such as land quality, climate, human, and physicalcapital. This time-invariant commodity-region parameter reflects average differences be-tween home and foreign unit costs that govern comparative advantage. The commodity-time dummy, dit, controls for commodity-specific changes over time that affect allCanadian provinces. For example, variation arising from national trade policy, exchangerate fluctuations, tariffs, and the mean ratio of foreign to domestic costs of production arecaptured by this parameter. Together, these fixed effects enable us to net out factors whichdrive common home-foreign jurisdiction cost differentials. Remaining variation comesfrom province-commodity-year shocks. The most prominent of these is prevailing weather.As such, we incorporate a polynomial of weather terms, f
(tjt, pjt
), which includes actual
and squared spring and summer temperature indices (given by tjt) as well as actual andsquared spring and summer precipitation indices (given by pjt). Finally, the error terms,εijt, are assumed to be uncorrelated with the primary variable of interest, the carbon tax,τjt, and pick up changes in foreign environmental policies, classical measurement errorin addition to time-variant changes in the ratio of home and foreign commodity-specificunit costs. Unbiased estimates for the carbon tax coefficient rely on lack of correlationbetween these omitted variables and the independent variables in the model, a plausibleassumption in this case as the carbon tax was unilaterally implemented and not agriculturespecific.
Our coefficient of interest is a. This parameter shows the impact of the tax onagricultural exports and imports. Unlike Levinson and Taylor (2008) (and many othercontributors to the literature on international trade and the environment), we do notemploy a proxy for environmental regulatory stringency. Instead we measure stringencydirectly with the carbon tax rate.6 This exogenous measure of regulatory stringencysimplifies our estimation significantly compared to other contributions as it is preciseand plausibly unconfounded with the error term.7 This is an important contribution tothe literature as few studies have a comparably explicit measure of regulatory stringency.Finally, we conduct a sequence of robustness checks to test whether changes in the sample
6 The typical measure of regulatory stringency in this literature is pollution abatement cost per unitof value added. Since industry structure can change in response to regulatory stringency, this proxymeasure is endogenous, creating difficulties with estimation.7 One concern in the previous literature linking pollution regulation at the sector level to interna-tional trade is that policy makers may select regulations based on their expectations of the responseof the sector to the regulation, such that the regulation is endogenous. In our case, BC applied thecarbon tax uniformly to all sectors, such that this type of endogeneity is less likely to be a concern.
EFFECT OF CARBON TAXES ON AGRICULTURAL TRADE 9
or estimating equation induce changes in the economic or statistical significance of ourcoefficients.
Bias may still arise if there are omitted variables that are correlated with agriculturaltrade and the carbon tax. One potential confounder is the emissions offset system imple-mented at the same time as the carbon tax. This offset system supported the provincialgovernment’s aim to become carbon neutral—all publicly funded agencies had to achievemandated carbon neutrality through emissions reductions or offsets. Agricultural projectsare eligible sources for offset projects and a small number of credits originate in the agri-cultural sector (we count fewer than 10 agricultural offset projects in the retired offsetcredit registry).8 To the extent that these are subsidies for the agricultural sector im-plemented concurrently with the tax, omitting them in the regression could lead us tounderestimate the effect of the tax—that is, the offset program will lead to an attenuationof our coefficient of interest. We believe that any bias attributable to the program will bevery small due to the exceedingly small number of agricultural offset projects that werefunded. Still, supposing that offsets are an important source of bias, our coefficient onthe carbon tax can be thought of as the joint effect of the tax and offset programs.
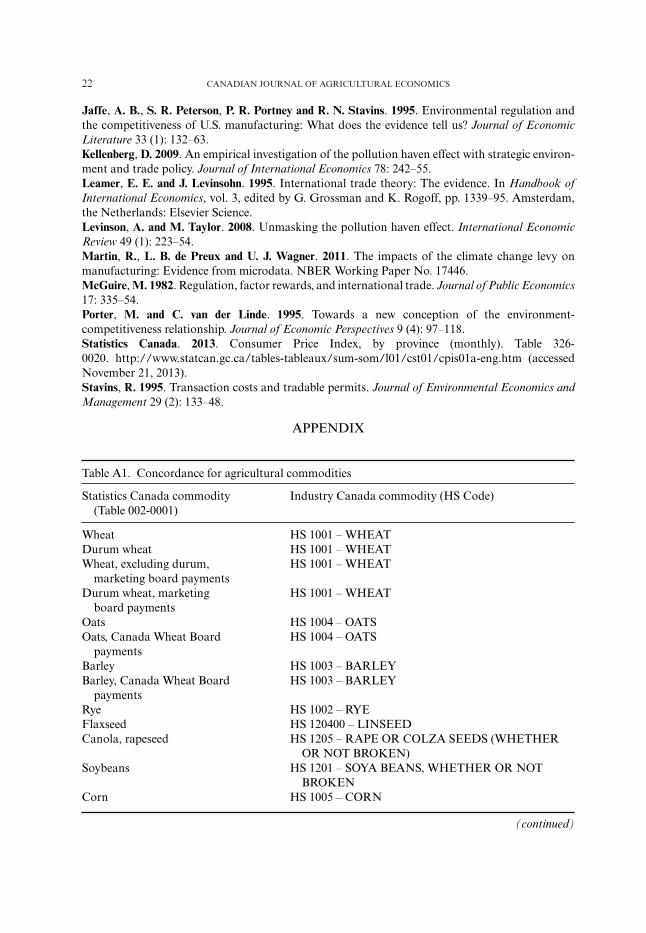
DataOur data set is assembled from three sources, each requiring manual processing. Theempirical strategy is based on comparing international agricultural trade on a commoditylevel between BC and other provinces. Commodity classifications are coarse however.There may be an imperfect match between the commodities traded in each province.For example, one commodity in our sample is edible fruits and nuts, which clearly isheterogeneous. If one province produces a distinct subset of this aggregate commoditycompared to another, it may yield less useful information about a counterfactual. Wecollect annual data on farm receipts by agricultural commodity and by province for 1970–2011 from Statistics Canada (Table 002-0001) and annual data on provincial importsand exports by agricultural commodity from 1990–2011 from Industry Canada (seeSupplementary Material). The commodity classifications used by Statistics Canada andIndustry Canada are slightly different, so manual merging was needed. Table A1 in theAppendix documents the commodity concordance table that we assembled to conductthe analysis.9 In addition to data on production, imports, and exports, data on weatherare sourced from Environment Canada’s Climate Trends and Variations Bulletins, whichreports regional precipitation and temperature anomalies on a seasonal basis. Althoughthe regions used by Environment Canada closely approximate provincial boundaries, thematch is not exact. The concordance between Environment Canada regions and provincesused in the analysis is reported in Table A2.10 All data and code are available for downloadfrom the authors’ websites.
8 The registry is available at: http://www.pacificcarbontrust.com/our-projects/offset-registry/.9 Supply-managed commodities (poultry, dairy, etc.) are not included in the analysis, since producersin these sectors face different incentives compared to other sectors. Specifically, we (a) do not expectthat these products will be exported and (b) that trade restrictions (quota levels vis-a-vis tariffs,etc.) may be considered endogenous to domestic environmental policy.10 The regions adopted by Environment Canada are reported in seasonal bulletins:http://www.ec.gc.ca/adsc-cmda/default.asp?lang=En&n=4CC724DA-1#a4.
10 CANADIAN JOURNAL OF AGRICULTURAL ECONOMICS
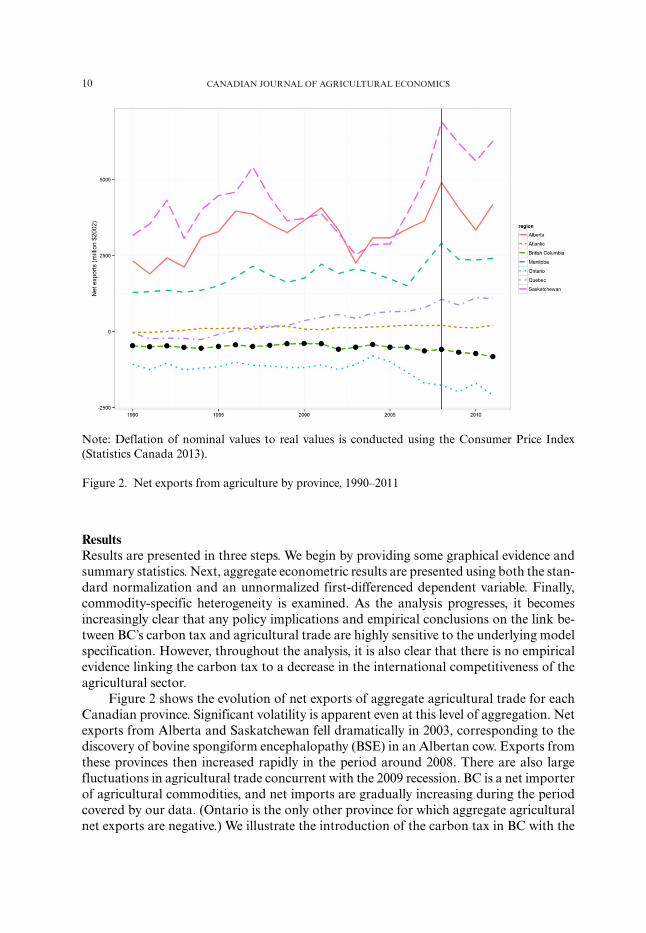
Note: Deflation of nominal values to real values is conducted using the Consumer Price Index(Statistics Canada 2013).
Figure 2. Net exports from agriculture by province, 1990–2011
ResultsResults are presented in three steps. We begin by providing some graphical evidence andsummary statistics. Next, aggregate econometric results are presented using both the stan-dard normalization and an unnormalized first-differenced dependent variable. Finally,commodity-specific heterogeneity is examined. As the analysis progresses, it becomesincreasingly clear that any policy implications and empirical conclusions on the link be-tween BC’s carbon tax and agricultural trade are highly sensitive to the underlying modelspecification. However, throughout the analysis, it is also clear that there is no empiricalevidence linking the carbon tax to a decrease in the international competitiveness of theagricultural sector.
Figure 2 shows the evolution of net exports of aggregate agricultural trade for eachCanadian province. Significant volatility is apparent even at this level of aggregation. Netexports from Alberta and Saskatchewan fell dramatically in 2003, corresponding to thediscovery of bovine spongiform encephalopathy (BSE) in an Albertan cow. Exports fromthese provinces then increased rapidly in the period around 2008. There are also largefluctuations in agricultural trade concurrent with the 2009 recession. BC is a net importerof agricultural commodities, and net imports are gradually increasing during the periodcovered by our data. (Ontario is the only other province for which aggregate agriculturalnet exports are negative.) We illustrate the introduction of the carbon tax in BC with the

EFFECT OF CARBON TAXES ON AGRICULTURAL TRADE 11
Table 1. Annual average growth rate in gross agricultural exports
Panel A2001–07 2009–11 Difference
British Columbia −3.93 −4.07 −0.14Other provinces 0.82 1.76 0.94Difference −4.75 −5.83 −1.08
Panel B2000–08 2008–11 Difference
British Columbia −0.49 −4.86 −4.37Other provinces 5.39 −2.93 −8.32Difference −5.88 −1.93 3.95
Note: Values are in percentage terms and refer to the real dollar value of agricultural exports.
vertical black line. At this level of aggregation, there is little visually discernable changein net exports.
Table 1 provides numerical context for Figure 2. It summarizes growth rates, bothprior to and following the introduction of the carbon tax, in the real value of aggregategross agricultural exports in BC compared to other provinces (note that the table focuseson gross exports, while Figure 2 shows net exports). Panel A focuses on 2001–07 (priorto the 2008 introduction of the tax) compared with 2009–11 (posttax). The first rowdemonstrates that exports of agricultural commodities from BC declined by 3.93% in realterms per year during the early part of the decade compared with a decline of 4.07% from2009 to 2011. The second row repeats the calculations for the rest of Canada: exportsgrew by 0.82% annually in other provinces in 2001–07 and by 1.76% in 2009–11. Table 1’sright-hand column then shows the difference in the growth rates in exports before andafter the tax in BC and the rest of Canada. The bottom cell presents the difference-in-differences calculation which suggests a decline of 1.08% in gross exports attributable tothe tax. This insinuates that the tax had a negative effect on exports, perhaps warrantingthe exemption granted by the government.
Before drawing conclusions however, caution is required when interpreting theseresults. The tax was introduced on July 1, 2008 and a slight shift in the window ofanalysis generates completely different results. Panel B of Table 1 changes the periodsboth before and after the tax slightly. Now, the before period is from 2000 to 2008while the after period is 2008–11. This one-year change yields results that suggest alarge positive impact of the tax—the difference-in-differences calculation shows that BC’sgross agricultural exports increased by 3.95% relative to the rest of Canada. Clearly,these high level comparisons are insufficient to precisely determine the impact of thecarbon tax on trade. Moreover, Table 1 highlights two challenges that arise when usingsimple averages to evaluate environmental policy. First, there is notable intertemporalvolatility in trade over time. Results are sensitive to the selection of the period of analysis.Second, there is likely substantial commodity-specific heterogeneity across commoditieseven within provinces—for example, Alberta’s aggregate agricultural sector was moreaffected by BSE in 2003 as cattle comprised a larger share of exports compared with
12 CANADIAN JOURNAL OF AGRICULTURAL ECONOMICS
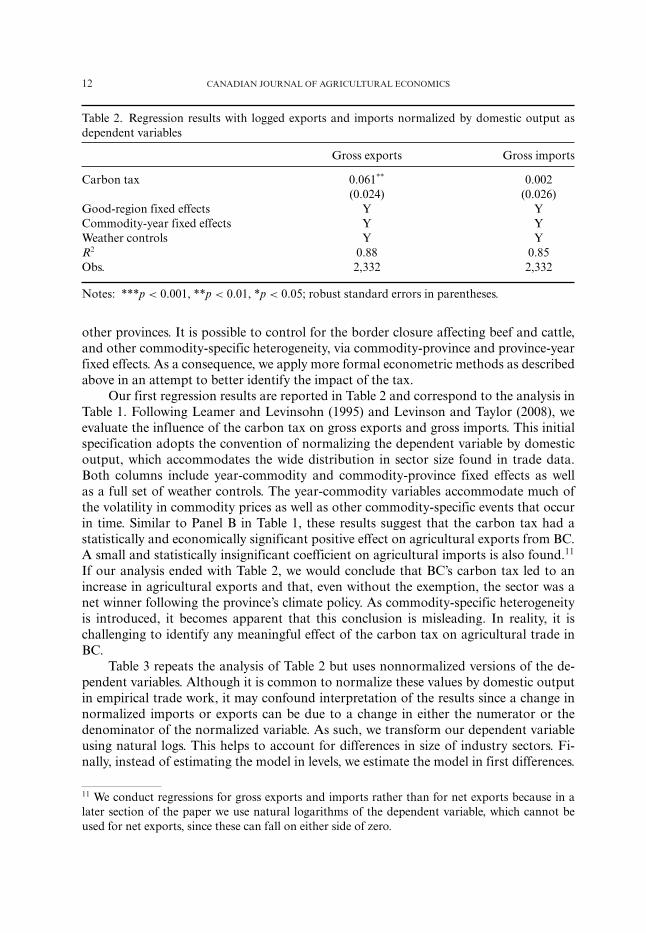
Table 2. Regression results with logged exports and imports normalized by domestic output asdependent variables
Gross exports Gross imports
Carbon tax 0.061** 0.002(0.024) (0.026)
Good-region fixed effects Y YCommodity-year fixed effects Y YWeather controls Y YR2 0.88 0.85Obs. 2,332 2,332
Notes: ***p < 0.001, **p < 0.01, *p < 0.05; robust standard errors in parentheses.
other provinces. It is possible to control for the border closure affecting beef and cattle,and other commodity-specific heterogeneity, via commodity-province and province-yearfixed effects. As a consequence, we apply more formal econometric methods as describedabove in an attempt to better identify the impact of the tax.
Our first regression results are reported in Table 2 and correspond to the analysis inTable 1. Following Leamer and Levinsohn (1995) and Levinson and Taylor (2008), weevaluate the influence of the carbon tax on gross exports and gross imports. This initialspecification adopts the convention of normalizing the dependent variable by domesticoutput, which accommodates the wide distribution in sector size found in trade data.Both columns include year-commodity and commodity-province fixed effects as wellas a full set of weather controls. The year-commodity variables accommodate much ofthe volatility in commodity prices as well as other commodity-specific events that occurin time. Similar to Panel B in Table 1, these results suggest that the carbon tax had astatistically and economically significant positive effect on agricultural exports from BC.A small and statistically insignificant coefficient on agricultural imports is also found.11
If our analysis ended with Table 2, we would conclude that BC’s carbon tax led to anincrease in agricultural exports and that, even without the exemption, the sector was anet winner following the province’s climate policy. As commodity-specific heterogeneityis introduced, it becomes apparent that this conclusion is misleading. In reality, it ischallenging to identify any meaningful effect of the carbon tax on agricultural trade inBC.
Table 3 repeats the analysis of Table 2 but uses nonnormalized versions of the de-pendent variables. Although it is common to normalize these values by domestic outputin empirical trade work, it may confound interpretation of the results since a change innormalized imports or exports can be due to a change in either the numerator or thedenominator of the normalized variable. As such, we transform our dependent variableusing natural logs. This helps to account for differences in size of industry sectors. Fi-nally, instead of estimating the model in levels, we estimate the model in first differences.
11 We conduct regressions for gross exports and imports rather than for net exports because in alater section of the paper we use natural logarithms of the dependent variable, which cannot beused for net exports, since these can fall on either side of zero.
EFFECT OF CARBON TAXES ON AGRICULTURAL TRADE 13
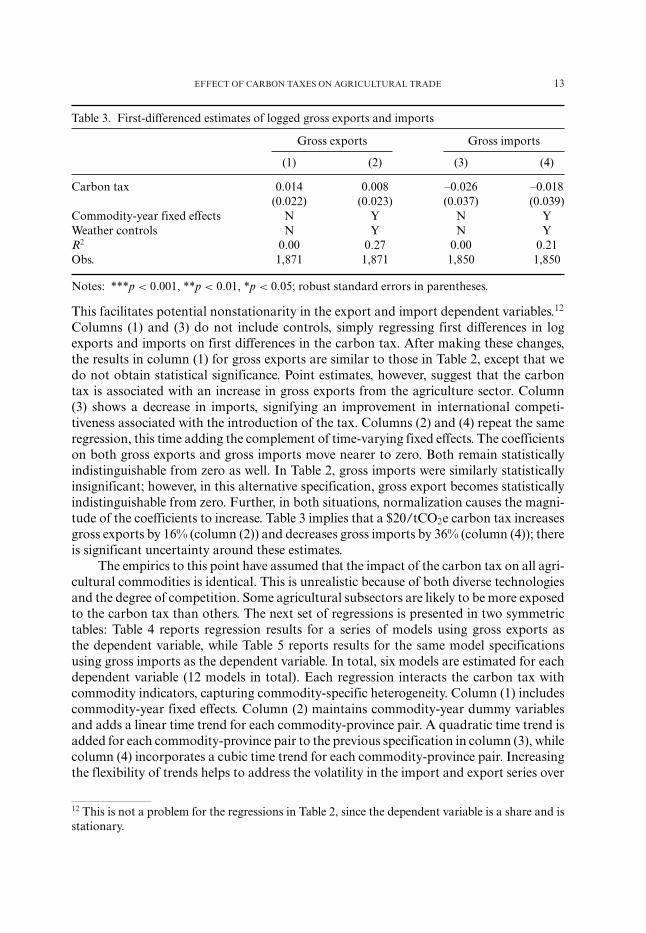
Table 3. First-differenced estimates of logged gross exports and imports
Gross exports Gross imports
(1) (2) (3) (4)
Carbon tax 0.014 0.008 –0.026 –0.018(0.022) (0.023) (0.037) (0.039)
Commodity-year fixed effects N Y N YWeather controls N Y N YR2 0.00 0.27 0.00 0.21Obs. 1,871 1,871 1,850 1,850
Notes: ***p < 0.001, **p < 0.01, *p < 0.05; robust standard errors in parentheses.
This facilitates potential nonstationarity in the export and import dependent variables.12
Columns (1) and (3) do not include controls, simply regressing first differences in logexports and imports on first differences in the carbon tax. After making these changes,the results in column (1) for gross exports are similar to those in Table 2, except that wedo not obtain statistical significance. Point estimates, however, suggest that the carbontax is associated with an increase in gross exports from the agriculture sector. Column(3) shows a decrease in imports, signifying an improvement in international competi-tiveness associated with the introduction of the tax. Columns (2) and (4) repeat the sameregression, this time adding the complement of time-varying fixed effects. The coefficientson both gross exports and gross imports move nearer to zero. Both remain statisticallyindistinguishable from zero as well. In Table 2, gross imports were similarly statisticallyinsignificant; however, in this alternative specification, gross export becomes statisticallyindistinguishable from zero. Further, in both situations, normalization causes the magni-tude of the coefficients to increase. Table 3 implies that a $20/tCO2e carbon tax increasesgross exports by 16% (column (2)) and decreases gross imports by 36% (column (4)); thereis significant uncertainty around these estimates.
The empirics to this point have assumed that the impact of the carbon tax on all agri-cultural commodities is identical. This is unrealistic because of both diverse technologiesand the degree of competition. Some agricultural subsectors are likely to be more exposedto the carbon tax than others. The next set of regressions is presented in two symmetrictables: Table 4 reports regression results for a series of models using gross exports asthe dependent variable, while Table 5 reports results for the same model specificationsusing gross imports as the dependent variable. In total, six models are estimated for eachdependent variable (12 models in total). Each regression interacts the carbon tax withcommodity indicators, capturing commodity-specific heterogeneity. Column (1) includescommodity-year fixed effects. Column (2) maintains commodity-year dummy variablesand adds a linear time trend for each commodity-province pair. A quadratic time trend isadded for each commodity-province pair to the previous specification in column (3), whilecolumn (4) incorporates a cubic time trend for each commodity-province pair. Increasingthe flexibility of trends helps to address the volatility in the import and export series over
12 This is not a problem for the regressions in Table 2, since the dependent variable is a share and isstationary.
14 CANADIAN JOURNAL OF AGRICULTURAL ECONOMICS
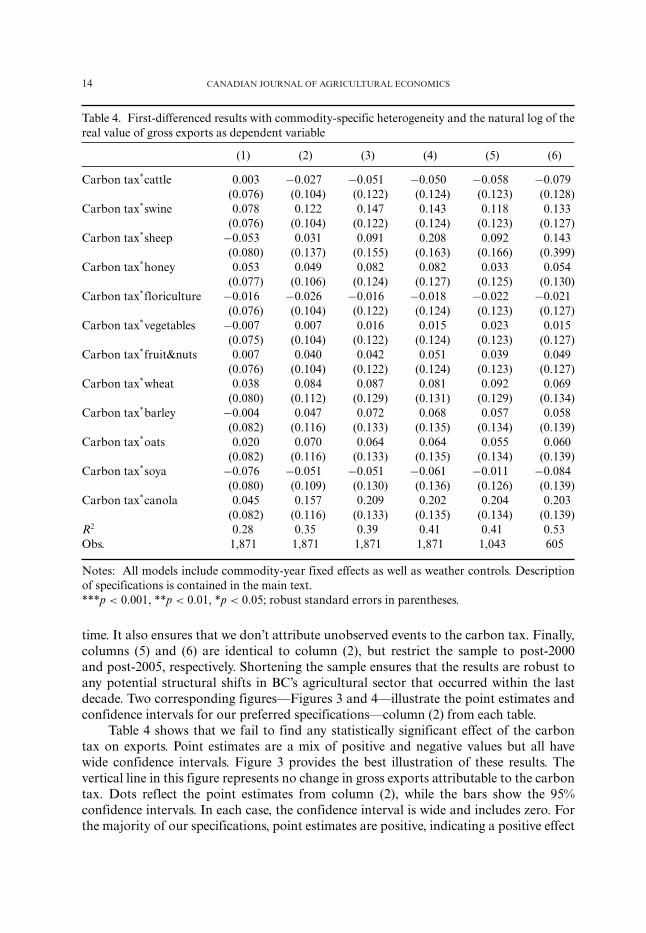
Table 4. First-differenced results with commodity-specific heterogeneity and the natural log of thereal value of gross exports as dependent variable
(1) (2) (3) (4) (5) (6)
Carbon tax*cattle 0.003 −0.027 −0.051 −0.050 −0.058 −0.079(0.076) (0.104) (0.122) (0.124) (0.123) (0.128)
Carbon tax*swine 0.078 0.122 0.147 0.143 0.118 0.133(0.076) (0.104) (0.122) (0.124) (0.123) (0.127)
Carbon tax*sheep −0.053 0.031 0.091 0.208 0.092 0.143(0.080) (0.137) (0.155) (0.163) (0.166) (0.399)
Carbon tax*honey 0.053 0.049 0.082 0.082 0.033 0.054(0.077) (0.106) (0.124) (0.127) (0.125) (0.130)
Carbon tax*floriculture −0.016 −0.026 −0.016 −0.018 −0.022 −0.021(0.076) (0.104) (0.122) (0.124) (0.123) (0.127)
Carbon tax*vegetables −0.007 0.007 0.016 0.015 0.023 0.015(0.075) (0.104) (0.122) (0.124) (0.123) (0.127)
Carbon tax*fruit&nuts 0.007 0.040 0.042 0.051 0.039 0.049(0.076) (0.104) (0.122) (0.124) (0.123) (0.127)
Carbon tax*wheat 0.038 0.084 0.087 0.081 0.092 0.069(0.080) (0.112) (0.129) (0.131) (0.129) (0.134)
Carbon tax*barley −0.004 0.047 0.072 0.068 0.057 0.058(0.082) (0.116) (0.133) (0.135) (0.134) (0.139)
Carbon tax*oats 0.020 0.070 0.064 0.064 0.055 0.060(0.082) (0.116) (0.133) (0.135) (0.134) (0.139)
Carbon tax*soya −0.076 −0.051 −0.051 −0.061 −0.011 −0.084(0.080) (0.109) (0.130) (0.136) (0.126) (0.139)
Carbon tax*canola 0.045 0.157 0.209 0.202 0.204 0.203(0.082) (0.116) (0.133) (0.135) (0.134) (0.139)
R2 0.28 0.35 0.39 0.41 0.41 0.53Obs. 1,871 1,871 1,871 1,871 1,043 605
Notes: All models include commodity-year fixed effects as well as weather controls. Descriptionof specifications is contained in the main text.***p < 0.001, **p < 0.01, *p < 0.05; robust standard errors in parentheses.
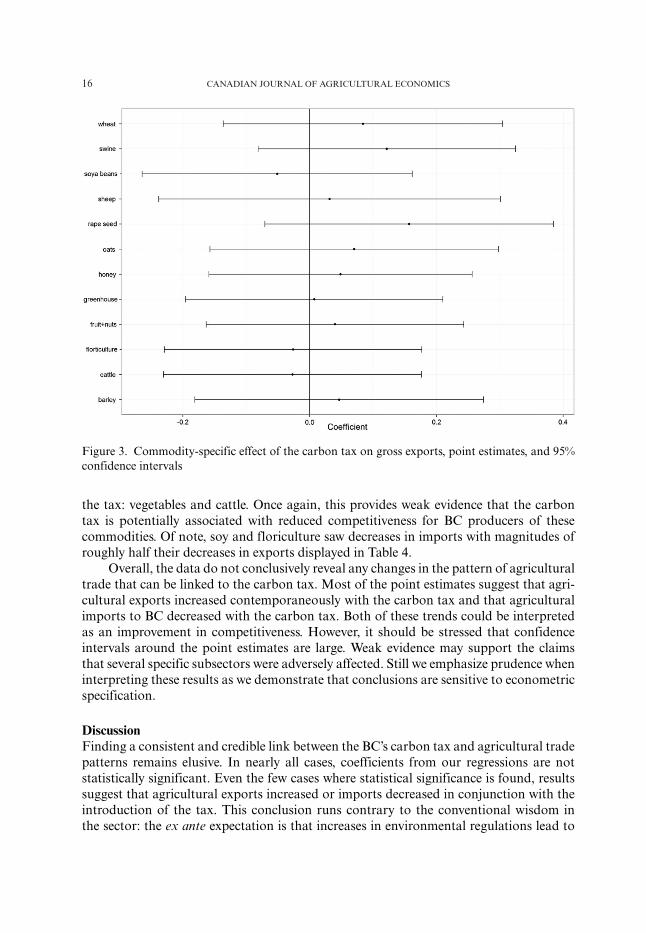
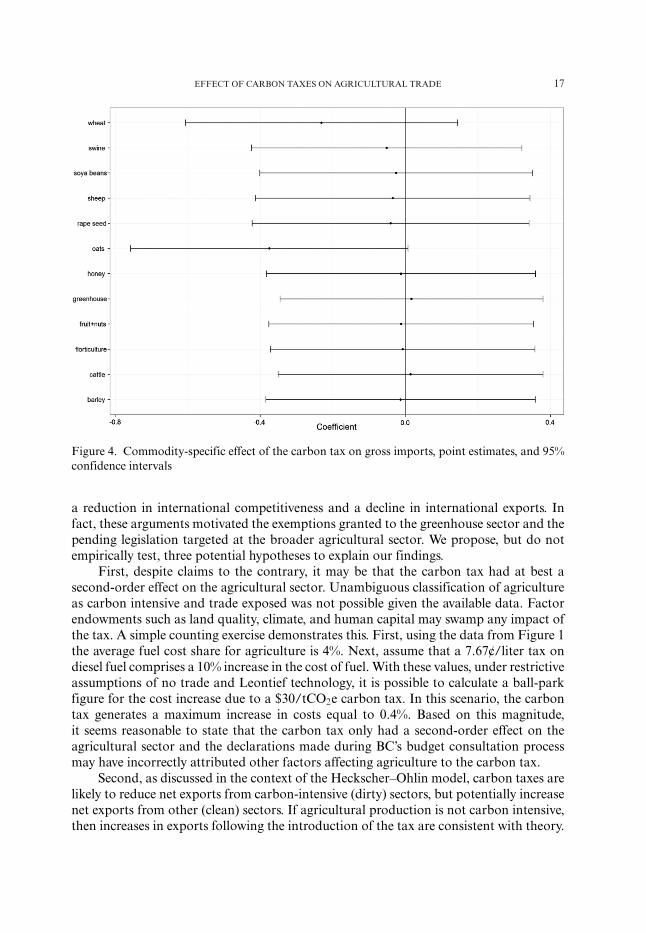
time. It also ensures that we don’t attribute unobserved events to the carbon tax. Finally,columns (5) and (6) are identical to column (2), but restrict the sample to post-2000and post-2005, respectively. Shortening the sample ensures that the results are robust toany potential structural shifts in BC’s agricultural sector that occurred within the lastdecade. Two corresponding figures—Figures 3 and 4—illustrate the point estimates andconfidence intervals for our preferred specifications—column (2) from each table.
Table 4 shows that we fail to find any statistically significant effect of the carbontax on exports. Point estimates are a mix of positive and negative values but all havewide confidence intervals. Figure 3 provides the best illustration of these results. Thevertical line in this figure represents no change in gross exports attributable to the carbontax. Dots reflect the point estimates from column (2), while the bars show the 95%confidence intervals. In each case, the confidence interval is wide and includes zero. Forthe majority of our specifications, point estimates are positive, indicating a positive effect
EFFECT OF CARBON TAXES ON AGRICULTURAL TRADE 15
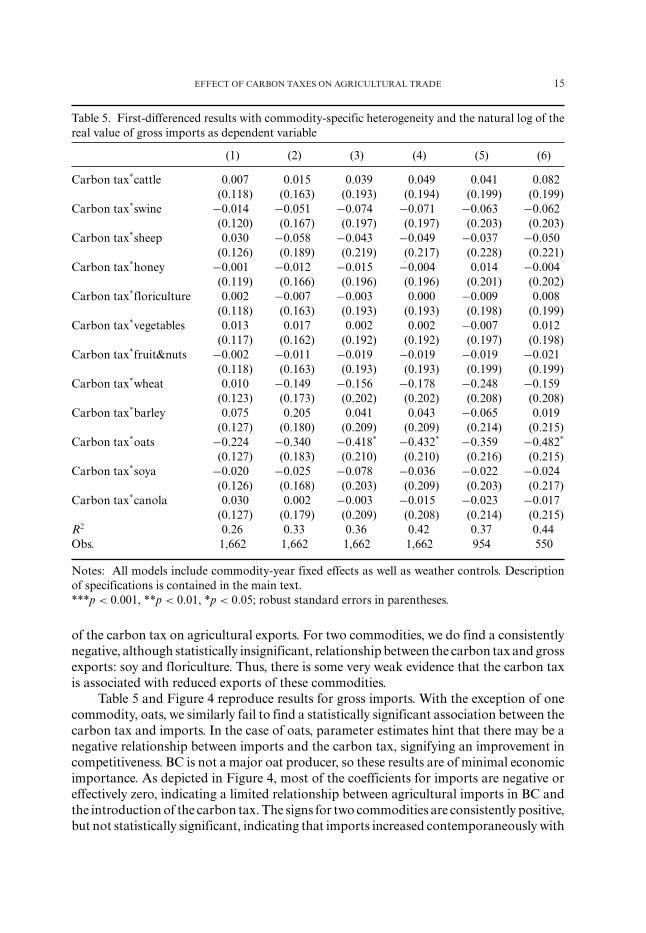
Table 5. First-differenced results with commodity-specific heterogeneity and the natural log of thereal value of gross imports as dependent variable
(1) (2) (3) (4) (5) (6)
Carbon tax*cattle 0.007 0.015 0.039 0.049 0.041 0.082(0.118) (0.163) (0.193) (0.194) (0.199) (0.199)
Carbon tax*swine −0.014 −0.051 −0.074 −0.071 −0.063 −0.062(0.120) (0.167) (0.197) (0.197) (0.203) (0.203)
Carbon tax*sheep 0.030 −0.058 −0.043 −0.049 −0.037 −0.050(0.126) (0.189) (0.219) (0.217) (0.228) (0.221)
Carbon tax*honey −0.001 −0.012 −0.015 −0.004 0.014 −0.004(0.119) (0.166) (0.196) (0.196) (0.201) (0.202)
Carbon tax*floriculture 0.002 −0.007 −0.003 0.000 −0.009 0.008(0.118) (0.163) (0.193) (0.193) (0.198) (0.199)
Carbon tax*vegetables 0.013 0.017 0.002 0.002 −0.007 0.012(0.117) (0.162) (0.192) (0.192) (0.197) (0.198)
Carbon tax*fruit&nuts −0.002 −0.011 −0.019 −0.019 −0.019 −0.021(0.118) (0.163) (0.193) (0.193) (0.199) (0.199)
Carbon tax*wheat 0.010 −0.149 −0.156 −0.178 −0.248 −0.159(0.123) (0.173) (0.202) (0.202) (0.208) (0.208)
Carbon tax*barley 0.075 0.205 0.041 0.043 −0.065 0.019(0.127) (0.180) (0.209) (0.209) (0.214) (0.215)
Carbon tax*oats −0.224 −0.340 −0.418* −0.432* −0.359 −0.482*
(0.127) (0.183) (0.210) (0.210) (0.216) (0.215)Carbon tax*soya −0.020 −0.025 −0.078 −0.036 −0.022 −0.024
(0.126) (0.168) (0.203) (0.209) (0.203) (0.217)Carbon tax*canola 0.030 0.002 −0.003 −0.015 −0.023 −0.017
(0.127) (0.179) (0.209) (0.208) (0.214) (0.215)R2 0.26 0.33 0.36 0.42 0.37 0.44Obs. 1,662 1,662 1,662 1,662 954 550
Notes: All models include commodity-year fixed effects as well as weather controls. Descriptionof specifications is contained in the main text.***p < 0.001, **p < 0.01, *p < 0.05; robust standard errors in parentheses.
of the carbon tax on agricultural exports. For two commodities, we do find a consistentlynegative, although statistically insignificant, relationship between the carbon tax and grossexports: soy and floriculture. Thus, there is some very weak evidence that the carbon taxis associated with reduced exports of these commodities.
Table 5 and Figure 4 reproduce results for gross imports. With the exception of onecommodity, oats, we similarly fail to find a statistically significant association between thecarbon tax and imports. In the case of oats, parameter estimates hint that there may be anegative relationship between imports and the carbon tax, signifying an improvement incompetitiveness. BC is not a major oat producer, so these results are of minimal economicimportance. As depicted in Figure 4, most of the coefficients for imports are negative oreffectively zero, indicating a limited relationship between agricultural imports in BC andthe introduction of the carbon tax. The signs for two commodities are consistently positive,but not statistically significant, indicating that imports increased contemporaneously with
16 CANADIAN JOURNAL OF AGRICULTURAL ECONOMICS
Figure 3. Commodity-specific effect of the carbon tax on gross exports, point estimates, and 95%confidence intervals
the tax: vegetables and cattle. Once again, this provides weak evidence that the carbontax is potentially associated with reduced competitiveness for BC producers of thesecommodities. Of note, soy and floriculture saw decreases in imports with magnitudes ofroughly half their decreases in exports displayed in Table 4.
Overall, the data do not conclusively reveal any changes in the pattern of agriculturaltrade that can be linked to the carbon tax. Most of the point estimates suggest that agri-cultural exports increased contemporaneously with the carbon tax and that agriculturalimports to BC decreased with the carbon tax. Both of these trends could be interpretedas an improvement in competitiveness. However, it should be stressed that confidenceintervals around the point estimates are large. Weak evidence may support the claimsthat several specific subsectors were adversely affected. Still we emphasize prudence wheninterpreting these results as we demonstrate that conclusions are sensitive to econometricspecification.
DiscussionFinding a consistent and credible link between the BC’s carbon tax and agricultural tradepatterns remains elusive. In nearly all cases, coefficients from our regressions are notstatistically significant. Even the few cases where statistical significance is found, resultssuggest that agricultural exports increased or imports decreased in conjunction with theintroduction of the tax. This conclusion runs contrary to the conventional wisdom inthe sector: the ex ante expectation is that increases in environmental regulations lead to
EFFECT OF CARBON TAXES ON AGRICULTURAL TRADE 17
Figure 4. Commodity-specific effect of the carbon tax on gross imports, point estimates, and 95%confidence intervals
a reduction in international competitiveness and a decline in international exports. Infact, these arguments motivated the exemptions granted to the greenhouse sector and thepending legislation targeted at the broader agricultural sector. We propose, but do notempirically test, three potential hypotheses to explain our findings.
First, despite claims to the contrary, it may be that the carbon tax had at best asecond-order effect on the agricultural sector. Unambiguous classification of agricultureas carbon intensive and trade exposed was not possible given the available data. Factorendowments such as land quality, climate, and human capital may swamp any impact ofthe tax. A simple counting exercise demonstrates this. First, using the data from Figure 1the average fuel cost share for agriculture is 4%. Next, assume that a 7.67¢/liter tax ondiesel fuel comprises a 10% increase in the cost of fuel. With these values, under restrictiveassumptions of no trade and Leontief technology, it is possible to calculate a ball-parkfigure for the cost increase due to a $30/tCO2e carbon tax. In this scenario, the carbontax generates a maximum increase in costs equal to 0.4%. Based on this magnitude,it seems reasonable to state that the carbon tax only had a second-order effect on theagricultural sector and the declarations made during BC’s budget consultation processmay have incorrectly attributed other factors affecting agriculture to the carbon tax.
Second, as discussed in the context of the Heckscher–Ohlin model, carbon taxes arelikely to reduce net exports from carbon-intensive (dirty) sectors, but potentially increasenet exports from other (clean) sectors. If agricultural production is not carbon intensive,then increases in exports following the introduction of the tax are consistent with theory.
18 CANADIAN JOURNAL OF AGRICULTURAL ECONOMICS
Figure 1 suggests that on average the agricultural sector is less carbon intensive thanmany other highly traded sectors such that it may experience an increase in comparativeadvantage following introduction of the carbon tax.
Finally, there exists a possibility that the introduction of the carbon tax helped tostimulate process innovations or intra-industry substitutions on BC farms, which offsetany first-order effects of the carbon tax. The potential for this was first raised by Porterand van der Linde (1995). Since then, there have been many empirical tests of the so-called“Porter Hypothesis,” some which document situations where more stringent environmen-tal regulations created an advantage for regulated firms compared to unregulated firms inother jurisdictions (Ambec et al 2011). To the extent that the carbon tax had a first-ordereffect on agriculture, the Porter Hypothesis may partially explain its ability to adapt.
POLICIES TO ADDRESS COMPETITIVE CONCERNS OF CARBON TAXES ONAGRICULTURE
This paper examined the effect of the carbon tax on the international competitivenessof the agricultural sector. The analysis finds little evidence that net exports from BCagricultural firms declined following implementation of the carbon tax. It does not how-ever preclude the possibility that certain agricultural subsectors experienced declines inexports following the introduction of the tax (or that other economic sectors experienceddeclines in international competitiveness related to the tax). Further, it is possible thateven if international exports were relatively unaffected by the tax, profits of agriculturalfirms declined. For economic efficiency or distributional reasons, the BC government maybe interested in mitigating any negative impacts on agriculture associated with the tax.Recognizing that legitimate concerns may exist, it is important to consider the suite ofavailable strategies available to address these worries. The literature raises several possibil-ities, which could each be targeted at commodities considered most negatively affected bya carbon tax: (1) sector exemptions, (2) lump-sum rebates, and (3) output-based rebates.13
We discuss each in turn.Prior to considering these mechanisms, it is worth noting that, in general, policies to
support a particular sector of the economy are costly and frequently come at the expenseof other sectors. As a result, clear standards should be set to guide the governmentwhen supporting particular sectors. The previously discussed U.S. Waxman–Markey Billimplemented this type of condition very clearly. For example, in the case we examine here,sector support to maintain international competitiveness could be contingent on a cleardemonstration of a loss in net exports (which we were unable to find with the availabledata). Without clear conditions such as these, it is difficult to distinguish legitimateassistance from rent seeking.
ExemptionsWhen implemented elsewhere (notably in Europe), carbon taxes have often been accom-panied with exemptions for certain sectors to shield them from the full impact of thecarbon tax. Such exemptions have taken various forms, including complete exemptionssuch as Norway’s exemption on coal use in the cement industry (Ekins and Speck 1999),
13 Border tax adjustments are also the subject of a substantial literature, but are not explored here.These results indicate that border tax adjustments are unnecessary however.

EFFECT OF CARBON TAXES ON AGRICULTURAL TRADE 19
conditional exemptions such as the UK’s Climate Change Agreements and Levy (Martinet al 2011), and reduced tax rates which exist for most manufacturers subject to Europeancarbon taxes (Ekins and Speck 1999). While such exemptions are politically popular, mosteconomists consider them to be economically inefficient because they entail forgoing cost-effective opportunities to reduce carbon emissions. To achieve the same level of emissionreductions, more costly activities need to be pursued. Bohringer and Rutherford (1997),as an example, estimate that sector exemptions are an extremely costly way to preserveemployment in the exempted sector and Hoel (1996) shows that sector exemptions areinferior to other support mechanisms that governments can use.
Conventional economic wisdom suggests that the number of policy instrumentsshould be equal to the number of policy goals. In the context of BC’s carbon tax, thereappear to be at least three goals facing policy makers—(1) improving environmentalperformance, (2) maintaining international competitiveness, and (3) maintaining employ-ment or firm profitability when the carbon tax is implemented. Trying to address allthree of these goals with a single policy (carbon tax with exemptions) is suboptimal andcompromises efficiency across all goals. Instead, individual policies should be used toaddress each policy goal.
Lump-Sum RebatesSectoral rebates are an alternative form of compensation for affected sectors. Rebatescan be unconditional (lump sum) or conditional. Lump-sum rebates are transfers fromgovernment to a firm’s shareholders and should not create economic incentives or dis-incentives (of course, raising funds to provide the rebates can distort economic activity).In the current context, they would be used to support firms’ profits during a transitoryperiod when carbon taxation was applied, in a manner similar to the $100 Climate ActionDividend which was provided to households when BC’s carbon tax was first implemented.Goulder et al (2010) estimate that to preserve firm profits following implementation of acarbon tax, a lump-sum transfer equivalent to about 15% of total carbon tax paymentsis adequate for energy-intensive firms in the United States. A 100% lump-sum rebatesubstantially overcompensates industries. Several market-based climate policies do pro-vide substantial lump-sum rebates for participating sectors. For example, the EuropeanUnion’s Emission Trading System uses a lump-sum allocation of emission permits toindustrial facilities, similar to the allocation system in the U.S. sulfur dioxide tradingprogram. Importantly, a lump-sum rebate is not tied directly to a firm’s current carbonemissions or fossil fuel use (or any other current-year variable)—this is what distinguishesit from an exemption. Instead, lump-sum rebates could be distributed on a per-firm basis(similar to the climate action dividend, which distributed revenue on a per-person ba-sis) or based on historic emissions. In this way, the rebate functions purely as a transfermechanism and does not influence firm decisions.
Output-Based RebatesAn alternative to lump-sum rebates are conditional rebates, in which rebates depend on afirm’s performance. Fischer and Fox (2009) explore output-based rebates, where paymentsare calculated based on a measure of physical or economic output. A sector may receivea rebate which is some percentage of total carbon tax payments and distribution tofirms within the sector is according to shares of physical output (e.g., tonnes of cornproduced). This structure provides the firm with two incentives: first, because of the
20 CANADIAN JOURNAL OF AGRICULTURAL ECONOMICS
carbon tax, each firm faces an incentive to reduce emissions; and, second, because firmsreceive a subsidy contingent on their share of sector output, each firm faces an incentiveto increase output. This structure helps to mitigate some of the negative impacts of thetax on “competitiveness.” Simulations suggest that this type of rebating can be effective(Fischer and Fox 2007).
CONCLUSIONS
Although the design of the carbon tax adopted in BC in 2008 appears to conformvery closely to best practice, concerns remain over implementation. The carbon tax isunilateral and may provide incentives for carbon-intensive firms to shift production toother jurisdictions to avoid paying the tax. Partly in response to this concern, in its 2012budget, the BC government offered a temporary (one-year) exemption to the greenhousesector, which reported problems with international competitiveness as a result of the tax.In its 2013 budget, it made the exemption permanent (for 80% of total carbon costs) andexpanded it to include all gasoline and diesel purchases from the agricultural sector.
Our aim in this paper is to evaluate the impact of the BC carbon tax on the interna-tional trade of the agricultural sector. We demonstrated that among highly traded sectorsin BC, the agricultural sector has a fossil fuel intensity that is approximately average. Thusa simple theoretical model does not give an unambiguous prediction for whether the car-bon tax would expand or contract net exports from the sector. Next, we estimated theeffect of the carbon tax on agricultural exports using a panel data set, covering importsand exports of a number of agricultural commodities in each province in Canada over the22-year period from 1990 to 2011. We control for time-varying factors that are similar forall provinces (world commodity prices, national tariffs, costs, and environmental policiesin other countries), time-invariant factors that are specific to each province (comparativeadvantage) as well as weather. Our results do not conclusively reveal a connection betweenthe carbon tax and agricultural trade. As a result, the exemptions from the carbon tax forthe greenhouse sector, which were justified primarily based on concerns over internationalcompetitiveness, appear unnecessary and are not justified by available data.
To our knowledge, this analysis is the first to estimate the ex post effect of the BCcarbon tax on a sector’s performance. It is also the first to examine the consequences ofan actual carbon tax on the agricultural sector. We believe that it is a useful initial studyin a field that deserves more attention. In particular, this research was based on aggregatedata. Using firm-level microdata, it would likely be possible to generate more preciseestimates of the impact of the tax on firm performance, and to test other hypothesesrelating to the causal impact of the tax. This is a fruitful avenue for future research.
ACKNOWLEDGMENTS
Funding for this project was provided by the Pacific Institute for Climate Solutions. The authorsacknowledge the excellent research assistance of Linda Li and Noemie Schmiedel.
REFERENCES
Ambec, S., M. Cohen, S. Elgie and P. Lanoie. 2011. The Porter Hypothesis at 20: Can environmentalregulation enhance innovation and competitiveness? Review of Environmental Economics and Policy7 (1): 2–22.
EFFECT OF CARBON TAXES ON AGRICULTURAL TRADE 21
BC Budget Consultation. 2012. Budget Consultation. http://www.leg.bc.ca/cmt/39thparl/session-4/fgs/hansard/hansindx/FGSNDX-3--4c.htm#mh194 (accessed September 7, 2012).BC Budget Speech. 2012. Provincal Budget Speech. http://www.bcbudget.gov.bc.ca/2012/speech/2012_Budget_Speech.pdf (accessed September 7, 2012).BC Ministry of Agriculture. 2012. News release: $7.6M carbon tax relief supports B.C.’s greenhousejobs. http://www2.news.gov.bc.ca/news_releases_2009--2013/2012AGRI0008--000405.htm (ac-cessed September 7, 2012).BC Ministry of Finance. 2011. How the carbon tax works. www.fin.gov.ba.ca/tbs/tp/brkclimate/A4.htm (accessed July 20, 2012).BC Ministry of Finance. 2012. Budget and Fiscal Plan 2012/13.www.bcbudget.gov.bc.ca/2012/bfp/2012_Budget_Fiscal_Plan.pdf (accessed July 20, 2012).Bohringer, C. and T. Rutherford. 1997. Carbon taxes with exemptions in an open economy: Ageneral equilibrium analysis of the German tax initiative. Journal of Environmental Economics andManagement 32 (2): 189–203.Carter, C., B. Krissoff and A. P. Zwane. 2006. Can country-of-origin labeling succeed as a marketingtool for produce? Lessons from three case studies. Canadian Journal of Agricultural Economics 54:513–30.Copeland, B. and M. Taylor. 2004. Trade, growth, and the environment. Journal of EconomicLiterature 42: 7–71.Copeland, B. R. 2012. International trade and green growth. World Bank Policy Research Paper6235.Edgerington, W. and J. Minier. 2003. Is environmental regulation a secondary trade barrier? Anempirical analysis. Canadian Journal of Economics 36: 137–54.Ekins, P. and S. Speck. 1999. Competitiveness and exemptions from environmental taxes in Europe.Environmental and Resource Economics 13: 369–96.Elliot, J., I. Foster, S. Kortum, T. Munson, F. Perez Cervantes and D. Weisbach. 2010. Trade andcarbon taxes. American Economic Review, Papers and Proceedings 100 (2): 465–69.Felder, S. and T. Rutherford. 1993. Unilateral CO2 reductions and carbon leakage: The conse-quences of international trade in oil and basic materials. Journal of Environmental Economics andManagement 25 (2): 162–76.Fischer, C. and A. Fox. 2007. Output-based allocations of emissions permits for mitigating tax andtrade interactions. Land Economics 83 (4): 575–99.Fischer, C. and R. Newell. 2008. Environmental and technology policies for climate mitigation.Journal of Environmental Economics and Management 55 (2): 142–62.Fisher, C. and A. K. Fox. 2009. Combining rebates with carbon taxes. Discussion paper 09–12.Washington: Resources for the Future.Goulder, L. 1995. Environmental taxation and the double dividend: A reader’s guide. InternationalTax and Public Finance 2 (2): 157–83.Goulder, L., M. Hafstead and M. Dworsky. 2010. Impacts of alternative emissions allowanceallocation methods under a federal cap-and-trade program. Journal of Environmental Economicsand Management 60 (3): 161–81.Goulder, L., I. Parry and D. Burtraw. 1997. Revenue-raising versus other approaches to environmen-tal protection: The critical significance of pre-existing tax distortions. RAND Journal of Economics28 (4): 708–31.Hanna, R. 2010. U.S. environmental regulation and FDI: Evidence from a panel of U.S. basedmultinational firms. American Economic Journal: Applied Economics 2: 158–89.Harrison, K. 2012. A tale of two taxes: The fate of environmental tax reform in Canada. Review ofPolicy Research 29 (3): 383–407.Hoel, M. 1996. Should a carbon tax be differentiated across sectors? Journal of Public Economics59 (1): 17–32.
22 CANADIAN JOURNAL OF AGRICULTURAL ECONOMICS
Jaffe, A. B., S. R. Peterson, P. R. Portney and R. N. Stavins. 1995. Environmental regulation andthe competitiveness of U.S. manufacturing: What does the evidence tell us? Journal of EconomicLiterature 33 (1): 132–63.Kellenberg, D. 2009. An empirical investigation of the pollution haven effect with strategic environ-ment and trade policy. Journal of International Economics 78: 242–55.Leamer, E. E. and J. Levinsohn. 1995. International trade theory: The evidence. In Handbook ofInternational Economics, vol. 3, edited by G. Grossman and K. Rogoff, pp. 1339–95. Amsterdam,the Netherlands: Elsevier Science.Levinson, A. and M. Taylor. 2008. Unmasking the pollution haven effect. International EconomicReview 49 (1): 223–54.Martin, R., L. B. de Preux and U. J. Wagner. 2011. The impacts of the climate change levy onmanufacturing: Evidence from microdata. NBER Working Paper No. 17446.McGuire, M. 1982. Regulation, factor rewards, and international trade. Journal of Public Economics17: 335–54.Porter, M. and C. van der Linde. 1995. Towards a new conception of the environment-competitiveness relationship. Journal of Economic Perspectives 9 (4): 97–118.Statistics Canada. 2013. Consumer Price Index, by province (monthly). Table 326-0020. http://www.statcan.gc.ca/tables-tableaux/sum-som/l01/cst01/cpis01a-eng.htm (accessedNovember 21, 2013).Stavins, R. 1995. Transaction costs and tradable permits. Journal of Environmental Economics andManagement 29 (2): 133–48.
APPENDIX
Table A1. Concordance for agricultural commodities
Statistics Canada commodity(Table 002-0001)
Industry Canada commodity (HS Code)
Wheat HS 1001 – WHEATDurum wheat HS 1001 – WHEATWheat, excluding durum,
marketing board paymentsHS 1001 – WHEAT
Durum wheat, marketingboard payments
HS 1001 – WHEAT
Oats HS 1004 – OATSOats, Canada Wheat Board
paymentsHS 1004 – OATS
Barley HS 1003 – BARLEYBarley, Canada Wheat Board
paymentsHS 1003 – BARLEY
Rye HS 1002 – RYEFlaxseed HS 120400 – LINSEEDCanola, rapeseed HS 1205 – RAPE OR COLZA SEEDS (WHETHER
OR NOT BROKEN)Soybeans HS 1201 – SOYA BEANS, WHETHER OR NOT
BROKENCorn HS 1005 – CORN
(continued)

EFFECT OF CARBON TAXES ON AGRICULTURAL TRADE 23
Table A1. Continued
Statistics Canada commodity(Table 002-0001)
Industry Canada commodity (HS Code)
Greenhouse vegetables HS 07 – Edible Vegetables and Certain Roots and TubersPotatoes HS 07 – Edible Vegetables and Certain Roots and TubersVegetables HS 07 – Edible Vegetables and Certain Roots and TubersTotal tree fruits HS 08 – Edible Fruits and NutsApples HS 08 – Edible Fruits and NutsOther tree fruits HS 08 – Edible Fruits and NutsTotal small fruits HS 08 – Edible Fruits and NutsBlueberries HS 08 – Edible Fruits and NutsStrawberries HS 08 – Edible Fruits and NutsGrapes HS 08 – Edible Fruits and NutsOther berries and grapes HS 08 – Edible Fruits and NutsFloriculture HS 06 – Live Trees and Other Plants (Incl. Cut Flowers
and Ornamental Foliage)Nursery HS 06 – Live Trees and Other Plants (Incl. Cut Flowers
and Ornamental Foliage)Sod HS 06 – Live Trees and Other Plants (Incl. Cut Flowers
and Ornamental Foliage)Cattle HS 0102 & 0201 & 0202 – CATTLECalves HS 0102 & 0201 & 0202 – CATTLEHogs HS 0103 & 0203 – SWINESheep HS 0104 & HS0204 SHEEP AND GOATSLambs HS 0104 & HS0204 SHEEP AND GOATSHoney HS 0409 – HONEY, NATURAL
Table A2. Climate data and province concordance
Province Climate region
Newfoundland and Labrador Atlantic CanadaPrince Edward Island Atlantic CanadaNova Scotia Atlantic CanadaNew Brunswick Atlantic CanadaQuebec Great Lakes/St. LawrenceOntario Great Lakes/St. LawrenceManitoba PrairiesSaskatchewan PrairiesAlberta PrairiesBritish Columbia South BC Mountains
SUPPORTING INFORMATION
Additional Supporting Information may be found in the online appendix of this article: