The Development of Energy Management in Chinese Taipei
27
Clean Energy- 1 Copyright 2014 ITRI The Development of Energy Management in Chinese Taipei April 10, 2014
Transcript of The Development of Energy Management in Chinese Taipei
Clean Energy- 1Copyright 2014 ITRI 工業技術研究院The Development of Energy Management
in Chinese Taipei
April 10, 2014

Clean Energy- 2Copyright 2014 ITRI 工業技術研究院 Contents
• Introduction
• Action Plan for Energy Conservation
• The Policy Tools of Energy Efficiency Management in Chinese Taipei
• Installation of Renewable Energy
• Others

Clean Energy- 3Copyright 2014 ITRI 工業技術研究院Mitigation Actions in Chinese Taipei
� 277 Mt CO2 reduction is required to reach reduction goal in 2025 as compared to
BAU scenario.
� Energy efficiency can account for 17% of CO2 reduction based on ITRI’s bottom-up (MACC) approach.

Clean Energy- 4Copyright 2014 ITRI 工業技術研究院Abatement Cost Curve in 2025 (144.1 MtCO2)
Use of low-carbon technologies to fill the gap• CCS will play an important role
• Accelerate R&D, reduce installation cost,
increase capability of carbon reduction
Accelerate the implementation of mature
technologies through regulation adjustment
and incentive policies

Clean Energy- 5Copyright 2014 ITRI 工業技術研究院The Policy Tools of Energy Efficiency
Management in Chinese Taipei
� Mandatory Programs
�Minimum energy performance standard (MEPS)
�Energy efficiency ranking labeling
�Energy management and audit
�ESCO
� Voluntary programs
�Energy conservation labeling
� Public awareness, education & promotion
� Incentives programs

Clean Energy- 6Copyright 2014 ITRI 工業技術研究院Minimum Energy Performance Standard (MEPS)
Effective Year CategoriesNew Criteria Effective Date
1988 Engine for fishing boat --
1987/…/2004 Automobile & motorcycle Aug. 2009
2001 Fluorescent lamps --
2003 Chiller for Air Conditioner System --
2003 Boiler --
1981/…/2007 Non-ductive Air-ConditionersStage1::::Jan. 1, 2011Stage2::::Jan. 1, 2016
2002 1 & 3 phased Induction motors --
1984/…/2003 Refrigerators Jan. 1, 2011
2007 Self-ballasted fluorescent lamps Jan. 1, 2010
2009 Ballast Mar.1,2009
2010 Compact fluorescent lamps Jan. 1, 2010
2011 Dehumidifiers Mar.1,2011
2012 Incandescent bulb Jan. 1, 2012
2014 LED bulb Jul. 7, 2014
2015 Electric pots Jan. 1, 2015
� Mandatory minimum energy performance standards (MEPS) is the main regulatory tool used for energy efficiency. Manufacturers and importers are obliged to apply in advance for compliance certification.
� In Chinese Taipei, MEPS was first introduced in 1980’s, and have been updated over the years to cover a wide range of products, and increasing levels of stringency.
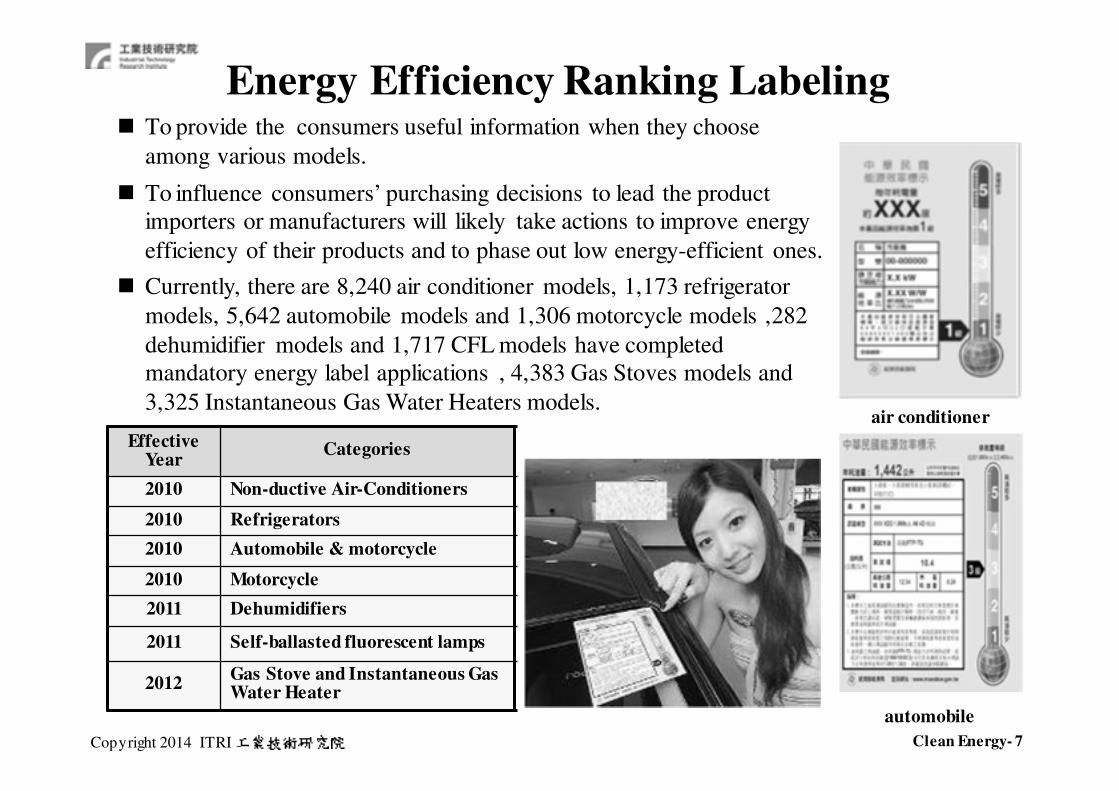
Clean Energy- 7Copyright 2014 ITRI 工業技術研究院Energy Efficiency Ranking Labeling
Effective Year
Categories
2010 Non-ductive Air-Conditioners
2010 Refrigerators
2010 Automobile & motorcycle
2010 Motorcycle
2011 Dehumidifiers
2011 Self-ballasted fluorescent lamps
2012Gas Stove and Instantaneous Gas Water Heater
� To provide the consumers useful information when they choose
among various models.
� To influence consumers’ purchasing decisions to lead the product importers or manufacturers will likely take actions to improve energy
efficiency of their products and to phase out low energy-efficient ones.
� Currently, there are 8,240 air conditioner models, 1,173 refrigerator
models, 5,642 automobile models and 1,306 motorcycle models ,282
dehumidifier models and 1,717 CFL models have completed mandatory energy label applications , 4,383 Gas Stoves models and
3,325 Instantaneous Gas Water Heaters models.air conditioner
automobile

Clean Energy- 8Copyright 2014 ITRI 工業技術研究院�RAC:The rating 1 products are 37% more efficient than rating 5 products
�Refrigerator:The rating 1 products are 40% more efficient than rating 5 products
�Dehumidifier:The rating 1 products are 28% more efficient than rating 5 products
�Self-Ballasted Fluorescent Lamp :The rating 1 products are 30%~40% more efficient than rating 5 products
� Market Transformation of RAC and Refrigerator (2010~ 2012)::::Achievements of EE Rating Labeling Program
Market Share of each rating Air Conditioner Market Share of each rating Refrigerator/freezer

Clean Energy- 9Copyright 2014 ITRI 工業技術研究院Benchmarks for Energy Label Products(45 product Categories)
7,875Energy Conservation Labeling certified models with 367 brand names and over 178
million Energy Conservation qualified models have been used by Mar. 3, 2014
Year Categories
2001 (1)air-conditioners (2) refrigerators (3) dehumidifiers (4) clothes dryers
2002 (5)TVs (6) clothes washers (7) electric fans, (8) fluorescent lamps (> 32 W)
2003 (8)fluorescent lamps (<<<<32W) (9)hair dryers (10) hand dryers
2004 (11)warm-hot water dispensers (12) chilled-warm-hot water dispensers
2005 (13) chilled-warm-hot drinking fountains (14) automobiles & light trucks (15) motorcycles (16) self-ballasted fluorescent lamps
2006 (17) thin film transistor-liquid crystal display (18) instant gas burning water heaters (19) gas burning cooking appliances (20) electric rice cookers
2007 (21)Electric Storage Water Heaters (effective on Jan. 1, 2008)(22) Electric Pots (23) Exit Lights and Emergency Direction Lights(24) DVD Products
2008 (25)Warm-hot drinking fountains (26) Luminaries (27) Integrated Stereo
2009 (28)Compact Fluorescent Lamp
2010 (29)Printer
2011 (30) Copier (31) Air Cleaner (new) ((((32))))street lighting (33)Ventilating Fan for Bath Room (34) Window Type Ventilating Fan
2012 (35)Desk top PC (36) Notebook PC (37) Heat pump water heater (38)Range Hoods
2013 (39)Microwave oven (40) Axial-flow Fans (41) Centrifugal fan (42) Ballast for Fluorescent tubes (43) Electric Stove (44) Electric water machine (45) LED bulbs
Voluntary Energy Conservation Labeling Program

Clean Energy- 10Copyright 2014 ITRI 工業技術研究院Energy Management and Audit
� The process of energy audit for Industry sector
Industrial sector shares around 54% of energy consumption
the significant object of energy conservation implementation
� Benefits
� From 2004~2010, average annual
saving was 517.55 KKLOE with
1.20% annual saving rate
� An effective strategy can be
developed to cope with the
situations in different industries
一德請幫忙更新

Clean Energy- 11Copyright 2014 ITRI 工業技術研究院Chinese Taiepi’s ESCO Industry Development
Strategy
Promote
ESCO
development
Expand the industrial market • Promote the energy conservation performance
guarantee program promotion subsidies
• promote public sector to ESCO
• Promote Groups and enterprises to perform
initial diagnosis and introduce ESCOs
• Promote LED street lights and ESCO subsidies
• Commend of excellence ESCOs
• Energy audit of colleges and universities
• Promoting PV-ESCO
Improve the environment for industrial development
•Promote talent certification system
•Introduce IPMVP energy saving
performance measurement and verify the
licenses of specialists
•““““ESCO Project Development
Technology” training course
•Promote the inclusion of ESCO courses in
college curriculum
Develop project financing system
•Establish credit guarantee financing
system
•Promote low-interest loans
•Promote industry project financing
•Promote the Industry Revolving
Fund
Nurture industry talent
• Formulate industrial development strategy and policy
measures
• Set up an all-around industrial services system
• Strengthen industry related laws and risk management
• Establish sound energy-saving performance
measurement and verification system
• Promote ESCO servicing capacity registration system
• Set up a third impartial office for measurement
verification
• promote strategic alliances between equipment
manufacturers, engineering companies and financial
institutions

Clean Energy- 12Copyright 2014 ITRI 工業技術研究院 � Organize M&V training
workshop during 2006-2013
with more than 2,000 participants.
Subsides and Industry Match
Professionals
Financial
Technology
� Publish 21 guidelines
for M&V (lighting, heat
pump, A/C, and cooling system)
� Subsidize ESCO project during 2006-2013 for 99
projects with NTD 420 million
� The six cities using the ESPC model set up lighting reached 60.5 thousand, around NTD 540
million output values.� Subsidy 102 universities to perform ESCO energy
conservation initial diagnosis, predicting saving
electric power 549.2 hundred kilowatts
� Provide credit guarantee fund
for 5 cases with NTD 265
millions..� Provide NTD 20 billions for
project finance by local bank.� Government provide low
interest rate loans (3.825%)
for energy saving equipment procurement, total loan is
NTD 2,118 million.
Achievement of ESCO Promotion

Clean Energy- 13Copyright 2014 ITRI 工業技術研究院 Launching ~~“Cool Style for Summer Dresses”1.Promoted Energy Saving Campaign, “Cool
Style for Summer Dresses"
� First time to maximize work capacity with service sector,
design and fashion industries of textile.
� Offered funds by test and verification mechanism for
expanding commercial opportunity. All 45 verified patterns
from 25 companies fit in the idea of cool feeling textiles and
moisture transferring and quick drying textiles.
� Open market by sales competition among textile
companies. 215 sale spots out of 28 companies were in the
competition and 140 thousand items were sold during the
campaign.
2.Connected social resources to promote the
network for energy saving volunteer
� Worked with environment groups and scientific and
technology museum system to cultivate volunteers and
promote energy saving.
� Trained 492 volunteers, organized 985 activities, which
attracted 59 thousand people’s attendance in total.
Campaign for Energy Saving (1/2)

Clean Energy- 14Copyright 2014 ITRI 工業技術研究院3.Conducted Contest of "Power Saving in Summer Months" Among 22 Cities and Counties.
� Contest of "Power Saving in Summer Months" among 22
cities and counties was firstly held in 2012; the contest is based
on 5 pools of index, such as government, household, service
sector, energy education and policy administration.
� Compared with the reference year of 2011, the electricity
saved respectively was more than 2.45 billion kWh (9.1%) in
2012, and 1.20 billion kWh (4.78%) in 2013.
� Promoted campaign identity of "Power Saving in Summer
Months“ for 11 designated businesses which consume
significant electricity. There were more than 20 thousand
physical stores, equal to 90% stores in Chinese Taiepi taking
part in the event.
� For promoting high energy efficiency household appliances,
8 cities and counties organized special deal events dedicated to
energy saving appliances. In aggregate, more than 200
thousand items were sold, equal to 1.04 billion NTDs.
Campaign for Energy Saving (2/2)

Clean Energy- 15Copyright 2014 ITRI 工業技術研究院�Promoted Energy-efficient Performance Award
For promoting entrepreneur’s voluntary energy saving and encouraging public, private sector
and school for energy saving, Ministry of Economy yearly holds Energy-efficient Performance
Award.
�Organizing Demonstration of Energy Saving forAward Winner
Invited Excellent Energy-Saving Performance Award winners to share successful cases and
experiences. Around 580 entrepreneurs attended live demonstration of energy saving
technologies annually.
�System for promotion
Constructed sharing platform for successful cases and technologies, produced e-book (More
than 2,200 cases have been compiled) from industries’ successful cases and organized
demonstration.
�The Result of Energy Saving in 2013
In 2013, 37 winning corporations, governmental institutions and schools conserved 36
thousand kiloliters of oil equivalence, saved 303 million NTDs and reduced 119 thousand
tons emission of carbon dioxide.
Award and Demonstration for Energy Saving

Clean Energy- 16Copyright 2014 ITRI 工業技術研究院Source: Bureau of Energy, Ministry of Economic Affairs, Chinese Taipei
Installation of Renewable Energy
• The installed capacity of renewable energy was 3,769 MW at the end of 2013.
• Targeted renewable power generation capacity is 13.75 GW by 2030.

Clean Energy- 17Copyright 2014 ITRI 工業技術研究院ᴏ Conventional HydropowerTotal hydro power capacity is 2,081.3 MW, of which the Public utilities
(Taipower) accounted for 98% of large hydro power plants (2,042.2 MW),
privately owned 39.1 MW only
ᴏ Solar Water Heaters
2.27 million m2 of heat collectors installed, effective households
penetration rate3.63% (around 300 thousand households)
Ranked No. 5 globally for installed density (land area based)
Annual Energy Production: 154 million litres oil equivalent
Others

Clean Energy- 18Copyright 2014 ITRI 工業技術研究院 source:http://www.flickr.com/photos/hanksun88/6608214497/
Thank youThank you

Clean Energy- 19Copyright 2014 ITRI 工業技術研究院Mechanism of Feed-in Tariffs
• Tariffs and formula should be reviewed annually by referring to
technical advancement, cost variation, goal achievement status, etc.
� no degression system in place
• Tariffs shall not be lower than the average cost for fossil-fired
power of domestic power utilities.
• Current, only Solar PV tariff rates are set on date when generating
equipment installations are completed. Other technologies have
tariff rates set on the Power Purchasing Agreement (PPA) signing
date.
���� applied for 20 years
• BOE announces PV capacity quota every year. PV systems > 30 kW
are subject to a bidding procedure to decide tariffs. Developers
proposing higher discount rates get the priority to get the quota.

Clean Energy- 20Copyright 2014 ITRI 工業技術研究院• Applied for 20 years to electricity from renewables (except PV) whose owner signs
PPA with power utility from 1 Jan. 2014 to 31 Dec. 2014
FIT for Renewables (2014)
* Exchange rate: USD 1 = NTD 30
Item TypeCapacity
(kW)
2014 Tariff Rates (US ¢/kWh)
2013 Tariff Rates (US ¢/kWh) Variation
period 1 period 2 period 1 period 2 period 1 period 2
PVRoof type
≧≧≧≧1 ~ <10 23.8673 23.8673 27.9903 27.2787 -14.7% -12.5%
≧≧≧≧ 10 ~ < 100 21.3967 21.3967 25.1439 24.4323 -14.9% -12.4%
≧≧≧≧ 100 ~ < 500 20.1493 20.1493 23.7207 23.0091 -15.1% -12.4%
≧≧≧≧ 500 17.4387 17.4387 21.1113 19.9253 -17.4% -12.5%
Ground type ≧≧≧≧1 16.4074 16.4074 19.9253 18.7393 -17.7% -12.4%
Wind PowerOnshore
≧≧≧≧ 1 ~ < 10 27.2450 24.5207 11.1%
≧≧≧≧ 10 8.7793 (with LVRT) 8.7527 (with LVRT) 0.3%
Offshore -- 18.6920 18.5420 0.8%
Hydropower Stream-Type -- 8.3510 8.2174 1.6%
Geothermal -- -- 16.4383 16.0130 2.7%
BiomassNo biogas eqip. -- 8.3510 8.2174 1.6%
With biogas eqip. -- 10.8370 9.3380 16.1%
RDF -- -- 9.4133 9.4133 0.0%
Others -- -- 8.3510 8.2174 1.6%

Clean Energy- 21Copyright 2014 ITRI 工業技術研究院Million Solar Rooftop PVs project (1/2)
ᴏ Solar Energy Potential Goal : 6,200 MW developed by 2030
A. Roof-top (3,000 MW) B. Ground (3,200 MW)
Buildings will be installed with PV panels through the incentives of feed-in tariffs.
Restricted annual quota at present, while large scale expansion after grid-parity reached
To expand the PV power applications in the domestic market, the annual installation limit
has been raised to 210MW in 2014, up from 70MW in 2011
ᴏ Strategy - Gradual expansion/ incentivizing roof-tops prior to ground installations

Clean Energy- 22Copyright 2014 ITRI 工業技術研究院ᴏ Encouraging participation from local governmentsBesides FIT, some local governments (e.g. Kaohsiung City) granting extra capital subsidy
Encouraging public buildings and constructions equipped with PV
BOE assisting local governments on Solar Roof-top Program and Solar Community Program
to facilitate public participation
ᴏ Establishment of PV-ESCO mechanismEncouraging banks to participate in project financing and to provide soft loans to PV-ESCO
players
Million Solar Rooftop PVs project (2/2)
PV-ESCO /PV System company
Taiwan Power Company
reimburse loan
principal and
interest
electricity selling income wholesale electricity
roof renting
During the renting period, the
site provider get the rent.
The ownership of system after
the rent expiring should be
discussed by the PV-ESCO and
the site provider .
finance for 80%
system warranty
and after-sales
service
Bank
Example Model: Zero
financing burden for the
site provider
General residential roof system

Clean Energy- 23Copyright 2014 ITRI 工業技術研究院Thousand Wind Turbines Project (1/2)
Goal : 4,200 MW developed by 2030
A. Onshore ::::1,200 MW installed by 2020
B. Offshore:::: 3,000 MW installed by 2030
ᴏ Wind Power Generation Target
23
Year 2012 2015 2020 2025 2030
Onshore(MW) 614.2 814 1,200 1,2001,200
(450 turbines)
Offshore(MW) 0 15 320 1,5203,000
(600 turbines)
Cumulative Installed
Capacity (MW)
614.2
(311turbines)829 1,800 3,000
4,200
(1,050 turbines)
Ca
pa
city
(MW
) Turbines1,200
1,000
800
600
400
200
0
4,200
3,600
3,000
2,400
1,800
1,200
600
0
4,200Capacity
Turbines614.2

Clean Energy- 24Copyright 2014 ITRI 工業技術研究院ᴏ Strategy ----Develop on- shore prior to off-shore wind farmsOn-shore: develop areas with higher power generating potentials prior to 2015,
then develop areas with less potential thereafter.- Develop areas with higher power generating potentials prior to 2015 (estimated 800 MW)
- Develop areas with less potential thereafter (400 MW), with total installed capacity reaching 1.2
GW by 2020
Off-shore: develop among the shallow areas prior 2020 then develop in deep
water offshore areas. - Establish the first off-shore wind farm by 2015, and reach 320 MW installed capacity on shallow
off-shore areas (approximately 100 turbines) by 2020.
- Develop large wind-farms in areas possessing economic scalability between 2021-2030
(reaching 2,680 MW, which is approximately 500 wind turbines in 10 years)
Short-term~2015:
Offshore Wind Power Demonstration Program
Promote Demonstration
Incentive Program
Mid-term~2020
Develop Demonstration Offshore Wind Farms
Optimizer circumstances and
infrastructure
Long-term~2030
Develop Large-scale Wind Farms
Establish local industry of marine
construction and
wind turbines
Thousand Wind Turbines Project (2/2)

Clean Energy- 25Copyright 2014 ITRI 工業技術研究院Offshore Wind Power Demonstration Program ᴏ Demonstration Wind Farms
In the ocean of 5 m isobaths or deeper, with total capacity above 100 MW
but not exceeding 200 MW.
ᴏ Demonstration Devices2 offshore wind power systems of single capacity above 3 MW
Awarded Demonstration Projects
� Fuhai @Changhua
• Capacity: 108 MW (30 turbines)
• Distance from Shore: 11 km
• Water Depth: 25-40 m
� Formosa @Miaoli
• Capacity: 108 MW (30 turbines)
• Distance from Shore: 1-5 km
• Water Depth: 5-30 m
� TPC @Changhua
• Capacity: approx.. 108 MW (22-36 turbines)
• Distance from Shore: 6-8 km
• Water Depth: 15-25 m

Clean Energy- 26Copyright 2014 ITRI 工業技術研究院 26
Bio-Energy (1/2)
� Bio-power
– Current status: total installed capacity of bio-power in 2013 is 740 MW fueled by
MSW, biogas and RDF (Refuse Derived Fuel)
– Prospect: the goal in 2020 is 950 MW, focusing on the co-firing of bio-coal and pellet
in coal-fired units
� Bio-diesel
– Mandatory B2 diesel starting from June 2010, which could reduce 0.26 million ton
CO2 emission annually.
– Spent cooking oil is the main feedstock for domestic production, and looking for
oversea plantation and microalgae as future feedstocks.
– Higher blend ratio in the future depends on the supply of feedstock.
Commerical bio-diesel plant
(10,000 kL/yr in Changhua , 2007)
B5
(under planning)2006 20082007 2009 2010 2013
Mandatory B2 - 2010.06
Mandatory B1 - 2008.07~ 2010.06
Green County Demo Program
2007.01~ 2008.06
Preliminary Subvention Program (Green Bus)
2006.10~ 2008.06Public transportation buses fueled by B5 in a selected area
2006 20082007 2009 2010
B100=100 ML
Mandatory B2 -
Mandatory B1 - 2008.07~ 2010.06
Green County Demo Program
2007.01~ 2008.06 B1 in the demo county
-Microalgae Cultivation

Clean Energy- 27Copyright 2014 ITRI 工業技術研究院 27
Bio-Energy (2/2)
� Bio-alcohol
– Promote E3 gasoline in Taipei and Kaohsiung cities since July 2009. There are 14 gas
stations in Taipei and Kaohsiung supply E3 with an incentive price 2NT$/L cheaper than gasoline.
– Compatibility of old model vehicles and scooters is the major concern for mandatory nationwide E3 gasoline
– No fuel ethanol plant in Chinese Taiepi now. Cellulosic alcohol (ethanol & butanol)
technologies are under development via enzyme/chemical hydrolysis of lignocellulose.
Mandatory E3
(under planning)
2006 20082007 2009 2010 2013
E3 Demo Program in
Taipei & Kaohsiung 2009.07~
14 gas stations in Taipei and
Kaohsiung provide E3
Government
Vehicles
Demo Program2007.09~ 2009. 07
Government Vehicles
in Taipei are fueled E3
(~8 stations)
E100=120 KL E100=236.5 KL
Enzyme / Chemical Cellulosic Hydrolysis
Typical gas station