The Determination of Uncertainties in Fatigue Crack...
25
S M & T Standards Measurement & Testing Project No. SMT4-CT97-2165 UNCERT COP 05: 2000 Manual of Codes of Practice for the Determination of Uncertainties in Mechanical Tests on Metallic Materials Code of Practice No. 05 The Determination of Uncertainties in Fatigue Crack Growth Measurement Peter Georgsson Volvo Aero Corporation Trollhättan SWEDEN Issue 1 September 2000
-
Upload
trinhquynh -
Category
Documents
-
view
224 -
download
0
Transcript of The Determination of Uncertainties in Fatigue Crack...
S M & T Standards Measurement & Testing Project No. SMT4-CT97-2165
UNCERT COP 05: 2000
Manual of Codes of Practice for the Determination of Uncertainties in Mechanical Tests on Metallic Materials
Code of Practice No. 05
The Determination of Uncertainties in Fatigue Crack Growth Measurement
Peter Georgsson
Volvo Aero Corporation Trollhättan SWEDEN
Issue 1
September 2000

S M & T Standards Measurement & Testing Project No. SMT4-CT97-2165
UNCERT COP 05: 2000
CONTENTS 1 SCOPE 2 SYMBOLS AND DEFINITIONS 3 INTRODUCTION 4 A PROCEDURE FOR THE ESTIMATION OF UNCERTAINTY IN FATIGUE
CRACK GROWTH MEASUREMENT Step 1- Identifying the parameters for which uncertainty is to be estimated
Step 2- Identifying all sources of uncertainty in the test Step 3- Classifying the uncertainty according to Type A or B Step 4- Estimating the standard uncertainty for each source of uncertainty Step 5- Computing the combined uncertainty uc Step 6- Computing the expanded uncertainty U Step 7- Reporting of results
5 REFERENCES
APPENDIX A Mathematical formulae for calculating uncertainties in crack length, stress range intensity factor and da/dn in crack propagation test at room temperature.
APPENDIX B A worked example for calculating uncertainties in crack length, stress range intensity factor and da/dn in crack propagation test at room temperature.
S M & T Standards Measurement & Testing Project No. SMT4-CT97-2165
UNCERT COP 05: 2000
Page 1 of 23
1. SCOPE This procedure covers the evaluation of uncertainty in crack length measuring and crack propagation rate of a crack lengths in the range of 0.25-2.5mm on a Kb-specimen1 using the DC potential drop method obtained from tests at room temperature, carried out according to the following Standard:
ASTM E647, ”Standard Method for Measurement of Fatigue Crack Growth Rates”, 1996 Annual Book of ASTM Standards, Section 3, Volume 03.01. - This standard cover the determination of steady-state fatigue crack growth rates from near-threshold to Kmax using C(T) or (MT)-specimens. The general procedures regarding the testing and potential drop method are however applicable on the small crack size Kb-specimen.)
Applicable parts of ASTM E740 have also been used.
The procedure is restricted to tests conducted in load control at constant-amplitude, on specimens that have uniform gauge lengths and to tests performed under uni-axial loading conditions. The general procedure described in this CoP05 is however applicable on other types of specimens, such as MT and CT-specimens. 2. SYMBOLS AND DEFINITIONS For a complete list of symbols and definitions of terms on uncertainties, see Reference 1, Section 2. The following are the symbols and definitions used in this procedure.
a crack length. ameasured measured crack length. apredicted predicted crack length. adifference difference between measured and predicted crack length. ca sensitivity coefficient that describes the variation of crack length as a
function of the Potential drop value. ci sensitivity coefficient.
c∆K sensitivity coefficient that describes the variation of ∆K as a function of the crack length.
COD coefficient of determination. CoP Code of Practice. dv divisor used to calculate the standard uncertainty. E Young’s modulus ea error in crack length due to variations of the PD value. eF estimated uncertainty in ∆σ due to error in force measurement. eLm estimated uncertainty in a due to variations between the potential drop
measuring wires.
1 Axial fatigue crack propagation specimen with a rectangular cross section area (10x4.3mm) and a 0.075 mm deep EDM notch.

S M & T Standards Measurement & Testing Project No. SMT4-CT97-2165
UNCERT COP 05: 2000
Page 2 of 23
ePDLm error in the PD-signal due to variations in the measuring wires. esec approximately error due to the method of determining da/dN (secant k coverage factor used to calculate expanded uncertainty (normally
corresponding to 95% confidence level). n number of measured crack lengths or/and cycle value for a given
filtered crack length with 2 decimals (result from the test data filter program).
p confidence level. PD potential Drop value defined as PDmeasure/PDreference PDmeasure potential drop value measured over the crack. PDreference potential drop value measured over a crack-unaffected area of the
specimen. q random variable.
q arithmetic mean of the values of the random variable q. s experimental standard deviation (of a random variable) determined
from a limited number of measurements. Sea calculated standard deviation of the error in crack length due to the
variations of the PD-signal. SN calculated standard deviation in number of cycles. U expanded uncertainty. u standard uncertainty. uc combined standard uncertainty. u(a)PD estimated uncertainty in a due to the variation of the PD-signal. u(a)cal estimated uncertainty in a due to the calibration curve. u(a)rep estimated uncertainty in a due to the repeatability. V value of the measurand. xi estimate of input quantity. ε elastic strain. ∆σ stress range. ∆N range in number of cycles, Nn+1 - Nn ∆K stress range intensity factor (Kmax – Kmin)

S M & T Standards Measurement & Testing Project No. SMT4-CT97-2165
UNCERT COP 05: 2000
Page 3 of 23
Figure 1-3 shows the definitions of the parameters used in the crack propagation test.
Figure 1-3 Parameters used in fatigue crack propagation testing. 3. INTRODUCTION It is good practice with any measurement to evaluate and report the uncertainty associated with the test results. A statement of uncertainty may be required by a customer who wishes to know the limits within which the reported result may be assumed to lie, or the test laboratory itself may wish to develop a better understanding of which particular aspects of the test procedure have the greatest effect on results so that this may be controlled more closely. This Code of Practice (CoP) has been prepared within UNCERT, a project funded by the European Commission’s Standards, Measurement and Testing programme under reference SMT4-CT97-2165 to simplify the way in which uncertainties are evaluated. The aim is to produce a series of documents in a common format which is easily understood and accessible to customers, test laboratories and accreditation authorities. This CoP is one of seventeen produced by the UNCERT consortium for the estimation of uncertainties associated with mechanical tests on metallic materials. Reference 1 is divided into 6 sections as follows, with all the individual CoPs included in Section 6.
1. Introduction to the evaluation of uncertainty 2. Glossary of definitions and symbols 3. Typical sources of uncertainty in materials testing 4. Guidelines for the estimation of uncertainty for a test series 5. Guidelines for reporting uncertainty 6. Individual Codes of Practice (of which this is one) for the estimation of
uncertainties in mechanical tests on metallic materials This CoP can be used as a stand-alone document. For further background information on the measurement uncertainty and values of standard uncertainties of the equipment and instrumentation used commonly in material testing, the user may need to refer to Section 3 in Reference 1. The individual CoPs are kept as simple as possible by following the same structure; viz:
σ (MPa)
N (number of cycles)
∆σ
PD
N (number of cycles)
reference
measure
PD
PDPD =
a ( m m )
0 1 2 3
PD
0
1
2
Results from calibration specimens
Calibration curve: PD=0.252+0.266*a+0.0483*a2
S M & T Standards Measurement & Testing Project No. SMT4-CT97-2165
UNCERT COP 05: 2000
Page 4 of 23
• The main procedure • Quantifying the major contributions to the uncertainty for that test type (Appendix
A) • A worked example (Appendix B)
This CoP guides the user through the various steps to be carried out in order to estimate the uncertainty in crack length and crack propagation rate. 4. A PROCEDURE FOR THE ESTIMATION OF UNCERTAINTY IN
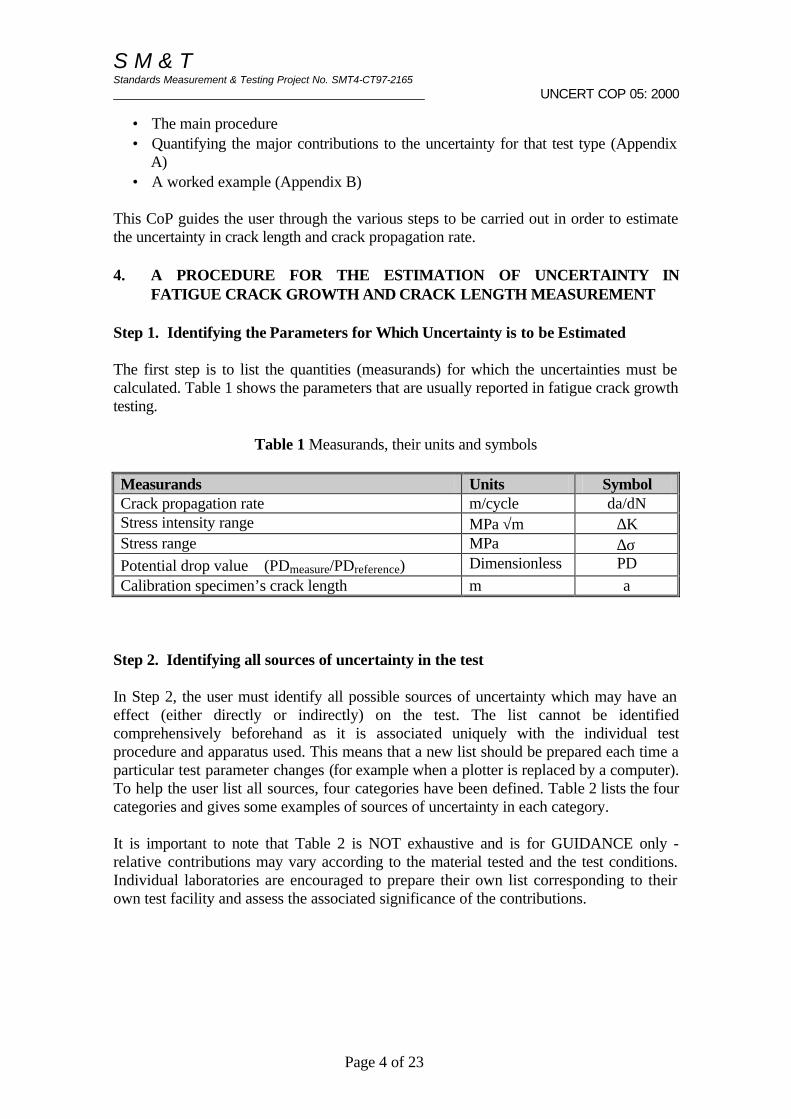
FATIGUE CRACK GROWTH AND CRACK LENGTH MEASUREMENT Step 1. Identifying the Parameters for Which Uncertainty is to be Estimated The first step is to list the quantities (measurands) for which the uncertainties must be calculated. Table 1 shows the parameters that are usually reported in fatigue crack growth testing.
Table 1 Measurands, their units and symbols
Measurands Units Symbol Crack propagation rate m/cycle da/dN Stress intensity range MPa⋅√m ∆K Stress range MPa ∆σ Potential drop value (PDmeasure/PDreference) Dimensionless PD
Calibration specimen’s crack length m a Step 2. Identifying all sources of uncertainty in the test In Step 2, the user must identify all possible sources of uncertainty which may have an effect (either directly or indirectly) on the test. The list cannot be identified comprehensively beforehand as it is associated uniquely with the individual test procedure and apparatus used. This means that a new list should be prepared each time a particular test parameter changes (for example when a plotter is replaced by a computer). To help the user list all sources, four categories have been defined. Table 2 lists the four categories and gives some examples of sources of uncertainty in each category. It is important to note that Table 2 is NOT exhaustive and is for GUIDANCE only - relative contributions may vary according to the material tested and the test conditions. Individual laboratories are encouraged to prepare their own list corresponding to their own test facility and assess the associated significance of the contributions.

S M & T Standards Measurement & Testing Project No. SMT4-CT97-2165
UNCERT COP 05: 2000
Page 5 of 23
Table 2 Typical sources of uncertainty and their likely contribution to uncertainties on fatigue crack growth measurands for a typical superalloy at room temperature.
[1 = major contribution, 2 = minor contribution, 0 = no contribution (zero effect)]
Source of uncertainty Type1 a ∆∆K da/dN
1. Test piece Dimension of the specimen A or B 0 2 0 Distance between the measuring wires A 1 2 0 Distance between the reference wires A 2 2 0 2. Test system Alignment B 2 1 0 Uncertainty in force measurement B 0 1 0 Drift in force measuring system B 0 2 0 Variation of the PD-signal due to noise, amplification, PD-source etc.
A 2 1 1
3. Environment Laboratory ambient temperature and humidity
B 2 2 0
4. Test Procedure Measuring the calibration specimen’s crack length
A or B 2 2 0
Calibration curve A 1 1 0 Repeatability of measurement A 1 1 0
The worked example in Appendix B uses the above categorisation when assessing uncertainties. Step 3. Classifying the Uncertainty According to Type A or B In this third step, which is in accordance with Reference 2, 'Guide to the Expression of Uncertainties in Measurement', the sources of uncertainty are classified as Type A or B, depending on the way their influence is quantified. If the uncertainty is evaluated by statistical means (from a number of repeated observations), it is classified Type A, if it is evaluated by any other means it should be classified as Type B. The values associated with Type B uncertainties can be obtained from a number of sources including a calibration certificate, manufacturer's information, or an expert's estimation. For Type B uncertainties, it is necessary for the user to estimate for each source the most appropriate probability distribution (further details are given in Section 2 of Reference 1). It should be noted that, in some cases, an uncertainty can be classified as either Type A or Type B depending on how it is estimated. Table 2 contains an example where, if the diameter of a cylindrical specimen is measured once, that uncertainty is considered Type B. If the mean value of two or more consecutive measurements is taken into account, then the uncertainty is Type A.
S M & T Standards Measurement & Testing Project No. SMT4-CT97-2165
UNCERT COP 05: 2000
Page 6 of 23
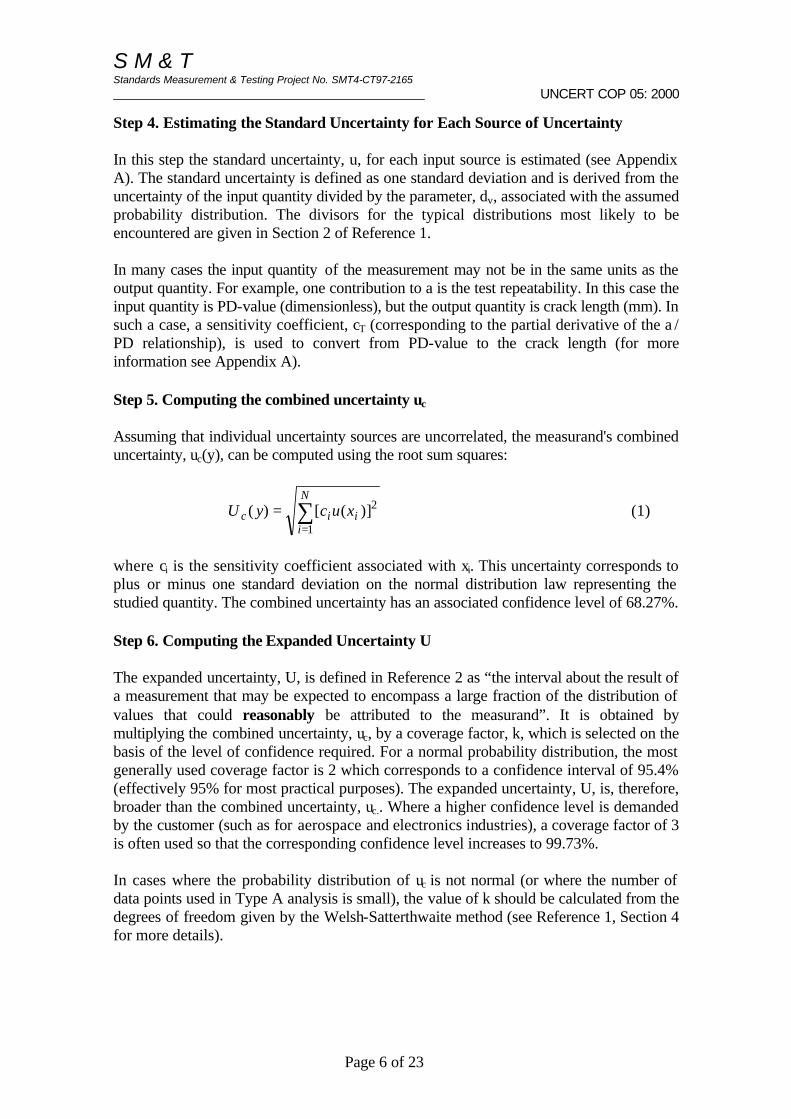
Step 4. Estimating the Standard Uncertainty for Each Source of Uncertainty In this step the standard uncertainty, u, for each input source is estimated (see Appendix A). The standard uncertainty is defined as one standard deviation and is derived from the uncertainty of the input quantity divided by the parameter, dv, associated with the assumed probability distribution. The divisors for the typical distributions most likely to be encountered are given in Section 2 of Reference 1. In many cases the input quantity of the measurement may not be in the same units as the output quantity. For example, one contribution to a is the test repeatability. In this case the input quantity is PD-value (dimensionless), but the output quantity is crack length (mm). In such a case, a sensitivity coefficient, cT (corresponding to the partial derivative of the a / PD relationship), is used to convert from PD-value to the crack length (for more information see Appendix A). Step 5. Computing the combined uncertainty uc Assuming that individual uncertainty sources are uncorrelated, the measurand's combined uncertainty, uc(y), can be computed using the root sum squares:
∑=
=N
iiic xucyU
1
2)]([)( (1)
where ci is the sensitivity coefficient associated with xi. This uncertainty corresponds to plus or minus one standard deviation on the normal distribution law representing the studied quantity. The combined uncertainty has an associated confidence level of 68.27%. Step 6. Computing the Expanded Uncertainty U The expanded uncertainty, U, is defined in Reference 2 as “the interval about the result of a measurement that may be expected to encompass a large fraction of the distribution of values that could reasonably be attributed to the measurand”. It is obtained by multiplying the combined uncertainty, uc, by a coverage factor, k, which is selected on the basis of the level of confidence required. For a normal probability distribution, the most generally used coverage factor is 2 which corresponds to a confidence interval of 95.4% (effectively 95% for most practical purposes). The expanded uncertainty, U, is, therefore, broader than the combined uncertainty, uc.. Where a higher confidence level is demanded by the customer (such as for aerospace and electronics industries), a coverage factor of 3 is often used so that the corresponding confidence level increases to 99.73%. In cases where the probability distribution of uc is not normal (or where the number of data points used in Type A analysis is small), the value of k should be calculated from the degrees of freedom given by the Welsh-Satterthwaite method (see Reference 1, Section 4 for more details).
S M & T Standards Measurement & Testing Project No. SMT4-CT97-2165
UNCERT COP 05: 2000
Page 7 of 23
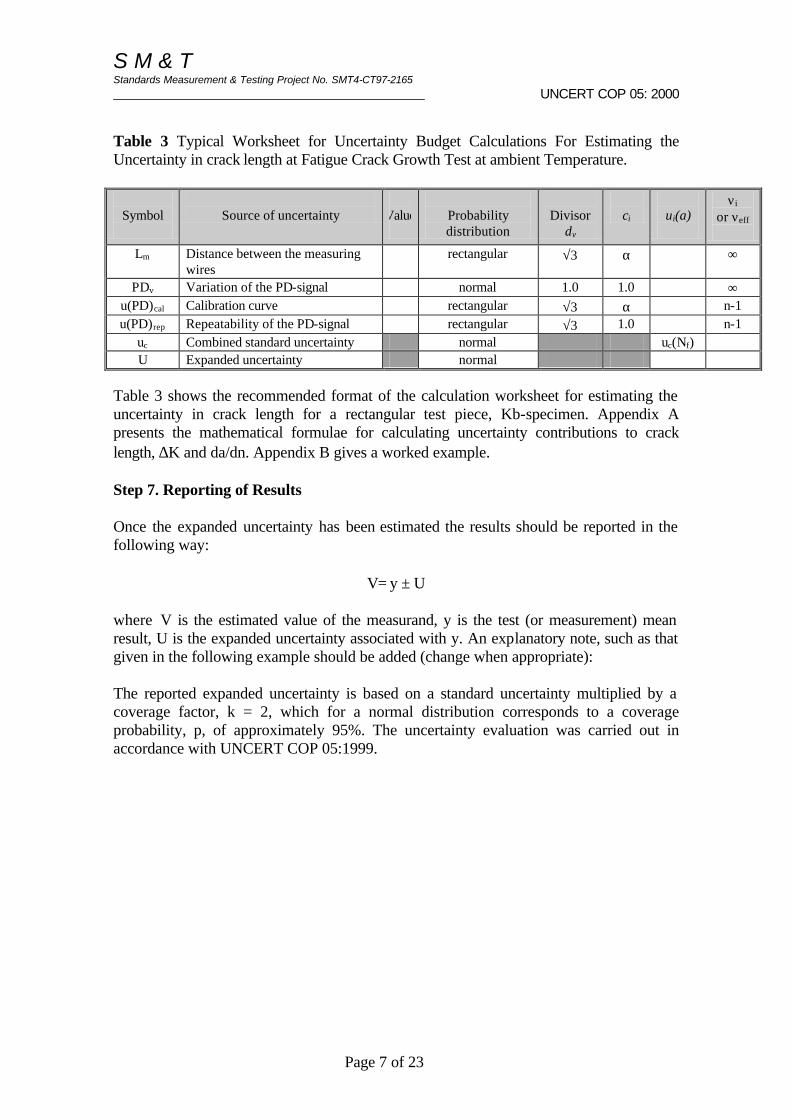
Table 3 Typical Worksheet for Uncertainty Budget Calculations For Estimating the Uncertainty in crack length at Fatigue Crack Growth Test at ambient Temperature.
Symbol
Source of uncertainty
Value
Probability distribution
Divisor
dv
ci
ui(a)
νi or νeff
Lm Distance between the measuring wires
rectangular √3 α ∞
PDv Variation of the PD-signal normal 1.0 1.0 ∞ u(PD)cal Calibration curve rectangular √3 α n-1 u(PD)rep Repeatability of the PD-signal rectangular √3 1.0 n-1
uc Combined standard uncertainty normal uc(Nf) U Expanded uncertainty normal
Table 3 shows the recommended format of the calculation worksheet for estimating the uncertainty in crack length for a rectangular test piece, Kb-specimen. Appendix A presents the mathematical formulae for calculating uncertainty contributions to crack length, ∆K and da/dn. Appendix B gives a worked example. Step 7. Reporting of Results Once the expanded uncertainty has been estimated the results should be reported in the following way:
V= y ± U where V is the estimated value of the measurand, y is the test (or measurement) mean result, U is the expanded uncertainty associated with y. An explanatory note, such as that given in the following example should be added (change when appropriate): The reported expanded uncertainty is based on a standard uncertainty multiplied by a coverage factor, k = 2, which for a normal distribution corresponds to a coverage probability, p, of approximately 95%. The uncertainty evaluation was carried out in accordance with UNCERT COP 05:1999.
S M & T Standards Measurement & Testing Project No. SMT4-CT97-2165
UNCERT COP 05: 2000
Page 8 of 23
5. REFERENCES 1. Manual of Codes of Practice for the determination of uncertainties in
mechanical tests on metallic materials. Project UNCERT, EU Contract SMT4-CT97-2165, Standards Measurement & Testing Programme, ISBN 0-946754-41-1, Issue 1, September 2000.
2. BIPM, IEC, IFCC, ISO, IUPAC, OIML, ”Guide to the Expression of Uncertainty
in Measurement”. International Organisation for Standardisation, Geneva, Switzerland, ISBN 92-67-10188-9, First Edition, 1993. [This Guide is often referred to as the GUM or the ISO TAG4 document after the ISO Technical Advisory Group that drafted it].
3. BSI (identical), ”Vocabulary of Metrology, Part 3. Guide to the Expression of
Uncertainty in Measurement”, PD 6461: Part 3: 1995, British Standards Institution.
4. ASTM E647, designation: E647-95a 1996 volume 03.01, Standard Test Method for
Measurement of Fatigue Crack Growth Rates. 5. ASTM E740, designation: E740-88 (re-approved 1995) 1996 volume 03.01,
Standard Practice for Fracture Testing With Surface-Crack Tension Specimens.
S M & T Standards Measurement & Testing Project No. SMT4-CT97-2165
UNCERT COP 05: 2000
Page 9 of 23
APPENDIX A
Mathematical Formulae for Calculating Uncertainties in Crack Length, ∆∆K and da/dn at Ambient Temperature
A1. Uncertainty due to variations between the measuring wires Variations between the measuring wires arises from the spot welding procedure. Since the size of the EDM notch and measuring wires is very small it is important that the spot weld is placed as close to the notch as possible in order to optimize the sensitivity of the potential drop method. Uncertainty in crack length: It is advisable that the error in PD-value (ePDLm) due to variations between the measuring wires is calculated by electrical FEM simulations. Such simulations can easily by done just by altering the location of the measuring wires in the range of tolerance for different crack lengths using ANSYS Poisson’s and Laplace’s equation. The uncertainty for a given crack length (a1) due to variations between the measuring wires is calculated according to the formula:
=
Lmaaδ
LmPD
PD
edvPD
a⋅⋅
∂∂
1
(m) (A1)
a1 ⇒ PD1 (the relation between a and PD is given by the calibration curve) Often it is not reasonable to do FEM simulations for every obtained crack length. To compensate for the uncertainty in crack lengths for all sampled crack lengths during crack propagation test it is easiest to choose one ePDLm that is conservative for all crack lengths. The ePDLm chosen should therefore be the largest ePDLm that is related to the shortest valid crack length during a test. Uncertainty in ∆K: Similarly, the uncertainty in ∆K due to variations in between the measuring wires can be expressed as:
=
∆∆
LmKKδ
Lma a
adv
a
K
⋅⋅
∂∆∂ δ
1
(MPa⋅√m) (A2)

S M & T Standards Measurement & Testing Project No. SMT4-CT97-2165
UNCERT COP 05: 2000
Page 10 of 23
A2. Uncertainty due to Alignment (Bending) Uncertainty in ∆K: The bending is proportional to ∆K according to the formulas: εσ ⋅= E (A3)
afK ⋅⋅∆⋅=∆ πσ (A4) Thus the uncertainty in ∆K due to bending is calculated according to the formula:
=
∆
bendingK
Kδ dveK bending ⋅⋅∆ ε (Mpa⋅√m) (A5)
A3. Uncertainty due to Variations of the PD-signal Uncertainty in a: The uncertainty in a due the variations of the PD-signal should be very small for every test lab using modern test equipment. The presented procedure below also gives a good control of the evaluation technique used (best fit solution, data filter etc.) In order to calculate the uncertainty due to variations of the PD-signal it is necessarily to first calculate da/dN as a function of ∆K. Since this evaluation gives the result in a derivative it recommended to use some kind of test data filter and not use a best a Vs N curve fit. The test data reduction technique used is based on calculating the average N for the cycles satisfying a-0.01 <a < a+0.01 mm and using the standard deviation in N, see example in table A1 below.
Figure A1 Test data filter
a (mm) N (mean) n SN 0.78 93223.5 18 69.9926 0.79 93385.5 15 52.1493 0.80 93575.6 22 65.7503 0.81 93765.8 16 50.7953 0.82 93924.5 16 51.0412 0.83 94086.4 16 51.4663
S M & T Standards Measurement & Testing Project No. SMT4-CT97-2165
UNCERT COP 05: 2000
Page 11 of 23
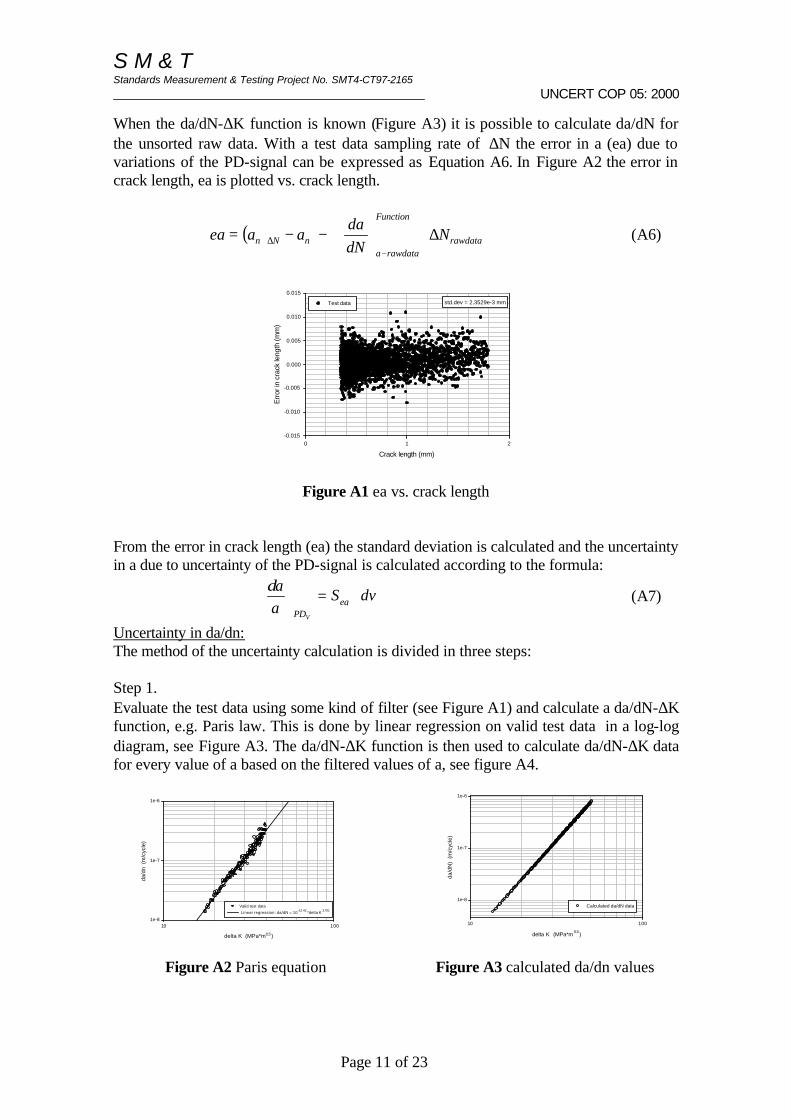
When the da/dN-∆K function is known (Figure A3) it is possible to calculate da/dN for the unsorted raw data. With a test data sampling rate of ∆N the error in a (ea) due to variations of the PD-signal can be expressed as Equation A6. In Figure A2 the error in crack length, ea is plotted vs. crack length.
( )
∆⋅
−−=
−∆+ rawdata
Function
rawdataanNn N
dN
daaaea (A6)
Crack length (mm)
0 1 2
Err
or in
cra
ck le
ngth
(mm
)
-0.015
-0.010
-0.005
0.000
0.005
0.010
0.015
Test data std.dev = 2.3529e-3 mm
Figure A1 ea vs. crack length From the error in crack length (ea) the standard deviation is calculated and the uncertainty in a due to uncertainty of the PD-signal is calculated according to the formula:
dvSa
aea
PDV
⋅=
δ
(A7)
Uncertainty in da/dn: The method of the uncertainty calculation is divided in three steps: Step 1. Evaluate the test data using some kind of filter (see Figure A1) and calculate a da/dN-∆K function, e.g. Paris law. This is done by linear regression on valid test data in a log-log diagram, see Figure A3. The da/dN-∆K function is then used to calculate da/dN-∆K data for every value of a based on the filtered values of a, see figure A4. Figure A2 Paris equation Figure A3 calculated da/dn values
delta K (MPa*m0.5)
10 100
da/d
n (
m/c
ycle
)
1e-8
1e-7
1e-6
Valid test data
Linear regression: da/dN = 10-12.42
*delta K3.701
delta K (MPa*m 0.5)
10 100
da/d
N)
(m
/cyc
le)
1e-8
1e-7
1e-6
Calculated da/dN data
S M & T Standards Measurement & Testing Project No. SMT4-CT97-2165
UNCERT COP 05: 2000
Page 12 of 23
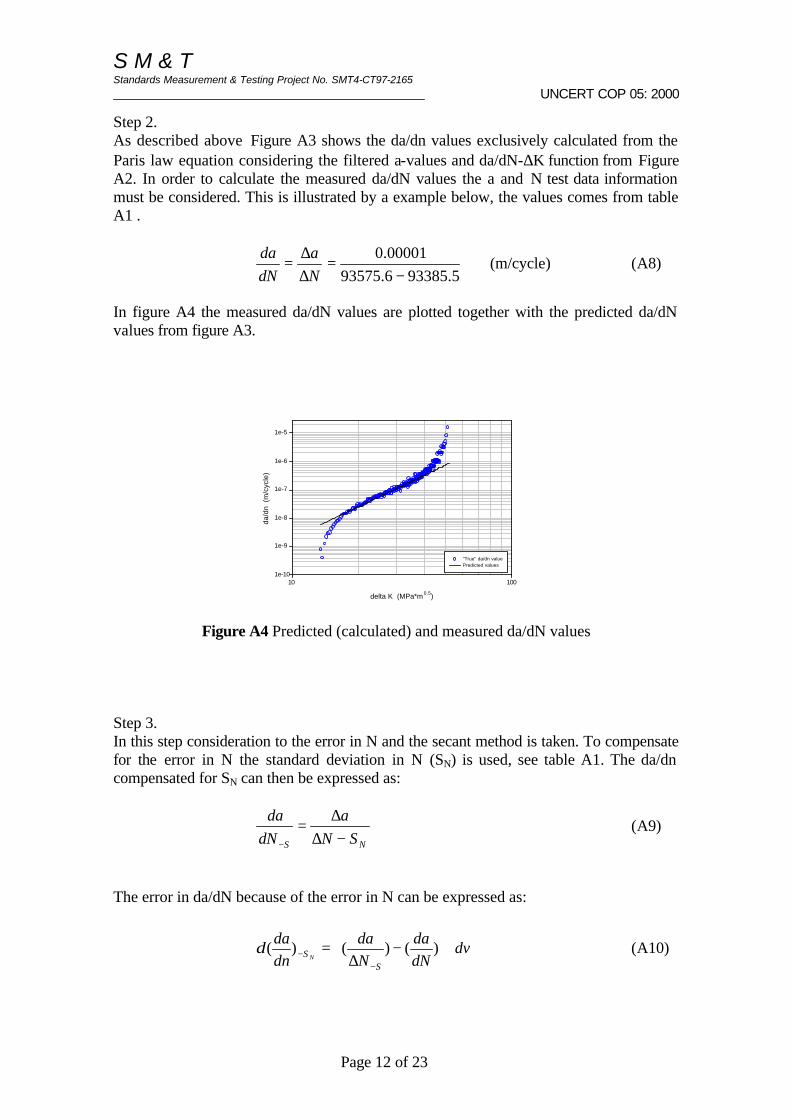
Step 2. As described above Figure A3 shows the da/dn values exclusively calculated from the Paris law equation considering the filtered a-values and da/dN-∆K function from Figure A2. In order to calculate the measured da/dN values the a and N test data information must be considered. This is illustrated by a example below, the values comes from table A1 .
5.933856.93575
00001.0
−=
∆∆
=N
a
dN
da (m/cycle) (A8)
In figure A4 the measured da/dN values are plotted together with the predicted da/dN values from figure A3.
delta K (MPa*m0.5)
10 100
da/d
n (
m/c
ycle
)
1e-10
1e-9
1e-8
1e-7
1e-6
1e-5
"True" da/dn valuePredicted values
Figure A4 Predicted (calculated) and measured da/dN values Step 3. In this step consideration to the error in N and the secant method is taken. To compensate for the error in N the standard deviation in N (SN) is used, see table A1. The da/dn compensated for SN can then be expressed as:
NS SN
a
dN
da
−∆∆
=−
(A9)
The error in da/dN because of the error in N can be expressed as:
dvdN
da
N
da
dn
da
SS N
⋅
−
∆=
−− )()()(δ (A10)

S M & T Standards Measurement & Testing Project No. SMT4-CT97-2165
UNCERT COP 05: 2000
Page 13 of 23
The error because of the secant method can approximately be expressed as:
aaa
ant dN
da
dN
da
dN
da
−
=
∆+sec)(δ (A11)
A4. Uncertainty due to the Calibration Curve Uncertainty due to the calibration curve is a Type A uncertainty contribution. It is the standard deviation of the estimated mean value of a series of test results under the same conditions considered in the uncertainty analysis as follows. Uncertainty in a: The standard deviation of the a, S(a) is calculated from the difference between ameasured and apredicted as:
2
1
2 )(1
1)( difference
n
idifference aa
nSaS −
−=⇒ ∑
=
, (A12)
( predictedmeasureddifference aaa −= )
The uncertainty in a due to the calibration curve is:
2
1
)(1
1)( difference
n
idifferencencurvecalibratio aa
nau −
−= ∑
=⋅dv (A13)
Uncertainty in ∆K: The uncertainty in ∆K is dependent on the uncertainty in a (A13) and it is described as:
=
∆∆
ncurvecalibratioK
Kδdvauci ncurvecalibratio ⋅⋅ )( (A14)
∂∆∂
=a
Kci (A15)

S M & T Standards Measurement & Testing Project No. SMT4-CT97-2165
UNCERT COP 05: 2000
Page 14 of 23
A4. Uncertainty due to Repeatability In order measure the repeatability of the test system is necessarily to mount the test machine repeatedly with the same specimen. This gives a scatter band from which the standard deviation of the PD can be calculated. It is important that the crack length chosen for this study is so small that no propagation occurs during the repeatability test. The same reasoning is also for the number of cycles completed within each test, see Figure A6.
N
0 20 40 60 80 100 120
PD
(P
D mea
sure/
PD r
efer
ence
)
0.480
0.485
0.490
0.495
0.500
0.505
0.510
test 1test 2test 3test 4test 5test 6test 7test 8test 9Plot 1 Mean
SPD=0.0067
Figure A6 Repeatability test on nine Kb-specimen. Uncertainty in a: The uncertainty in a due to imperfect repeatability can be expressed as:
ityrepeatabilityrepeatabil
Sdvcia
a ⋅⋅=
δ
(A16)
∂∂
=PD
aci (A17)
Uncertainty in ∆K: Similarly, the uncertainty in ∆K due to errors in repeatability can be expressed as:
ityrepeatabilityrepeatabil a
advci
K
K
⋅⋅=
∆∆ δδ
(A18)
∂∆∂
=a
Kci (A19)

S M & T Standards Measurement & Testing Project No. SMT4-CT97-2165
UNCERT COP 05: 2000
Page 15 of 23
APPENDIX B
A Worked Example for Calculating Uncertainties in Crack Propagation Test Using
DCPD Method and Kb-Specimen at Room Temperature B1. Introduction A customer asked a testing laboratory to carry out crack propagation tests at room temperature according to ASTM E647 on rectangular Kb test specimens made of IN718 superalloy. The laboratory has considered the sources of uncertainty in its test facility and found that the sources of uncertainty in crack propagation test results are identical to those described in Table 2 of the Main Procedure. B2. Estimation of Input Quantities to the Uncertainty Analysis 1 All tests were carried out according to the laboratory’s own written procedure
using an appropriately calibrated fatigue test facility. The test facility was located in a temperature-controlled environment (21±2oC).
2 The dimensions of the specimen were measured using a calibrated analog
micrometer with an accuracy of ± 0.002 mm (manufacturer’s specification) and a resolution of ±0.005 mm.
3 The test was carried out on a servo-hydraulic test facility under load-controlled
conditions using a triangular load wave with a stress ratio of 0 and a frequency of 15Hz. The stress range used in the test was 700 MPa. The machine was calibrated to Class 1 according to EN 10 002. Uncertainty of mean incremental error = ±1.5%.
4. ∆K-solution used was: aK ⋅⋅∆⋅⋅=∆ πσ63.012.1 . The uncertainty due to the K-solution was negligible. Old handbook K-solutions has a uncertainty typically in the order of 1-2 %, with modern FEM solutions this uncertainty is smaller.
6 Specimen bending measurements were carried out on a strain-gauged specimen at
ambient temperature. Maximum allowed bending is 5%. 7 The DC current source was a Thurlby Thandar instrument and it is estimated that the
uncertainty due to DC source is insignificant. 8 Four calibration specimen tests were carried out in order to calculate the PD vs. a
function i.e. the calibration curve, see figure B1 below. The crack length measurement were done by heat tint, 4 crack lengths can be obtained on each specimen.

S M & T Standards Measurement & Testing Project No. SMT4-CT97-2165
UNCERT COP 05: 2000
Page 16 of 23
Figure B1 Calibration curve for IN718 obtained from four Kb-specimens.
9. The error in PD-value (ePDW) due to variations in lengths between the measuring
wires is calculated by electrical FEM simulations. Different crack lengths were examined and the results are shown in Table B2.
Table B2 PD-error for different crack lengths 10. The da/dN-∆K function for the tested specimen is calculated by linear regression
(figure A2) :
701.3131081.3 KdN
da∆⋅⋅= − (m/cycle)
Crack length (mm) ePDW (% error) 0.25 5.62 0.8 2.32 2.0 0.47
a ( m m )
-1 0 1 2 3 4
PD
0
1
2Exper imental data [S=0.06475]
Cal ibrat ion curve: PD = 0.252 + 0.266*a + 0.0483*a2
r2=0.991Calibrat ion curve +1S Calibrat ion curve -1S

S M & T Standards Measurement & Testing Project No. SMT4-CT97-2165
UNCERT COP 05: 2000
Page 17 of 23
B3. Example of Uncertainty Calculations and Reporting of Results for a Given Crack Length.
Note all calculations below are for a crack length, a = 0.8mm, it is however possible to use the method of calculation for every crack length during a test i.e. the entire da/dN-∆K curve. The result from such a calculation is shown in Figure B5. Influence on a: - Uncertainty due to measuring wires: PD-error from FEM calculation = 2.32% for 0.8 mm crack length, see Figure B2. PDa=0.8mm=0.4957, calculated from the calibration curve equation in Figure B1.
91.2)0483.0
252.0(5767.7
0483.021
5.0
4957.0
=
−−⋅
⋅=
∂∂=
−
=
PDPDa
ciPD
37
ui(a) = 0.0232 ⋅ 0.4947 ⋅ 2.9137 ⋅ dv - Uncertainty due to variation of the PD-signal: The standard deviation in crack length error due to PD-variation was found to be ±2.35µm, which is considered as insignificant, see Figure A1. - Uncertainty due to the calibration curve: Standard deviation, Sa=0.06475 mm (valid for all crack lengths, see B1.) - Uncertainty due to repeatability: The repeatability was obtained by nine-repeated test with the same specimen, i.e. reload and unload the specimen from grip and all means of PD-wires attachment. The standard deviation in the PD-signal was found to be ±0.0067, see Figure A6.
9137.24957.0
=
∂∂=
=PDPD
aci (partial derivative of the calibration curve, Figure B1)
ui(a) = ci ⋅ SPD ⋅ dv = 2.9137 ⋅ 0.0067 ⋅ dv (valid for all crack lengths)
S M & T Standards Measurement & Testing Project No. SMT4-CT97-2165
UNCERT COP 05: 2000
Page 18 of 23
Influence on ∆∆K: Uncertainty due to measuring wires:
154728.0
=
∂∆∂=
= mmaa
Kci (partial derivative of the K-solution used, see B2.4)
ui(∆K) is judged as a minor contribution (see table 2). It can be calculated using above sensitivity factor, the error on ∆K due to the measuring wires is then less then 1%. Uncertainty due to alignment (bending): ± 5% (proportional to the stress range). Uncertainty due to load cell: ± 1.5% (proportional to the stress range). Uncertainty due to the calibration curve:
ci = 154728.0
=
∂∆∂
= mmaa
K (partial derivative of the K-solution used, see B2.4)
ui(∆) = ci ⋅ Sa ⋅ dv = 15472 ⋅ 6.475⋅10-5 ⋅ dv Uncertainty due to uncertainty in the crack length: (A2) The uncertainty in ∆K due to uncertainty in crack length can be expressed as: ui(∆K ) = uc(a) ⋅ ci ⋅ dv = 43.6 ⋅ 10-6 ⋅ 15472 ⋅ dv Where uc(a) is the combinated standard uncertainty in crack length, see Table B2.
ci = 154728.0
=
∂∆∂
= mmaa
K (partial derivative of the K-soulution)
Influence on da/dN: Uncertainty due to variation of the PD-signal:
cyclemN
a/1026.5
1.190
00001.0
5.933856.93575
00079.00008.0 8)1
)1−⋅==
−−
=∆∆
1) see Table A1.
8)1
10035.875.651.190
00001.0)( −
− ⋅=−
=−∆
∆=
NS SN
a
dN
daN

S M & T Standards Measurement & Testing Project No. SMT4-CT97-2165
UNCERT COP 05: 2000
Page 19 of 23
810775.2)()( −−− ⋅=
∆∆
−=N
a
dN
da
dN
daNN SSδ
Uncertainty due to secant error:
701.30008.0
13701.300081.0
13sec 108.3108.3)( =
−=
−
∆+
∆⋅⋅−∆⋅⋅=
−
= aa
Function
a
Function
aaant KK
dN
da
dN
da
dN
daδ
cyclemmdN
daant /102.11047.51059.5)( 988
sec−−− ⋅=⋅−⋅=δ
Table B1 lists the input quantities used to produce Table B2, B3 and B4 the uncertainty budget for estimating the uncertainty in a, ∆K and da/dN at room temperature. To exemplify the method of calculating one crack length (0.8mm) has been chosen as a basis for for calculations.
Table B1 Input Quantities Used for Producing Table B2
Quantity Symbol Values Mean
Standard deviation
Crack length (mm) a 0.8 Crack propagation rate (m/cycle) da/dN 5.26⋅10-8 Stress range intensity factor (Mpa⋅√m) ∆K 24.75 Crack length sensitivity coefficient 1) ci a 2.9137 mm/PD ∆K sensitivity coefficient 2) ci∆K 15472 Mpa⋅√m/m Error in PD due to variations between the measuring wires
eLM ±2.32% 0.4957
Error in the ∆σ due to alignment ψ ±5% Error in the ∆σ due to force measurment eF ±1.5% Variation of the PD-signal ePD 2.35µm Error in a due to the calibration curve ecal 64.75µm Error in PD due to repeatability er 0.0067 1) ciPD is obtained from differentiating the calibration equation shown in Fig. B1 2) cia is obtained from differentiating the K-soulution used (∆K=1.12⋅0.63⋅∆σ⋅√π⋅a).
S M & T Standards Measurement & Testing Project No. SMT4-CT97-2165
UNCERT COP 05: 2000
Page 20 of 23
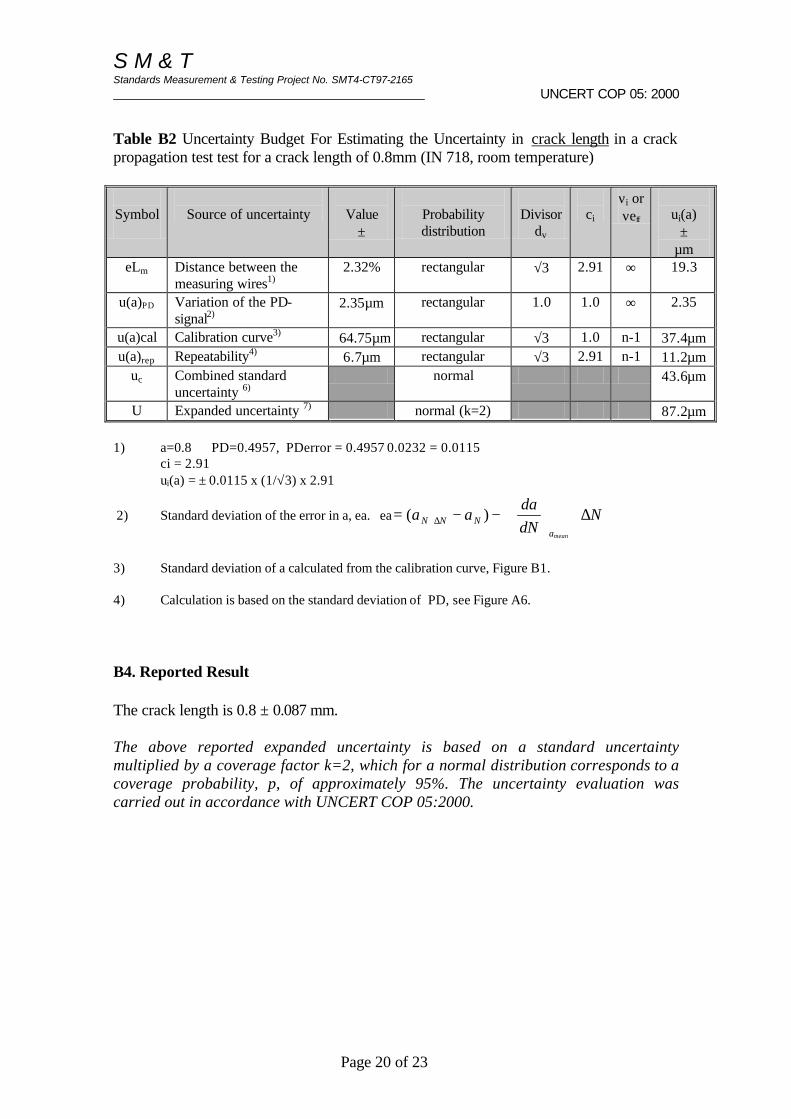
Table B2 Uncertainty Budget For Estimating the Uncertainty in crack length in a crack propagation test test for a crack length of 0.8mm (IN 718, room temperature)
Symbol
Source of uncertainty
Value
±
Probability distribution
Divisor
dv
ci
νi or νeff
ui(a)
± µm
eLm Distance between the measuring wires1)
2.32% rectangular √3 2.91 ∞ 19.3
u(a)PD Variation of the PD-signal2)
2.35µm rectangular 1.0 1.0 ∞ 2.35
u(a)cal Calibration curve3) 64.75µm rectangular √3 1.0 n-1 37.4µm u(a)rep Repeatability4) 6.7µm rectangular √3 2.91 n-1 11.2µm
uc Combined standard uncertainty 6)
normal 43.6µm
U Expanded uncertainty 7) normal (k=2) 87.2µm 1) a=0.8 ⇒ PD=0.4957, PDerror = 0.4957⋅0.0232 = 0.0115 ci = 2.91 ui(a) = ± 0.0115 x (1/√3) x 2.91
2) Standard deviation of the error in a, ea. ea
∆⋅
−−= ∆+ N
dN
daaa
meanaNNN )(
3) Standard deviation of a calculated from the calibration curve, Figure B1. 4) Calculation is based on the standard deviation of PD, see Figure A6.
B4. Reported Result The crack length is 0.8 ± 0.087 mm. The above reported expanded uncertainty is based on a standard uncertainty multiplied by a coverage factor k=2, which for a normal distribution corresponds to a coverage probability, p, of approximately 95%. The uncertainty evaluation was carried out in accordance with UNCERT COP 05:2000.

S M & T Standards Measurement & Testing Project No. SMT4-CT97-2165
UNCERT COP 05: 2000
Page 21 of 23
Table B3 Uncertainty Budget For Estimating the Uncertainty in ∆K in a crack propagation test test for a crack length of 0.8 mm (IN 718, room temperature)
Symbol
Source of uncertainty
Value
±
Probability distribution
Divisor
dv
ci
νi or νeff
ui(∆K)
± MPa⋅√m
Ψ Error in the ∆σ due to alignment1)
5% normal 2 1.0 ∞ 0.62
eF Error in the ∆σ due to force measurment2)
1.5% normal 2 1.0 ∞ 0.18
uc(a) Combined standard uncertainty in crack length3)
43.6µm normal 1.0 15472 ∞ 0.67
uc Combined standard uncertainty 6)
normal 0.93
U Expanded uncertainty 7) normal (k=2) 1.86 1) a=0.8 ⇒ (1.12⋅0.63⋅∆σ⋅√π⋅a), ∆K= 24.75 MPa⋅√m ui(∆K) = 0.05⋅24.75⋅1/2 =0.62 2) ui(∆K) = 0.015⋅24.75⋅1/2 3) Combined standard uncertainty of a, see table B1. B5. Reported Result For a crack length of 0.8 mm the stress intensity factor range ∆K is 24.75 ± 1.86MPa⋅√m. The above reported expanded uncertainty is based on a standard uncertainty multiplied by a coverage factor k=2, which for a normal distribution corresponds to a coverage probability, p, of approximately 95%. The uncertainty evaluation was carried out in accordance with UNCERT COP 05:2000.

S M & T Standards Measurement & Testing Project No. SMT4-CT97-2165
UNCERT COP 05: 2000
Page 22 of 23
Table B4 Uncertainty Budget For Estimating the Uncertainty in da/dN in a crack propagation test for a crack length of 0.8mm (IN 718, room temperature)
Symbol
Source of uncertainty
Value
±
Probability distribution
Divisor
dv
ci
νi or νeff
ui(da/dN)
± m/cycle
SN Error in N(mean) 1) 65.75 cycles normal 2.0 1.0 ∞ 1.39⋅10-8 esec Error due to secant method
2) 1.2⋅10-9
m/cycle normal 1.0 1.0 ∞ 1.2⋅10-9
uc Combined standard uncertainty 3)
normal 1.51⋅10-8
U Expanded uncertainty 4) normal (k=2)
2.9⋅10-8
1) a=0.8 ⇒ N(mean)=93575.6. SN=65.75 cycles obtained from the test data filter described in section A3. ∆a = 0.01mm, ∆Nmeasure=190.1 cycles
ui =
−SNdN
da
∆∆
−
−∆
∆=
∂∂
− N
a
SN
a
N
a
NSN
δ
2) Systematic error 3) uC= 1.39⋅10-8 + 1.2⋅10-9 4) U (k=2) = 2 ⋅ 1.39⋅10-8 + 1.2⋅10-9 B6. Reported Result The crack propagation rate for a 0.8 mm crack length is 5.26⋅10-8 ± 2.9⋅10-8 m/cycles. The above reported expanded uncertainty is based on a standard uncertainty multiplied by a coverage factor k=2, which for a normal distribution corresponds to a coverage probability, p, of approximately 95%. The uncertainty evaluation was carried out in accordance with UNCERT COP 05:2000.

S M & T Standards Measurement & Testing Project No. SMT4-CT97-2165
UNCERT COP 05: 2000
Page 23 of 23
5. Calculation and Reporting da/dN-∆∆K Functions Result. In Figure B5 da/dN vs. ∆K has been plotted for every obtained crack length during a test. The two curves of interest when reporting the uncertainty are obviously the mean curve from which no consideration of uncertainty has been made (circle) and the curve which has been compensated for both the uncertainty in da/dN and ∆K (triangle). How to report the uncertainty is dependent on the material model used, in the example below Paris law has been used. Since the uncertainty in the da/dN-∆K curve is not symmetric around the mean curve, the uncertainty cannot be expressed as ± uncertainty. Figure B5 shows the mean curve compensated only for the positive uncertainty. In order to calculate the curves in figure B5 most of the uncertainty values (ui) can be taken directely from table B2-B4 with the following exception: - The value of the error in PD due to the measuring wires (eLm) in Table B2 is the one for crack length = 0.8mm. When calculating ui(a) for eLm for every crack length as in Figure B5, the error in PD used is the one for the shortest valid crack length (5.62%). - The value of SN is not a fixed value, as the crack grows SN will decrease, see Figure A1. Figure B5 Presentation of the positive Expanded Uncertainty for the da/dN-∆K curve.
B7. Reported Result: [da/dN=C⋅∆Kn]
da/dN =3.81⋅10-13⋅∆K3.701 : C= )(−
+ 3.42⋅10-13 valid for: 17≤ ∆K ≥38 MPa⋅√m.
The above reported positive expanded uncertainty is based on a standard uncertainty multiplied by a coverage factor k=2, which for a normal distribution corresponds to a coverage probability, p, of approximately 95%. The uncertainty evaluation was carried out in accordance with UNCERT COP 05:2000.
delta K (MPa*m0.5)
10 100
da/d
N
(m/c
ycle
)
1e-10
1e-9
1e-8
1e-7
1e-6
1e-5
da/dN test datatest data compensated for uncertainty in delta K and da/dn (k=2)da/dN = 3.81E-13 * delta K3.701
da/dN = 7.24E-13 * delta K3.701