
Refinement of the structure of Household Balance Sheet in South Africa

Federal Reserve Bank of St. Louis REVIEW September/October 2013 337
The Current State of U.S. Household Balance Sheets
Jacob Krimmel, Kevin B. Moore, John Sabelhaus, and Paul Smith
H ousehold sector balance sheets both contributed to and were dramatically affected bythe Great Recession. The run-up in housing and stock prices in the years precedingthe recession contributed to the strong growth in consumer spending and the rapid
pace of debt accumulation during that period and thus helped to create a situation in whichmore households were more vulnerable to financial shocks.1 The steep declines in house valuesand stock prices at the onset of the recession (combined with rising unemployment and declin-ing incomes) contributed to the substantial drop and subsequent anemic growth in consumerspending that has dominated macroeconomic activity for the past five years. One of the usualexplanations for continuing spending restraint by consumers is the desire by at least some
The Board of Governors of the Federal Reserve System is responsible for two of the most widely useddatasets containing information about U.S. household balance sheets: the quarterly macro-level FinancialAccounts of the United States (FA, formerly known as the Flow of Funds Accounts) and the triennialmicro-level Survey of Consumer Finances (SCF). The FA is very timely, but the data can be used onlyto describe the household sector as a whole. The SCF provides the micro-level detail needed to captureheterogeneity in household finances, but the data are available only with a long lag. The authors’ keycontribution in this article is their use of the FA dataset and other macro data sources to “age” the micro-level SCF data forward through time to generate a representative sample for current-quarter policyanalysis. They use this aging approach to compare and contrast pre- and post-recession trends in keyindicators, such as net worth, debt-to-income ratios, debt service-to-income ratios, and housing loan-to-value ratios across families grouped by characteristics including income, age, and geography. (JEL E21, D31, D91)
Federal Reserve Bank of St. Louis Review, September/October 2013, 95(5), pp. 337-59.
Jacob Krimmel is a senior research assistant in the Research and Statistics Division; Kevin B. Moore is a senior economist; John Sabelhaus is chief ofthe Microeconomic Surveys Section, Research and Statistics Division; and Paul Smith is chief of the Flow of Funds Section, Research and StatisticsDivision, of the Board of Governors of the Federal Reserve System. The authors thank Karen Pence for comments on an earlier draft. The analysisand conclusions set forth are those of the authors and do not indicate concurrence by other members of the research staff or the Board ofGovernors. This paper was prepared for presentation at the symposium, “Restoring Household Financial Stability after the Great Recession: WhyHousehold Balance Sheets Matter,” sponsored by the Federal Reserve Bank of St. Louis and Washington University in St. Louis, February 5-7, 2013.
© 2013, The Federal Reserve Bank of St. Louis. The views expressed in this article are those of the author(s) and do not necessarily reflect the viewsof the Federal Reserve System, the Board of Governors, or the regional Federal Reserve Banks. Articles may be reprinted, reproduced, published,distributed, displayed, and transmitted in their entirety if copyright notice, author name(s), and full citation are included. Abstracts, synopses, andother derivative works may be made only with prior written permission of the Federal Reserve Bank of St. Louis.

households to avoid reverting to the vulnerable balance-sheet situations they faced as therecession started.2
Clearly, understanding the most recent business cycle and the slow pace of the ongoingrecovery requires an understanding of the evolution of household balance sheets. Unfortunately,the datasets available for studying household balance sheets all have significant limitations acrossone or more dimensions—such as representativeness, timeliness, level of aggregation, degree oflongitudinal information, and level of detail. These limitations impair our ability to track theevolution of household balance sheets over time in sufficient detail to identify important changesas they occur. In this article, we circumvent this problem by combining existing data sources totrack the evolution of household balance sheets in a manner that is timely yet still captures impor-tant heterogeneity.
We focus on two widely used data sources on household balance sheets, both of which areproduced by the Board of Governors of the Federal Reserve System—the Financial Accounts ofthe United States (FA),3 which provide quarterly estimates of the aggregate assets and liabilitiesheld by the household sector, and the Survey of Consumer Finances (SCF), which provides adetailed triennial snapshot of the finances and balance sheets of a representative sample of U.S.households.4
These two data sources were developed for different purposes. The FA provides a timelymeasure of the aggregate state of U.S. households, which is a key indicator for the macroeconomicoutlook. The SCF provides a detailed look at the rich heterogeneity in household finances, whichis critical for understanding the microeconomic underpinnings of macroeconomic activity. Weused FA data through the third quarter of 2013, but the dataset lacks micro data on householdbalances sheets. The SCF provides rich micro data for a point in time, but because it is costly andlabor intensive to produce, the SCF is available only every three years and has a two-year produc-tion lag (for example, the most recent survey is from 2010, which became available in 2012). Theprimary goal of our study described here is to combine the two datasets in an effort to create atimely dataset of detailed household-level balance-sheet information.
More generally, our goal is to explore a methodology to answer the following question: Howcan we use a combination of the SCF, the FA, and other available macro data to more comprehen-sively describe the current state of household finances? As later described, the central conceptdeveloped here can be described as “aging” the most recent SCF sample forward using the infor-mation available in the FA and other macro data sources. At the most basic level, each householdrecord in the SCF can be updated each quarter by applying estimated changes in asset valuesusing a local house price index for house values and an equity price index for corporate equityvalues. As we show below, this simple first step alone accounts for most of the change in house-hold net worth since 2010, as measured in the FA.
An important first step when integrating micro and macro data sources in such a simulationexercise is reconciling the economic concepts and measurement used in the two datasets. Asdescribed later (and in Appendix A), we make several adjustments to both the SCF and the FAto put them on the same footing.
Once these adjustments are made, the evolution of household balance sheets is generallysimilar in both the SCF and the FA. For example, both datasets show nearly identical levels and
Krimmel, Moore, Sabelhaus, Smith
338 September/October 2013 Federal Reserve Bank of St. Louis REVIEW

trends in the overall household debt-to-income (D/I) ratio. An interesting feature that meritsfurther analysis is that asset values do not track quite as closely between the two datasets. Inparticular, the SCF and FA show different rates of change in house prices in the period leadingup to the Great Recession,5 but even for these statistics the overall patterns of change for thisperiod are very similar.
The projections generate some intriguing results. Between 2010 and 2011, house prices andstock prices were both still falling in the aggregate, causing household wealth to fall. At the endof 2011, stock prices began to rise fairly robustly, while house price growth was much more mod-erate. This pattern led to gains in household net worth concentrated at the top of the wealth dis-tribution. As house prices continued to grow through 2012, household balance sheets began toimprove across the distribution and the share of households with key financial ratios (such asthe loan-to-value [LTV] ratio) showing high degrees of distress began to fall. Thus, the projec-tion suggests that important improvements in the balance-sheet positions of many householdsare currently underway, though elevated debt levels associated with the housing boom are stillwidespread.
MEASURING HOUSEHOLD WEALTH IN THE FA AND THE SCFAs noted, the FA and the SCF were developed for different purposes and do not measure
household balance sheets in the same manner. As a result, we need to standardize the conceptsof household assets and liabilities across the datasets before combining the information. Becauseour general approach is to start with the 2010 SCF and age it forward, we adjust the FA data tomake them more conceptually similar to the SCF data.6
The first step is to align the concept of “household.” In the FA, the household sector is esti-mated residually—that is, household holdings of each asset category are estimated as the totaloutstanding less holdings of the other sectors (businesses, governments, financial institutions,and foreign holders). This strategy is required because there are no comprehensive administrativedata sources on aggregate household assets and liabilities. Because we also lack comprehensiveadministrative data sources on other parts of the economy—in particular, nonprofit organiza-tions, hedge funds, and other private pools of assets—these other factors are also included inthe FA’s household sector by default. However, we are able to measure certain components, suchas the real estate holdings of nonprofit organizations. So, we first remove these holdings fromthe FA’s household sector.
A second standardization adjustment is related to institutional holdings of assets on behalfof households. The two most important examples are assets held by defined benefit pensionfunds and life insurance companies to back promises of future payments to households. Theseassets (or more precisely, the promises they back) can thus reasonably be considered part of house-hold net worth and are included in the FA concept of household wealth.7 However, it is difficultto measure the value of these promises accurately in the SCF. The SCF includes some questionsabout pension coverage and defined benefit income expectations, but a comprehensive calcula-tion of the value of these pension claims is beyond the scope of this article.8 Thus, we exclude
Krimmel, Moore, Sabelhaus, Smith
Federal Reserve Bank of St. Louis REVIEW September/October 2013 339

this source of wealth from the FA measure of net worth to standardize the data sources. On net,these adjustments lower FA net worth by about 21 percent in 2012.
We make similar types of conceptual adjustments to another macro data source we use tomeasure changes in aggregate income—the National Income and Product Accounts (NIPA).NIPA personal income is based on a very broad concept that includes “in-kind” payments thatmany households typically do not consider as income and are not collected in the SCF. Examplesinclude fringe benefits (e.g., employer-provided health insurance and employer pension contri-butions) and government-provided health care (Medicare and Medicaid). Removing these pay-ments from NIPA income reduces the aggregate income estimate by about 8 percent in 2012.9
Measurement differences still remain even after these conceptual adjustments to the macroand micro data sources. For example, aggregated total net worth in the SCF is approximately 125percent of the adjusted FA net worth measure in 2010, primarily because reported house valuesrose faster in the SCF than in the FA during the housing boom leading up the Great Recession.
TRENDS IN AGGREGATE MEASURES OF HOUSEHOLD BALANCESHEETS
The conceptual adjustments made to FA wealth and NIPA income concepts do not affectsome now very well-known stories about trends in household sector net worth over the past fewdecades. Household sector net worth has experienced two distinct boom and bust periods since1995 (Figure 1). The first boom and bust was largely associated with the 1990s’ stock market bub-ble, while the second involved run-ups and steep drops in both the stock market and housingvalues in the 2000s. Because the second period involved housing, it affected a much broaderswath of families, and the unprecedented widespread drop in housing values was a key contrib-utor to the Great Recession. Household sector net worth has rebounded somewhat since thetrough reached in early 2009, as both stock prices and housing prices have (at least partially)recovered.
One legacy of the housing boom is an elevated level of household debt. In the aggregate data,the overall ratio of household debt to disposable income was steady at just under 100 percentbetween 1995 through 2001 before surging to nearly 150 percent by 2010 (Figure 2). Althoughmortgage debt and other types of consumer debt (vehicle loans, credit cards, education debt,other consumer loans) all increased in the years preceding the Great Recession, mortgage debtaccounted for about 90 percent of the total household debt increase between 2001 and 2010. Thelevels of mortgage debt have since fallen (and incomes have since risen), but the large run-up inthe aggregate D/I ratio is far from gone. As of 2012:Q3, aggregate household sector debt remainedat about 125 percent of aggregate household sector disposable income.10
Figure 2 shows relatively high aggregate D/I ratios, but Figure 3 shows that the ratio of debtservice to income (also termed the debt service ratio) has fallen as interest rates have fallen.11
Trends in housing debt and housing values together generate one of the most widely dis-cussed statistics used to characterize the current state of U.S. household aggregate balance sheets,the total LTV ratio. As shown in Figure 4, the aggregate housing LTV ratio changed little duringthe decade preceding the Great Recession; the ratio hovered around 40 percent as the year-after-
Krimmel, Moore, Sabelhaus, Smith
340 September/October 2013 Federal Reserve Bank of St. Louis REVIEW

Krimmel, Moore, Sabelhaus, Smith
Federal Reserve Bank of St. Louis REVIEW September/October 2013 341
400
500
600
700
1995 1996 1997 1998 1999 2000 2001 2002 2003 2004 2005 2006 2007 2008 2009 2010 2011 2012
Percent
Figure 1
Household Net Worth-to-Household Disposable Income Ratio
SOURCE: FA and NIPA.
0
90
100
110
120
130
140
150
160
Percent
1995 1996 1997 1998 1999 2000 2001 2002 2003 2004 2005 2006 2007 2008 2009 2010 2011 2012
Figure 2
Aggregate Household Debt-to-Household Disposable Income Ratio
SOURCE: FA and NIPA.

Krimmel, Moore, Sabelhaus, Smith
342 September/October 2013 Federal Reserve Bank of St. Louis REVIEW
12
13
14
15
16
17
18
Percent
1995 1996 1997 1998 1999 2000 2001 2002 2003 2004 2005 2006 2007 2008 2009 2010 2011 2012
Figure 3
Aggregate Household Debt Service-to-Household Disposable Income Ratio
SOURCE: Federal Reserve Board and NIPA.
35
45
55
65
Percent
1995 1996 1997 1998 1999 2000 2001 2002 2003 2004 2005 2006 2007 2008 2009 2010 2011 2012
Figure 4
Aggregate Housing Debt-to-Housing Assets (LTV) Ratio
SOURCE: FA.

year surge in house values was matched by a surge in mortgage borrowing. When the collapsein house values began in 2006, the aggregate LTV jumped to over 60 percent, even as net mort-gage borrowing ground to a virtual halt.
Aggregate mortgage debt outstanding has fallen since 2007 as the result of a steep decline inpurchase originations, tighter credit standards, falling prices, and charge-offs. This decrease hashad a meaningful effect on aggregate LTV ratios, but the sharp drop in the ratio in 2012 as houseprices began to rise illustrates the importance of house values in determining the high-frequencymovements in the overall LTV ratio. While an aggregate LTV of 55 percent may not appear par-ticularly alarming—that is, the average homeowner may not be in a precarious position—we arealso interested in the distribution of LTVs, especially the incidence of very high LTVs. For this,we need micro data such as provided by the SCF.
AGING HOUSEHOLD BALANCE SHEETS FORWARD THROUGH TIMEHousehold-level data are critical for understanding heterogeneity in household balance
sheets and tracking metrics such as the share of households with high LTV or debt service-to-income ratios. But as noted previously, the painstaking process of collecting reliable micro datameans that the SCF is available only every three years with a two-year lag between fielding thesurvey and releasing the data. In other words, the SCF is a critical tool but not a particularlytimely one. The goal of our project is to estimate a current sample of household balance sheetsby aging the most recent SCF micro data forward to the current quarter, household by house-hold. The aging process involves updating prices for equity holdings and house values, growingincomes, and using two alternative trajectories for household debt. There are no adjustmentsfor other new saving or borrowing.
The first step in our aging approach is updating each household’s asset valuations usingindexes for house prices and stock prices. Real estate values are adjusted proportionally usingCoreLogic Home Price indexes at the level of the Census Bureau’s Core Based Statistical Area(CBSA) that matches each household’s geographic location (see Appendix B). The geographicdetail available in the CBSA is quite extensive, with close to 1,000 distinct geographic areas rep-resented across the United States. Real estate values for unincorporated businesses are adjustedproportionally using the percent change in noncorporate equity asset revaluations in the FA.Finally, the values of corporate equities (both inside and outside retirement accounts) are grownproportionally with corporate equity values from the Dow Jones Total Stock Market Index.12
These adjustments to asset values are only estimates—in reality, each household will experienceits own unique change in asset values. However, the price indexes we apply should capture theaverage movement of asset values since the most recent SCF.
These asset price changes alone are sufficient to capture most of the movement in aggregatenet worth since 2010. Overall FA net worth (adjusted for SCF consistency as described) rose by13.9 percent between 2010 and 2012. Applying the housing, corporate equity, and noncorporateequity revaluations as described to the 2010 SCF raises the sample’s aggregate net worth by 11.0percent.
Krimmel, Moore, Sabelhaus, Smith
Federal Reserve Bank of St. Louis REVIEW September/October 2013 343

The second step in aging the 2010 SCF records is updating household incomes. We groweach household’s income proportionally with the growth in aggregate NIPA income, componentby component. For example, a 10 percent increase in aggregate wage income would be appliedto the wages of each SCF household with wage income in 2010. We grow each component ofincome separately—for example, Social Security and pension income are grown separately fromwages—to preserve the heterogeneity in income growth for households with different composi-tions of income. For example, younger households and those with more-moderate incomes aremore likely to receive most of their income from wages, while older families are more likely toreceive less-volatile Social Security and pension income. Again, this simple approach of assigningthe aggregate growth rate to each household produces only a rough estimate of each household’sactual income growth and could miss key correlations affecting particular population subgroups.For example, if the households that accrued the highest amounts of debt leading up to the GreatRecession were also the ones that experienced the slowest income growth since 2010, our agingprocedure might overstate the improvement in the financial situations of these households.13
The third step in aging each SCF record is updating household debt. At this stage, we havemodeled two alternative assumptions governing the evolution of household debt since 2010.Neither scenario is meant to be a realistic prediction of the actual evolution of household debt,but together they help frame the role of debt on household balance sheets.
The first debt scenario we apply assumes that families offset any principal paydown since2010 with new borrowing, so that overall (nominal) debt is held constant. In this scenario, thechanges in balance-sheet measures (e.g., the D/I ratio and the debt service-to-income ratio after2010) reflect only improvements in income, driven by the proportional growth using NIPA aggre-gates. Similarly, the evolution of ratios involving asset prices—in particular, housing LTVs—isdetermined only by the house value itself. Although very simplistic, this constant debt scenariodoes help illustrate how factors other than debt growth itself can generate improvement in keymeasures of household finances. In particular, the threshold-type statistics will show dispropor-tionate improvement if many families are just above the threshold in 2010, and thus even modestincome or house price growth is enough to bring them below the cutoff.
The second debt scenario uses the 2010 SCF’s very detailed information about the loan termsand payment behavior of each household to model the effect of principal paydown at the ratesobserved in 2010. That is, we project forward each household’s principal balances, assuming thehousehold continues to make the observed loan payments on schedule.14 An important featureof this scenario is that it assumes that households take on no new debt, which is of course notrealistic: Since 2010, many households have originated new mortgages, refinanced existing ones,or added new credit card, student loan, or auto debt. Nonetheless, this scenario offers a usefulinterpretation by measuring what would have happened to each household’s balance sheet if allthe new debt acquisition had occurred among other households.
If every SCF household had paid down its debt according to the 2010 terms and no newdebt was assumed, aggregate debt in the SCF would have fallen about 8 percent between 2010and 2012. In the FA, aggregate household sector debt fell about 2 percent over this period. Thus,the assumption of principal paydown with no new debt clearly overstates debt paydown in theaggregate. Interestingly, however, this “miss” appears to be entirely concentrated in consumer
Krimmel, Moore, Sabelhaus, Smith
344 September/October 2013 Federal Reserve Bank of St. Louis REVIEW
(that is, non-mortgage) debt. Mortgage debt, which is the lion’s share of household debt, fell about6.1 percent in the FA over this period, while consumer debt rose substantially. The FA does notdecompose consumer debt into its components, but other sources, such as credit bureau data,suggest that education debt rose more than 30 percent, vehicle debt rose about 17 percent, andother consumer installment debt rose about 2 percent.15
Applying the principal paydown scenario to mortgage debt in the SCF results in a 5.9 percentaggregate reduction in SCF mortgage debt—quite close to the 6.1 percent reduction observed inthe FA. This finding suggests that unmodeled mortgage-related transactions such as cash-inrefinancing, charge-offs, and net new mortgage debt acquisition cancel out in the aggregate overthis period. Indeed, since many households did not engage in these unmodeled transactions,the principal paydown scenario is likely a reasonably accurate forecast for many of the house-holds that stayed in their 2010 homes. On the other hand, this scenario clearly misses the rapidgrowth in consumer debt—especially education debt and auto lending—seen in the aggregatedata since 2010.
THE CURRENT STATE OF U.S. HOUSEHOLD BALANCE SHEETS In this section, we analyze the balance sheets of the aged SCF sample as of 2012:Q3, the most
recent quarter of FA and NIPA data at the time of our analysis. It is well known that the GreatRecession had a dramatic impact on household balance sheets, with direct effects from relativeprice shocks on homeowners and households that owned corporate equities and indirect effectsfor many households from unemployment and other income shocks (Bricker et al., 2012, andMian, Rao, and Sufi, 2011).16 The 2010 SCF provides a snapshot of household finances in theperiod immediately following the recession. The goal of creating an aged SCF is to gain somesense of balance-sheet evolution since 2010 so we can derive a more timely estimate of the typesof disaggregated statistics calculated from the SCF data.
The advantage of a very rich micro dataset such as the SCF is that it provides many interestingways to tabulate the data and gain additional perspective on trends in household finances. Thefocus of the micro analysis in this section is on the distribution of the same four measures ofhousehold balance-sheet positions previously considered using the aggregate statistics: net worth-to-income, overall D/I, debt service-to-income, and housing LTV ratios. Different approachescan be used to tabulate these measures with micro data. For example, means can be reported bygroup and thus can be used to compare and contrast outcomes for various population subsetsagainst the aggregate or other groups. Alternatively, the fraction of families for whom the statisticof interest exceeds some critical threshold can be reported (e.g., LTV > 95 percent). Both meansand threshold-type statistics might be important for predicting changes in economic behaviorover time.
The amount of data that can be generated by this sort of micro analysis quickly expands withthe introduction of a third dimension for tabulating outcomes, such as decomposition by house-hold type. In this analysis, we tabulate various outcomes by permanent (or “normal”) income,by age (<45, 45-64, and ≥65 years of age), and by geography (the four so-called sand states versusall others).17 With these parsimonious choices, we have (i) four measures of household financial
Krimmel, Moore, Sabelhaus, Smith
Federal Reserve Bank of St. Louis REVIEW September/October 2013 345
position, (ii) two possible outcome variables for each (means and share exceeding a thresholdvalue), and (iii) three ways of grouping households (by normal income, age, and geography) foreach of six historical SCF samples (triennially from 1995 to 2010) plus eight projection quartersrepresenting 2010:Q4 through 2012:Q3. In addition, we have the two alternative scenarios forprojecting debt balances. Because all these choices result in so much potential data output, werestrict our presentation to a few tables and figures that highlight some noteworthy aspects ofpre- and post-recession trends in household finances.
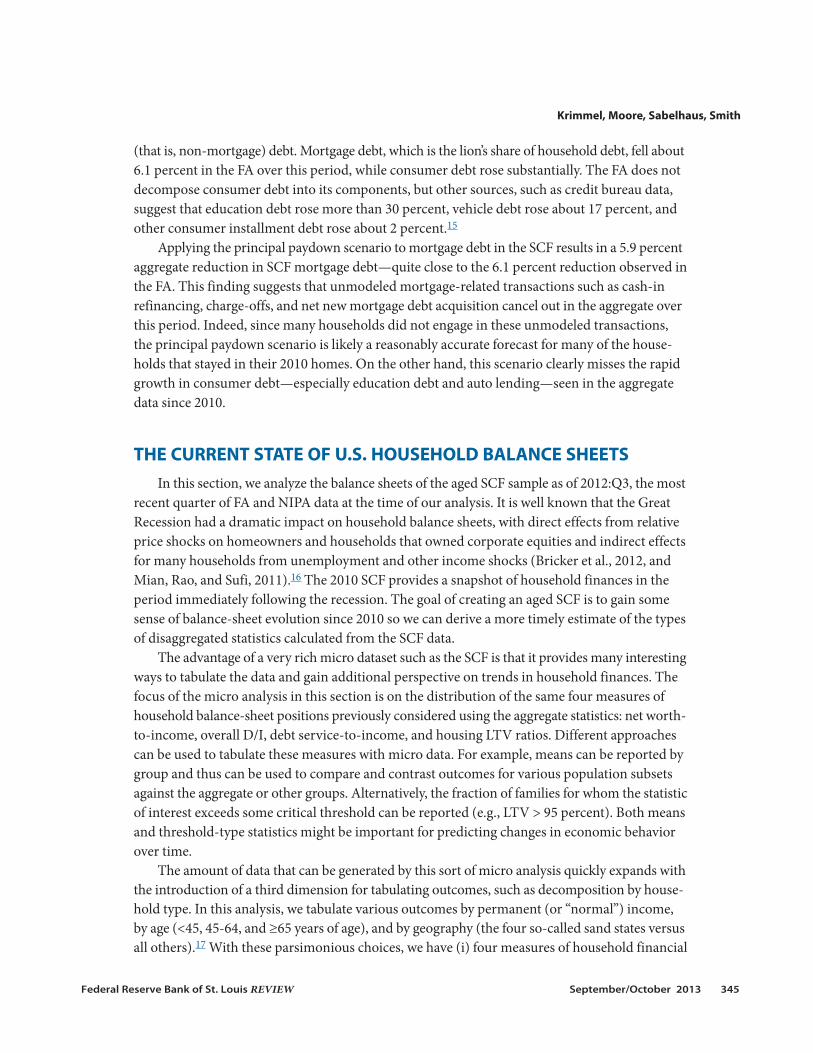
A natural starting point for analyzing household finances for the past few years is the dra-matic collapse in wealth between 2007 and 2010. As shown in Table 1, the overall decline inmean net worth was 15 percent and the decline was widespread across households grouped bynormal income. Every group experienced some decline, but proportionally the first, third, andfourth quintiles were somewhat harder hit. Note, however, that the top decile of households interms of normal income experienced a 13 percent real wealth decline between 2007 and 2010,which was roughly in line with the overall average decline.
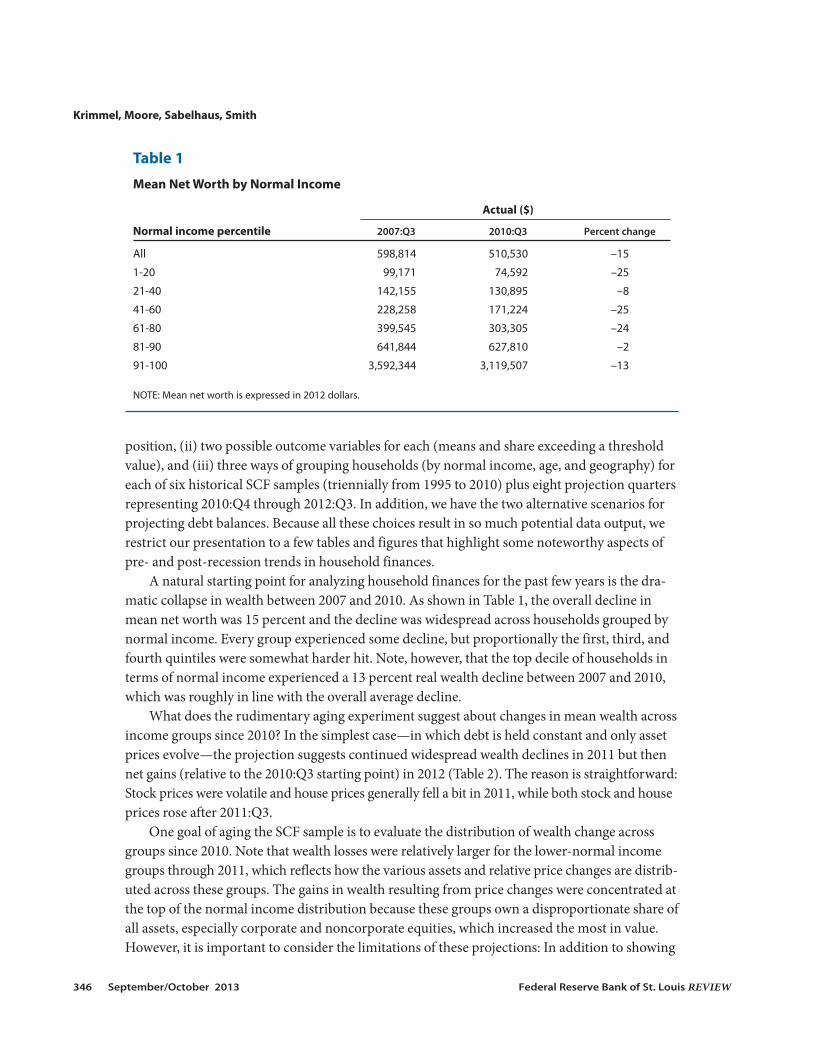
What does the rudimentary aging experiment suggest about changes in mean wealth acrossincome groups since 2010? In the simplest case—in which debt is held constant and only assetprices evolve—the projection suggests continued widespread wealth declines in 2011 but thennet gains (relative to the 2010:Q3 starting point) in 2012 (Table 2). The reason is straightforward:Stock prices were volatile and house prices generally fell a bit in 2011, while both stock and houseprices rose after 2011:Q3.
One goal of aging the SCF sample is to evaluate the distribution of wealth change acrossgroups since 2010. Note that wealth losses were relatively larger for the lower-normal incomegroups through 2011, which reflects how the various assets and relative price changes are distrib-uted across these groups. The gains in wealth resulting from price changes were concentrated atthe top of the normal income distribution because these groups own a disproportionate share ofall assets, especially corporate and noncorporate equities, which increased the most in value.However, it is important to consider the limitations of these projections: In addition to showing
Krimmel, Moore, Sabelhaus, Smith
346 September/October 2013 Federal Reserve Bank of St. Louis REVIEW
Table 1
Mean Net Worth by Normal Income
Actual ($)
Normal income percentile 2007:Q3 2010:Q3 Percent change
All 598,814 510,530 –15
1-20 99,171 74,592 –25
21-40 142,155 130,895 –8
41-60 228,258 171,224 –25
61-80 399,545 303,305 –24
81-90 641,844 627,810 –2
91-100 3,592,344 3,119,507 –13
NOTE: Mean net worth is expressed in 2012 dollars.
only the effects of price changes for these selected assets, there are real changes in other typesof assets and debt (for example, new saving and debt reduction) that are not captured in thesecalculations.
How different would these conclusions be under the principal paydown assumption scenariodescribed previously? As noted, if every household in the SCF paid down principal using their2010 loan terms without assuming any new debt, total household debt would have fallen about8 percent (in the FA, household sector debt fell 2 percent over this period). However, even the 8percent reduction in debt resulting from this thought experiment would have only a small effecton household net worth, pushing up the net increase in real net worth from 5 percent to 6 percentfor the 2010:Q3–2012:Q3 period (Table 3). Thus, even this sort of debt paydown scenario would
Krimmel, Moore, Sabelhaus, Smith
Federal Reserve Bank of St. Louis REVIEW September/October 2013 347
Table 3
Effect of Relative Prices and Debt Paydown on Mean Net Worth by Normal Income
Percent change Actual ($) Projected ($) from 2010:Q3 to
Normal income percentile 2010:Q3 2011:Q3 2012:Q3 2011:Q3 2012:Q3
All 510,530 495,831 544,897 –3 7
1-20 74,592 72,343 77,039 –3 3
21-40 130,895 126,570 134,550 –3 3
41-60 171,224 166,034 180,171 –3 5
61-80 303,305 294,290 321,394 –3 6
81-90 627,810 607,847 669,237 –3 7
91-100 3,119,507 3,033,951 3,355,620 –3 8
NOTE: Mean net worth is expressed in 2012 dollars.
Table 2
Effect of Relative Prices on Mean Net Worth by Normal Income
Percent change Actual ($) Projected ($) from 2010:Q3 to
Normal income percentile 2010:Q3 2011:Q3 2012:Q3 2011:Q3 2012:Q3
All 510,530 491,717 537,214 –4 5
1-20 74,592 71,421 75,394 –4 1
21-40 130,895 124,830 131,423 –5 0
41-60 171,224 163,052 174,688 –5 2
61-80 303,305 289,244 311,997 –5 3
81-90 627,810 600,420 655,394 –4 4
91-100 3,119,507 3,021,629 3,331,984 –3 7
NOTE: Mean net worth is expressed in 2012 dollars.

not fundamentally alter the distribution of wealth change across income groups. Lower-incomegroups would realize slightly more of the net gains in wealth since 2010 because debt is relativelymore important on their balance sheets. But the fundamental story from Table 2—that theimprovements since 2010 driven by asset price changes are concentrated at the top of the incomedistribution—would be unchanged even in the debt paydown scenario.
For the D/I ratio by age, income, or geographic group in the SCF, we calculate the ratio asthe average debt of the group relative to the average income of the group, rather than the averageof the group’s ratios.18 Figure 5 illustrates the trends in the D/I ratio by the normal-income groupin both the historical (triennial) SCF surveys (to the left of the vertical line) and in each projectedquarter (to the right of the line). The quarterly projection is shown for both the constant debtscenario and the principal paydown scenario. As Figure 5 shows, the run-up of the D/I ratiobetween 1995 and 2010 was widespread across normal-income groups; this ratio remains ele-vated for all groups through 2012:Q3 even under the principal paydown scenario. We find thatthe D/I ratio is highest for the middle normal-income group. Homeownership rates and thusmortgage debt rise with income; nonetheless, households at the top of the income distributiontend to have less debt relative to income than do middle-income households. These differencesby income hold at all points in time and the relative D/I ratios have changed little, which suggeststhat the growth of debt (relative to income) over the past decade was not concentrated in anyone part of the income distribution.
The same basic story about trends in debt relative to income holds across age groups. AsFigure 6 shows, D/I ratios are lower among older age brackets at every point in time. This is not
Krimmel, Moore, Sabelhaus, Smith
348 September/October 2013 Federal Reserve Bank of St. Louis REVIEW
0
50
100
150
200
1995:Q3 1998:Q3 2001:Q3 2004:Q3 2007:Q3 2010:Q3 2010:Q4 2011:Q1 2011:Q2 2011:Q3 2011:Q4 2012:Q1 2012:Q2 2012:Q3
Percent
Lowest QuintileMiddle QuintileHighest Quintile
Actual 1995 to 2010 Projected 2010:Q4 to 2012:Q3
Principal Constant at 2010 LevelsPrincipal Paid Down Using 2010 Loan Terms
Figure 5
Average Debt-to-Average Disposable Income Ratio (by Normal Income)

especially surprising because the typical life cycle pattern of borrowing for housing and otherinvestments exhibits higher borrowing at younger ages. However, as with income, the growth inthe D/I ratio from 1995 to 2010 can be seen across age groups and, in fact, is steepest in relativeterms for the 65-and-older age group. Even under the principal paydown scenario with no newdebt after 2010, there is no substantial reversal of the run-up in the D/I ratio from 1995 to 2010for any of the three age groups.
Next we examine the evolution of the debt service-to-income ratio, which is arguably evenmore important for measuring households’ financial stress from leverage. For this analysis, ratherthan focusing on the ratio itself, we measure the share of households with regular monthly pay-ments in excess of 40 percent of their disposable income. This threshold is arbitrary, but it isintended to indicate potentially risky levels of leverage.19 We find that this indicator of householdfinancial stress is highest in the middle of the normal-income distribution, at nearly 15 percentof households in 2010 (Figure 7). During the boom, this indicator spiked among the highestnormal-income households, while it fell back a bit among the lowest normal-income households.Unlike the previous figure, for this indicator we do find a significant decline after 2010 underthe principal paydown scenario, especially for middle-income households. Under the constantdebt scenario, however, we see little change after 2010.
Figure 8, which shows the debt service-to-income ratio by age, indicates that the share ofhouseholds with high debt service ratios is roughly similar for households younger than 45 yearsof age and those 45 to 64 years of age and significantly lower for those older than 65 years of age.Again, a significant decline in this indicator occurs after 2010 under the principal paydown sce-
Krimmel, Moore, Sabelhaus, Smith
Federal Reserve Bank of St. Louis REVIEW September/October 2013 349
0
50
100
150
200
1995:Q3 1998:Q3 2001:Q3 2004:Q3 2007:Q3 2010:Q3 2010:Q4 2011:Q1 2011:Q2 2011:Q3 2011:Q4 2012:Q1 2012:Q2 2012:Q3
Percent
Less Than 45 Years45 to 64 Years65 Years and Older
Actual 1995 to 2010 Projected 2010:Q4 to 2012:Q3
Principal Constant at 2010 LevelsPrincipal Paid Down Using 2010 Loan Terms
Figure 6
Average Debt-to-Average Disposable Income Ratio (by Age)

Krimmel, Moore, Sabelhaus, Smith
350 September/October 2013 Federal Reserve Bank of St. Louis REVIEW
0
5
10
15
20
1995:Q3 1998:Q3 2001:Q3 2004:Q3 2007:Q3 2010:Q3 2010:Q4 2011:Q1 2011:Q2 2011:Q3 2011:Q4 2012:Q1 2012:Q2 2012:Q3
Percent
Lowest QuintileMiddle QuintileHighest Quintile
Actual 1995 to 2010 Projected 2010:Q4 to 2012:Q3
Principal Constant at 2010 LevelsPrincipal Paid Down Using 2010 Loan Terms
Figure 7
Families for Whom Debt Service-to-Disposable Income Ratio Exceeds 40 Percent (by NormalIncome)
0
5
10
15
20
1995:Q3 1998:Q3 2001:Q3 2004:Q3 2007:Q3 2010:Q3 2010:Q4 2011:Q1 2011:Q2 2011:Q3 2011:Q4 2012:Q1 2012:Q2 2012:Q3
Percent
Less Than 45 Years45 to 64 Years65 Years and Older
Actual 1995 to 2010 Projected 2010:Q4 to 2012:Q3
Principal Constant at 2010 LevelsPrincipal Paid Down Using 2010 Loan Terms
Figure 8
Families for Whom Debt Service-to-Disposable Income Ratio Exceeds 40 Percent (by Age)
nario and there is little change under the constant debt scenario. This difference could be due inpart to the role of shorter-amortization loans such as car payments. Under the principal paydownscenario, such loans are being retired at a high rate, resulting in a dramatic drop in the share ofhouseholds with high debt service-to-income ratios.
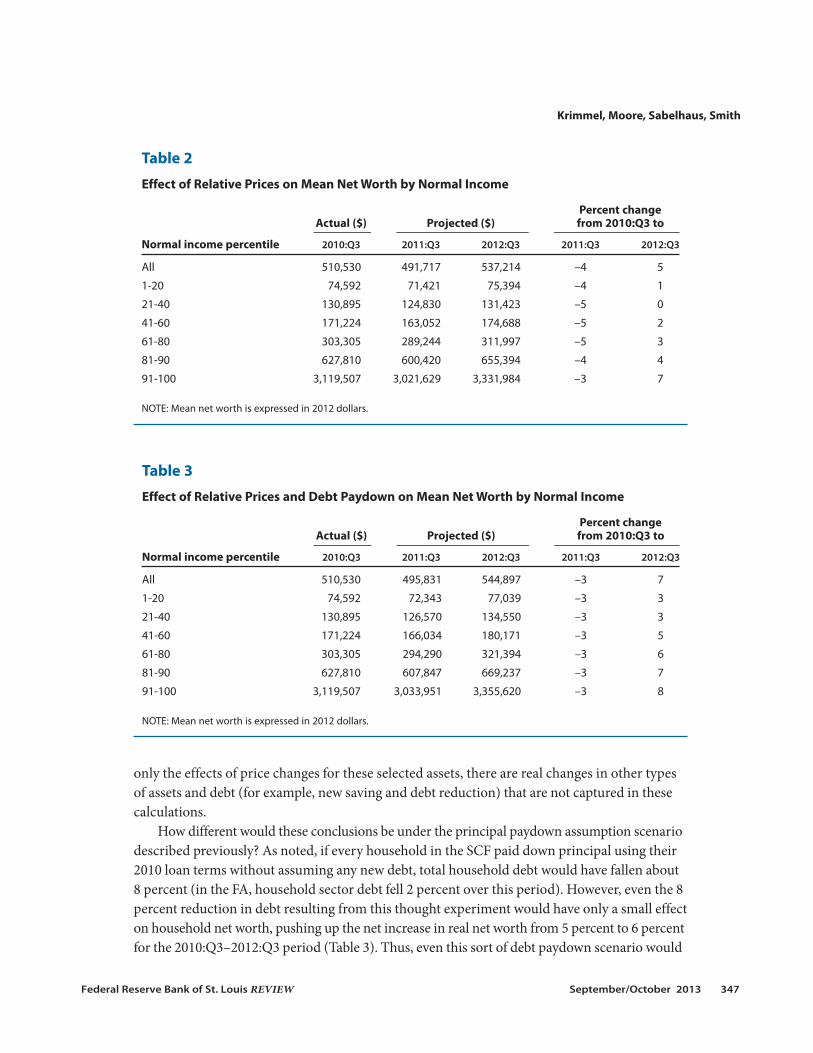
Figures 9 through 11 provide several perspectives on housing debt relative to housing values,or LTV. Again, we focus on an indicator of high LTV rather than the LTV itself since homeown-ers with high LTVs are often of particular interest with regard to financial stability (for example,they are most likely to default on their mortgages). In this analysis, we define “high-LTV” as amortgage balance in excess of 95 percent of the household’s reported market value of their home.20
As Figure 9 shows, the fraction of mortgage-holding households with high LTVs jumpeddramatically in 2010 for all normal-income groups but especially for the middle-income group,for whom it surpassed 20 percent. Since then, this indicator has trended down for all groups in2012 as house prices have risen. Comparing the two debt paydown scenarios after 2010, there islittle change under the constant debt scenario and a more significant decline under the principalpaydown scenario—especially for the lower-income households—though the indicator remainselevated relative to 2007. Recall that, in contrast to consumer debt, mortgage debt under ourprincipal paydown scenario tracks observed changes in aggregate mortgage debt in the FA quiteclosely, so in this case we believe that the patterns shown here for the principal paydown scenariomay be a reasonable estimate of actual developments after 2010.
Figure 10 shows the trends in the high-LTV indicator by age, with an even sharper patternthan the pattern for normal income. Again, there was a spike in the high-LTV indicator between
Krimmel, Moore, Sabelhaus, Smith
Federal Reserve Bank of St. Louis REVIEW September/October 2013 351
0
10
20
30
40
1995:Q3 1998:Q3 2001:Q3 2004:Q3 2007:Q3 2010:Q3 2010:Q4 2011:Q1 2011:Q2 2011:Q3 2011:Q4 2012:Q1 2012:Q2 2012:Q3
Percent
Actual 1995 to 2010 Projected 2010:Q4 to 2012:Q3
Principal Constant at 2010 LevelsPrincipal Paid Down Using 2010 Loan Terms
Lowest QuintileMiddle QuintileHighest Quintile
Figure 9
Families with Mortgages for Whom Housing LTV Exceeds 95 Percent (by Normal Income)

Krimmel, Moore, Sabelhaus, Smith
352 September/October 2013 Federal Reserve Bank of St. Louis REVIEW
0
10
20
30
40
1995:Q3 1998:Q3 2001:Q3 2004:Q3 2007:Q3 2010:Q3 2010:Q4 2011:Q1 2011:Q2 2011:Q3 2011:Q4 2012:Q1 2012:Q2 2012:Q3
Percent
Actual 1995 to 2010 Projected 2010:Q4 to 2012:Q3
Principal Constant at 2010 LevelsPrincipal Paid Down Using 2010 Loan Terms
Less Than 45 Years45 to 64 Years65 Years and Older
Figure 10
Families with Mortgages for Whom Housing LTV Exceeds 95 Percent (by Age)
0
10
20
30
40
1995:Q3 1998:Q3 2001:Q3 2004:Q3 2007:Q3 2010:Q3 2010:Q4 2011:Q1 2011:Q2 2011:Q3 2011:Q4 2012:Q1 2012:Q2 2012:Q3
Percent
Sand StatesNon-Sand States
Actual 1995 to 2010 Projected 2010:Q4 to 2012:Q3
Principal Constant at 2010 LevelsPrincipal Paid Down Using 2010 Loan Terms
Figure 11
Families with Mortgages for Whom Housing LTV Exceeds 95 Percent (by Geography)

2007 and 2010 for all three groups, but by far the largest spike occurred in the youngest age group,which includes many first-time homebuyers who were more likely to buy near the peak of thehousing market. For this age group, the high-LTV indicator reached nearly 30 percent in 2010,while among households over 65 years of age, it never exceeded 10 percent. Again, there was adownward trend for all ages in 2012 as house prices rose and a more significant reduction underthe principal paydown scenario, especially for the youngest age group.
Finally, we show the evolution of the high-LTV indicator by geography, splitting the sampleinto the “sand states”—Florida, Arizona, Nevada, and California—versus the other states to illus-trate the larger boom-and-bust cycle in the sand states. As Figure 11 shows, households in thesand states experienced a much larger spike in the high-LTV indicator in 2010 than did house-holds in other states, although the spike was by no means limited to only the sand states. Sand-state households also experienced a much larger decline in this indicator in 2012, especiallyunder the principal paydown scenario.
CONCLUSIONIn this exercise, we used aggregate information from the FA and other macro data sources
to attempt to estimate a “current SCF” by projecting forward each household in the 2010 SCFsurvey. Our simple exercise produced some key insights about the extent to which changes inhousehold finances after 2010 reversed some of the trends both before and throughout the GreatRecession. For example, real wealth losses between 2007 and 2010 were widespread across ageand income groups and continued through 2011 before asset prices began to recover. Equityprices began to rise in late 2011 and real estate prices began to follow in early 2012. However, thegains were not equal across groups, particularly by income, because the real wealth gains attrib-utable to house and equity prices after 2010 were concentrated at the top of the distribution.
In addition to rising asset prices, steadily rising incomes have improved key householdfinancial ratios such as the D/I ratio since 2010, though the effect has not been large enough toreverse the sharp run-up in these ratios over the past decade. We find that (i) the increase indebt was widespread across all the age and income groups considered and (ii) D/I ratios remainhigh through 2012 even under the assumption that households continued to pay down debt onterms observed in 2010 and have assumed no new debt since then. For the share of householdswith debt service-to-income ratios above 40 percent, however, we find a fairly significant drop-off would occur in the fraction of households above this threshold under the assumption ofcontinued debt paydown since 2010 with no new debt. However, other sources indicate thatconsumer debt—especially education and auto loans—has grown sharply after 2010.
One oft-cited statistic on household finances is the dramatic increase in housing LTVs thatoccurred in the post-2006 housing market collapse. The share of households with self-reportedLTVs over 95 percent rose from about just under 7 percent in 2007 to nearly 20 percent in 2010.This spike in the incidence of high LTVs was widespread across age and income groups and wasobserved in both the so-called sand states and other states (though the spike was much larger inthe sand states). Again, we find there would be a fairly significant reduction in the share of house-holds with high LTVs under the assumption of continued debt paydown since 2010 with no new
Krimmel, Moore, Sabelhaus, Smith
Federal Reserve Bank of St. Louis REVIEW September/October 2013 353
Krimmel, Moore, Sabelhaus, Smith
354 September/October 2013 Federal Reserve Bank of St. Louis REVIEW
debt. Unlike the case for consumer debt, for housing debt this assumption might be closer tothe truth as originations of mortgages for purchases remain very low by historical standards.Despite the possible drop-off since 2010, however, we find that even under the principal paydownscenario, the share of households with high LTVs remains elevated relative to 2007.
APPENDIXESAppendix A: Reconciling SCF Data with Aggregate Published Income and WealthMeasures
The concept of personal income in the National Income and Product Accounts (NIPA)includes imputed incomes for which no comparable cash flow measure exists, as well as unmea-sured or poorly measured (at the household level) income sources, such as fringe benefits andin-kind transfers. The concept of net worth in the FA includes assets and liabilities of nonprofitorganizations, as well as holdings through institutional arrangements such as defined benefitpensions, that are not adequately measured at the household level. This appendix describes theadjustments to aggregate income and wealth measures aimed at achieving improved conceptualconsistency with the SCF.
The NIPA concept of personal income is decomposed into source components in its Table 2.1.Personal income is the broadest measure of income received by the household sector. To bettercompare the NIPA income measure with the SCF income measure, we exclude supplements towages and salaries (line 6), Medicare and Medicaid transfers (lines 19 and 20), and other currenttransfers from business (net) (line 24). These exclusions reduce personal income by about 8 per-cent in 2012. On the SCF side, we begin with the standard Federal Reserve Bulletin income vari-able, which is the family’s reported total income for the year preceding the survey. However,we replace that measure with the sum of the reported income components (wages and salaries,business income, interest, dividends, capital gains, transfers, retirement income) in cases wherethe sum of the components exceeds the reported total. Several conceptual issues remain to beaddressed to completely reconcile incomes: The NIPA measure includes items not reported inthe SCF, such as imputed rent on owner-occupied housing and interest and dividends paid indi-rectly to households (mostly pensions), while the SCF income measure includes items not inthe NIPA concept, such as withdrawals from pension plans. On net, the discrepancies roughlycancel out and the SCF measure is close to 90 percent of the adjusted NIPA measure.
The FA net worth measure reported in its Table B.100 diverges conceptually from the SCFmeasure in two broad ways. First, the FA household sector includes nonprofit institutions. Themost prominent impact of nonprofits occurs through their holdings of real estate (line 5) andplant and equipment (line 6). Removing these assets lowers FA household sector net worth byabout 4 percent in 2012. The second (and larger) set of adjustments to FA household sector networth relates to assets held on behalf of households by other institutions, particularly definedbenefit pension funds and life insurance companies. The combined holdings of private sectordefined benefit pensions (Table L.116.b), federal employee pension assets (other than the ThriftSavings Plan) (Table L.118, line 7), and state and local employee pension assets (Table L.117)

account for about two-thirds of pension assets on Table B.100 (line 28), but these are not measuredat the household level in the SCF and excluding them lowers net worth by almost 15 percent.Similarly, holdings of life insurance companies are excluded because these assets are mostly policyreserves (that is, not whole life). Excluding life insurance (Table B.100, line 27) reduces net worthby approximately 2 percent. Finally, a number of asset and liability categories (Table B.100, lines26, 30, and 35-41) are either associated with nonprofits or are not well measured at the householdlevel; these basically net out and reduce reported net worth by less than 1 percent. Together, alladjustments for SCF consistency reduce FA net worth by just over 21 percent in 2012.
Appendix B: Geographic Locators for Assigning House Price Changes
One of the crucial building blocks for aging the SCF micro sample forward through time isassigning local area house price changes to individual observations. This appendix explains howspecific price indexes were used to project changes in house prices.
Each observation in the SCF includes a numeric geographic locator variable derived fromthat household’s CBSA. If the CBSA could not be identified or matched to a corresponding localhousing price index, we use the household’s state of residence as a geographic identifier. Accordingto the Census Bureau, “the term Core Based Statistical Area (CBSA) is a collective term for bothmetro and micro areas. A metro area contains a core urban area of 50,000 or more population,and a micro area contains an urban core of at least 10,000 (but less than 50,000) population.Each metro or micro area consists of one or more counties and includes the counties containingthe core urban area, as well as any adjacent counties that have a high degree of social and eco-nomic integration (as measured by commuting to work) with the urban core.”21 Current CBSAdelineations were last revised in September 2010; new delineations based on the 2010 Office ofManagement and Budget (OMB) standards22 will be released by the OMB in 2013. There are960 distinct CBSAs under current definitions.
The process of mapping households to unique geographic locators unfolded over severalsteps. We first assigned SCF households to their corresponding CBSA by using the Departmentof Housing and Urban Development’s zip code-to-CBSA crosswalk.23 Of the 142,460 observa-tions between the 1995 and 2010 surveys, 134,800 (94.6 percent) mapped to a CBSA that couldbe matched to a location represented in CoreLogic’s CBSA-level home price index (HPI). Overtwo-thirds (5,270) of the 7,660 observations that could not be matched to CoreLogic’s HPI werelocated in zip codes not located within a CBSA (i.e., rural). The remaining 2,390 observations(less than 1.7 percent of the SCF sample between 1995 and 2010) were located within a CBSAnot sampled by CoreLogic. Such a proportion is consistent with the coverage of CoreLogic’s HPI,which represents about 98.5 percent of U.S. zip codes. The 7,660 observations that could not bematched to CoreLogic’s CBSA data were therefore assigned their corresponding state-levelCoreLogic HPI.
Appendix C: Details about Loans, Loan Terms, and Debt Service in the SCF
The SCF collects data on 13 categories of loans that, in principle, can be used to measurehousehold debt service. These categories include loans on cars and trucks for personal use, otherowned vehicle loans, education loans, other consumer loans, home improvement loans, primary
Krimmel, Moore, Sabelhaus, Smith
Federal Reserve Bank of St. Louis REVIEW September/October 2013 355

mortgages, other residential real estate loans, loans against land contracts given by the respondenthousehold, margin loans, loans against life insurance policies, pension loans, credit cards, andlines of credit. In this article, we map the various types of loans into the five household debt cate-gories that are reconciled with the FA and other aggregate data sources and tracked as part ofhousehold net worth. These categories are mortgages, education loans, credit cards, vehicle loans,and other consumer loans. To maintain consistency between loans and (gross versus net) debtbalances, we exclude loans on land contracts, margin loans, life insurance loans, and pensionloans from the following discussion.
Each loan in the SCF is identified in two ways: by type and by purpose. Loan type describeswhere the loan is recorded in the SCF and differentiates, for example, a household’s first consumerloan from its second consumer loan. The 42 loan types can be assigned to up to one of eight pur-poses: vehicle, education, other consumer loans, home improvement, other residential, principalresidence, credit card, and other lines of credit. Loan type and loan purpose are then used to placea loan into one of the five debt classifications. This dual identification strategy helps identify (i)how the household thinks about the loan in terms of type and (ii) the underlying good or servicefinanced by the loan. In short, recording the loan type allows us to map it back to the SCF itself.Categorizing loans by their purpose allows proper aggregation of debt on the balance sheet.
The SCF has up to 17 distinct pieces of information on any given loan: the loan type andloan purpose as mentioned above plus payment amount, whether the loan is currently in paystatus (not deferred), whether the loan is on schedule, origination month, origination year, termof the loan, expected month of payoff, expected year of payoff, month when payments will begin,year when payments will begin, original amount, reported amount still owed, interest rate, creditlimit, and whether the loan is secured by home equity. Different loans have different combina-tions of the 17 variables under various circumstances, but together they make it possible to esti-mate the amount of principal currently being paid on any given type of loan, which is the keyinput to the debt paydown scenario.
Our analysis accounts for 431,892 loans across the 142,460 families in the 1995-2010 SCFsamples. Each family has a (weighted) average of 2.85 loans (3.03 unweighted); some 19,308(15,437 unweighted) households have no loans. Among the households with at least one loan,the average number of loans per household is 3.29 (3.40 unweighted). In terms of mapping loansinto debt categories, 22 percent are mortgages, 6 percent are for education, 54 percent are creditcards, 12 percent are vehicle loans, and 6 percent are other consumer loans.
Krimmel, Moore, Sabelhaus, Smith
356 September/October 2013 Federal Reserve Bank of St. Louis REVIEW

NOTES1 See, for example, Moore and Palumbo (2010).
2 See, for example, De Nardi, French, and Benson (2012) and Petev, Pistaferri, and Eksten (2011).
3 Before 2013, this dataset was known as the Flow of Funds Accounts.
4 The FA data are available for download at http://www.federalreserve.gov/releases/z1. Results of the most recent SCFare discussed in Bricker et al. (2012). SCF micro data are available for download or online tabulation and analysis athttp://www.federalreserve.gov/econresdata/scf/scfindex.htm.
5 See Henriques and Hsu (2013) for a more comprehensive discussion of reconciling SCF and FA net worth measures.
6 See Appendix A for more details.
7 The same logic can be applied to other promises of future payment to households, such as Social Security benefitsor Medicare. These promises are not included in the FA concept of household wealth, in part because they are notbacked by marketable financial assets.
8 See Love, Smith, and McNair (2008) for a calculation of the value of households’ claims on pension and life insuranceproviders using the Health and Retirement Survey sponsored by the National Institute on Aging.
9 One important area for future work is further reconciliation of SCF and NIPA incomes, especially with respect toimputed income on owner-occupied housing and pension flows. See Appendix A for details.
10 For a more comprehensive discussion of recent trends and current levels of household debt, see Brown et al. (2011).
11 These debt service ratios are available on the website of the Board of Governors of the Federal Reserve System(http://www.federalreserve.gov/releases/housedebt/); see Dynan, Johnson, and Pence (2003) for details. In computingthis ratio, we adjust the definition of income in the denominator to be consistent with the SCF definition, as describedpreviously. Note that this ratio can also fall because of lengthening average amortization periods—for example, ifthere is a compositional shift toward longer-term loans.
12 As noted, at this stage we are not accounting for any new saving flows.
13 A more realistic simulation methodology could bring to bear the insights and data used in studies of permanent andtransitory income changes over time. See, in particular, Carroll (1992); DeBacker et al. (2011); Guvenen, Ozkan, andSong (2012); and Sabelhaus and Song (2009, 2010). Ackerman and Sabelhaus (2012) show how the difference betweenthe actual and “normal” income measures in the SCF relates to the traditional distinction between transitory and per-manent income shocks.
14 The SCF has information on up to 42 distinct loans across several different types of debt, of which most are installment-type loans, for which typical or scheduled payments, interest rate, term, and origination are known. Some loans—most notably education loans—have additional information about payment behavior, in particular, whether theloan is currently in deferral. See Appendix C for details.
15 Authors’ calculations, using Equifax aggregates calibrated so total non-mortgage consumer debt matches the non-mortgage consumer debt totals in the FA.
16 For a more dynamic perspective on the effects of the Great Recession on household finances, see Bricker et al. (2011).Also, Moore and Palumbo (2010) compare and contrast the distribution of household finances across the three eco-nomic downturns since the current version of the SCF was initiated in 1989.
17 The concept of “normal” income in the SCF is conceptually and empirically close to the concept of “permanent”income that economists generally consider when they describe consumer behavior. The label “normal” stems from aquestion posed to SCF respondents; after they report their actual income, they are asked whether they consider thecurrent year a “normal” year. If respondents state it is not a normal year, they are asked to report a value for “normal”income. Actual and normal income are the same for most respondents. However, Ackerman and Sabelhaus (2012)show that the deviations from normal for the subset who report such deviations provide a relationship betweenactual and permanent income consistent with estimates of transitory shocks using panel income data.
18 This approach is used to minimize the influence of households with special circumstances that result in unusuallylarge or small ratios.
Krimmel, Moore, Sabelhaus, Smith
Federal Reserve Bank of St. Louis REVIEW September/October 2013 357

19 Recent regulations promulgated by the Consumer Financial Protection Bureau use a similarly defined threshold of43 percent in the context of regulating “qualified mortgages” (seehttp://files.consumerfinance.gov/f/201308_cfpb_atr-qm-implementation-guide_final.pdf).
20 Because this measure of LTV relies on homeowners’ self-reports on the market value of their home, it may differ some-what from other measures of LTV. For example, the 2010 SCF shows a spike in the share of homeowners reportingtheir home is worth exactly what they owe on it. Because our indicator is intended to identify a group of people whohave no real equity to lose by walking away, we include these homeowners in the high-LTV indicator.
21 See “Metropolitan and Micropolitan Statistical Areas Main” at http://www.census.gov/population/metro/.
22 See “Part IV: Office of Management and Budget 2010 Standards for Delineating Metropolitan and MicropolitanStatistical Areas; Notice.” Federal Register, June 28, 2010, 75(123);http://www.whitehouse.gov/sites/default/files/omb/assets/fedreg_2010/06282010_metro_standards-Complete.pdf.
23 See “HUD USPS ZIP Code Crosswalk Files” at http://www.huduser.org/portal/datasets/usps_crosswalk.html.
REFERENCESAckerman, Samuel and Sabelhaus, John. “The Effect of Self-Reported Transitory Income Shocks on Household
Spending.” Finance and Economics Discussion Series 2012-64, Board of Governors of the Federal Reserve System,August 2012; http://www.federalreserve.gov/pubs/feds/2012/201264/201264pap.pdf.
Bricker, Jesse; Bucks, Brian; Kennickell, Arthur; Mach, Traci and Moore, Kevin. “Surveying the Aftermath of the Storm:Changes in Family Finances from 2007 to 2009.” Finance and Economics Discussion Series 2011-17, Board ofGovernors of the Federal Reserve System, March 2011;http://www.federalreserve.gov/pubs/feds/2011/201117/201117pap.pdf.
Bricker, Jesse; Kennickell, Arthur B.; Moore, Kevin B. and Sabelhaus, John. “Changes in U.S. Family Finances from 2007to 2010: Evidence from the Survey of Consumer Finances.” Federal Reserve Bulletin, June 2012, 98(2), pp. 1-80;http://www.federalreserve.gov/Pubs/Bulletin/2012/PDF/scf12.pdf.
Brown, Meta; Haughwout, Andrew; Lee, Donghoon and van der Klaauw, Wilbert. “Do We Know What We Owe? AComparison of Borrower- and Lender-Reported Consumer Debt.” Federal Reserve Bank of New York Staff ReportNo. 523, October 2011; http://www.newyorkfed.org/research/staff_reports/sr523.pdf.
Carroll, Christopher D. “The Buffer-Stock Theory of Saving: Some Macroeconomic Evidence.” Brookings Papers onEconomic Activity, 1992, 23(2), pp. 61-156.
DeBacker, Jason; Heim, Bradley; Panousi, Vasia and Vidangos, Ivan. “Rising Inequality: Transitory or Permanent? NewEvidence from a U.S. Panel of Household Income 1987-2006.” Finance and Economics Discussion Series 2011-60,Board of Governors of the Federal Reserve System, December 15, 2011;http://www.federalreserve.gov/pubs/feds/2011/201160/201160pap.pdf.
De Nardi, Mariacristina; French, Eric and Benson, David. “Consumption and the Great Recession.” Federal Reserve Bankof Chicago Economic Perspectives, First Quarter 2012, 36(1), pp. 1-16; http://www.chicagofed.org/digital_assets/publications/economic_perspectives/2012/1Q2012_part1_denardi_french_benson.pdf.
Dynan, Karen E.; Johnson, Kathleen and Pence, Karen. “Recent Changes to a Measure of U.S. Household Debt Service.”Federal Reserve Bulletin, October 2003, 89(10), pp. 417-26; http://www.federalreserve.gov/pubs/bulletin/2003/1003lead.pdf.
Guvenen, Fatih; Ozkan, Serdar and Song, Jae. NBER Working Paper No. 18035, National Bureau of Economic Research,May 2012, revised June 2012; http://www.nber.org/papers/w18035.pdf?new_window=1.
Henriques, Alice M. and Hsu, Joanne W. “Analysis of Wealth Using Micro and Macro Data: A Comparison of the Surveyof Consumer Finances and Flow of Funds Accounts.” Finance and Economics Discussion Series 2013-46, Board ofGovernors of the Federal Reserve System, May 10, 2013;http://www.federalreserve.gov/pubs/feds/2013/201346/201346pap.pdf.
Love, David A.; Smith, Paul A. and McNair, Lucy A. “A New Look at the Wealth Adequacy of Older U.S. Households.”Review of Income and Wealth, December 2008, 54(4), pp. 616-42.
Krimmel, Moore, Sabelhaus, Smith
358 September/October 2013 Federal Reserve Bank of St. Louis REVIEW

Mian, Atif; Rao, Kamalesh and Sufi, Amir. “Household Balance Sheets, Consumption, and the Economic Slump.”Working paper, University of Chicago Booth School of Business, November 2011;http://faculty.chicagobooth.edu/amir.sufi/MianRaoSufi_EconomicSlump_Nov2011.pdf.
Moore, Kevin B. and Palumbo, Michael G. “The Finances of American Households in the Past Three Recessions:Evidence from the Survey of Consumer Finances.” Finance and Economics Discussion Series 2010-06, Board ofGovernors of the Federal Reserve System, 2010;http://www.federalreserve.gov/pubs/feds/2010/201006/201006pap.pdf.
Petev, Ivaylo; Pistaferri, Luigi and Eksten, Itay Saporta. “Consumption and the Great Recession: An Analysis of Trends,Perceptions, and Distributional Effects.” Working paper, Stanford University, August 2011;http://www.stanford.edu/~isaporta/cons_recess_August_2011.pdf.
Sabelhaus, John and Song, Jae. “Earnings Volatility across Groups and Time.” National Tax Journal, June 2009, 62(2), pp. 347-64.
Sabelhaus, John and Song, Jae. “The Great Moderation in Micro Labor Earnings.” Journal of Monetary Economics, May2010, 57(4), pp. 391-403.
Krimmel, Moore, Sabelhaus, Smith
Federal Reserve Bank of St. Louis REVIEW September/October 2013 359

360 September/October 2013 Federal Reserve Bank of St. Louis REVIEW