
Profits and Balance Sheet Developments at U.S. Commercial ...
37
Profits and Balance Sheet Developments at U.S. Commercial Banks in 2009 Seung Jung Lee and Jonathan D. Rose, of the Board’s Division of Monetary Affairs, prepared this article. Thomas C. Allard and Mary E. Chosak assisted in developing the database underlying much of the analysis. Michael Levere and Robert Kurtzman pro- vided research assistance. The U.S. commercial banking sector remained under significant pressure in 2009. Bank profitability was damped by the effects of the weak economy on asset quality and lending activity, with loan delinquency and charge-off rates rising to historical highs in many cases and banks’ balance sheets contracting. Reflect- ing the weak portfolios and low profitability that weighed on the sector as a whole, 120 smaller banks failed during the year, and the watch list of the Federal Deposit Insurance Corporation (FDIC) ex- panded to include about 700 institutions by year-end, the highest levels for both of these measures since the early 1990s. By contrast, the acute strains the largest banks faced in late 2008 abated over the first half of 2009, largely because of unprecedented interventions by the Treasury, the Federal Reserve, and the FDIC. Asset quality worsened for all major loan classes over 2009, but real estate loans backed by residential and by commercial properties remained at the center of banks’ credit quality problems. Conditions in the real estate sector generally stayed weak, especially in commercial markets. House prices continued declin- ing sharply in the first half of the year but were more stable in the second half. The stabilization of prices partly reflects stronger demand for housing that was likely spurred in part by low mortgage rates, which were fostered partly by the Federal Reserve’s pur- chases of agency debt and mortgage-backed securi- ties (MBS). A tax credit for first-time homebuyers also helped support housing demand. Still, with many households’ mortgage obligations exceeding the value of their houses, 1.4 million properties entered foreclo- sure over the year. Aggregate economic activity picked up in the second half of the year after several quarters of contraction, stimulated by monetary and fiscal expan- sions, increased foreign growth, and improvements in financial market conditions. However, as is typical in cyclical economic recoveries, the improvement in labor market conditions lagged the trends in eco- nomic activity, and the unemployment rate reached 10 percent at year-end before edging lower. The weakness in labor markets contributed to historically elevated delinquency and charge-off rates on con- sumer credit card loans. The deterioration in credit quality across all loan categories led to a further rise in already elevated rates of loss provisioning. Conse- quently, the profitability of the commercial banking industry was depressed, and return on assets (ROA) and return on equity (ROE) were both at their lowest annual levels since at least 1985 (figure 1). 1 Note: The data in this article cover insured domestic commercial banks and nondeposit trust companies (hereafter, banks). Except as otherwise indicated, the data are from the Consolidated Reports of Condition and Income (Call Report). The Call Report consists of two forms submitted by domestic banks to the Federal Financial Institu- tions Examination Council: FFIEC 031 (for those with domestic and foreign offices) and FFIEC 041 (for those with domestic offices only). The data thus consolidate information from foreign and domestic offices, and they have been adjusted to take account of mergers and the effects of push-down accounting. For additional information on the adjustments to the data, see the appendix in William B. English and William R. Nelson (1998), ‘‘Profits and Balance Sheet Developments at U.S. Commercial Banks in 1997,’’ Federal Reserve Bulletin, vol. 84 (June), p. 408. Size categories, based on assets at the start of each quarter, are as follows: the 10 largest banks, large banks (those ranked 11 through 100), medium-sized banks (those ranked 101 through 1,000), and small banks (those ranked 1,001 and higher). At the start of the fourth quarter of 2009, the approximate asset sizes of the banks in those groups were as follows: the 10 largest banks, more than $166 billion; large banks, $7.9 billion to $165 billion; medium-sized banks, $527.3 million to $7.9 billion; and small banks, less than $527.3 million. Data shown in this article may not match data published in earlier years because of revisions and corrections. The data reflect informa- tion available as of April 20, 2010, unless noted otherwise. In the tables, components may not sum to totals because of rounding. Appendix tables A.1.A through A.1.E report portfolio composition, interest rates, and income and expense items, all as a percentage of overall average net consolidated assets, for all banks and for banks in each of the four size categories. Appendix table A.2 reports income statement data for all banks. 1. It is worth emphasizing that the analysis in this article is based on Call Reports for commercial banks. For a commercial bank that is a subsidiary of a bank holding company or a financial holding company, the Call Report does not include the assets, liabilities, income, or expenses of the other subsidiaries of the larger organization. Thus, the A1 May 2010
Transcript of Profits and Balance Sheet Developments at U.S. Commercial ...

Profits and Balance Sheet Developmentsat U.S. Commercial Banks in 2009
Seung Jung Lee and Jonathan D. Rose, of the Board’s
Division of Monetary Affairs, prepared this article.
Thomas C. Allard and Mary E. Chosak assisted in
developing the database underlying much of the
analysis. Michael Levere and Robert Kurtzman pro-
vided research assistance.
The U.S. commercial banking sector remained undersignificant pressure in 2009. Bank profitability wasdamped by the effects of the weak economy on assetquality and lending activity, with loan delinquencyand charge-off rates rising to historical highs in manycases and banks’ balance sheets contracting. Reflect-ing the weak portfolios and low profitability thatweighed on the sector as a whole, 120 smaller banksfailed during the year, and the watch list of theFederal Deposit Insurance Corporation (FDIC) ex-panded to include about 700 institutions by year-end,the highest levels for both of these measures since theearly 1990s. By contrast, the acute strains the largest
banks faced in late 2008 abated over the first half of2009, largely because of unprecedented interventionsby the Treasury, the Federal Reserve, and the FDIC.
Asset quality worsened for all major loan classesover 2009, but real estate loans backed by residentialand by commercial properties remained at the centerof banks’ credit quality problems. Conditions in thereal estate sector generally stayed weak, especially incommercial markets. House prices continued declin-ing sharply in the first half of the year but were morestable in the second half. The stabilization of pricespartly reflects stronger demand for housing that waslikely spurred in part by low mortgage rates, whichwere fostered partly by the Federal Reserve’s pur-chases of agency debt and mortgage-backed securi-ties (MBS). A tax credit for first-time homebuyersalso helped support housing demand. Still, with manyhouseholds’ mortgage obligations exceeding the valueof their houses, 1.4 million properties entered foreclo-sure over the year.
Aggregate economic activity picked up in thesecond half of the year after several quarters ofcontraction, stimulated by monetary and fiscal expan-sions, increased foreign growth, and improvements infinancial market conditions. However, as is typical incyclical economic recoveries, the improvement inlabor market conditions lagged the trends in eco-nomic activity, and the unemployment rate reached10 percent at year-end before edging lower. Theweakness in labor markets contributed to historicallyelevated delinquency and charge-off rates on con-sumer credit card loans. The deterioration in creditquality across all loan categories led to a further risein already elevated rates of loss provisioning. Conse-quently, the profitability of the commercial bankingindustry was depressed, and return on assets (ROA)and return on equity (ROE) were both at their lowestannual levels since at least 1985 (figure 1).1
Note: The data in this article cover insured domestic commercialbanks and nondeposit trust companies (hereafter, banks). Except asotherwise indicated, the data are from the Consolidated Reports ofCondition and Income (Call Report). The Call Report consists of twoforms submitted by domestic banks to the Federal Financial Institu-tions Examination Council: FFIEC 031 (for those with domestic andforeign offices) and FFIEC 041 (for those with domestic offices only).The data thus consolidate information from foreign and domesticoffices, and they have been adjusted to take account of mergers and theeffects of push-down accounting. For additional information on theadjustments to the data, see the appendix in William B. English andWilliam R. Nelson (1998), ‘‘Profits and Balance Sheet Developmentsat U.S. Commercial Banks in 1997,’’ Federal Reserve Bulletin, vol. 84(June), p. 408. Size categories, based on assets at the start of eachquarter, are as follows: the 10 largest banks, large banks (those ranked11 through 100), medium-sized banks (those ranked 101 through1,000), and small banks (those ranked 1,001 and higher). At the start ofthe fourth quarter of 2009, the approximate asset sizes of the banks inthose groups were as follows: the 10 largest banks, more than$166 billion; large banks, $7.9 billion to $165 billion; medium-sizedbanks, $527.3 million to $7.9 billion; and small banks, less than$527.3 million.
Data shown in this article may not match data published in earlieryears because of revisions and corrections. The data reflect informa-tion available as of April 20, 2010, unless noted otherwise. In thetables, components may not sum to totals because of rounding.Appendix tables A.1.A through A.1.E report portfolio composition,interest rates, and income and expense items, all as a percentage ofoverall average net consolidated assets, for all banks and for banks ineach of the four size categories. Appendix table A.2 reports incomestatement data for all banks.
1. It is worth emphasizing that the analysis in this article is based onCall Reports for commercial banks. For a commercial bank that is asubsidiary of a bank holding company or a financial holding company,the Call Report does not include the assets, liabilities, income, orexpenses of the other subsidiaries of the larger organization. Thus, the
A1
May 2010

Profitability diverged between the largest bankinginstitutions and the rest of the industry, primarilyreflecting the ability of large banks to generate incomefrom specialized activities in which other banks donot generally participate. Indeed, large banks, takentogether, posted a small profit last year, as tradingrevenue rebounded to pre-crisis levels with the im-provements in capital markets and income from netservicing fees increased. Those revenues managed tooffset the pressures on earnings at these banks causedby the further deterioration in credit quality. In addi-tion, large banks experienced a substantial inflow ofcore deposits at very low interest rates, which im-proved their net interest margins. In contrast, profitsat small and medium-sized banks declined further,weighed down by higher loan losses that were notoffset by other forms of revenue.
The commercial banking sector deleveraged over2009 as banks raised capital and nominal assetsposted an annual decline for the first time since 1948.Loans outstanding declined—across all major loancategories, but especially in loans to businesses—consistent with reports of banks’ more stringent lend-ing posture and reduced demand for loans fromcreditworthy borrowers. Borrowers such as house-holds and small businesses with more limited accessto nonbank sources of credit were particularly affectedby the tight lending conditions.
Demand for bank loans was further held down bythe efforts of households and businesses to rebuildtheir balance sheets. Consumer spending stabilized in
the first half of the year and expanded thereafter,reflecting the improvement in financial market pricesand accommodative monetary and fiscal policies.However, households financed the increase in con-sumer outlays primarily out of disposable income. Onthe business side, commercial real estate (CRE) activ-ity contracted sharply. Businesses’ spending on equip-ment and software picked up in the second half of theyear, probably owing in part to improved conditionsin the bond market and some increase in sales pros-pects. Indeed, large reductions in corporate bondspreads spurred robust issuance of both investment-and speculative-grade bonds, and large firms report-edly paid down some bank loans with the proceeds ofsuch bond issues.
Throughout the year, the Federal Open MarketCommittee maintained a target range for the federalfunds rate of 0 to 1⁄4 percent to foster economicrecovery. The Federal Reserve extended through early2010 most of the special credit and liquidity programsthat it had established at the height of the crisis.However, as financial market functioning improvedover 2009, these facilities generally declined in size(figure 2), and on February 1, 2010, most expired.2
The Term Asset-Backed Securities Loan Facility,which was designed to increase credit availability andsupport economic activity by facilitating renewedissuance of consumer and business asset-backed secu-rities (ABS) at more-normal interest rate spreads,continued operating into 2010. Together, the supportprovided by all of these programs helped reducestrains in funding markets and bolster liquidity infinancial markets more broadly.
To provide support to mortgage lending and hous-ing markets and to improve overall conditions inprivate credit markets, the Federal Reserve announcedlarge-scale asset purchases of government-sponsoredenterprise (GSE) debt and agency MBS in late 2008.In March 2009, those programs were enlarged, andthe Federal Reserve also announced a program ofpurchases of Treasury securities. The Federal Reserveconcluded purchasing $1.25 trillion of agency MBSand about $175 billion of agency debt in March 2010,
profits of the commercial banks that are subsidiaries of a largerbanking organization may differ substantially from the profits of theconsolidated institution.
2. The following programs expired on February 1, 2010: Asset-Backed Commercial Paper Money Market Mutual Fund LiquidityFacility; Commercial Paper Funding Facility; Primary Dealer CreditFacility; Term Securities Lending Facility; Term Securities LendingFacility Options Program; and central bank liquidity swaps, includingdollar liquidity swap lines and foreign currency liquidity swap lines.The Money Market Investor Funding Facility separately expired onOctober 30, 2009. In March 2010, the Federal Reserve completed itsfinal planned auction of funds through the Term Auction Facility.
1. Bank profitability, 1985–2009
+
_0
.2
.4
.6
.8
1.0
1.2
1.4
1.6
1.8
Percent
Return on assets
Return on equity
+
_0
2
4
6
8
10
12
14
16
18
200920062003200019971994199119881985
Percent
NOTE: The data are annual. SOURCE: Here and in subsequent figures and tables except as noted,
Federal Financial Institutions Examination Council, Consolidated Reports ofCondition and Income (Call Report).
A2 Federal Reserve Bulletin h May 2010

in addition to the $300 billion of Treasury securitiesthat it purchased between March 2009 and October2009.
The Treasury provided a large amount of capital tobanking institutions under the Troubled Asset ReliefProgram (TARP), and a substantial volume of thatcapital was downstreamed by parent holding compa-nies to their commercial bank subsidiaries in the firsthalf of 2009. The Treasury injected capital intofinancial institutions primarily through the CapitalPurchase Program (CPP), under which it acquiredshares of preferred stock at the holding companylevel. In addition, the federal bank regulatory agen-cies, led by the Federal Reserve, successfully com-pleted the Supervisory Capital Assessment Program(SCAP), which induced several large U.S. bankingorganizations to raise capital in public equity mar-kets.3 Subsequently, a number of other larger banksalso raised capital in order to repay their CPP fundsand increase the share of common equity in their totalcapital. Meanwhile, aggregate regulatory capital ra-tios at the commercial bank level reached historicalhighs by the end of 2009.
The government programs to support and assessthe level of capital adequacy augmented the highlyaccommodative monetary and fiscal policies to help
improve investors’ outlook for the banking industry.The Dow Jones stock price index for banks reboundedsharply beginning in March 2009, as market partici-pants began to mark down the odds of a worsening ofthe financial crisis, especially after the completion ofthe SCAP. Indeed, bank stocks have significantlyoutperformed the broader S&P 500 index since thattime despite historically low profitability, though theyremain substantially below their pre-crisis levels (fig-ure 3, top panel). Reflecting the decrease in theperceived risks of failure for large banks after theconclusion of the SCAP, credit default swap spreadson banks’ subordinated debt came back to levels lastseen in the first half of 2008 (figure 3, bottom panel).
ASSETS
Severe and widespread economic weakness during2009 impaired the health of both lenders and borrow-ers and significantly reduced the supply of anddemand for bank loans. Consequently, the total assetsof all commercial banks contracted 31⁄2 percent in
3. For press releases and documents related to the SCAP, seewww.federalreserve.gov/bankinginforeg/scap.htm.
2. Target federal funds rate and usage of Federal Reserve lending facilities, 2002–10
Percent
+
_0
1
2
3
4
5
20102008200620042002
Billions of dollars
+
_0
300
600
900
1,200
1,500
Target federalfunds rate
Usage ofFederal Reservelending facilities
NOTE: The data are daily and extend through April 14, 2010. On December16, 2008, the Federal Open Market Committee established a target range forthe federal funds rate of 0 to ¼ percent. The black rectangle represents thisrange. Usage data are the sum of usage amounts for primary, secondary, andseasonal credit; Term Auction Facility; dollar liquidity swaps; Primary DealerCredit Facility; Commercial Paper Funding Facility; Asset-BackedCommercial Paper Money Market Mutual Fund Liquidity Facility; and TermAsset-Backed Securities Loan Facility.
SOURCE: For federal funds rate, Federal Reserve Board (www.federalreserve.gov/fomc/fundsrate.htm); for usage of lending facilities,Federal Reserve Board, Statistical Release H.4.1, “Factors Affecting ReserveBalances” (www.federalreserve.gov/releases/h41).
3. Indicators for the banking industry, 2001–10
100
150
200
250
300
350
400
450
500
20102008200620042002
Stock price indexes
Dow Jones bank index
S&P 500
March 2009=100
+
_0
40
80
120
160
200
240
280
20102008200620042002
Premium on credit default swaps on subordinateddebt at selected banking institutions
Basis points
NOTE: The stock price index data are monthly and extend through March2010. The credit default swap (CDS) data are weekly and extend throughApril 14, 2010; median spread of all available quotes.
SOURCE: For stock price indexes, Standard & Poor’s and Dow Jones; forpremium on CDS, Markit.
Profits and Balance Sheet Developments at U.S. Commercial Banks in 2009 A3

2009, the first annual contraction since 1948 (table 1and figure 4). However, the decline in banks’ assetslast year was even larger—about 51⁄4 percent—afteraccounting for the acquisition of several nonbanks bycommercial banks (see box ‘‘Adjustments to theBalance Sheet Data for Structure Activity in 2009’’).The share of industry assets in the top 100 banks fellslightly, the first annual decline since 1991 (see box‘‘Bank Failures and Measures of Banking Concentra-tion in 2009’’).
The decline in assets on banks’ books reflected inlarge part a fall in gross loans of about 5 percent, or7 percent when adjusted for structure activity. Rela-tive to 2008, on an adjusted basis, loan declines in2009 spread from closed-end residential real estateloans to all major loan classes, as the economiccontraction encompassed the consumer, business, and
4. Composition of assets at commercial banks, 2006–09
9,500
10,500
11,500
12,500
Billions of dollars
25
50
75
100
Percent
Other Loans
NOTE: Other assets consist of loans to banks, trading assets (excludingsecurities), and other assets not elsewhere classified.
2009200820072006
Total
Securities
Cash and equivalents
1. Change in balance sheet items, all U.S. banks, 2000−09
Percent
Item 2000 2001 2002 2003 2004 2005 2006 2007 2008 2009
Memo
Dec.2009
(billionsof
dollars)
Assets . . . . . . . . . . . . . . . . . . . . . . . . . . . . . . . . . . . . . . . . . . . . 8.76 5.11 7.19 7.18 10.78 7.73 12.36 10.81 10.22 –3.58 11,772Interest-earning assets. . . . . . . . . . . . . . . . . . . . . . . . . . . 8.66 3.96 7.53 7.27 11.29 7.97 12.45 10.11 8.31 –2.46 10,108
Loans and leases (net) . . . . . . . . . . . . . . . . . . . . . . . . 9.24 1.82 5.90 6.51 11.21 10.39 11.97 10.57 2.21 –5.96 6,221Commercial and industrial. . . . . . . . . . . . . . . . . . 8.54 –6.73 –7.41 –4.56 4.35 12.53 11.81 20.27 3.48 –18.42 1,149Real estate. . . . . . . . . . . . . . . . . . . . . . . . . . . . . . . . . 10.74 7.94 14.44 9.75 15.41 13.80 14.94 7.04 4.48 –.44 3,780
Booked in domestic offices. . . . . . . . . . . . . . . 11.02 8.02 14.85 9.66 15.09 13.93 15.05 6.77 4.75 –.42 3,719One- to four-family residential . . . . . . . . . 9.28 5.70 19.86 10.01 15.75 11.95 15.11 5.53 3.07 3.17 2,121Other real estate. . . . . . . . . . . . . . . . . . . . . . . 13.31 10.95 8.81 9.19 14.20 16.61 14.96 8.39 6.89 –4.82 1,597
Booked in foreign offices . . . . . . . . . . . . . . . . –1.62 3.97 –7.41 15.74 35.59 7.19 8.79 22.76 –9.28 –1.72 62Consumer . . . . . . . . . . . . . . . . . . . . . . . . . . . . . . . . . 8.04 4.16 6.55 9.31 10.16 2.30 6.19 11.67 4.23 –1.95 969Other loans and leases . . . . . . . . . . . . . . . . . . . . . 7.01 –2.02 –.03 8.31 3.57 –.18 3.17 13.01 –6.41 –7.32 537Loan loss reserves and unearned income . . . . 7.98 13.15 5.73 –3.41 –3.72 –5.55 1.69 27.98 75.28 35.73 214
Securities . . . . . . . . . . . . . . . . . . . . . . . . . . . . . . . . . . . . 6.36 7.22 16.20 9.44 10.58 2.40 11.53 4.54 –.53 21.24 2,646Investment account. . . . . . . . . . . . . . . . . . . . . . . . . 2.85 8.88 13.53 8.70 6.15 1.19 6.94 –4.42 10.07 26.66 2,177
U.S. Treasury . . . . . . . . . . . . . . . . . . . . . . . . . . . –32.72 –40.27 41.92 14.14 –15.87 –17.59 –19.30 –26.93 7.96 215.48 100U.S. government agency
and corporation obligations . . . . . . . . . 3.75 12.84 18.09 9.68 9.46 –1.83 4.71 –12.15 15.44 15.49 1,190Other . . . . . . . . . . . . . . . . . . . . . . . . . . . . . . . . . . . 13.39 12.18 2.72 5.98 3.02 10.12 13.78 10.75 2.66 35.05 887
Trading account. . . . . . . . . . . . . . . . . . . . . . . . . . . . 37.16 –3.72 36.12 14.01 36.81 7.96 31.32 35.98 –26.69 1.17 469Other . . . . . . . . . . . . . . . . . . . . . . . . . . . . . . . . . . . . . . . . 10.30 13.09 –2.93 6.76 14.25 5.81 19.31 22.35 73.68 –20.71 1,241
Noninterest-earning assets. . . . . . . . . . . . . . . . . . . . . . . 9.45 12.74 5.11 6.64 7.61 6.19 11.79 15.42 22.30 –9.89 1,664
Liabilities . . . . . . . . . . . . . . . . . . . . . . . . . . . . . . . . . . . . . . . . 8.59 4.45 7.13 7.24 9.56 7.74 12.10 10.79 11.27 –5.46 10,458Core deposits. . . . . . . . . . . . . . . . . . . . . . . . . . . . . . . . . . . 7.53 10.55 7.58 7.29 8.25 6.40 5.84 5.49 14.51 8.07 5,843
Transaction deposits . . . . . . . . . . . . . . . . . . . . . . . . . . –1.31 10.20 –5.12 2.82 3.20 –1.18 –4.28 –1.22 20.72 6.34 892Savings deposits (including MMDAs) . . . . . . . . . 12.51 20.68 18.46 13.71 11.72 6.93 5.53 3.34 9.98 17.78 3,879Small time deposits . . . . . . . . . . . . . . . . . . . . . . . . . . 7.20 –7.23 –4.92 –6.79 1.58 12.88 16.97 18.03 23.48 –15.88 1,072
Managed liabilities1. . . . . . . . . . . . . . . . . . . . . . . . . . . . . 8.79 –2.73 5.34 6.96 12.06 12.24 19.45 16.57 6.45 –16.61 4,038Large time deposits. . . . . . . . . . . . . . . . . . . . . . . . . . . 19.37 –3.65 5.05 1.42 21.86 22.88 15.94 1.90 4.56 –16.15 897Deposits booked in foreign offices. . . . . . . . . . . . . 7.84 –10.96 4.49 12.63 16.84 6.32 29.67 25.86 2.46 –.60 1,529Subordinated notes and debentures . . . . . . . . . . . . 13.98 9.56 –.59 5.08 10.49 11.41 22.60 16.83 4.60 –15.53 154Gross federal funds purchased and RPs. . . . . . . . 6.49 5.72 12.75 –8.70 8.40 15.62 9.47 7.06 5.76 –31.70 537Other managed liabilities . . . . . . . . . . . . . . . . . . . . . 1.80 –.28 .97 22.00 1.37 6.15 18.89 28.44 14.38 –27.25 921
Revaluation losses held in trading accounts . . . . . . 7.47 –17.06 33.44 14.03 –12.61 –17.86 6.89 42.66 88.60 –57.17 166Other . . . . . . . . . . . . . . . . . . . . . . . . . . . . . . . . . . . . . . . . . . 20.61 14.90 5.23 5.28 17.19 –1.60 22.33 3.21 –8.63 –3.31 410
Capital account . . . . . . . . . . . . . . . . . . . . . . . . . . . . . . . . . . . 10.65 12.29 7.84 6.61 23.14 7.59 14.69 10.94 .96 14.54 1,314
Memo
Commercial real estate loans2 . . . . . . . . . . . . . . . . . . . . . 12.16 13.10 6.82 8.99 13.93 16.87 14.91 9.21 6.74 –5.69 1,588Mortgage-backed securities . . . . . . . . . . . . . . . . . . . . . . . . 3.29 29.05 15.54 10.12 13.45 2.06 10.22 –1.24 11.37 11.54 1,192Federal Home Loan Bank advances . . . . . . . . . . . . . . . . n.a. n.a. 17.21 3.71 3.73 10.00 29.80 30.62 17.51 –24.87 402
Note: Data are from year-end to year-end and are as of March 23, 2010.1. Measured as the sum of large time deposits in domestic offices, deposits
booked in foreign offices, subordinated notes and debentures, federal fundspurchased and securities sold under repurchase agreements, Federal HomeLoan Bank advances, and other borrowed money.
2. Measured as the sum of construction and land development loans securedby real estate; real estate loans secured by nonfarm nonresidential properties or
by multifamily residential properties; and loans to finance commercial real es-tate, construction, and land development activities not secured by real estate.
n.a. Not available.MMDA Money market deposit account.RP Repurchase agreement.
A4 Federal Reserve Bulletin h May 2010

Adjustments to the Balance Sheet Data for Structure Activity in 2009
One consequence of the turmoil in financial markets overthe past two years has been a steady stream of acquisi-tions and reorganizations by major financial institutions.Several large thrift institutions that were acquired by bankholding companies in 2008 were consolidated into thecommercial bank subsidiaries of those institutions during2009, boosting assets on banks’ books.1 In addition tothese bank–nonbank structure events, a large credit cardbank completed balance sheet consolidation of its securi-tized assets in the fourth quarter of 2009 under the newaccounting requirements established by Statements of Fi-nancial Accounting Standards Nos. 166 and 167; similarevents will boost assets on many banks’ books in the firstquarter of 2010.
In general, the effects of these structure activities onbank balance sheet data do not reflect net asset creation orelimination. To better capture net asset changes, the datashown in table A have been adjusted to remove the effectson the data series that have resulted from these structureevents. The growth rates of selected balance sheet compo-nents given in the table have been adjusted to remove theestimated effects of the following events that occurredover 2009, as well as the five major structure events thatwere detailed in the Federal Reserve Bulletin article aboutthe 2008 developments:2
• Bank of America, N.A., consolidated the assets and li-abilities of Countrywide Bank, F.S.B., on April 27,2009, boosting industry assets by about $115 billion.
1. In publishing its H.8 statistical release, ‘‘Assets and Liabilities ofCommercial Banks in the United States,’’ each week, the Federal Reservedescribes nonbank structure activity that affects bank assets by $5.0 billionor more. For a list of such activity dating to December 16, 2005, see theH.8 ‘‘Notes on the Data’’ webpage (www.federalreserve.gov/releases/h8/h8notes.htm). In addition, information about structure activity involvingany banking organization is available in the Federal Financial InstitutionsExamination Council’s central repository of data, the National InformationCenter (www.ffiec.gov/nicpubweb/nicweb/nichome.aspx).
2. See box ‘‘Adjustments to the Balance Sheet Data for Structure Activ-ity’’ in Morten L. Bech and Tara Rice (2009), ‘‘Profits and Balance SheetDevelopments at U.S. Commercial Banks in 2008,’’ Federal Reserve Bul-
• Commercial bank subsidiaries of Wells Fargo & Com-pany consolidated the assets and liabilities of WachoviaMortgage, F.S.B., and Wachovia Bank, F.S.B., on No-vember 1, 2009, boosting industry assets by about$85 billion.
• Bank of America, N.A., consolidated the assets and li-abilities of Merrill Lynch Bank and Trust Co., F.S.B.,on November 2, 2009, boosting industry assets byabout $40 billion.
• A large credit card bank consolidated securitized creditcard loans onto its balance sheet as of the December2009 Consolidated Reports of Condition and Income (CallReport), boosting industry assets by about $25 billion.3
These four events resulted in the net addition of morethan $265 billion of nonbank assets to commercial banks’balance sheets last year, bringing the total since 2006 tonine major events and $847 billion. As a consequence, theadjusted growth rates shown in table A are generallylower than the unadjusted growth rates shown in table 1of the main text. Notably, after accounting for the consoli-dation of assets from Countrywide and Wachovia, thegrowth of residential real estate loans in the second andfourth quarters was markedly lower, more clearly reflect-ing the weakness in most residential real estate marketsover that period. Overall, the adjusted data on growth intotal loans show that, after adjusting for major structureevents, bank lending steadily contracted in each quarter of2009.
letin, vol. 95 (June), pp. A62–A63, www.federalreserve.gov/pubs/bulletin/2009/pdf/bankprofits09.pdf. The structure-adjusted growth rates shown inthe table were generally based on the difference between the end-of-periodreported data and the beginning-of-period data adjusted for the structureevent. To adjust for Bank of America, N.A., in 2009:Q2 and 2009:Q4, andthe bank subsidiaries of Wells Fargo & Company in 2009:Q4, thebeginning-of-period values were determined by adding the value of the as-sets of the acquired thrift(s) to the reported data for the previous quarter.Similarly, to adjust for the large credit card bank in 2009:Q4, thebeginning-of-period values were determined by adding the value of the se-curitized loans to the reported data for the previous quarter.
3. See note 11 of the main text.
A. Structure-adjusted change in selected balance sheet items, all U.S. banks, 2007–09Percent, annual rate
Balance sheetcategory
2008 20092007 2008 2009
Q1 Q2 Q3 Q4 Q1 Q2 Q3 Q4
Assets . . . . . . . . . . . . . . . . . . . . . . . . . . . . . 12.38 –1.21 8.92 3.51 –8.49 –5.64 –3.56 –3.51 11.38 6.10 –5.15Loans and leases (gross) . . . . . . . . . 5.05 –.70 .40 –6.64 –4.08 –6.27 –11.73 –6.49 11.39 –.43 –6.93
Commercial and industrial . . . . . . 9.49 2.19 7.14 –6.19 –16.32 –18.47 –25.44 –20.34 20.28 3.23 –18.62Consumer . . . . . . . . . . . . . . . . . . . . . 9.27 7.76 –.23 –4.18 –3.21 –2.39 –5.55 –6.19 11.67 3.10 –4.35One- to four-family residential . . –4.36 –10.36 –4.10 –4.90 2.05 –5.01 –9.56 5.29 7.30 –5.83 –1.78Commercial real estate loans1 . . . 5.95 4.97 4.17 .61 –.41 –4.37 –7.83 –11.79 9.17 3.98 –5.97Other loans and leases . . . . . . . . . . 9.29 1.86 10.60 –10.49 –3.00 –2.34 –5.77 –10.74 10.06 2.77 –5.37
Securities . . . . . . . . . . . . . . . . . . . . . . . . .30 –3.33 13.36 –19.15 11.97 24.18 22.81 16.17 5.31 –2.49 19.98Mortgage-backed securities . . . . . 10.74 11.50 2.44 12.60 2.59 13.17 12.67 12.06 .43 9.39 10.51
Liabilities . . . . . . . . . . . . . . . . . . . . . . . . . . 13.30 –1.20 10.88 4.26 –11.61 –7.17 –5.11 –4.25 11.41 7.07 –6.81Capital account . . . . . . . . . . . . . . . . . . . . . 4.33 .46 –7.44 –5.59 21.94 10.11 9.25 8.06 11.16 –2.07 12.88
Memo
Unused loan commitments . . . . . . . . . . .21 –5.88 –16.43 –31.87 –29.30 –24.90 –16.08 –8.94 9.50 –12.98 –18.46Federal Home Loan Bank advances . . 15.96 5.22 52.64 –50.30 –49.47 –43.31 –43.92 –22.20 35.61 4.83 –34.07
Note: Data are from period-end to period-end and are as of April 15, 2010,for both commercial banks and thrift institutions. For a discussion of thestructure adjustments, see the box text; for an explanation of the adjustmentcalculation, see note 2 of the box text.
1. Measured as the sum of construction and land development loanssecured by real estate; real estate loans secured by nonfarm nonresidential
properties or by multifamily residential properties; and loans to financecommercial real estate, construction, and land development activities notsecured by real estate.
Source: Federal Financial Institutions Examination Council, Consoli-dated Reports of Condition and Income (Call Report) for commercial banksand thrift institutions; staff calculations.
Profits and Balance Sheet Developments at U.S. Commercial Banks in 2009 A5

Bank Failures and Measures of Banking Concentration in 2009
Among the major developments in the commercial bank-ing sector in 2009 were the failure of 120 banks with$117.9 billion in assets (figure A). Since the middle of2007, the health of the commercial banking sector hasbeen adversely affected by the economic downturn anddisruptions to financial markets caused by the financialcrisis. The number of problem institutions, as identifiedby the Federal Deposit Insurance Corporation (FDIC),increased greatly throughout 2009 and reached about700 institutions by year-end, up from about 250 a yearearlier.1
The FDIC sold most of the $117.9 billion in assets atthe 120 failed banks to other surviving banks. However,given the uncertain quality of some of the seized assets, inmany instances the FDIC entered loss-sharing agreementswith the purchasers of disposed assets, and in some casesit retained assets for future liquidation.
Very few new commercial banks were chartered during2009. Merger activity among commercial banks slowed abit again, and roughly two-fifths of all mergers involved afailed bank. Together, these structural developmentscaused the number of banks to continue declining over theyear, to about 6,900 at year-end 2009 from about 7,100 atyear-end 2008 (figure B, top panel).
Concentration in the banking industry was littlechanged over 2009 after many years of steady increases.
1. This total includes depository institutions insured by the FDIC thatare not commercial banks. See Federal Deposit Insurance Corporation(2009), Quarterly Banking Profile (Washington: FDIC, December 31),available at www2.fdic.gov/QBP/qbpSelect.asp?menuItem=QBP.
The share of assets held by the 10 largest banks increasedonly slightly, to just under 541⁄2 percent at the end of2009, even with the consolidation of assets from acquiredthrifts onto the balance sheets of the largest banks (figureB, bottom panel). The share of assets held by the top100 banks declined a bit over the year to 811⁄2 percent, thefirst annual decline since 1991.
The number of bank holding companies (BHCs) fell atabout the same pace as in recent years to about 5,000 atthe end of 2009 (for multitiered BHCs, only the top-tierorganization is counted in these figures). While merger ac-tivity among BHCs slowed compared with the past twoyears, the number of newly formed BHCs decreased forthe second consecutive year, and a number of BHCs ex-ited because of the failures of their subsidiary banks. Thenumber of financial holding companies also declinedslightly, mainly as a result of mergers and decertificationsof financial holding company status.2
2. Statistics on financial holding companies include both domesticBHCs that have elected to become financial holding companies and for-eign banking organizations operating in the United States as financial hold-ing companies and subject to the Bank Holding Company Act. For moreinformation, see Board of Governors of the Federal Reserve System andU.S. Department of the Treasury (2003), Report to the Congress on Finan-
cial Holding Companies under the Gramm-Leach-Bliley Act (Washington:Board of Governors and Department of the Treasury, November), availableat www.federalreserve.gov/pubs/reports_other.htm.
10
20
30
40
Billions of dollars
201020092008
A. Assets at failed commercial banks, 2008–10
NOTE: The data are monthly and extend through March 2010. Assets areas of the fail date.
SOURCE: Federal Deposit Insurance Corporation via SNL Financial.
6
8
10
12
14
Thousands
2009200720052003200119991997199519931991
B. Number of banks, and share of assets at the largest banks, 1990–2009
Number
20
40
60
80
100
Percent
2009200720052003200119991997199519931991
Share of assets
100 largest
10 largest
NOTE: The data are as of year-end. For the definition of bank size, seethe general note on the first page of the main text.
A6 Federal Reserve Bulletin h May 2010

real estate sectors. The runoff in loans involved anumber of related factors. With less need for externalfinancing and the uncertain economic outlook, de-mand from businesses for bank-intermediated creditdeclined broadly. Household loan demand similarlydropped as consumers began deleveraging their bal-ance sheets, in part to adjust to the declines in thevalues of their homes and equity holdings. Weakbalance sheets of both businesses and householdslikely also reduced the number of creditworthy bor-rowers. In addition, banks tightened their lendingpolicies substantially over 2008 and 2009, partly inresponse to a less favorable or more uncertain eco-nomic outlook. Reportedly, banks were also respond-ing to a range of other factors, including the poorquality of assets on their balance sheets, the adverseimplications of that situation for their own capital,and disruptions in securitization markets.
The credit quality of existing loans in all majorclasses continued to deteriorate significantly, on bal-ance, over the year, resulting in historically highcharge-off rates. Banks’ overall loan delinquency rate(that is, the proportion of loans whose payments are30 days or more past due or not accruing interest)rose to 71⁄4 percent at year-end, the highest levelposted since at least 1985. Credit quality deterioratedmost sharply for real estate loans. For 2009 as awhole, banks cumulatively charged off 21⁄2 percent ofthe loans that were outstanding at year-end 2008,directly contributing to the decline in loans outstand-ing.
In contrast to the drop in loans, banks’ holdings ofsecurities expanded about 20 percent over 2009(adjusted for structure activity), with growth particu-larly strong in holdings of Treasury securities andagency debt securities (excluding MBS). In addition,as the Federal Reserve ramped up its purchases ofTreasury and agency securities over the course of theyear, reserve balances grew as a share of banks’ totalassets. Indeed, at the end of 2009, such balancesaccounted for 5 percent of banks’ total assets; reservebalances had accounted for just 1⁄4 percent of assetsbefore the financial turmoil of the fall of 2008.
Business Loans
Commercial and industrial (C&I) loans on banks’books plummeted 181⁄2 percent in 2009, the steepestannual decline since at least 1985, and the pace ofcontraction gained momentum over the year (fig-ure 5).
Demand for C&I loans decreased as nonfinancialfirms’ need for external finance dropped off. Thefinancing gap at nonfinancial corporations—the dif-
ference between capital expenditures and internallygenerated funds—fell sharply in the second half of2009 and ended the year below zero (figure 6).Anecdotal reports associated with the weekly datacollected by the Federal Reserve indicate that origina-tions of large loans were sparse last year, and therewere broad-based paydowns of existing C&I loansacross banks and industries. The contraction in C&Iloans was especially steep at large banks last year,which is consistent with reports that some large firmswith access to capital markets paid down bank loanswith the proceeds of bond issues. Indeed, bondissuance was robust after the first quarter amidincreasingly attractive conditions in the corporate
6. Financing gap and net equity retirement at nonfarm nonfinancial corporations, 1990–2009
200
+
_0
200
400
600
800
1,000
Billions of dollars
2009200720052003200119991997199519931991
Net equity retirement
Financing gap
NOTE: The data are four-quarter moving averages. The financing gap is thedifference between capital expenditures and internally generated funds. Netequity retirement consists of funds used to repurchase equity less funds raisedin equity markets.
SOURCE: Federal Reserve Board, Statistical Release Z.1, “Flow of FundsAccounts of the United States,” table F.102 (www.federalreserve.gov/releases/z1).
5. Change in commercial and industrial loans, 1986–2009
20
15
10
5
+
_0
5
10
15
20
Percent
20092006200320001997199419911988
NOTE: The data are quarterly; changes are from four quarters earlier.
Profits and Balance Sheet Developments at U.S. Commercial Banks in 2009 A7

bond market (figure 7). Overall, according to domes-tic banks responding to the Federal Reserve’s SeniorLoan Officer Opinion Survey on Bank Lending Prac-tices (SLOOS), the most important factors explainingthe decline in C&I loans last year were lower loandemand from creditworthy borrowers and a deteriora-tion in the credit quality of potential borrowers.
On the supply side, results from the SLOOS indi-cated that unprecedented fractions of banks tightenedstandards and a wide range of terms on C&I loansthrough the first half of 2009 (figure 8). Results fromthe Federal Reserve’s quarterly Survey of Terms ofBusiness Lending also pointed to a tightening incredit conditions, indicating that the spreads of C&Iloan rates over banks’ cost of funds increased sharplylast year. Even after adjusting for changes in theriskiness of loans and other nonprice loan character-istics, significant increases in C&I loan rate spreadswere reported on loans of all sizes and on loansoriginated by both large and small banks.
A number of developments contributed importantlyto last year’s decline in C&I loans. As financialmarket conditions improved in 2009, the drop in C&Iloans may have been exacerbated by repayments ofdraws on existing credit lines; firms had reportedlydrawn heavily on these lines for precautionary liquid-ity during the extreme disruptions in credit markets inthe fall of 2008. In addition, strained conditions in thesyndicated loan market may also have contributed tothe sharp decline in C&I loans at large banks, asbanks, to complete syndicated deals, had reliedheavily on some types of structured vehicles that havenot regained acceptance by investors. In the leveraged
segment of the C&I loan market, issuance was weakthrough most of last year despite consistent improve-ment in loan prices and trading liquidity in thesecondary market for such loans. In the fourth quar-ter, however, issuance of syndicated leveraged loanspicked up somewhat, and the terms on such loansreportedly eased a bit.
Policymakers have expressed concern about thedifficulties that creditworthy business borrowers with-out access to capital markets—typically smallbusinesses—are experiencing in obtaining credit inthe current lending environment. Gauging the degreeto which small businesses’ access to credit has tight-ened is difficult, as only sparse and imperfect mea-sures of small business lending by banks are avail-
7. Selected components of net financing for nonfinancial businesses, 2005–09
60
40
20
+
_0
20
40
60
Billions of dollars, monthly rate
20092008200720062005
Total
NOTE: C&I is commercial and industrial. SOURCE: Federal Reserve Board, Statistical Release Z.1, “Flow of Funds
Accounts of the United States” (www.federalreserve.gov/releases/z1).
Commercial paper
Bonds
C&I loans
Commercial mortgages
8. Changes in demand and supply conditions at selected banks for commercial and industrial loans to large and middle-market firms, 1990–2009
80
60
40
20
+
_0
20
40
60
Percent
Net percentage of banks reporting stronger demand
2009200720052003200119991997199519931991
1
40
20
+
_0
20
40
60
80
100
Percent
Net percentage of banks reporting tighter standards
2009200720052003200119991997199519931991
2
NOTE: The data are drawn from a survey generally conducted four timesper year; the last observation is from the January 2010 survey, which covers2009:Q4. Net percentage is the percentage of banks reporting an increase indemand or a tightening of standards less, in each case, the percentagereporting the opposite. The definition for firm size suggested for, andgenerally used by, survey respondents is that large and middle-market firmshave annual sales of $50 million or more.
1. Series begins with the November 1991 survey. 2. Series begins with the May 1990 survey. SOURCE: Federal Reserve Board, Senior Loan Officer Opinion Survey on
Bank Lending Practices (www.federalreserve.gov/boarddocs/snloansurvey).
A8 Federal Reserve Bulletin h May 2010

able.4 A survey by the National Federation ofIndependent Business found that slightly larger netfractions of small businesses in 2009 reported thatthey faced tightening credit conditions than had soreported during the period of banking strains in theearly 1990s, and that approval rates for businessowners attempting to borrow were significantly lowerthan in the mid-2000s. That said, only 8 percent ofsurveyed business owners indicated that access tocredit was their principal economic problem, withslow sales and an uncertain economic situation beingmore commonly cited.5 In part, the tight credit condi-tions reported by small businesses may reflect thereduced credit quality of such firms. Banks reportedin the SLOOS that delinquency rates in the fourthquarter were higher for C&I loans to small businessesthan for such loans to larger businesses, and morebanks expected improvement over 2010 in the creditquality of C&I loans to larger firms than of C&I loansto smaller firms.
Federal and state regulators issued guidance inFebruary 2010 stating that banks should strive tomake prudent loans to creditworthy small businesses,and the regulators directed examiners to conduct theirreviews in a way that would not discourage suchactivities.6 In addition, the availability of loans tosmall businesses was supported by the Term Asset-Backed Securities Loan Facility, which helped revi-talize the market for securities guaranteed by theSmall Business Administration.
Delinquency and charge-off rates on C&I loansincreased through 2009, and while these rates werenot as high as those in other loan categories, theirlevels at year-end were roughly comparable withthose from the early 1990s (figure 9). Most SLOOSrespondents indicated that they expected the credit
quality of C&I loans to stabilize or improve in 2010,although banks’ outlook regarding credit quality wasmore sanguine for loans to larger businesses than forloans to smaller businesses. In addition, some signs ofstabilization in C&I loan quality were apparent in thefourth quarter of 2009, as the delinquency rate onC&I loans increased only slightly further and thecharge-off rate declined a bit.
The fundamentals of CRE were poor in 2009, withprices of commercial properties dropping, rents de-clining, and vacancy rates rising. Financing condi-tions for CRE were strained over the year: Almost noissuance of commercial mortgage-backed securitiesoccurred (figure 10), and large net fractions of banksreported tighter standards for CRE loans in theSLOOS (figure 11). The pace of the runoff in CREloans increased over the year, while delinquency and
4. For example, each year the second-quarter Call Report recordsthe amount of C&I loans outstanding that were made originally insmall amounts; these amounts are often used as a proxy for smallbusiness lending but also may capture other lending, such as businesscredit card loans and loans to large firms that were issued by multiplebanks. In addition, realized flows of credit generally reflect bothdemand and supply conditions, and so a fall in loans may notnecessarily be due to supply factors. With those caveats, small C&Iloans at banks declined about 41⁄2 percent from the second quarter of2008 to the second quarter of 2009, while all other C&I loans declinedabout 9 percent.
5. William J. Dennis, Jr. (2010), Small Business Credit in a Deep
Recession (Washington: NFIB Research Foundation, February).6. See Interagency Statement on Meeting the Credit Needs of
Creditworthy Small Business Borrowers, an attachment to Board ofGovernors of the Federal Reserve System, Federal Deposit InsuranceCorporation, National Credit Union Administration, Office of theComptroller of the Currency, Office of Thrift Supervision, and Con-ference of State Bank Supervisors (2010), ‘‘Regulators Issue State-ment on Lending to Creditworthy Small Businesses,’’ joint pressrelease, February 5, www.federalreserve.gov/newsevents/press/bcreg/20100205a.htm.
9. Delinquency and charge-off rates for loans to businesses, by type of loan, 1990–2009
+
_0
3
6
9
12
15
Percent
2009200720052003200119991997199519931991
Delinquencies
C&I
Commercial real estate
+
_0
.5
1.0
1.5
2.0
2.5
3.0
Percent
2009200720052003200119991997199519931991
Net charge-offs
C&I
Commercial real estate
NOTE: The data are quarterly and seasonally adjusted; the data forcommercial real estate begin in 1991. Delinquent loans are loans that are notaccruing interest and those that are accruing interest but are more than 30days past due. The delinquency rate is the end-of-period level of delinquentloans divided by the end-of-period level of outstanding loans. The netcharge-off rate is the annualized amount of charge-offs over the period, net ofrecoveries, divided by the average level of outstanding loans over the period.For the computation of these rates, commercial real estate loans exclude loansnot secured by real estate (see table 1, note 2). C&I is commercial andindustrial.
Profits and Balance Sheet Developments at U.S. Commercial Banks in 2009 A9

charge-off rates reached historically high levels. Inparticular, the delinquency rate on construction andland development loans surged to 181⁄2 percent by theend of 2009, and the delinquency rate was 281⁄2percent for loans that financed the construction ofone- to four-family residential properties (figure 12).Meanwhile, the charge-off rate on construction andland development loans reached 8 percent in thefourth quarter. The credit quality of other CRE lend-ing categories deteriorated to a lesser degree butnevertheless appeared to still be worsening at year-end. Indeed, in the January 2010 SLOOS, banksreported expectations of further deterioration in thecredit quality of CRE loans over 2010, an outlook thatmay be seen as a particular concern for smaller banksbecause their assets are more heavily concentrated inCRE lending. Smaller banks increased their concen-tration of lending in CRE loans over much of the pastdecade; at the end of 2009, CRE loans accounted for
11. Changes in demand and supply conditions at selected banks for commercial real estate loans, 1996–2009
60
40
20
+
_0
20
40
60
Percent
Net percentage of banks reporting stronger demand
2009200720052003200119991997
40
20
+
_0
20
40
60
80
100
Percent
Net percentage of banks reporting tighter standards
2009200720052003200119991997
NOTE: See figure 8, general note and source note.
10. Gross issuance of selected mortgage- and asset-backed securities, 2003–09
100
200
300
400
500
Billions of dollars, annual rate
2009200820072006200520042003
H1 H2
NOTE: CMBS are commercial mortgage-backed securities; consumer ABS(asset-backed securities) are securities backed by credit card loans,nonrevolving consumer loans, and auto loans.
SOURCE: For CMBS, Commercial Mortgage Alert; for ABS, Inside MBS &ABS and Merrill Lynch.
CMBS
Consumer ABS
12. Delinquency and charge-off rates for construction and land development loans, by type of loan, 2007–09
5
10
15
20
25
30
Percent
200920082007
Delinquencies
Residential
Other
2
4
6
8
10
Percent
Net charge-offs
200920082007
Residential
Other
NOTE: The data are quarterly and are available since the series began in2007:Q1. For definitions of delinquencies and net charge-offs, see the notefor figure 9. Other consists of other construction loans and all other landdevelopment and other land loans.
A10 Federal Reserve Bulletin h May 2010

about 46 percent of total loans at such banks, com-pared with about 17 percent of loans at the 100 largestbanks.
Banks’ holdings of CRE loans fell 6 percent(adjusted for structure activity) in 2009, pulled downby a precipitous drop in loans to fund constructionand land development, particularly of one- to four-family residential homes (figure 13).7 In contrast,loans secured by nonfarm nonresidential propertiesexpanded modestly last year despite the worseningfundamentals in commercial property markets. Someof this relative strength may reflect a substitutionaway from C&I loans: Given the substantial deterio-ration in the credit quality of banks’ business loanportfolios, some banks reportedly sought strongercollateral for business loans, which may have in-cluded forms of real estate. In such cases, the loanswould have shifted from the C&I category to loanssecured by nonfarm nonresidential real estate. None-theless, even growth of nonfarm nonresidential loansslowed over the second half of the year. In other CRElending, loans backed by multifamily properties grewmildly over most of 2009 but dropped in the fourthquarter.
Household Loans
Banks’ holdings of loans to households also declinedbroadly in 2009. Adjusted for structure activity, resi-dential real estate loans on banks’ books decreased13⁄4 percent and consumer loans fell 41⁄4 percent.
Following the financial crisis, households tooksteps to strengthen their balance sheets. The house-
hold financial obligations ratio—an estimate of debtpayments and recurring obligations as a percentage ofdisposable income—fell over 2009 to end the year atits lowest level since 2000; this movement is consis-tent in part with households paying down debt toreduce their interest and principal burdens (figure 14).In addition, the personal saving rate increased mark-edly since the beginning of 2008.
However, the combination of low mortgage rates, atax credit for first-time homebuyers, and improvedhome affordability likely contributed to the strength-ened demand for prime mortgages reported in theSLOOS over the first three quarters of 2009 (fig-ure 15). Compared with 2008, originations of first-lien residential mortgages by commercial banks as awhole rose in 2009.
The decrease in banks’ holdings of residential realestate loans last year was attributable to their substan-tial sales of such loans to the GSEs, their tight lending
7. Outstanding loans to fund the construction of one- to four-familyresidential homes totaled only $86 billion at year-end, less thanone-half of their peak during the first quarter of 2008.
13. Change in commercial real estate loans, by major components, 1990–2009
30
20
10
+
_0
10
20
30
40
Percent
Construction and landdevelopment
Multifamilyresidential
Nonfarmnonresidential
2009200720052003200119991997199519931991
NOTE: The data are annual and adjusted for major structure events.
14. Indicators of household financial stress, 1993–2009
16.0
16.5
17.0
17.5
18.0
18.5
19.0
200920072005200320011999199719951993
Financial obligations ratioPercent
100
200
300
400
500
600
700
800
900
1,000
200920072005200320011999199719951993
Household bankruptcy filingsPer 100,000 persons
NOTE: The data are quarterly. The financial obligations ratio is an estimateof debt payments and recurring obligations as a percentage of disposablepersonal income; debt payments and recurring obligations consist of requiredpayments on outstanding mortgage debt, consumer debt, auto leases, rent,homeowner’s insurance, and property taxes. The series shown for bankruptcyfilings begins in 1995:Q1 and is seasonally adjusted.
SOURCE: For financial obligations ratio, Federal Reserve Board(www.federalreserve.gov/releases/housedebt); for bankruptcy filings, staffcalculations based on data from Lundquist Consulting.
Profits and Balance Sheet Developments at U.S. Commercial Banks in 2009 A11

standards in an environment of declining home valuesand high unemployment, and few originations ofnontraditional or subprime loans by banks.
The deterioration in the credit quality of banks’closed-end residential real estate loans showed little,if any, sign of abating in 2009 (figure 16). Nationaldata on rates of serious delinquency worsened consid-erably for all classes of borrowers and types ofmortgages. Delinquency rates on variable-rate mort-gages in particular continued to increase more thanthose on fixed-rate loans, especially for subprimeborrowers (figure 17). Of all major loan classes,banks recorded the highest delinquency rate for resi-dential real estate loans, and the charge-off rate in thiscategory was also very elevated. Banks’ holdings offoreclosed real estate rose in 2009 but remained lowrelative to delinquency rates; such holdings equaledabout 1⁄2 percent of the value of outstanding closed-end residential mortgages by year-end.
The credit quality of first- and junior-lien closed-end residential mortgages diverged last year. Delin-quency and charge-off rates for first liens worsenedthroughout the year, but the delinquency rate forjunior liens stabilized in the second half of the year.The latter development may be explained by the verysharp increase in the charge-off rate on junior liens, asthese loans are associated with lower recovery ratesand tend to be charged off sooner after becomingdelinquent than first liens. In contrast, delinquencyand charge-off rates for revolving, open-end homeequity loans were about flat for most of the year,likely reflecting banks’ tightening of standards on
17. Rate of serious delinquency on residential mortgages, by type of mortgage and type of interest rate, 2000–10
+
_0
5
10
15
20
25
30
35
40
45
Percent
201020082006200420022000
Subprime, fixed rate
Subprime, variable rate
Prime, variable rate
Prime, fixed rate
NOTE: The data are monthly and extend through January 2010. Seriouslydelinquent loans are 90 days or more past due or in foreclosure. The primemortgage data are representative of all residential mortgages, not just thoseheld by commercial banks. The subprime mortgage data cover onlysecuritized loans.
SOURCE: For prime mortgages, McDash Analytics; for subprimemortgages, LoanPerformance, a division of First American CoreLogic.
15. Change in prices of existing single-family homes, 1990–2009
20
15
10
5
+
_0
5
10
15
20
Percent
2009200720052003200119991997199519931991
LP price index
FHFAindex
NOTE: The data are quarterly and extend through 2009:Q4; changes arefrom one year earlier. The LP price index includes purchase transactionsonly. For 1990, the FHFA index (formerly calculated by the Office of FederalHousing Enterprise Oversight) includes appraisals associated with mortgagerefinancings; beginning in 1991, it includes purchase transactions only.
SOURCE: For LP, LoanPerformance, a division of First AmericanCoreLogic; for FHFA, Federal Housing Finance Agency.
16. Delinquency and charge-off rates for residential real estate loans at commercial banks, by type of loan, 1991–2009
+
_0
2
4
6
8
10
12
14
Percent
2009200720052003200119991997199519931991
Delinquencies
Revolving home equity
Closed-end mortgages
+
_0
.5
1.0
1.5
2.0
2.5
3.0
3.5
Percent
2009200720052003200119991997199519931991
Net charge-offs
Revolving home equity
Closed-end mortgages
NOTE: The data are quarterly and seasonally adjusted. For definitions ofdelinquencies and net charge-offs, see the note for figure 9.
A12 Federal Reserve Bulletin h May 2010

such loans over the past several years and their abilityto reduce credit lines for borrowers with impairedhome values.
Non-credit-card consumer loans expanded some-what in the second half of 2009, perhaps in part as aresult of frictions in the student loan securitizationmarket, which caused banks to retain more of suchloans on their books. In addition, this category oflending may have benefited from a pickup in personalconsumption expenditures on durable goods duringthe second half of the year.
In contrast, credit card loans declined substantiallyover the same period, likely for several reasons.These loans incurred the highest charge-off rates ofany major loan category, directly reducing outstand-ings (figure 18).8 Also, banks tightened standards and
terms on consumer loans (figure 19), partly in antici-pation of new regulations. Households may also havereduced their use of credit cards in part to shore uptheir financial condition, a move that would be con-sistent with the reduced demand for consumer loansthat was reported by notable net fractions of banks inthe SLOOS during 2009.
By year-end 2009, the credit quality of consumerloans appeared to have begun to stabilize. The delin-quency and charge-off rates on consumer loans de-clined slightly in the second half of the year butremained at historically high levels, particularly forcredit card loans. In the January 2010 SLOOS, banksreported expecting no further deterioration, on net, inthe credit quality of consumer credit card loans over2010, assuming that economic activity progressed inline with consensus forecasts; moderate net fractionsof banks expected credit quality to improve for otherconsumer loans. The largest banks—which are respon-sible for the bulk of credit card lending—may havebegun to benefit from the stabilization in credit
8. For a discussion of the change in bankruptcy law that wasimplemented in 2005 and its effect on credit card loans, see the box‘‘The New Bankruptcy Law and Its Effect on Credit Card Loans,’’ inElizabeth Klee and Gretchen Weinbach (2006), ‘‘Profits and BalanceSheet Developments at U.S. Commercial Banks in 2005,’’ Federal
Reserve Bulletin, vol. 92 (June), p. A89.
18. Delinquency and charge-off rates for loans to households, by type of loan, 1990–2009
1
2
3
4
5
6
7
2009200720052003200119991997199519931991
Delinquencies
Credit card
Other consumer
Percent
+
_0
2
4
6
8
10
2009200720052003200119991997199519931991
Net charge-offs
Credit card
Other consumer
Percent
NOTE: The data are quarterly and seasonally adjusted; data for de-linquencies begin in 1991. For definitions of delinquencies and netcharge-offs, see the note for figure 9.
19. Changes in supply conditions at selected banks for consumer lending and for consumer installment loans, 1996–2009
20
+
_0
20
40
60
80
Percent
2009200720052003200119991997
Net percentage of banks reporting tighterstandards for consumer lending
Credit card loans
Other consumer loans
60
40
20
+
_0
20
40
Percent
2009200720052003200119991997
Net percentage of banks reporting increasedwillingness to make consumer installment loans
NOTE: See figure 8, general note and source note.
Profits and Balance Sheet Developments at U.S. Commercial Banks in 2009 A13

quality on credit card loans, as evidenced by theirreductions in loan loss provisioning during the fourthquarter.
Other Loans
All other loans and leases on banks’ books, a volatilecategory, dropped 71⁄4 percent over 2009, about thesame rate of decline as in 2008. Loans to otherdepository institutions were about flat for the year.Leases, which are made primarily to businesses forfinancing equipment or to households for financingautomobiles, have been declining for most of the pastdecade and continued to do so in 2009, albeit at asomewhat faster rate. Bank lending to state and localgovernments grew during 2009 but not as rapidly asin recent years. Farm loans were about flat for theyear, as farm banks have been less affected by thefinancial crisis, but growth of these loans weakenedcompared with past years given the wider macroeco-nomic downturn. The credit quality of farm loans alsodeteriorated in 2009 but was not notably worse thanthe average quality of these loans over the past twodecades.
Securities
The decline in total loans over 2009 was partiallyoffset by growth in banks’ securities holdings ofabout 20 percent (adjusted for structure activity).While the expansion in securities was shared bybanks of all sizes, it was strongest at the 100 largestbanks. Amid heavy inflows of core deposits over thecourse of the year (discussed later in the article) andweak loan demand, banks increased their holdings ofTreasury securities and agency non-MBS issues mostrapidly, suggesting a preference for liquid, low-riskassets. A total of about $154 billion of these securitieswas added to commercial banks’ balance sheets over2009, an increase of roughly 67 percent over year-end2008. The run-up occurred mostly at the 100 largestbanks, which traditionally have held fewer of thesesecurities as a share of total securities than smallerbanks. Agency MBS, which accounted for roughly37 percent of banks’ securities holdings at year-end2009, also grew strongly at the 100 largest banks.
In general, banks report both the book value (oramortized cost of acquisition) of their securities andthe securities’ current market value. The market valueof the securities is affected by the credit quality of theissuers or of the assets that back the securities as wellas by changes in the general level of interest rates. Atthe height of the credit market turmoil in the fall of2008, the market value of many bank-held securities,
particularly the non-agency MBS at the center of thecrisis as well as the perpetual preferred securitiesissued by the GSEs, had declined considerably. How-ever, the substantial decline in the general level ofinterest rates since the onset of the crisis has causedthe market value of longer-duration assets with littlecredit risk to increase.
Over 2009, the difference between reported fairvalue measurements and book values of available-for-sale securities in investment accounts narrowed, sug-gesting that banks have substantially lower revalua-tion losses on their current securities holdings thanthey did a year ago. At the end of 2008, banksreported net unrealized losses on investment accountsecurities of about $60 billion, led by losses onnon-agency MBS and ABS, which were offset a bit bygains in other securities categories, particularly agencyMBS. These net unrealized losses waned over 2009,as improving financial conditions and lower interestrates contributed to a recovery in the market prices ofmany securities. At the end of the fourth quarter,banks reported net unrealized gains of about $9 bil-lion on their investment account securities as awhole.9 Finally, banks sold some securities at a loss,which was reflected in the $1.7 billion of total netrealized losses on securities holdings over 2009.
Cash Assets
Cash assets, including reserve balances with FederalReserve Banks, expanded considerably in late 2008, apattern consistent with the considerable growth of theFederal Reserve’s balance sheet. Usage of the specialliquidity facilities established at the height of thefinancial crisis gradually fell over the first half of2009, and reserve balances declined over the sameperiod. However, as the Federal Reserve continued itslarge-scale asset purchases, reserve balances rosesharply in the third quarter. At year-end, the level ofreserve balances was at a record high, accounting for5 percent of industry assets. The interest rate paid on
9. In early April 2009, the Financial Accounting Standards Boardissued guidance related to other-than-temporary impairments (OTTI),or FASB Staff Position (FSP) FAS 115-2, which required impairmentwrite-downs through earnings only for the credit-related portion of adebt security’s fair value impairment, while other components wouldaffect other comprehensive income, which includes unrealized gainsand losses on available-for-sale securities. (For more information onthe guidance, see Financial Accounting Standards Board (2009),‘‘Summary of Board Decisions,’’ webpage, April 2, www.fasb.org/action/sbd040209.shtml.) However, banks reported that the cumula-tive effect of the initial application of FSP FAS 115-2 on OTTI wasonly about $1.3 billion in 2009, having only a marginal effect onearnings relative to total unrealized gains and losses and fair valueadjustments on securities.
A14 Federal Reserve Bulletin h May 2010

excess reserves held by banks remained at 25 basispoints over the year.
Off-Balance-Sheet Items
For the second consecutive year, banks’ off-balance-sheet unused commitments to fund loans contractedsteeply, and the runoff was widespread across allmajor commitment categories (figure 20). Responsesto the SLOOS suggest that banks reduced credit linesfor both new and existing customers and that thosereductions were more prevalent for lower-qualityborrowers. In addition, the cuts in lines likely re-flected disproportionately the tightened lending stan-dards by banks, as borrowers are presumably unlikelyto request reductions in their line size since themarginal cost to borrowers of maintaining unusedlines is typically small, especially for households.
Securitized loans, which are not held on banks’books, contracted 5 percent over 2009.10 Since thedata began to be collected in 2002, the only previousannual decline occurred in 2003, with a drop of1⁄2 percent. Last year’s decline was likely in responseto the impairment of many securitization markets forall or part of the period, as well as the weak lendingenvironment. Securitized mortgages had risen consid-erably over 2007 and 2008 and still accounted fortwo-thirds of securitized loans at the end of 2009.However, with the market for non-agency MBSremaining shut last year, balances of securitizedmortgages declined about 33⁄4 percent in 2009. TheGSEs, though, continued to purchase large quantitiesof closed-end residential mortgages from banks.
Securitized credit card loans, which account for afurther 20 percent of securitized loans, declined83⁄4 percent in 2009. Most of this decline was due tothe consolidation of securitized credit card assets inthe fourth quarter by one large bank that adopted thenew FAS 166 and 167 accounting rules at that time.11
DERIVATIVES
In 2009, the notional principal amount of derivativescontracts held by banks grew a moderate 33⁄4 percentto reach $220 trillion (table 2).12 Notional values areboosted substantially by a few of the largest banks,which enter into offsetting positions in their capaci-ties as dealers in derivatives markets. The fair marketvalue of those derivatives contracts held by banksreflects the contracts’ replacement costs and is farsmaller than the notional principal amount.13 Theaggregate fair market value for all bank contractswith a positive value in 2009 was about $4.1 trillion;for all bank contracts with a negative value, theaggregate fair market value was roughly negative$3.9 trillion. These fair values were considerablysmaller relative to their notional values at the end of2009 than they were at the end of 2008, due to thepartial recovery in financial markets from the unprec-edented market dislocations that occurred in the fallof 2008. Both the positive and negative fair values10. Loans that banks sold or securitized with servicing rights
retained or with recourse or other seller-provided enhancements arehereafter referred to, for simplicity, as ‘‘securitized’’ loans. Theanalysis excludes loans that were sold to, and securitized by, a thirdparty (for example, the Federal National Mortgage Association or theFederal Home Loan Mortgage Corporation).
11. The Financial Accounting Standards Board (FASB) announcedin June 2009 the publication of FAS 166, Accounting for Transfers of
Financial Assets, and FAS 167, Amendments to FASB Interpretation
No. 46(R) (Consolidation of Variable Interest Entities), which willchange the way companies account for securitizations and specialpurpose entities. FAS 166 and 167 must be implemented with firms’first financial reporting period ending after November 15, 2009, whichfor commercial banks effectively means that the implementation willbe reflected in their 2010:Q1 Call Reports. For more information, seethe FASB’s website at www.fasb.org. For more information about thebalance sheets of commercial banks, see Board of Governors of theFederal Reserve System (2010), Statistical Release H.8, ‘‘Assets and
Liabilities of Commercial Banks in the United States’’ (April 9),www.federalreserve.gov/releases/h8/current/default.htm.
12. Notional amounts are amounts from which contractual pay-ments will be derived and, in most instances, are much larger than theamounts at risk; thus, they do not accurately represent the scope ofeconomic involvement of banks with derivatives.
13. The total of all contracts with a positive fair value is ameasurement of credit exposure, or the amount that a bank could loseif its counterparties did not fulfill their contracts. The total of allcontracts with a negative fair value at a bank represents a measurementof exposure that the bank poses to its counterparties. Even these fairvalue amounts can overstate exposure, as counterparties often enterinto bilateral ‘‘netting’’ agreements, which allow aggregation of allbilateral exposure into the equivalent of a single trade in the event ofdefault of either party.
20. Change in unused bank loan commitments to businesses and households, 1990–2009
80
60
40
20
+
_0
20
40
60
Percent, annual rate
2009200720052003200119991997199519931991
Commercial real estate,construction, and
land development loansTotal
NOTE: The data, which are quarterly, begin in 1990:Q2 and are notseasonally adjusted. The total consists of unused commitments relating tocredit card lines; revolving, open-end lines secured by one- to four-familyresidential properties; commercial real estate, construction, and landdevelopment loans; securities underwriting; and “other.”
Profits and Balance Sheet Developments at U.S. Commercial Banks in 2009 A15

contracted substantially over the first half of 2009,and each declined about 43 percent for the year as awhole.
Interest rate products continued to account formore than 80 percent of the notional value of deriva-tives products held by banks and about 77 percent ofpositive and negative fair values. Interest rate swaps,which account for most of the interest rate derivativeson banks’ books, are an important way for banks tohedge interest rate risk, including that related tointerest-sensitive assets such as mortgages and MBS.The notional amount of interest rate swaps declined13⁄4 percent over 2009. In addition, both positive andnegative fair values dropped substantially, likely inpart because of the development of stable low interestrates over the year. Other interest rate derivativesinclude options, futures, and forwards, and the no-tional value of these other derivatives contracts grew16 percent over 2009, in line with the pace in the pastfew years.
One of the fastest growing components of banks’derivatives portfolios in recent years has been creditderivatives, which, prior to last year, had expanded an
average of about 70 percent per year since 2000. Aftera pause in 2008, credit derivatives resumed growth in2009.14 The notional amount of these derivativesgrew 29 percent for the year, and at year-end 2009,credit derivatives accounted for 91⁄2 percent of thenotional principal value of all derivatives contractsheld by banks. By contrast, the fair value of creditderivatives contracts fell 60 percent in 2009, andthese products constituted about 11 percent of posi-tive and negative fair values at banks at year-end.These fair values started to decline in the spring of2009 but remained high relative to historical normsdue to the elevated spreads on many of the underlyingreference entities. Over the course of the year, asspreads on underlying reference entities receded andoverall market functioning improved, the value ofsuch credit protection (the fair values of the creditderivatives) declined. Credit default swaps accounted
14. The flattening in notional values of credit default swaps during2008, however, appears to have been due in part to organized efforts tocompress offsetting trades and not simply to a reduction in tradingactivity.
2. Change in notional value and fair value of derivatives, all U.S. banks, 2004–09
Percent
Item 2004 2005 2006 2007 2008 2009
Memo
Dec. 2009(billions of
dollars)
Total derivativesNotional amount. . . . . . . . . . . . . . . . . 23.69 15.38 29.75 25.68 27.70 3.80 220,146Fair value
Positive. . . . . . . . . . . . . . . . . . . . . . . 13.71 –6.46 –4.50 68.18 250.24 –42.86 4,057Negative . . . . . . . . . . . . . . . . . . . . . . 13.75 –5.78 –4.27 65.77 249.26 –43.26 3,919
Interest rate derivativesNotional amount . . . . . . . . . . . . . . 22.07 11.92 27.11 20.54 35.85 2.09 179,548Fair value
Positive . . . . . . . . . . . . . . . . . . . . 13.14 –5.52 –14.55 56.19 290.52 –39.06 3,121Negative . . . . . . . . . . . . . . . . . . . 12.94 –5.15 –15.06 58.19 286.45 –39.41 3,023
Exchange rate derivativesNotional amount . . . . . . . . . . . . . . 21.03 7.69 29.27 36.69 –1.46 2.22 17,298Fair value
Positive . . . . . . . . . . . . . . . . . . . . 14.86 –35.84 22.86 43.59 149.12 –45.05 354Negative . . . . . . . . . . . . . . . . . . . 12.74 –37.36 21.39 43.40 163.80 –47.91 345
Credit derivativesNotional amount . . . . . . . . . . . . . . 134.52 148.09 54.93 75.87 1.05 28.76 20,639
Guarantor . . . . . . . . . . . . . . . . . . 139.07 137.87 67.69 73.94 –1.27 31.37 10,143Beneficiary . . . . . . . . . . . . . . . . . 130.46 157.53 44.03 77.79 3.30 26.33 10,496
Fair valueGuarantor . . . . . . . . . . . . . . . . . . 69.92 81.43 92.96 295.25 282.68 –61.31 406
Positive . . . . . . . . . . . . . . . . . . 74.56 –5.62 201.40 –38.79 19.41 230.90 122Negative . . . . . . . . . . . . . . . . . 38.37 827.98 –1.59 1187.41 316.11 –71.96 284
Beneficiary . . . . . . . . . . . . . . . . . 51.28 83.50 90.26 301.20 260.40 –60.12 448Positive . . . . . . . . . . . . . . . . . . 2.64 505.51 3.98 1086.95 306.28 –70.62 319Negative . . . . . . . . . . . . . . . . . 66.36 2.79 187.44 –18.95 –13.35 233.57 129
Other derivatives1
Notional amount . . . . . . . . . . . . . . 32.66 29.43 75.17 13.44 –9.00 –18.48 2,661Fair value
Positive . . . . . . . . . . . . . . . . . . . . 8.55 58.51 18.99 41.22 33.70 –33.53 142Negative . . . . . . . . . . . . . . . . . . . 19.73 74.29 24.15 15.66 39.27 –32.75 139
Note: Data are from year-end to year-end and are as of March 23, 2010.1. Other derivatives consist of equity and commodity derivatives
and other contracts.
A16 Federal Reserve Bulletin h May 2010

for 98 percent of the notional value of credit deriva-tives held by banks throughout the year (total returnswaps and credit options are two other commontypes). Banks are beneficiaries of protection whenthey buy credit derivatives contracts and providers ofprotection (guarantors) when they sell them. Banksare typically net beneficiaries of protection; as ofyear-end, contracts in which banks were beneficiariesof protection totaled $10.5 trillion in notional value,and contracts in which they were guarantors totaled$10.1 trillion (figure 21).
Banks also use derivatives related to foreign ex-change, equities, and commodities. Collectively, thoseinstruments accounted for about 9 percent of thenotional value of the derivatives contracts held bybanks at year-end. Banks’ notional holdings of foreign-exchange-related derivatives grew 21⁄4 percent in2009. Their notional holdings of equity and commod-ity derivatives together fell 181⁄2 percent, a secondconsecutive annual decline.
The share of industry derivatives contracts (interms of notional value) at the 10 largest banks (interms of assets) had for years been more than 97 per-cent, a concentration ratio that reflected the role thatsome of the largest banks play as dealers in deriva-tives markets. However, since the end of 2008, thatshare has declined to about 80 percent, as the reorga-nization of a prominent derivatives dealer involvedbooking these derivatives at one of its commercialbank subsidiaries that remained outside of the 10 larg-est banks at the end of 2009. Still, banks’ derivativesholdings were highly concentrated over the past twoyears: The 5 banks with the most derivatives activityin 2009, including 1 bank not among the 10 largest
banks by assets, held 96 percent of all derivatives bynotional amounts.15
LIABILITIES
Total liabilities on banks’ books declined about51⁄2 percent in 2009. Adjusting for major structureevents, liabilities contracted 63⁄4 percent. As was trueof the decrease in assets, the decline in liabilities wasconcentrated at the 100 largest banks. The runoff inliabilities took place in the context of deleveraging bybanking institutions amid weak loan demand andtight credit standards; banks reduced assets, raisedcapital, and pared back relatively more expensivesources of funding. Thus, banks did not competestrongly for managed liabilities or small time depos-its, and declines in those components accounted forthe contraction of overall liabilities. Indeed, smalltime deposits shrank substantially over 2009, revers-ing a steep run-up during the height of the financialcrisis in late 2008, after which the spreads betweenrates on time and savings deposits declined markedly.
While overall liabilities contracted, total core de-posits grew about 8 percent in 2009, well above theaverage pace during years prior to the financial crisis.As a result, for the second consecutive year, coredeposits rose as a share of bank funding.16 Amid lowmarket interest rates, the opportunity cost of holdingliquid deposits remained low in 2009, and conse-quently savings and transaction deposits grew sizably(figure 22). With money market rates unusually low,money market mutual funds experienced large out-flows, some of which may have ended up at banks asthe public sought the safety and liquidity of insureddeposits (figure 23). Reinforcing this trend was theextension through 2013 of the temporary increase inthe Federal Deposit Insurance Corporation’s maxi-mum deposit insurance amount to $250,000, whichpreviously had been in place only through the end of2009.17 The FDIC also extended, until the end of June2010, its program providing unlimited guarantees oftransaction accounts, although the new higher annualassessment rates for participating banks caused manylarge institutions to opt out of the program at year-end2009.
Managed liabilities contracted 161⁄2 percent over2009. Given strong growth of core deposits and
15. Office of the Comptroller of the Currency, OCC’s Quarterly
Report on Bank Trading and Derivatives Activities, Third Quarter
2009 (Washington: OCC), available at www.occ.treas.gov/deriv/deriv.htm.
16. Core deposits consist of savings deposits (including moneymarket deposit accounts), small-denomination time deposits, andtransaction deposits.
17. This extension became effective on May 20, 2009.
21. Notional amounts of credit derivatives for which banks were beneficiaries or guarantors, 2000–09
+
_0
2
4
6
8
10
Trillions of dollars
20092007200520032001
Beneficiary
Guarantor
NOTE: The data are quarterly.
Profits and Balance Sheet Developments at U.S. Commercial Banks in 2009 A17

shrinking assets, banks were able to continue reduc-ing their reliance on these generally more expensiveand less stable sources of funds. Large time depositsran off appreciably, while deposits booked in foreignoffices were about flat for the year. In addition toparing back advances from the Federal Home LoanBanks over the course of the year, commercial banksdecreased their borrowings from the Federal Reserveliquidity facilities introduced during the crisis.18 Netborrowings in the federal funds market declined inlight of banks’ hefty reserve holdings.
Banking institutions issued about $300 billion ofdebt under the debt guarantee portion of the FDIC’sTemporary Liquidity Guarantee Program (TLGP),which was established in October 2008. The TLGPguarantees, in exchange for a fee, short- and medium-term debt maturing on or before December 31, 2012.About five-sixths of this debt was issued by bankholding companies (BHCs) and so does not appeardirectly as long-term debt at the bank level. Theprogram was used most heavily before the summer of2009. After the results of the Supervisory CapitalAssessment Program were released in May, manybanks were able to issue sufficient amounts of debtwithout the guarantee. In October, the FDIC endedthe Debt Guarantee Program component of the TLGP
and established a new, limited emergency guaranteefacility in order to promote the transition of bankinginstitutions away from such support.
CAPITAL
The banking industry shored up its capital position in2009. The equity capital of commercial banks rose toabout 111⁄4 percent of assets by the end of 2009, upconsiderably from about 91⁄2 percent at the end of2008. The increase was due largely to substantialinfusions of capital from parent BHCs throughout theyear. Total capital transfers in 2009 amounted to$113 billion. These additions augmented the largetransfers that occurred in the fourth quarter of 2008(figure 24). In many cases, the transfers reflected the
18. The Federal Home Loan Banks (FHLBs) were established in1932 as GSEs chartered to provide a low-cost source of funds,primarily for mortgage lending. They are cooperatively owned by theirmember financial institutions, a group that originally was limited tosavings and loan associations, savings banks, and insurance compa-nies. Commercial banks were first able to join FHLBs in 1989, andsince then FHLB advances have become a significant source offunding for them, particularly for medium-sized and small banks. TheFHLBs are cooperatives, and the purchase of stock is required in orderto borrow.
23. Net flows into money market mutual funds and deposits at commercial banks, 2007–09
200
100
+
_0
100
200
300
400
500
Billions of dollars
200920082007
NOTE: The data are aggregated from weekly to quarterly frequency. SOURCE: For money market mutual funds, iMoneyNet; for deposits,
Federal Reserve Board, Statistical Release H.8, “Assets and Liabilities ofCommercial Banks in the United States” (www.federalreserve.gov/releases/h8).
Money market mutual funds
Deposits
22. Selected domestic liabilities at banks as a proportion of their total domestic liabilities, 1990–2009
+
_0
10
20
30
40
Percent
2009200720052003200119991997199519931991
Savings deposits
Small time deposits
Transaction deposits
NOTE: The data are quarterly. Savings deposits include money marketdeposit accounts.
24. Capital transfers to commercial banks from parent bank holding companies, 1990–2009
+
_0
10
20
30
40
50
60
70
Billions of dollars
2009200720052003200119991997199519931991
NOTE: The data are quarterly.
A18 Federal Reserve Bulletin h May 2010

downstreaming of capital raised by the parent BHCthrough the Troubled Asset Relief Program’s CapitalPurchase Program (CPP). Although many BHCsrepaid CPP funds during the second half of 2009,most of that equity was replaced by secondary equityissuance by large BHCs that had been evaluatedunder the SCAP. As public equity markets improvedfurther in the second half of 2009, other banks werealso able to issue new shares to build capital or repayCPP investments. (For more information, see box‘‘The Capital Purchase Program and the SupervisoryCapital Assessment Program.’’)
Retained earnings as a share of total equity droppedfrom about 27 percent at the end of 2008 to about22 percent at the end of 2009. That component wasreduced by declared dividends that exceeded profitsfor the second consecutive year, even though suchpayouts as a percentage of average assets were athistorically low levels. A large majority of the divi-dends were declared by banks in the top five BHCs.These relatively more profitable institutions repaidtheir CPP funds in the second half of 2009 and werenot subject to the restrictions on dividends at the BHClevel that are associated with the receipt of TARPfunds.19 For the entire year, dividends at profitablebanks amounted to 0.55 percent of average assets,while dividends at the other banks amounted to only0.04 percent.
On balance, all three regulatory capital ratiosincreased to record levels (figure 25). The leverageratio increased by 1 percentage point to about 81⁄2percent by the end of 2009.20 The tier 1 and totalrisk-based capital ratios, measured relative to risk-weighted assets, each increased substantially—fromabout 93⁄4 percent to 111⁄2 percent and from about123⁄4 percent to 141⁄4 percent, respectively.21 Reduc-
tions in risk-weighted assets and average tangibleassets as well as increased capital contributed tohigher regulatory capital ratios in 2009. The reductionin risk-weighted assets was partly attributable to ashift in the composition of assets from loans to cashand securities, while total assets shrank as loansoutstanding on banks’ books ran off steeply last year.
Several factors likely contributed to banking insti-tutions’ efforts to boost capital. First, some of thelargest banking organizations were required to aug-ment their capital as a result of the SCAP process.Second, a few banks faced substantial increases inboth risk-weighted and total assets associated withthe large amounts of off-balance-sheet assets thatare required to be consolidated on banks’ balancesheets by the end of the first quarter of 2010 inconjunction with the adoption of Statements of Fi-nancial Accounting Standards Nos. 166 and 167.Those consolidations may have led some institutionsto add to their capital prior to the accountingchange.22 Third, capital is generally considered abuffer to protect uninsured depositors and other
19. The top five BHCs are ranked by the combined assets ofcommercial bank subsidiaries for a given BHC. As of the fourthquarter of 2009, the top five BHCs had 28 commercial bank subsidiar-ies, which accounted for about 52 percent of total commercial bankassets. For more information on the dividend restrictions, see thepublic term sheet for the CPP, which is an attachment to U.S.Department of the Treasury (2008), ‘‘Treasury Announces TARPCapital Purchase Program Description,’’ press release, October 14,www.ustreas.gov/press/releases/hp1207.htm.
20. The leverage ratio is the ratio of tier 1 capital to averagetangible assets. Tangible assets are equal to total average consolidatedassets less assets excluded from common equity in the calculation oftier 1 capital.
21. Tier 1, tier 2, and tier 3 capital are regulatory measures. Tier 1capital consists primarily of common equity (excluding intangibleassets such as goodwill and excluding net unrealized gains on invest-ment account securities classified as available for sale) and certainperpetual preferred stock. Tier 2 capital consists primarily of subordi-nated debt, preferred stock not included in tier 1 capital, and loan lossreserves up to a cap of 1.25 percent of risk-weighted assets. Tier 3capital is short-term subordinated debt with certain restrictions onrepayment provisions and is limited to approximately 70 percent of a
bank’s measure for market risk. Total regulatory capital is the sum oftier 1, tier 2, and tier 3 capital. Risk-weighted assets are calculated bymultiplying the amount of assets and the credit-equivalent amount ofoff-balance-sheet items (an estimate of the potential credit exposureposed by the items) by the risk weight for each category. The riskweights rise from 0 to 1 as the credit risk of the assets increases. Thetier 1 ratio is the ratio of tier 1 capital to risk-weighted assets; the totalratio is the ratio of the sum of tier 1, tier 2, and tier 3 capital torisk-weighted assets.
22. Banks have an option to phase in the effects of the implemen-tation of FAS 166 and 167 on risk-weighted assets and tier 2 capitalover four quarters. See Board of Governors of the Federal ReserveSystem, Federal Deposit Insurance Corporation, Office of the Comp-troller of the Currency, and Office of Thrift Supervision (2010),‘‘Agencies Issue Final Rule for Regulatory Capital Standards Relatedto Statements of Financial Accounting Standards Nos. 166 and 167,’’press release, January 21, www.federalreserve.gov/newsevents/press/bcreg/20100121a.htm.
25. Regulatory capital ratios, 1990–2009
7
9
11
13
Percent
2009200720052003200119991997199519931991
Total
Tier 1
Leverage
NOTE: The data are quarterly. For the components of the ratios, see textnotes 20 and 21.
Profits and Balance Sheet Developments at U.S. Commercial Banks in 2009 A19
senior stakeholders against unexpected losses that abank may potentially incur beyond what it has setaside in reserves. In the current uncertain economicenvironment, banks may want a larger than usualbuffer. Moreover, banks’ loan loss reserves—whichare intended to cover estimated likely credit losses—have fallen to very low levels relative to theirdelinquent loans and charge-offs, even as certainsectors of the economy to which many banks havesignificant exposures, such as commercial real es-tate, remain fragile. Finally, both national and inter-national authorities are considering tightening capi-tal requirements in light of the crisis.
Although not part of regulatory capital, accumu-lated other comprehensive income (AOCI), which
includes net unrealized gains and losses on available-for-sale securities and accumulated net gains andlosses on cash flow hedges, continued to play animportant role as a component of equity last year.Particularly during the period of greatest stress on thebanking system in late 2008 and the first half of 2009,market participants focused on various measures oftangible common equity (TCE) relative to tangible orrisk-weighted assets as important indicators of banks’financial condition. These measures usually incorpo-rated AOCI in the calculation of tangible capital. Theincrease in AOCI, which was largely due to thenotable reduction in unrealized losses on available-for-sale securities, helped improve industry TCEratios in 2009.
The Capital Purchase Program and the Supervisory Capital Assessment Program
In 2009, parent bank holding companies (BHCs) trans-ferred a record level of capital to commercial bankswithin their organizational structures. Such transfers re-sulted in significantly higher regulatory capital ratios forthose subsidiary banks. The capital transfers themselveswere initially supported by large injections of governmentcapital at the BHC level through the Troubled Asset Re-lief Program (TARP), launched in October 2008, and pri-marily through the TARP Capital Purchase Program(CPP).1 The CPP initially was allotted $250 billion to pur-chase senior preferred shares of financial institutions inorder to stabilize the financial system by increasing thecapital base of financial institutions and to support theircapacity to make loans to businesses and households. Fi-nancial institutions participating in the program agreed topay the Treasury a 5 percent dividend on the preferredshares per year for the first five years and 9 percent peryear thereafter. At the end of 2008, the CPP had almost$180 billion invested in more than 200 financial institu-tions. Most of the capital was committed to the largestU.S. financial institutions (figure C, top panel). By the endof 2009, more than 650 institutions had received CPP in-vestments. CPP balances peaked at close to $200 billionin the second quarter, but afterward many banks began torepay those investments. As of year-end, CPP balanceshad fallen to less than $85 billion.
A turning point in the outstanding balances of the CPPprogram was the Supervisory Capital Assessment Pro-gram (SCAP), otherwise known as the bank stress tests.Led by the Federal Reserve, the U.S. federal banking su-pervisory agencies conducted the SCAP from February toApril 2009 and released the results in May.2 The objective
1. The Treasury also purchased preferred stock at Citigroup, Inc., andBank of America Corporation through the TARP Targeted Investment Pro-gram (TIP). Both institutions fully repaid their TIP balances in the fourthquarter of 2009.
2. For an overview of the results, see www.federalreserve.gov/bankinginforeg/scap.htm.
of the SCAP was to conduct a comprehensive, consistent,and simultaneous assessment of capital needs across the19 largest BHCs using a common set of macroeconomicscenarios and a common forward-looking framework.3
More specifically, the SCAP estimated losses, revenues,and loss reserve needs for the next two years under twomacroeconomic scenarios.4 The program was designed toassess the need for a BHC to raise or improve the qualityof capital in order to have sufficient capital buffers to sus-tain lending even in a more adverse economic scenario.The SCAP results identified 10 BHCs as requiring addi-tional capital or higher-quality capital. The detailed publi-cation of the SCAP results also helped clarify the financialconditions of the largest BHCs and provided investorswith greater assurance about the health of these institu-tions. The resulting improvement in market sentiment re-garding banking institutions, reinforced by the stabiliza-tion of the economic outlook at the time, allowed theBHCs to tap capital markets for substantial funds. Most ofthe 19 BHCs included in the SCAP issued equity, some toraise their required SCAP buffer and some to repay the
3. The following 19 BHCs were in the SCAP: American Express Com-pany; Bank of America Corporation; The Bank of New York Mellon Cor-poration; BB&T Corporation; Capital One Financial Corporation; Citi-group, Inc.; Fifth Third Bancorp; GMAC LLC; The Goldman SachsGroup, Inc.; JPMorgan Chase & Co.; KeyCorp; MetLife, Inc.; MorganStanley; PNC Financial Services Group, Inc.; Regions Financial Corpora-tion; State Street Corporation; SunTrust Banks, Inc.; U.S. Bancorp; andWells Fargo & Company Bank Holding Company.
4. The two scenarios consisted of a ‘‘baseline scenario’’ and a ‘‘moreadverse scenario.’’ The baseline scenario relied on a consensus view aboutthe depth and duration of the recession, assuming real GDP growth and theunemployment rate for 2009 and 2010 equal to the average of the projec-tions published by Consensus Forecasts, the Blue Chip survey, and theSurvey of Professional Forecasters as of February 2009. In addition, houseprices were assumed to be in line with futures prices for the S&P/Case-Shiller 10-city composite index in late February and with the average re-sponse to a special question on house prices in the Blue Chip survey. Themore adverse scenario was designed to characterize a recession longer andmore severe than the consensus expectation, with house prices assumed tobe significantly lower by the end of 2010 than in the baseline scenario.
A20 Federal Reserve Bulletin h May 2010

TRENDS IN PROFITABILITY
Total annual net income of the commercial bankingindustry as a percentage of average assets remaineddepressed in 2009, as profits were weighed down byhigh levels of loss provisioning. Elevated provisionswere offset by higher noninterest income, particularlyincome from capital-market-related activities. Netinterest margins remained basically unchanged, andnoninterest expense edged down despite significantincreases in FDIC assessments. Notably, large banksposted a small profit, on balance, while other banksended the year with an aggregate loss.
Return on assets for the banking industry as awhole stayed very low by historical standards at0.04 percent, and return on equity was 0.42 percent,with both profitability measures depressed by el-
evated loss provisioning amid the deterioration incredit quality. Banks increased provisioning to1.95 percent of industry average consolidated assetsin 2009, up from 1.48 percent in 2008. At the sametime, charge-offs surged to 1.47 percent of industryassets—compared with 0.83 percent in 2008—limiting the rise in the stock of loan loss reserves, anddelinquency rates increased dramatically throughout2009. Although the rate of provisioning edged downin the final quarter of last year, consistent withreduced charge-offs in some loan categories, somemeasures of reserve adequacy remained very low.
Despite the high levels of provisioning, the ROA atlarge banks increased from 0.04 percent in 2008 to0.12 percent in 2009. The improvement in profitabil-ity was due mainly to a rebound in these banks’
Treasury investments through the CPP and, eventually,other TARP programs (figure C, bottom panel). Otherbanks also issued equity in the second half of 2009 to bol-ster their capital or repay CPP investments. The preferredshares owned by the government were replaced primarilywith common stock held by private investors. Reflectingthe inflow of both government and private capital toBHCs, capital transfers by the BHCs to their commercialbank subsidiaries were strong throughout 2009.
While the CPP and SCAP helped reduce the uncertaintyabout the capital adequacy of large financial institutionsand contributed to improved market functioning, it is dif-ficult to assess the extent to which the CPP and SCAPsucceeded in fostering lending to creditworthy businessesand households. Banks’ lending activity, as measured bythe sum of total loans and unused loan commitments out-standing, fell substantially last year, and lending standardsand terms continued to tighten according to the FederalReserve’s Senior Loan Officer Opinion Survey on BankLending Practices. However, some of the fall in creditwas likely due to weaker demand by households and busi-nesses as the economy remained fragile. In addition, atleast some tightening of credit standards and terms is alsoto be expected when economic growth is weak or uncer-tain, and so a tightening may not reflect pressures on capi-tal. Indeed, credit might have been even weaker and lend-ing standards even tighter without the programs.
One can say, however, that the cumulative magnitudeof the capital transfers that were stimulated by the CPPand SCAP was substantial. Without the capital transfersfrom parent BHCs since the fourth quarter of 2008, theregulatory capital ratios of commercial banks would havebeen 11⁄2 to 2 percentage points lower at the end of 2009.Although some of that difference in regulatory capital ra-tios in the absence of the CPP likely would have beenmade up through other means, such as stock sales andconversions, a further decrease in risk-weighted assets andaverage tangible assets may also have resulted.
+
_0
50
100
150
200
250
Billions of dollars
201020092008
C. Outstanding balance in the Capital Purchase Program, and cumulative gross secondary equity issuance, October 2008–February 2010
Outstanding CPP balance
SCAP banks
Total
+
_0
50
100
150
201020092008
Cumulative gross secondary equity issuance
SCAP banks
Financial companies
NOTE: The data are daily and extend from October 28, 2008, toFebruary 24, 2010. CPP is the Capital Purchase Program; SCAP is theSupervisory Capital Assessment Program.
SOURCE: For outstanding CPP balance, Department of the Treasury; forcumulative gross secondary equity issuance, Securities Data CorporationNew Issues Database.
Profits and Balance Sheet Developments at U.S. Commercial Banks in 2009 A21

noninterest income. In particular, trading revenue atlarge banks was boosted by significant improvementsin financial markets throughout the year, includinghigher equity prices and lower interest rates on corpo-rate bonds and other securities. In addition, relative to2008, less noninterest expense, smaller losses onsecurities held in investment accounts, and improve-ments in net interest income supported earnings forthe 100 largest banks. The improvement in net inter-est income was attributable to significant inflows ofrelatively low-cost core deposits, allowing banks torun off their more expensive managed liabilities.However, the improvement in profitability among thelargest institutions was not uniform (figure 26, toppanel). Forty-three of the top 100 banks—accountingfor about 35 percent of the assets of such banks—incurred losses, compared with 35 of the top 100banks in 2008.
In contrast, the fourth quarter of 2009 marked thesixth consecutive quarter of losses at small and
medium-sized banks. ROA for such banks fell tonegative 0.29 percent in 2009 from 0.10 percent inthe previous year. The modest leftward shift in thedistribution of ROA for such banks in 2009 reflects adeterioration in profitability for the group as a whole(figure 26, bottom panel). The fraction of small andmedium-sized banks that incurred annual losses in-creased to about 30 percent in 2009, up from 23 per-cent in 2008. These institutions accounted for about36 percent of assets at all small and medium-sizedbanks.
Several factors contributed to the weaker perfor-mance of smaller banks relative to larger ones.Smaller banks are not active in the capital marketactivities that provided a substantial source of rev-enue for large banks. In addition, smaller banks arerelatively more exposed to the deterioration in loanquality, as loans compose a higher percentage of theirassets. On the cost side, smaller banks could notsubstitute additional core deposits for managed liabili-ties to the same degree as large banks, as smallerbanks already relied significantly on low-cost depos-its for funding.
Interest Income and Expense
Overall, banks earned an average of 4.62 percent ontheir interest-earning assets in 2009, down from5.72 percent in the previous year. The decline was duepartly to large compositional shifts in banks’ assetsfrom loans to securities, an asset class that typicallycarries lower average interest rates. Indeed, the aver-age effective interest rate on loans last year was5.54 percent, while the rate on securities was signifi-cantly lower at 4.15 percent. However, the effectiveinterest rate earned on loans net of provisioning fellsharply to just 2.10 percent, an unusually low rate ofreturn by historical standards. The deterioration inloan quality also significantly reduced banks’ interestincome, as large fractions of loans that had yet to becharged off moved to nonaccrual status.
Meanwhile, consistent with the extended period ofaccommodative monetary policy, the average interestrate that banks paid on their interest-bearing liabilitiesfell steeply again, from 2.53 percent in 2008 to1.30 percent in 2009. However, banks’ use of substan-tial inflows of core deposits to pay down more costlymanaged liabilities was also an important factor in thedecline. Core deposits are an attractive source offunding for banks because they tend to be fairlystable, as well as carry relatively low interest costscompared with managed liabilities. Most of theincrease in core deposits last year came in the form ofsavings deposits, for which the effective interest rate
26. Distribution of return on assets at commercial banks, by size of bank and by percentage of assets at all banks in each size category, 2008–09
10
20
30
40
50
100 largest banks
-2.5 -2.0 -1.5 -1.0 -0.5 0.0 0.5 1.0 1.5 2.0 2.5
2008
Percentage of assets at top 100 banks
2009
10
20
30
40
50
Small and medium-sized banks
NOTE: Assets are deflated by a gross domestic product price deflator. Forthe definition of bank size, see the general note on the first page of the maintext.
-2.5 -2.0 -1.5 -1.0 -0.5 0.0 0.5 1.0 1.5 2.0 2.5
2008
Return on assets (percent)
Percentage of assets at all other banks
2009
A22 Federal Reserve Bulletin h May 2010

paid in 2009, measured by interest paid on suchaccounts relative to their average balances, was his-torically low at about 0.50 percent, down from1.24 percent in 2008.
On balance, the industry-wide net interest marginwas little changed in 2009 despite the reported wid-ening of spreads for many types of new loans overbanks’ cost of funds, as noted in the SLOOS, andevidence of wider spreads on newly originated com-mercial and industrial loans from the Survey of Termsof Business Lending, possibly due to a large fractionof loans moving to nonaccrual status. However, thenet interest margin for the largest banks improvednoticeably over the past two years: For banks in thetop five BHCs, net interest margins increased from3.13 percent in 2007 to 3.55 percent in 2009 (fig-ure 27, top panel). These institutions benefited themost from the decrease in funding costs associatedwith shedding higher-cost managed liabilities in favorof core deposits. Indeed, core deposits at banks in the
top five BHCs jumped from less than 33 percent ofaverage consolidated assets in 2008 to almost 39 per-cent in 2009 (figure 27, bottom panel). In addition,the substantial increase in equity capital at largeorganizations, though accounting for a small percent-age of assets, also boosted net interest margins, asneither common nor preferred dividends are includedin banks’ interest expense.
In contrast, core deposits at small and medium-sized banks have been relatively stable over the pastfew years, averaging just above 60 percent of assetssince 2006. The net interest margins at small andmedium-sized banks decreased from 3.80 percent in2008 to 3.61 percent in 2009, as the drop in their assetyields exceeded the decline in the rates they paid ontheir liabilities.
Noninterest Income and Expense
Total noninterest income rebounded in 2009 to2.07 percent of average assets. Most of the improve-ment was due to trading revenue at large banksreturning to pre-crisis levels (figure 28, top panel).However, large banks’ noninterest income was alsoboosted by a significant increase in income from netservicing fees and a substantial rise in the fair value offinancial instruments accounted for under a fair valueoption as conditions in financial markets improved.23
These improvements at large banks were offset some-what by a sizable drop in net securitization income anda small decline in income from deposit fees. Incomefrom fiduciary activities also decreased, largely be-cause of a sharp drop in the first quarter of 2009 asassets under management and the number of accountsat bank trust departments fell in the wake of the declinein stock prices. In contrast, noninterest income at smalland medium-sized banks inched down last year to1.34 percent of average assets, primarily because theyalso suffered from the decrease in income from fidu-ciary activities (figure 28, middle panel).
The divergent pattern of noninterest income be-tween the large and the other banks mostly reflectedthe different composition of their financial interme-diation activities. Trading revenue, net servicing fees,card interchange fees, and net securitization incomecomposed less than 13 percent of small and medium-sized banks’ noninterest income in 2009, compared
23. Some of the increase in the fair value of financial instrumentsmay have been related to the new fair value guidance that was issuedby the Financial Accounting Standards Board in April 2009 (FASBStaff Position FAS 157–e), which reduced the emphasis on ‘‘lasttransaction price’’ when markets are not active and transactions arelikely to be forced or distressed. Generally, larger banks have tended toadopt the fair value option more widely than smaller banks.
27. Net interest margin and core deposits as a percentage of total assets, by size of bank, 1990–2009
3.25
3.50
3.75
4.00
4.25
4.50
4.75
5.00
Percent
2009200720052003200119991997199519931991
Net interest margin
100 largest
Small and medium-sized
Banks in top 5 BHCs
25
35
45
55
65
75
Percent
Core deposits as a percentage of total assets
2009200720052003200119991997199519931991
100 largest
Small and medium-sized
Banks in top 5 BHCs
NOTE: The data are annual. Net interest margin is net interest incomedivided by average interest-earning assets. Core deposits consist oftransaction deposits, savings deposits, and small time deposits. For thedefinition of bank size, see the general note on the first page of the main text;for the definition of the top five bank holding companies (BHCs), see textnote 19.
Profits and Balance Sheet Developments at U.S. Commercial Banks in 2009 A23

with about 35 percent for large banks. For largebanks, trading revenue was boosted to pre-crisislevels by significant improvements in income frominterest rate and credit exposures as conditions infinancial markets improved (figure 28, bottom panel).The increase in net servicing fees—which includeincome from servicing mortgages, credit cards, andother off-balance-sheet assets, as well as changes inthe fair value of such servicing rights—was partly aconsequence of the consolidation of some large thrift
institutions into the banking sector in the second andfourth quarters of 2009. Further, large banks report-edly sold sizable amounts of seasoned residentialmortgage loans to the government-sponsored enter-prises last year, and some may have retained servic-ing rights to those loans. While bankcard and creditcard interchange fees continued to be an importantsource of noninterest income for large banks, netsecuritization income fell rapidly for the secondconsecutive year because of relatively subdued secu-ritization activity.24 Other noninterest income itemsnot mentioned separately already made up about35 percent of noninterest income for the industry as awhole.25
Banks’ noninterest expense edged down to 3 per-cent of average assets in 2009 (figure 29, top panel).Salaries, wages, and employee benefits composedabout 43 percent of noninterest expense, a figure thatcontinues to be fairly low by historical standards.Among other noninterest expense items, net expensesof premises and fixed assets (excluding mortgageinterest) continued to account for about 12 percent ofnoninterest expense. Goodwill impairment chargesdecreased from more than $26 billion in 2008 to about$10 billion in 2009.26 That improvement was offset,however, by rising FDIC assessment fees, whichjumped to about $17 billion in 2009 from slightly morethan $1 billion in 2008 (figure 29, bottom panel); thosefees were exceptionally elevated in the second quarterof 2009, when the FDIC levied a special assessmentfee in order to replenish the Deposit Insurance Fund(DIF) because of the growing number of bank failures.In the second half of 2009, the FDIC raised itsestimated cost of bank failures and required banks toprepay regular assessments through 2012, with higherassessment rates applied for 2011 and 2012, in order to
24. Such income is composed of net gains and losses on assets soldin the bank’s own securitization transactions net of transaction costs—this includes unrealized losses (and recoveries of unrealized losses) onloans and leases held for sale in the bank’s own securitizationtransactions and fee income from securitizations, securitization con-duits, and structured finance vehicles.
25. These other items include fees and commissions from securitiesbrokerage, investment banking, advisory services, securities under-writing, and annuity sales; underwriting income from insurance andreinsurance activities; venture capital revenue; net gains and losses onsales of assets excluding securities; and other noninterest items. Itemsreported separately already are deposit fees, net servicing fees, fidu-ciary income, trading revenue, card interchange fees, the net change inthe fair value of financial instruments, and net securitization income.
26. Banks incur goodwill impairment losses when the market valueof their business segments (or reporting units) drops below the fairvalue recorded by the company. Companies must test for impairmentof goodwill annually or when events occur that would likely reducethe fair value of a business segment (or reporting unit) below thecarrying value. Assets are written down when considered overvaluedcompared with the market value—that is, the amount that a potential(or actual) acquirer would be willing to pay (or had paid) for the assets.
28. Noninterest income, and selected components, as a proportion of total assets, by size of bank, 2002–09
Percent
1.2
1.4
1.6
1.8
2.0
2.2
2.4
2.6
2.8
3.0
20092008200720062005200420032002
Noninterest income
100 largest
Small and medium-sized
.20
.25
.30
.35
.40
.45
Percent
20092008200720062005200420032002
All banks
Deposit fees
Fiduciary income
+
_0
.1
.2
.3
.4
Percent
20092008200720062005200420032002
100 largest banks
Net servicing fees
Trading income
Net securitization income
NOTE: The data are annual. For the definition of bank size, see the generalnote on the first page of the main text.
A24 Federal Reserve Bulletin h May 2010

shore up the DIF. This prepayment was not consideredto be noninterest expense for 2009, but rather wasbooked as a prepaid asset to be expensed smoothlyover the next three years.According to the FDIC, theseprepayments totaled $46 billion for all FDIC-insuredinstitutions. Banks were able to reduce expenses inother noninterest categories, which include data pro-cessing expenses, advertising and marketing costs,and other items.27
INTERNATIONAL OPERATIONS
OF U.S. COMMERCIAL BANKS
The share of U.S. bank assets booked in foreignoffices edged down from about 121⁄2 percent at year-end 2008 to just less than 121⁄4 percent at year-end2009. Assets booked abroad remained highly concen-trated among the largest banks. Commercial banksreturned to profitability on their international opera-
tions in 2009, though losses were reported on domes-tic operations for the first time since at least 1985.However, profits at foreign offices would have beennegative and those at domestic offices positive, as wasthe case in 2008, had there not been a large reductionin internal allocations of income and expense appli-cable to foreign offices at one large bank. Before suchallocations and restructuring activity for the industryas a whole, net income from foreign offices as apercentage of average assets booked in foreign officesremained about the same as in 2008. More specifi-cally, large increases in provisioning for loans andleases held at banks’ foreign offices and a fall innoninterest income were offset by significantly smallernoninterest expense and a return to positive realizedgains in investment account securities.
Banks’ total exposures to foreign economiesthrough lending and derivatives activities increased in2009, as two investment banks with large foreignexposures became BHCs and were added to theFederal Financial Institutions Examination Council’sCountry Exposure Lending Survey (table 3). Withoutthe change in the sample of banks, such foreignexposures would have continued to decline. The vastmajority of U.S. banks’ cross-border lending andderivatives outstanding—in dollar terms—remainedin the advanced foreign economies at the end of2009.28 Lending and derivatives activities outstand-ing in Asia were about 12 percent of total foreignexposure, or 35 percent of total tier 1 capital of thebanks in the survey. Lending and derivatives expo-sures to the Latin American and the Caribbean regionsand such exposures to a selected group of EuropeanUnion countries (Greece, Ireland, Italy, Portugal, andSpain) were both about 25 percent of total tier 1capital.
DEVELOPMENTS IN EARLY 2010
U.S. economic activity continued to recover in thefirst quarter of 2010, and financial market conditionsremained broadly supportive of economic recovery.29
In particular, household spending expanded moder-ately, while business spending on equipment andsoftware rose significantly. The equity and bondmarkets continued to be an important source offunding for large corporations. Treasury yields, inter-est rates on business loans, and mortgage rates
27. Other items include amortization expense and impairmentlosses for intangible assets besides goodwill, as well as other noninter-est expense items.
28. The advanced foreign economies include Australia, Austria,Belgium, Canada, Denmark, Finland, France, Germany, Greece, Ice-land, Ireland, Israel, Italy, Japan, Luxembourg, the Netherlands,New Zealand, Norway, Portugal, South Africa, Spain, Sweden, Swit-zerland, Turkey, and the United Kingdom.
29. This section reflects information available through mid-April.
29. Noninterest expense and selected components, and other selected components of noninterest expense, as a proportion of total assets, 2002–09
+
_0
.5
1.0
1.5
2.0
2.5
3.0
3.5
4.0
Percent
20092008200720062005200420032002
Noninterest expense and selected components
Noninterest expense
Salaries and benefits
Occupancy
+
_0
.05
.10
.15
.20
.25
Percent
NOTE: The data are annual. For the definition of goodwill impairmentlosses, see text note 26. FDIC is the Federal Deposit Insurance Corporation.
Advertising and data processing
Goodwill impairmentlosses
FDIC assessments
20092008200720062005200420032002
Other selected components of noninterest expense
Profits and Balance Sheet Developments at U.S. Commercial Banks in 2009 A25

remained low by historical standards, partly due toaccommodative monetary policy. The Federal OpenMarket Committee continued to maintain a targetrange for the federal funds rate of 0 to 1⁄4 percent.Financial markets showed little effect from the end ofthe Federal Reserve’s purchases of agency mortgage-backed securities and agency debt and the expirationof most of the Federal Reserve’s emergency creditfacilities. However, unemployment remained elevated,investment in nonresidential structures declined fur-ther, and home sales generally remained low.
Amid tight credit conditions and reportedly weakdemand, loans to both businesses and householdscontinued to decline during the first three months of2010. Commercial and industrial loans contractedfurther as spreads of interest rates on such loans overcomparable-maturity market instruments climbedagain in the first quarter. Commercial real estate loansalso posted a substantial decline, which reflectedweak investment in nonresidential structures. Resi-
dential real estate loans also ran off, likely owingimportantly to greater securitizations of mortgages tothe government-sponsored enterprises and sluggishhome sales, while credit card balances continued tofall, perhaps partly in response to further increases ininterest rates on credit cards.
Bank profitability improved significantly in thefirst quarter of 2010 as many banks reported tentativeimprovements in credit quality. In particular, the fourlargest bank holding companies recorded profits inthe first quarter of 2010, as trading revenue and lowerloss provisioning boosted earnings. Indeed, the fairlybroad-based decline in loss provisioning also contrib-uted to improved earnings at many regional banks.Nevertheless, regional and smaller banks continuedto struggle with profitability as credit losses on corelending operations remained high. Moreover, failuresof smaller banks continued in 2010 at about the samepace as 2009, driven largely by credit losses oncommercial real estate lending.
Appendix tables start on p. A27
3. Exposure of U.S. banks to selected economies at year-end relative to tier 1 capital, 1998−2009
Percent
YearAsia Latin America and the Caribbean
EasternEurope
G-10 andSwitzerland1
Non-G-10developedcountries2
Total
Memo
SelectedEU
countries3All China India Korea All Mexico Brazil
1998 . . . . . . . . . . 28.2 1.0 2.2 7.1 42.9 9.9 11.3 3.5 182.5 37.1 294.3 29.72000 . . . . . . . . . . 24.0 .8 2.6 6.4 37.9 9.1 11.2 4.4 174.6 32.8 273.7 26.92002 . . . . . . . . . . 21.9 .9 2.7 5.8 38.9 20.8 8.4 5.5 172.1 21.3 259.8 23.92004 . . . . . . . . . . 32.2 1.4 4.2 15.0 31.8 16.6 6.5 6.1 198.2 37.2 305.4 25.72006 . . . . . . . . . . 34.7 4.1 6.1 13.6 30.8 16.8 5.7 6.5 174.7 38.5 285.1 23.22007 . . . . . . . . . . 44.6 4.5 9.8 14.4 35.6 17.2 8.2 9.0 219.3 48.3 356.6 27.02008 . . . . . . . . . . 30.8 3.4 6.1 10.7 25.5 12.9 5.0 5.4 166.3 35.3 263.3 20.02009 . . . . . . . . . . 35.2 6.4 6.1 11.3 25.0 12.0 7.0 4.6 198.1 39.9 302.8 25.4
Memo
Total exposure(billions ofdollars)1998 . . . . . . . . . . 69.1 2.3 5.4 17.3 105.0 24.1 27.6 8.5 446.3 90.8 719.6 72.52000 . . . . . . . . . . 68.0 2.2 7.5 18.1 107.3 25.7 31.6 12.3 494.6 93.0 775.3 76.32002 . . . . . . . . . . 69.5 2.7 8.7 18.4 123.5 66.2 26.6 17.5 546.5 67.7 824.7 75.92004 . . . . . . . . . . 125.8 5.3 16.3 58.7 124.4 65.2 25.5 23.8 775.7 145.5 1,195.4 100.62006 . . . . . . . . . . 190.5 22.7 33.6 74.8 168.9 92.5 31.5 35.5 959.1 211.2 1,565.2 127.12007 . . . . . . . . . . 249.8 25.5 54.9 80.8 199.3 96.1 46.2 50.2 1,229.0 270.5 1,998.8 151.62008 . . . . . . . . . . 217.4 24.3 43.1 75.3 179.7 90.7 35.6 37.9 1,172.9 248.6 1,856.5 141.02009 . . . . . . . . . . 328.4 59.5 56.8 105.2 233.2 111.4 65.6 42.6 1,846.2 371.9 2,822.3 236.8
Note: Exposures consist of lending and derivatives exposures for cross-border and local-office operations. Respondents may file information on onebank or on the bank holding company as a whole. For the definition of tier 1capital, see text note 21.
The 2009 data cover 69 banks (which include two large, newly formed bankholding companies) with a total of $932.1 billion in tier 1 capital. The 2008data covered 68 banks with a total of $705.1 billion in tier 1 capital.
1. The G-10 (Group of Ten) countries are Belgium, Canada, France, Ger-many, Italy, Japan, Luxembourg, the Netherlands, Sweden, and the UnitedKingdom.
2. The non-G-10 developed countries include Australia, Austria, Denmark,Finland, Greece, Iceland, Ireland, Israel, New Zealand, Norway, Portugal,South Africa, Spain, and Turkey.
3. The selected European Union (EU) countries consist of Greece, Ireland,Italy, Portugal, and Spain.
Source: Federal Financial Institutions Examination Council, Statistical Re-lease E.16, “Country Exposure Lending Survey” (www.ffiec.gov/E16.htm).
A26 Federal Reserve Bulletin h May 2010

A.1. Portfolio composition, interest rates, and income and expense, U.S. banks, 2000–09
A. All banks
Item 2000 2001 2002 2003 2004 2005 2006 2007 2008 2009
Balance sheet items as a percentage of average net consolidated assets
Interest-earning assets1 . . . . . . . . . . . . . . . . . . . . . . . . . 87.13 86.49 86.42 86.08 86.90 86.82 86.86 86.94 85.28 85.71Loans and leases (net). . . . . . . . . . . . . . . . . . . . . . . . 60.48 58.95 57.83 56.88 56.98 57.88 58.26 58.37 56.73 53.96
Commercial and industrial . . . . . . . . . . . . . . . . . 17.16 16.08 14.07 12.18 11.06 11.17 11.42 11.84 12.08 10.77U.S. addressees . . . . . . . . . . . . . . . . . . . . . . . . . 14.67 13.69 12.04 10.48 9.52 9.64 9.73 9.86 10.12 9.20Foreign addressees . . . . . . . . . . . . . . . . . . . . . . 2.49 2.39 2.04 1.70 1.54 1.53 1.70 1.98 1.96 1.57
Consumer . . . . . . . . . . . . . . . . . . . . . . . . . . . . . . . . . 9.38 9.23 9.35 9.06 9.18 9.12 8.53 8.43 8.33 8.06Credit card. . . . . . . . . . . . . . . . . . . . . . . . . . . . . . 3.52 3.69 3.78 3.55 3.87 4.06 3.73 3.72 3.68 3.59Installment and other . . . . . . . . . . . . . . . . . . . . 5.87 5.55 5.57 5.51 5.31 5.06 4.80 4.71 4.65 4.47
Real estate . . . . . . . . . . . . . . . . . . . . . . . . . . . . . . . . 27.04 27.10 28.39 29.91 30.77 32.40 33.19 33.37 31.96 32.02In domestic offices . . . . . . . . . . . . . . . . . . . . . . 26.49 26.60 27.91 29.45 30.24 31.84 32.61 32.76 31.35 31.50
Construction and land development . . . . 2.51 2.85 2.98 2.99 3.26 3.90 4.73 5.05 4.73 3.99Farmland . . . . . . . . . . . . . . . . . . . . . . . . . . . . . .56 .55 .56 .54 .54 .54 .53 .53 .52 .55One- to four-family residential. . . . . . . . . 14.96 14.67 15.40 16.96 17.42 18.26 18.23 18.31 17.29 17.59
Home equity . . . . . . . . . . . . . . . . . . . . . . . 1.96 2.18 2.80 3.40 4.34 4.95 4.71 4.49 4.60 5.07Other . . . . . . . . . . . . . . . . . . . . . . . . . . . . . . 13.00 12.49 12.60 13.57 13.08 13.31 13.51 13.82 12.70 12.52
Multifamily residential . . . . . . . . . . . . . . . . .99 .97 1.02 1.05 1.06 1.08 1.06 1.04 1.10 1.30Nonfarm nonresidential . . . . . . . . . . . . . . . 7.48 7.56 7.95 7.91 7.97 8.06 8.07 7.84 7.70 8.07
In foreign offices . . . . . . . . . . . . . . . . . . . . . . . . .54 .50 .48 .46 .53 .56 .58 .60 .61 .53To depository institutions and
acceptances of other banks . . . . . . . . . . . 1.87 1.83 1.87 1.98 2.11 1.73 1.65 1.21 1.19 1.01Foreign governments . . . . . . . . . . . . . . . . . . . . . . .12 .10 .09 .08 .08 .06 .04 .03 .02 .02Agricultural production . . . . . . . . . . . . . . . . . . . . .78 .75 .70 .63 .59 .56 .55 .52 .49 .49Other loans. . . . . . . . . . . . . . . . . . . . . . . . . . . . . . . . 2.58 2.34 2.06 2.00 2.35 2.09 2.19 2.48 2.64 2.26Lease-financing receivables . . . . . . . . . . . . . . . . 2.63 2.58 2.44 2.11 1.79 1.58 1.43 1.23 1.07 .94Less: Unearned income on loans . . . . . . . . . . . –.05 –.04 –.05 –.04 –.04 –.03 –.03 –.02 –.02 –.02Less: Loss reserves2 . . . . . . . . . . . . . . . . . . . . . . . –1.02 –1.04 –1.11 –1.03 –.91 –.79 –.71 –.70 –1.03 –1.58
Securities. . . . . . . . . . . . . . . . . . . . . . . . . . . . . . . . . . . . 20.02 19.53 21.27 21.90 22.57 22.04 21.32 20.77 19.27 20.39Investment account . . . . . . . . . . . . . . . . . . . . . . . . 17.59 16.82 18.30 18.97 18.99 17.87 16.89 15.41 14.13 16.62
Debt. . . . . . . . . . . . . . . . . . . . . . . . . . . . . . . . . . . . 16.93 16.48 17.99 18.72 18.79 17.71 16.73 15.23 13.95 16.36U.S. Treasury . . . . . . . . . . . . . . . . . . . . . . . . . 1.66 .85 .78 .90 .89 .62 .47 .32 .24 .52U.S. government agency and
corporation obligations . . . . . . . . . . . 10.31 10.08 11.46 12.26 12.37 11.51 10.65 9.32 8.14 9.32Government-backed mortgage pools . 4.75 5.13 6.09 6.75 7.13 6.78 6.43 5.82 5.47 6.14Collateralized mortgage obligations . . 1.92 1.95 2.35 2.34 2.01 1.80 1.58 1.34 1.27 1.52Other . . . . . . . . . . . . . . . . . . . . . . . . . . . . . . 3.63 2.99 3.02 3.17 3.22 2.93 2.65 2.16 1.40 1.66
State and local government . . . . . . . . . . . . 1.52 1.49 1.49 1.48 1.41 1.36 1.34 1.34 1.20 1.27Private mortgage-backed securities . . . . . .95 1.09 1.25 1.30 1.41 1.76 1.89 2.15 2.10 1.88Other. . . . . . . . . . . . . . . . . . . . . . . . . . . . . . . . . 2.48 2.98 3.01 2.78 2.72 2.47 2.37 2.10 2.28 3.36
Equity . . . . . . . . . . . . . . . . . . . . . . . . . . . . . . . . . . .66 .34 .31 .25 .20 .16 .16 .18 .18 .26Trading account . . . . . . . . . . . . . . . . . . . . . . . . . . . 2.43 2.72 2.97 2.93 3.59 4.17 4.43 5.36 5.13 3.77
Gross federal funds sold and reverse RPs . . . . . 4.12 5.11 4.81 4.85 4.58 4.75 5.30 5.49 6.03 4.54Balances at depositories1 . . . . . . . . . . . . . . . . . . . . . 2.52 2.90 2.52 2.46 2.76 2.14 1.98 2.30 3.25 6.82
Noninterest-earning assets1 . . . . . . . . . . . . . . . . . . . . . 12.87 13.51 13.58 13.92 13.10 13.18 13.14 13.06 14.72 14.29Revaluation gains held in trading accounts . . . . 2.28 2.37 2.42 2.70 2.19 1.82 1.64 1.73 2.83 2.78Other. . . . . . . . . . . . . . . . . . . . . . . . . . . . . . . . . . . . . . . . 10.58 11.14 11.16 11.22 10.91 11.36 11.51 11.33 11.90 11.51
Liabilities . . . . . . . . . . . . . . . . . . . . . . . . . . . . . . . . . . . . . . 91.58 91.25 90.85 90.96 90.57 89.91 89.84 89.78 90.07 89.50Core deposits . . . . . . . . . . . . . . . . . . . . . . . . . . . . . . . . 46.52 47.07 48.98 49.18 48.56 47.52 45.56 43.89 42.72 46.92
Transaction deposits . . . . . . . . . . . . . . . . . . . . . . . 11.07 10.36 10.06 9.73 9.10 8.46 7.45 6.43 6.16 6.90Demand deposits . . . . . . . . . . . . . . . . . . . . . . . . 8.61 8.00 7.67 7.26 6.58 6.16 5.41 4.66 4.53 5.06Other checkable deposits . . . . . . . . . . . . . . . . 2.46 2.36 2.39 2.47 2.52 2.30 2.04 1.77 1.63 1.84
Savings deposits (including MMDAs) . . . . . . 22.43 24.53 28.13 30.12 31.19 30.83 29.49 28.21 27.04 29.98Small time deposits . . . . . . . . . . . . . . . . . . . . . . . . 13.01 12.18 10.80 9.33 8.27 8.23 8.62 9.26 9.51 10.04
Managed liabilities3 . . . . . . . . . . . . . . . . . . . . . . . . . . 38.83 37.42 35.05 34.61 35.69 36.25 38.29 39.85 41.08 37.09Large time deposits . . . . . . . . . . . . . . . . . . . . . . . . 8.77 8.89 8.30 8.09 8.00 9.11 10.07 9.13 9.13 8.32Deposits booked in foreign offices . . . . . . . . . . 11.43 10.66 9.42 9.38 10.25 10.39 11.18 12.81 13.09 12.56Subordinated notes and debentures . . . . . . . . . 1.37 1.43 1.40 1.33 1.30 1.34 1.40 1.55 1.51 1.39Gross federal funds purchased and RPs . . . . . 7.83 7.95 7.77 7.75 7.24 7.05 7.53 7.06 6.98 6.05Other managed liabilities. . . . . . . . . . . . . . . . . . . 9.44 8.49 8.16 8.06 8.91 8.37 8.11 9.31 10.38 8.77
Revaluation losses held in trading accounts. . . . 2.29 2.21 2.09 2.30 1.95 1.67 1.51 1.59 2.27 1.98Other. . . . . . . . . . . . . . . . . . . . . . . . . . . . . . . . . . . . . . . . 3.94 4.54 4.73 4.87 4.36 4.47 4.47 4.44 4.01 3.51
Capital account . . . . . . . . . . . . . . . . . . . . . . . . . . . . . . . . 8.42 8.75 9.15 9.04 9.43 10.09 10.16 10.22 9.93 10.50
Memo
Commercial real estate loans4 . . . . . . . . . . . . . . . . . . . 11.58 12.09 12.57 12.47 12.78 13.52 14.35 14.47 14.10 13.91Other real estate owned5. . . . . . . . . . . . . . . . . . . . . . . . .05 .05 .06 .06 .06 .04 .05 .07 .13 .28Mortgage-backed securities . . . . . . . . . . . . . . . . . . . . . 7.63 8.17 9.69 10.39 10.56 10.33 9.89 9.31 8.84 9.55Federal Home Loan Bank advances . . . . . . . . . . . . . n.a. 2.89 3.17 3.19 3.07 3.04 3.07 3.66 4.45 3.77Balances at the Federal Reserve1 . . . . . . . . . . . . . . . .42 .40 .38 .40 .35 .29 .24 .20 3.44 4.14
Interest-earning . . . . . . . . . . . . . . . . . . . . . . . . . . . . . . n.a. n.a. n.a. n.a. n.a. n.a. n.a. n.a. 3.00 4.14Noninterest-earning . . . . . . . . . . . . . . . . . . . . . . . . . . .42 .40 .38 .40 .35 .29 .24 .20 .44 n.a.
Interest-earning balances at depositoriesother than the Federal Reserve . . . . . . . . . . . . . 2.52 2.90 2.52 2.46 2.76 2.14 1.98 2.30 2.69 2.68
Average net consolidated assets(billions of dollars) . . . . . . . . . . . . . . . . . . . . . . . . 5,907 6,334 6,635 7,249 7,879 8,592 9,427 10,396 11,578 11,869
Profits and Balance Sheet Developments at U.S. Commercial Banks in 2009 A27
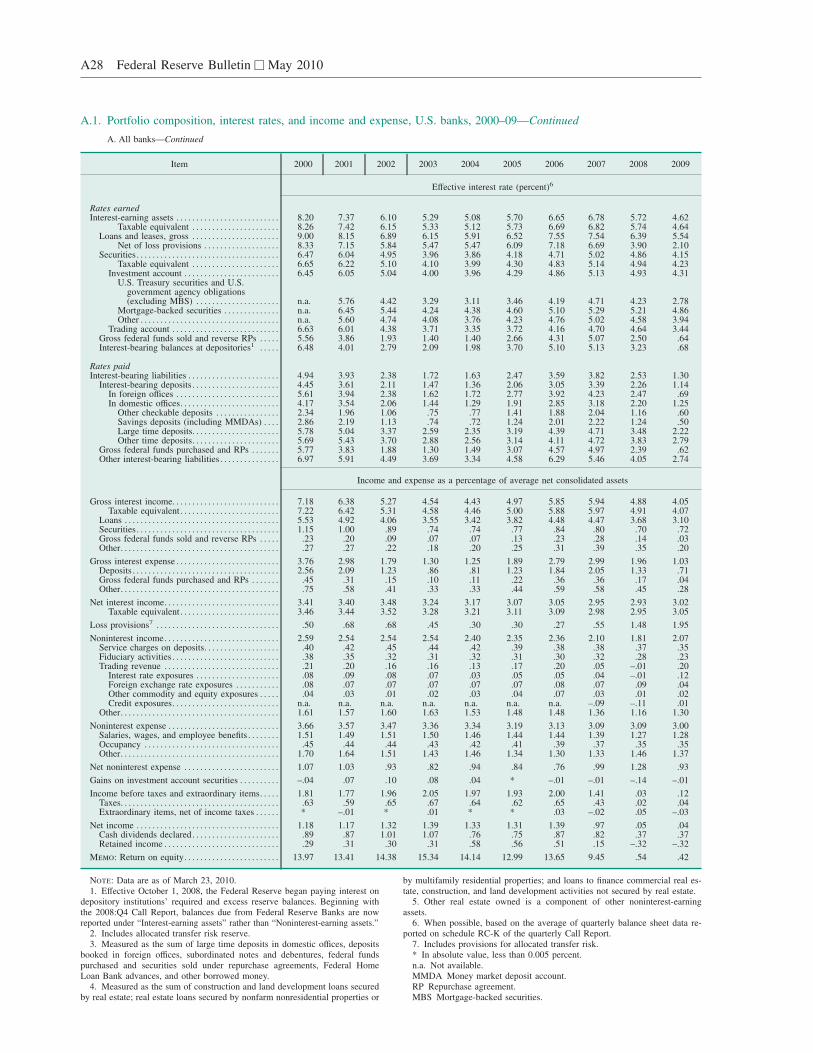
A.1. Portfolio composition, interest rates, and income and expense, U.S. banks, 2000–09—Continued
A. All banks—Continued
Item 2000 2001 2002 2003 2004 2005 2006 2007 2008 2009
Effective interest rate (percent)6
Rates earnedInterest-earning assets . . . . . . . . . . . . . . . . . . . . . . . . . . 8.20 7.37 6.10 5.29 5.08 5.70 6.65 6.78 5.72 4.62
Taxable equivalent . . . . . . . . . . . . . . . . . . . . . . 8.26 7.42 6.15 5.33 5.12 5.73 6.69 6.82 5.74 4.64Loans and leases, gross . . . . . . . . . . . . . . . . . . . . . . 9.00 8.15 6.89 6.15 5.91 6.52 7.55 7.54 6.39 5.54
Net of loss provisions . . . . . . . . . . . . . . . . . . . 8.33 7.15 5.84 5.47 5.47 6.09 7.18 6.69 3.90 2.10Securities. . . . . . . . . . . . . . . . . . . . . . . . . . . . . . . . . . . . 6.47 6.04 4.95 3.96 3.86 4.18 4.71 5.02 4.86 4.15
Taxable equivalent . . . . . . . . . . . . . . . . . . . . . . 6.65 6.22 5.10 4.10 3.99 4.30 4.83 5.14 4.94 4.23Investment account . . . . . . . . . . . . . . . . . . . . . . . . 6.45 6.05 5.04 4.00 3.96 4.29 4.86 5.13 4.93 4.31
U.S. Treasury securities and U.S.government agency obligations(excluding MBS) . . . . . . . . . . . . . . . . . . . . . n.a. 5.76 4.42 3.29 3.11 3.46 4.19 4.71 4.23 2.78
Mortgage-backed securities . . . . . . . . . . . . . . n.a. 6.45 5.44 4.24 4.38 4.60 5.10 5.29 5.21 4.86Other . . . . . . . . . . . . . . . . . . . . . . . . . . . . . . . . . . . n.a. 5.60 4.74 4.08 3.76 4.23 4.76 5.02 4.58 3.94
Trading account . . . . . . . . . . . . . . . . . . . . . . . . . . . 6.63 6.01 4.38 3.71 3.35 3.72 4.16 4.70 4.64 3.44Gross federal funds sold and reverse RPs . . . . . 5.56 3.86 1.93 1.40 1.40 2.66 4.31 5.07 2.50 .64Interest-bearing balances at depositories1 . . . . . 6.48 4.01 2.79 2.09 1.98 3.70 5.10 5.13 3.23 .68
Rates paidInterest-bearing liabilities . . . . . . . . . . . . . . . . . . . . . . . 4.94 3.93 2.38 1.72 1.63 2.47 3.59 3.82 2.53 1.30
Interest-bearing deposits . . . . . . . . . . . . . . . . . . . . . . 4.45 3.61 2.11 1.47 1.36 2.06 3.05 3.39 2.26 1.14In foreign offices . . . . . . . . . . . . . . . . . . . . . . . . . . 5.61 3.94 2.38 1.62 1.72 2.77 3.92 4.23 2.47 .69In domestic offices. . . . . . . . . . . . . . . . . . . . . . . . . 4.17 3.54 2.06 1.44 1.29 1.91 2.85 3.18 2.20 1.25
Other checkable deposits . . . . . . . . . . . . . . . . 2.34 1.96 1.06 .75 .77 1.41 1.88 2.04 1.16 .60Savings deposits (including MMDAs) . . . . 2.86 2.19 1.13 .74 .72 1.24 2.01 2.22 1.24 .50Large time deposits. . . . . . . . . . . . . . . . . . . . . . 5.78 5.04 3.37 2.59 2.35 3.19 4.39 4.71 3.48 2.22Other time deposits. . . . . . . . . . . . . . . . . . . . . . 5.69 5.43 3.70 2.88 2.56 3.14 4.11 4.72 3.83 2.79
Gross federal funds purchased and RPs . . . . . . . 5.77 3.83 1.88 1.30 1.49 3.07 4.57 4.97 2.39 .62Other interest-bearing liabilities . . . . . . . . . . . . . . . 6.97 5.91 4.49 3.69 3.34 4.58 6.29 5.46 4.05 2.74
Income and expense as a percentage of average net consolidated assets
Gross interest income. . . . . . . . . . . . . . . . . . . . . . . . . . . 7.18 6.38 5.27 4.54 4.43 4.97 5.85 5.94 4.88 4.05Taxable equivalent . . . . . . . . . . . . . . . . . . . . . . . . . 7.22 6.42 5.31 4.58 4.46 5.00 5.88 5.97 4.91 4.07
Loans . . . . . . . . . . . . . . . . . . . . . . . . . . . . . . . . . . . . . . . 5.53 4.92 4.06 3.55 3.42 3.82 4.48 4.47 3.68 3.10Securities. . . . . . . . . . . . . . . . . . . . . . . . . . . . . . . . . . . . 1.15 1.00 .89 .74 .74 .77 .84 .80 .70 .72Gross federal funds sold and reverse RPs . . . . . .23 .20 .09 .07 .07 .13 .23 .28 .14 .03Other. . . . . . . . . . . . . . . . . . . . . . . . . . . . . . . . . . . . . . . . .27 .27 .22 .18 .20 .25 .31 .39 .35 .20
Gross interest expense . . . . . . . . . . . . . . . . . . . . . . . . . . 3.76 2.98 1.79 1.30 1.25 1.89 2.79 2.99 1.96 1.03Deposits . . . . . . . . . . . . . . . . . . . . . . . . . . . . . . . . . . . . . 2.56 2.09 1.23 .86 .81 1.23 1.84 2.05 1.33 .71Gross federal funds purchased and RPs . . . . . . . .45 .31 .15 .10 .11 .22 .36 .36 .17 .04Other. . . . . . . . . . . . . . . . . . . . . . . . . . . . . . . . . . . . . . . . .75 .58 .41 .33 .33 .44 .59 .58 .45 .28
Net interest income. . . . . . . . . . . . . . . . . . . . . . . . . . . . . 3.41 3.40 3.48 3.24 3.17 3.07 3.05 2.95 2.93 3.02Taxable equivalent . . . . . . . . . . . . . . . . . . . . . . . . . 3.46 3.44 3.52 3.28 3.21 3.11 3.09 2.98 2.95 3.05
Loss provisions7 . . . . . . . . . . . . . . . . . . . . . . . . . . . . . . . .50 .68 .68 .45 .30 .30 .27 .55 1.48 1.95
Noninterest income. . . . . . . . . . . . . . . . . . . . . . . . . . . . . 2.59 2.54 2.54 2.54 2.40 2.35 2.36 2.10 1.81 2.07Service charges on deposits. . . . . . . . . . . . . . . . . . . .40 .42 .45 .44 .42 .39 .38 .38 .37 .35Fiduciary activities . . . . . . . . . . . . . . . . . . . . . . . . . . . .38 .35 .32 .31 .32 .31 .30 .32 .28 .23Trading revenue . . . . . . . . . . . . . . . . . . . . . . . . . . . . . .21 .20 .16 .16 .13 .17 .20 .05 –.01 .20
Interest rate exposures . . . . . . . . . . . . . . . . . . . . . .08 .09 .08 .07 .03 .05 .05 .04 –.01 .12Foreign exchange rate exposures . . . . . . . . . . . .08 .07 .07 .07 .07 .07 .08 .07 .09 .04Other commodity and equity exposures . . . . . .04 .03 .01 .02 .03 .04 .07 .03 .01 .02Credit exposures. . . . . . . . . . . . . . . . . . . . . . . . . . . n.a. n.a. n.a. n.a. n.a. n.a. n.a. –.09 –.11 .01
Other. . . . . . . . . . . . . . . . . . . . . . . . . . . . . . . . . . . . . . . . 1.61 1.57 1.60 1.63 1.53 1.48 1.48 1.36 1.16 1.30
Noninterest expense . . . . . . . . . . . . . . . . . . . . . . . . . . . . 3.66 3.57 3.47 3.36 3.34 3.19 3.13 3.09 3.09 3.00Salaries, wages, and employee benefits . . . . . . . . 1.51 1.49 1.51 1.50 1.46 1.44 1.44 1.39 1.27 1.28Occupancy . . . . . . . . . . . . . . . . . . . . . . . . . . . . . . . . . . .45 .44 .44 .43 .42 .41 .39 .37 .35 .35Other. . . . . . . . . . . . . . . . . . . . . . . . . . . . . . . . . . . . . . . . 1.70 1.64 1.51 1.43 1.46 1.34 1.30 1.33 1.46 1.37
Net noninterest expense . . . . . . . . . . . . . . . . . . . . . . . . 1.07 1.03 .93 .82 .94 .84 .76 .99 1.28 .93
Gains on investment account securities . . . . . . . . . . –.04 .07 .10 .08 .04 * –.01 –.01 –.14 –.01
Income before taxes and extraordinary items. . . . . 1.81 1.77 1.96 2.05 1.97 1.93 2.00 1.41 .03 .12Taxes. . . . . . . . . . . . . . . . . . . . . . . . . . . . . . . . . . . . . . . . .63 .59 .65 .67 .64 .62 .65 .43 .02 .04Extraordinary items, net of income taxes . . . . . . * –.01 * .01 * * .03 –.02 .05 –.03
Net income . . . . . . . . . . . . . . . . . . . . . . . . . . . . . . . . . . . . 1.18 1.17 1.32 1.39 1.33 1.31 1.39 .97 .05 .04Cash dividends declared. . . . . . . . . . . . . . . . . . . . . . .89 .87 1.01 1.07 .76 .75 .87 .82 .37 .37Retained income . . . . . . . . . . . . . . . . . . . . . . . . . . . . . .29 .31 .30 .31 .58 .56 .51 .15 –.32 –.32
Memo: Return on equity. . . . . . . . . . . . . . . . . . . . . . . . 13.97 13.41 14.38 15.34 14.14 12.99 13.65 9.45 .54 .42
Note: Data are as of March 23, 2010.1. Effective October 1, 2008, the Federal Reserve began paying interest on
depository institutions’ required and excess reserve balances. Beginning withthe 2008:Q4 Call Report, balances due from Federal Reserve Banks are nowreported under “Interest-earning assets” rather than “Noninterest-earning assets.”
2. Includes allocated transfer risk reserve.3. Measured as the sum of large time deposits in domestic offices, deposits
booked in foreign offices, subordinated notes and debentures, federal fundspurchased and securities sold under repurchase agreements, Federal HomeLoan Bank advances, and other borrowed money.
4. Measured as the sum of construction and land development loans securedby real estate; real estate loans secured by nonfarm nonresidential properties or
by multifamily residential properties; and loans to finance commercial real es-tate, construction, and land development activities not secured by real estate.
5. Other real estate owned is a component of other noninterest-earningassets.
6. When possible, based on the average of quarterly balance sheet data re-ported on schedule RC-K of the quarterly Call Report.
7. Includes provisions for allocated transfer risk.* In absolute value, less than 0.005 percent.n.a. Not available.MMDA Money market deposit account.RP Repurchase agreement.MBS Mortgage-backed securities.
A28 Federal Reserve Bulletin h May 2010

A.1. Portfolio composition, interest rates, and income and expense, U.S. banks, 2000–09
B. Ten largest banks by assets
Item 2000 2001 2002 2003 2004 2005 2006 2007 2008 2009
Balance sheet items as a percentage of average net consolidated assets
Interest-earning assets1 . . . . . . . . . . . . . . . . . . . . . . . . . 82.23 81.74 81.68 81.39 83.54 83.96 84.68 85.03 83.05 83.54Loans and leases (net). . . . . . . . . . . . . . . . . . . . . . . . 55.22 53.86 53.61 52.20 51.29 51.35 52.03 53.21 50.66 46.99
Commercial and industrial . . . . . . . . . . . . . . . . . 19.87 18.82 16.16 12.98 10.54 10.61 11.20 11.58 11.85 10.21U.S. addressees . . . . . . . . . . . . . . . . . . . . . . . . . 13.95 13.42 11.69 9.40 7.49 7.74 8.08 8.05 8.45 7.52Foreign addressees . . . . . . . . . . . . . . . . . . . . . . 5.92 5.41 4.47 3.59 3.06 2.87 3.12 3.53 3.40 2.69
Consumer . . . . . . . . . . . . . . . . . . . . . . . . . . . . . . . . . 5.43 6.17 7.82 7.96 8.49 8.80 8.17 8.98 8.43 6.83Credit card. . . . . . . . . . . . . . . . . . . . . . . . . . . . . . 1.34 1.69 2.90 2.81 3.19 3.60 3.05 3.87 3.54 2.16Installment and other . . . . . . . . . . . . . . . . . . . . 4.09 4.48 4.92 5.15 5.30 5.21 5.13 5.11 4.89 4.67
Real estate . . . . . . . . . . . . . . . . . . . . . . . . . . . . . . . . 19.82 19.23 20.78 22.68 23.21 24.55 25.51 27.04 25.26 26.23In domestic offices . . . . . . . . . . . . . . . . . . . . . . 18.48 18.05 19.70 21.74 22.21 23.52 24.50 26.00 24.29 25.39
Construction and land development . . . . .98 1.27 1.42 1.36 1.40 1.70 2.01 2.01 1.86 1.87Farmland . . . . . . . . . . . . . . . . . . . . . . . . . . . . . .11 .11 .12 .10 .10 .10 .10 .09 .09 .09One- to four-family residential. . . . . . . . . 13.37 12.41 13.51 16.03 16.71 17.73 18.30 19.86 18.40 18.95
Home equity . . . . . . . . . . . . . . . . . . . . . . . 1.61 1.78 2.35 2.96 4.04 5.22 5.40 5.46 5.59 6.26Other . . . . . . . . . . . . . . . . . . . . . . . . . . . . . . 11.76 10.63 11.17 13.07 12.67 12.52 12.90 14.40 12.81 12.69
Multifamily residential . . . . . . . . . . . . . . . . .60 .51 .55 .47 .45 .44 .44 .55 .69 1.00Nonfarm nonresidential . . . . . . . . . . . . . . . 3.42 3.76 4.09 3.78 3.55 3.55 3.65 3.49 3.25 3.48
In foreign offices . . . . . . . . . . . . . . . . . . . . . . . . 1.34 1.18 1.08 .94 1.00 1.03 1.01 1.03 .97 .84To depository institutions and
acceptances of other banks . . . . . . . . . . . 3.78 3.23 3.20 3.54 4.10 3.15 2.97 1.71 1.67 1.27Foreign governments . . . . . . . . . . . . . . . . . . . . . . .28 .20 .20 .17 .16 .12 .07 .05 .02 .03Agricultural production . . . . . . . . . . . . . . . . . . . . .23 .28 .23 .19 .22 .20 .20 .17 .15 .16Other loans. . . . . . . . . . . . . . . . . . . . . . . . . . . . . . . . 3.75 3.51 2.94 2.87 3.32 2.81 2.88 3.08 3.21 2.78Lease-financing receivables . . . . . . . . . . . . . . . . 3.07 3.43 3.44 2.87 2.08 1.78 1.60 1.22 1.06 .93Less: Unearned income on loans . . . . . . . . . . . –.04 –.04 –.08 –.06 –.04 –.04 –.02 –.02 –.02 –.02Less: Loss reserves2 . . . . . . . . . . . . . . . . . . . . . . . –.97 –.97 –1.12 –1.00 –.79 –.65 –.56 –.60 –.98 –1.45
Securities. . . . . . . . . . . . . . . . . . . . . . . . . . . . . . . . . . . . 18.98 17.81 20.54 21.22 22.95 23.37 23.05 21.97 20.97 22.27Investment account . . . . . . . . . . . . . . . . . . . . . . . . 13.71 12.14 14.35 15.31 15.99 15.58 15.12 12.81 12.44 16.56
Debt. . . . . . . . . . . . . . . . . . . . . . . . . . . . . . . . . . . . 13.03 11.88 14.13 15.11 15.83 15.44 14.97 12.66 12.32 16.40U.S. Treasury . . . . . . . . . . . . . . . . . . . . . . . . . 1.96 .68 .59 .82 .86 .56 .43 .24 .16 .51U.S. government agency and
corporation obligations . . . . . . . . . . . 6.59 6.84 8.69 9.20 9.92 9.69 9.48 8.02 6.95 8.67Government-backed mortgage pools . 4.88 4.99 6.38 7.59 8.64 8.65 8.64 7.53 6.48 7.25Collateralized mortgage obligations . . .93 1.11 1.52 .91 .70 .54 .53 .33 .38 .66Other . . . . . . . . . . . . . . . . . . . . . . . . . . . . . . .78 .74 .79 .70 .58 .50 .32 .16 .09 .75
State and local government . . . . . . . . . . . . .51 .55 .59 .59 .57 .58 .64 .65 .55 .68Private mortgage-backed securities . . . . . .51 .58 .92 1.10 .96 1.18 1.09 1.45 2.01 2.35Other. . . . . . . . . . . . . . . . . . . . . . . . . . . . . . . . . 3.47 3.22 3.34 3.40 3.52 3.43 3.33 2.30 2.66 4.19
Equity . . . . . . . . . . . . . . . . . . . . . . . . . . . . . . . . . . .68 .26 .22 .20 .16 .14 .15 .16 .12 .16Trading account . . . . . . . . . . . . . . . . . . . . . . . . . . . 5.26 5.67 6.18 5.91 6.96 7.79 7.94 9.16 8.52 5.70
Gross federal funds sold and reverse RPs . . . . . 5.02 6.38 5.26 5.79 6.37 6.96 7.60 7.47 8.13 6.53Balances at depositories1 . . . . . . . . . . . . . . . . . . . . . 3.01 3.69 2.28 2.18 2.93 2.28 1.99 2.38 3.28 7.76
Noninterest-earning assets1 . . . . . . . . . . . . . . . . . . . . . 17.77 18.26 18.32 18.61 16.46 16.04 15.32 14.97 16.95 16.46Revaluation gains held in trading accounts . . . . 5.66 5.48 5.40 5.79 4.45 3.50 3.07 3.03 4.77 4.47Other. . . . . . . . . . . . . . . . . . . . . . . . . . . . . . . . . . . . . . . . 12.11 12.78 12.93 12.83 12.01 12.54 12.25 11.93 12.18 11.98
Liabilities . . . . . . . . . . . . . . . . . . . . . . . . . . . . . . . . . . . . . . 92.36 92.14 91.52 91.94 91.64 90.81 91.10 90.82 91.34 90.78Core deposits . . . . . . . . . . . . . . . . . . . . . . . . . . . . . . . . 33.28 36.38 40.61 41.07 42.02 40.18 38.03 35.08 34.49 39.62
Transaction deposits . . . . . . . . . . . . . . . . . . . . . . . 8.01 8.40 8.34 7.74 6.65 6.05 5.41 4.69 4.73 5.80Demand deposits . . . . . . . . . . . . . . . . . . . . . . . . 7.28 7.50 7.40 6.72 5.43 4.90 4.32 3.80 3.91 4.84Other checkable deposits . . . . . . . . . . . . . . . . .74 .90 .95 1.02 1.22 1.15 1.09 .89 .81 .96
Savings deposits (including MMDAs) . . . . . . 19.24 22.21 26.82 28.99 31.54 30.11 28.11 25.55 24.59 28.41Small time deposits . . . . . . . . . . . . . . . . . . . . . . . . 6.03 5.77 5.44 4.34 3.83 4.02 4.52 4.84 5.18 5.41
Managed liabilities3 . . . . . . . . . . . . . . . . . . . . . . . . . . 46.84 43.41 38.89 38.60 39.33 40.83 43.75 46.83 47.69 43.51Large time deposits . . . . . . . . . . . . . . . . . . . . . . . . 5.55 5.46 5.13 5.53 5.21 6.28 6.85 6.13 6.72 6.11Deposits booked in foreign offices . . . . . . . . . . 22.76 20.28 17.31 16.62 17.20 17.51 18.50 19.86 20.16 20.25Subordinated notes and debentures . . . . . . . . . 2.10 2.16 2.11 1.92 1.78 1.89 1.99 2.17 2.09 1.87Gross federal funds purchased and RPs . . . . . 8.89 9.04 8.83 8.62 7.79 8.39 9.51 8.42 8.18 6.79Other managed liabilities. . . . . . . . . . . . . . . . . . . 7.55 6.47 5.53 5.90 7.35 6.76 6.89 10.26 10.54 8.48
Revaluation losses held in trading accounts. . . . 5.69 5.10 4.63 4.88 3.95 3.21 2.83 2.79 3.77 3.12Other. . . . . . . . . . . . . . . . . . . . . . . . . . . . . . . . . . . . . . . . 6.55 7.26 7.39 7.40 6.34 6.60 6.47 6.12 5.39 4.53
Capital account . . . . . . . . . . . . . . . . . . . . . . . . . . . . . . . . 7.64 7.86 8.48 8.06 8.36 9.19 8.90 9.18 8.66 9.22
Memo
Commercial real estate loans4 . . . . . . . . . . . . . . . . . . . 5.87 6.68 6.92 6.31 5.99 6.33 6.73 6.64 6.37 6.92Other real estate owned5. . . . . . . . . . . . . . . . . . . . . . . . .04 .04 .03 .03 .03 .02 .03 .05 .09 .19Mortgage-backed securities . . . . . . . . . . . . . . . . . . . . . 6.32 6.68 8.82 9.60 10.30 10.36 10.25 9.31 8.87 10.27Federal Home Loan Bank advances . . . . . . . . . . . . . n.a. .82 .82 .84 .79 .63 .75 2.33 2.81 2.64Balances at the Federal Reserve1 . . . . . . . . . . . . . . . .20 .27 .23 .23 .25 .21 .17 .15 3.92 4.29
Interest-earning . . . . . . . . . . . . . . . . . . . . . . . . . . . . . . n.a. n.a. n.a. n.a. n.a. n.a. n.a. n.a. 3.61 4.29Noninterest-earning . . . . . . . . . . . . . . . . . . . . . . . . . . .20 .27 .23 .23 .25 .21 .17 .15 .32 n.a.
Interest-earning balances at depositoriesother than the Federal Reserve . . . . . . . . . . . . . 3.01 3.69 2.28 2.18 2.93 2.28 1.99 2.38 2.69 3.46
Average net consolidated assets . . . . . . . . . . . . . . . .(billions of dollars) . . . . . . . . . . . . . . . . . . . . . . . 2,234 2,527 2,785 3,148 3,654 4,232 4,759 5,469 6,241 6,379
Profits and Balance Sheet Developments at U.S. Commercial Banks in 2009 A29

A.1. Portfolio composition, interest rates, and income and expense, U.S. banks, 2000–09—Continued
B. Ten largest banks by assets—Continued
Item 2000 2001 2002 2003 2004 2005 2006 2007 2008 2009
Effective interest rate (percent)6
Rates earnedInterest-earning assets . . . . . . . . . . . . . . . . . . . . . . . . . . 7.76 6.83 5.82 4.99 4.71 5.29 6.32 6.52 5.44 4.08
Taxable equivalent . . . . . . . . . . . . . . . . . . . . . . 7.78 6.86 5.85 5.01 4.73 5.31 6.34 6.54 5.45 4.10Loans and leases, gross . . . . . . . . . . . . . . . . . . . . . . 8.46 7.50 6.52 5.76 5.52 6.15 7.36 7.33 6.14 5.00
Net of loss provisions . . . . . . . . . . . . . . . . . . . 7.92 6.55 5.30 5.19 5.29 5.84 7.02 6.29 3.23 1.55Securities. . . . . . . . . . . . . . . . . . . . . . . . . . . . . . . . . . . . 6.48 6.23 5.04 4.15 4.04 4.27 4.69 4.99 4.93 4.20
Taxable equivalent . . . . . . . . . . . . . . . . . . . . . . 6.55 6.31 5.11 4.21 4.10 4.32 4.75 5.04 4.95 4.24Investment account . . . . . . . . . . . . . . . . . . . . . . . . 6.40 6.23 5.30 4.26 4.37 4.63 5.11 5.29 5.14 4.50
U.S. Treasury securities and U.S.government agency obligations(excluding MBS) . . . . . . . . . . . . . . . . . . . . . n.a. 5.01 3.74 2.62 2.92 3.29 4.15 4.15 3.02 2.61
Mortgage-backed securities . . . . . . . . . . . . . . n.a. 6.42 5.55 4.51 4.83 4.92 5.30 5.41 5.34 4.94Other . . . . . . . . . . . . . . . . . . . . . . . . . . . . . . . . . . . n.a. 6.34 5.30 4.28 3.76 4.26 4.81 5.08 4.77 4.09
Trading account . . . . . . . . . . . . . . . . . . . . . . . . . . . 6.70 6.24 4.46 3.87 3.32 3.57 3.90 4.57 4.59 3.36Gross federal funds sold and reverse RPs . . . . . 4.93 3.86 2.20 1.60 1.43 2.46 4.07 5.06 2.59 .72Interest-bearing balances at depositories1 . . . . . 7.43 3.73 3.40 2.49 1.80 4.06 5.59 5.36 3.46 .72
Rates paidInterest-bearing liabilities . . . . . . . . . . . . . . . . . . . . . . . 5.03 3.78 2.33 1.67 1.62 2.52 3.74 3.87 2.47 1.04
Interest-bearing deposits . . . . . . . . . . . . . . . . . . . . . . 4.40 3.27 1.94 1.34 1.29 2.01 2.96 3.30 2.08 .79In foreign offices . . . . . . . . . . . . . . . . . . . . . . . . . . 5.67 4.02 2.59 1.74 1.81 2.77 3.88 4.28 2.52 .74In domestic offices. . . . . . . . . . . . . . . . . . . . . . . . . 3.51 2.84 1.67 1.18 1.08 1.70 2.55 2.80 1.85 .82
Other checkable deposits . . . . . . . . . . . . . . . . 1.61 1.67 .93 .80 .97 2.27 2.46 2.36 1.13 .47Savings deposits (including MMDAs) . . . . 2.43 1.92 1.02 .73 .71 1.15 1.87 1.98 1.10 .36Large time deposits. . . . . . . . . . . . . . . . . . . . . . 5.32 4.40 3.26 2.36 2.14 3.06 4.32 4.72 3.33 1.60Other time deposits. . . . . . . . . . . . . . . . . . . . . . 5.53 5.11 3.44 2.70 2.61 3.40 4.05 4.55 3.48 2.41
Gross federal funds purchased and RPs . . . . . . . 5.47 3.81 2.02 1.39 1.59 3.11 4.63 5.15 2.54 .54Other interest-bearing liabilities . . . . . . . . . . . . . . . 8.07 6.84 5.57 4.42 3.83 5.40 7.78 5.61 4.32 2.80
Income and expense as a percentage of average net consolidated assets
Gross interest income. . . . . . . . . . . . . . . . . . . . . . . . . . . 6.39 5.55 4.77 4.05 3.94 4.47 5.46 5.61 4.52 3.53Taxable equivalent . . . . . . . . . . . . . . . . . . . . . . . . . 6.41 5.57 4.79 4.07 3.96 4.48 5.48 5.63 4.53 3.54
Loans . . . . . . . . . . . . . . . . . . . . . . . . . . . . . . . . . . . . . . . 4.74 4.13 3.57 3.04 2.86 3.19 3.91 3.98 3.15 2.45Securities. . . . . . . . . . . . . . . . . . . . . . . . . . . . . . . . . . . . .88 .72 .73 .63 .69 .72 .80 .69 .65 .75Gross federal funds sold and reverse RPs . . . . . .25 .25 .12 .10 .10 .18 .31 .38 .20 .05Other. . . . . . . . . . . . . . . . . . . . . . . . . . . . . . . . . . . . . . . . .51 .44 .35 .28 .30 .38 .45 .56 .51 .27
Gross interest expense . . . . . . . . . . . . . . . . . . . . . . . . . . 3.60 2.69 1.65 1.19 1.20 1.89 2.88 3.00 1.88 .82Deposits . . . . . . . . . . . . . . . . . . . . . . . . . . . . . . . . . . . . . 2.33 1.74 1.05 .74 .74 1.17 1.72 1.87 1.17 .48Gross federal funds purchased and RPs . . . . . . . .49 .35 .18 .13 .13 .27 .47 .46 .21 .04Other. . . . . . . . . . . . . . . . . . . . . . . . . . . . . . . . . . . . . . . . .78 .59 .41 .33 .33 .45 .69 .68 .50 .29
Net interest income. . . . . . . . . . . . . . . . . . . . . . . . . . . . . 2.78 2.87 3.12 2.86 2.74 2.58 2.58 2.61 2.63 2.71Taxable equivalent . . . . . . . . . . . . . . . . . . . . . . . . . 2.80 2.89 3.14 2.88 2.76 2.59 2.60 2.63 2.65 2.73
Loss provisions7 . . . . . . . . . . . . . . . . . . . . . . . . . . . . . . . .38 .59 .73 .35 .16 .20 .22 .60 1.52 1.71
Noninterest income. . . . . . . . . . . . . . . . . . . . . . . . . . . . . 2.54 2.26 2.31 2.32 2.21 2.37 2.35 1.95 1.66 2.17Service charges on deposits. . . . . . . . . . . . . . . . . . . .40 .44 .48 .46 .45 .42 .41 .40 .40 .37Fiduciary activities . . . . . . . . . . . . . . . . . . . . . . . . . . . .27 .29 .25 .26 .24 .27 .23 .20 .21 .21Trading revenue . . . . . . . . . . . . . . . . . . . . . . . . . . . . . .48 .43 .32 .30 .23 .31 .37 .05 –.01 .23
Interest rate exposures . . . . . . . . . . . . . . . . . . . . . .20 .20 .15 .12 .07 .11 .09 .08 –.01 .13Foreign exchange rate exposures . . . . . . . . . . . .18 .14 .14 .14 .12 .12 .14 .09 .13 .09Other commodity and equity exposures . . . . . .11 .08 .03 .04 .04 .07 .13 .06 .03 .04Credit exposures. . . . . . . . . . . . . . . . . . . . . . . . . . . n.a. n.a. n.a. n.a. n.a. n.a. n.a. –.18 –.17 –.03
Other. . . . . . . . . . . . . . . . . . . . . . . . . . . . . . . . . . . . . . . . 1.39 1.10 1.26 1.30 1.28 1.38 1.35 1.31 1.07 1.36
Noninterest expense . . . . . . . . . . . . . . . . . . . . . . . . . . . . 3.31 3.13 3.16 3.02 3.11 2.99 2.89 2.80 2.71 2.71Salaries, wages, and employee benefits . . . . . . . . 1.46 1.38 1.41 1.39 1.34 1.38 1.39 1.32 1.20 1.28Occupancy . . . . . . . . . . . . . . . . . . . . . . . . . . . . . . . . . . .47 .45 .46 .45 .43 .43 .40 .37 .35 .36Other. . . . . . . . . . . . . . . . . . . . . . . . . . . . . . . . . . . . . . . . 1.39 1.30 1.28 1.18 1.33 1.19 1.09 1.12 1.17 1.08
Net noninterest expense . . . . . . . . . . . . . . . . . . . . . . . . .77 .87 .85 .70 .91 .62 .54 .85 1.05 .55
Gains on investment account securities . . . . . . . . . . –.03 .08 .13 .11 .07 * –.01 .02 –.05 –.03
Income before taxes and extraordinary items. . . . . 1.60 1.48 1.67 1.92 1.74 1.75 1.82 1.18 * .42Taxes. . . . . . . . . . . . . . . . . . . . . . . . . . . . . . . . . . . . . . . . .60 .49 .56 .63 .56 .57 .59 .33 –.07 .06Extraordinary items, net of income taxes . . . . . . * –.01 * * * * .02 * .09 *
Net income . . . . . . . . . . . . . . . . . . . . . . . . . . . . . . . . . . . . 1.00 .99 1.11 1.29 1.18 1.18 1.25 .85 .16 .35Cash dividends declared. . . . . . . . . . . . . . . . . . . . . . .86 .66 1.05 .99 .65 .59 .64 .60 .28 .47Retained income . . . . . . . . . . . . . . . . . . . . . . . . . . . . . .13 .32 .06 .30 .53 .59 .62 .25 –.11 –.11
Memo: Return on equity. . . . . . . . . . . . . . . . . . . . . . . . 13.04 12.55 13.14 16.06 14.07 12.86 14.08 9.23 1.89 3.81
Note: Data are as of March 23, 2010.1. Effective October 1, 2008, the Federal Reserve began paying interest on
depository institutions’ required and excess reserve balances. Beginning withthe 2008:Q4 Call Report, balances due from Federal Reserve Banks are nowreported under “Interest-earning assets” rather than “Noninterest-earning assets.”
2. Includes allocated transfer risk reserve.3. Measured as the sum of large time deposits in domestic offices, deposits
booked in foreign offices, subordinated notes and debentures, federal fundspurchased and securities sold under repurchase agreements, Federal HomeLoan Bank advances, and other borrowed money.
4. Measured as the sum of construction and land development loans securedby real estate; real estate loans secured by nonfarm nonresidential properties or
by multifamily residential properties; and loans to finance commercial real es-tate, construction, and land development activities not secured by real estate.
5. Other real estate owned is a component of other noninterest-earningassets.
6. When possible, based on the average of quarterly balance sheet data re-ported on schedule RC-K of the quarterly Call Report.
7. Includes provisions for allocated transfer risk.* In absolute value, less than 0.005 percent.n.a. Not available.MMDA Money market deposit account.RP Repurchase agreement.MBS Mortgage-backed securities.
A30 Federal Reserve Bulletin h May 2010

A.1. Portfolio composition, interest rates, and income and expense, U.S. banks, 2000–09
C. Banks ranked 11 through 100 by assets
Item 2000 2001 2002 2003 2004 2005 2006 2007 2008 2009
Balance sheet items as a percentage of average net consolidated assets
Interest-earning assets1 . . . . . . . . . . . . . . . . . . . . . . . . . 88.67 88.09 88.34 88.10 88.18 87.87 87.05 87.01 85.34 85.84Loans and leases (net). . . . . . . . . . . . . . . . . . . . . . . . 64.88 62.14 60.00 59.48 60.63 63.37 62.77 60.99 60.04 58.58
Commercial and industrial . . . . . . . . . . . . . . . . . 18.19 15.84 13.27 11.96 11.90 12.17 12.13 12.74 12.79 11.88U.S. addressees . . . . . . . . . . . . . . . . . . . . . . . . . 17.64 15.36 12.94 11.66 11.64 11.91 11.81 12.41 12.46 11.53Foreign addressees . . . . . . . . . . . . . . . . . . . . . . .55 .48 .33 .30 .26 .27 .32 .33 .34 .35
Consumer . . . . . . . . . . . . . . . . . . . . . . . . . . . . . . . . . 13.79 13.20 12.79 12.57 12.74 12.84 11.94 9.99 10.61 12.96Credit card. . . . . . . . . . . . . . . . . . . . . . . . . . . . . . 6.97 7.05 6.56 6.35 6.90 7.45 7.12 5.29 5.67 8.20Installment and other . . . . . . . . . . . . . . . . . . . . 6.82 6.15 6.22 6.21 5.83 5.39 4.82 4.70 4.94 4.76
Real estate . . . . . . . . . . . . . . . . . . . . . . . . . . . . . . . . 26.21 27.29 28.94 30.67 32.16 34.89 35.23 33.53 32.50 31.21In domestic offices . . . . . . . . . . . . . . . . . . . . . . 26.12 27.21 28.88 30.54 31.96 34.73 35.03 33.35 32.19 30.93
Construction and land development . . . . 3.00 3.31 3.36 3.22 3.51 4.21 5.27 5.95 5.65 4.45Farmland . . . . . . . . . . . . . . . . . . . . . . . . . . . . . .22 .23 .22 .20 .19 .19 .17 .21 .26 .28One- to four-family residential. . . . . . . . . 14.51 15.51 17.05 18.79 19.52 21.05 20.27 17.80 16.57 16.19
Home equity . . . . . . . . . . . . . . . . . . . . . . . 2.49 2.90 3.92 4.74 5.90 6.04 5.01 4.01 3.90 4.17Other . . . . . . . . . . . . . . . . . . . . . . . . . . . . . . 12.02 12.60 13.13 14.05 13.62 15.01 15.26 13.79 12.67 12.02
Multifamily residential . . . . . . . . . . . . . . . . 1.11 1.16 1.20 1.32 1.34 1.45 1.45 1.27 1.25 1.31Nonfarm nonresidential . . . . . . . . . . . . . . . 7.28 6.99 7.05 7.00 7.41 7.83 7.86 8.13 8.47 8.71
In foreign offices . . . . . . . . . . . . . . . . . . . . . . . . .09 .09 .06 .13 .20 .16 .21 .18 .31 .28To depository institutions and
acceptances of other banks . . . . . . . . . . . 1.05 1.40 1.44 1.21 .54 .56 .45 1.05 .94 1.07Foreign governments . . . . . . . . . . . . . . . . . . . . . . .03 .03 .02 .02 .01 .02 .01 .01 .03 .01Agricultural production . . . . . . . . . . . . . . . . . . . . .37 .32 .27 .23 .19 .19 .18 .21 .23 .22Other loans. . . . . . . . . . . . . . . . . . . . . . . . . . . . . . . . 2.57 2.03 1.80 1.59 1.87 1.62 1.88 2.43 2.56 1.98Lease-financing receivables . . . . . . . . . . . . . . . . 3.82 3.18 2.65 2.35 2.30 2.07 1.83 1.80 1.50 1.31Less: Unearned income on loans . . . . . . . . . . . –.03 –.02 –.02 –.02 –.02 –.01 –.01 –.01 –.01 –.01Less: Loss reserves2 . . . . . . . . . . . . . . . . . . . . . . . –1.12 –1.13 –1.17 –1.10 –1.06 –.97 –.87 –.75 –1.12 –2.05
Securities. . . . . . . . . . . . . . . . . . . . . . . . . . . . . . . . . . . . 17.32 19.00 20.30 21.16 21.28 19.96 19.22 19.89 16.88 18.31Investment account . . . . . . . . . . . . . . . . . . . . . . . . 16.10 17.71 19.17 20.09 20.12 18.80 17.72 17.99 14.99 15.80
Debt. . . . . . . . . . . . . . . . . . . . . . . . . . . . . . . . . . . . 15.50 17.32 18.82 19.88 19.96 18.69 17.60 17.88 14.84 15.41U.S. Treasury . . . . . . . . . . . . . . . . . . . . . . . . . 1.12 .67 .74 .95 .89 .60 .44 .38 .31 .58U.S. government agency and
corporation obligations . . . . . . . . . . . 9.70 10.09 11.45 12.99 12.80 11.62 10.07 9.06 7.72 8.66Government-backed mortgage pools . 4.31 5.19 6.00 6.08 5.74 4.83 4.04 3.73 3.76 4.56Collateralized mortgage obligations . . 2.55 2.42 2.79 3.72 3.42 3.39 2.94 2.68 2.43 2.59Other . . . . . . . . . . . . . . . . . . . . . . . . . . . . . . 2.84 2.48 2.65 3.19 3.64 3.40 3.10 2.65 1.54 1.51
State and local government . . . . . . . . . . . . .96 .99 .97 .95 .96 .98 1.01 1.16 1.03 .89Private mortgage-backed securities . . . . . 1.66 2.01 2.13 2.14 2.65 3.58 4.29 4.60 3.23 1.78Other. . . . . . . . . . . . . . . . . . . . . . . . . . . . . . . . . 2.06 3.56 3.53 2.85 2.66 1.90 1.78 2.67 2.54 3.50
Equity . . . . . . . . . . . . . . . . . . . . . . . . . . . . . . . . . . .60 .39 .34 .21 .16 .11 .12 .12 .14 .39Trading account . . . . . . . . . . . . . . . . . . . . . . . . . . . 1.22 1.29 1.13 1.07 1.16 1.16 1.50 1.90 1.89 2.52
Gross federal funds sold and reverse RPs . . . . . 3.76 4.06 4.71 4.20 2.98 2.30 2.84 3.41 4.27 2.46Balances at depositories1 . . . . . . . . . . . . . . . . . . . . . 2.71 2.88 3.33 3.26 3.29 2.24 2.22 2.72 4.16 6.48
Noninterest-earning assets1 . . . . . . . . . . . . . . . . . . . . . 11.33 11.91 11.66 11.90 11.82 12.13 12.95 12.99 14.66 14.16Revaluation gains held in trading accounts . . . . .40 .55 .47 .60 .42 .33 .30 .48 .91 1.36Other. . . . . . . . . . . . . . . . . . . . . . . . . . . . . . . . . . . . . . . . 10.92 11.37 11.19 11.30 11.40 11.80 12.65 12.51 13.75 12.80
Liabilities . . . . . . . . . . . . . . . . . . . . . . . . . . . . . . . . . . . . . . 91.57 91.15 90.79 90.65 89.87 88.86 88.08 88.40 88.17 87.01Core deposits . . . . . . . . . . . . . . . . . . . . . . . . . . . . . . . . 46.28 46.28 47.07 47.93 46.55 48.18 46.84 47.44 46.35 50.91
Transaction deposits . . . . . . . . . . . . . . . . . . . . . . . 9.93 8.37 7.49 7.29 7.06 6.64 5.74 5.15 5.13 5.44Demand deposits . . . . . . . . . . . . . . . . . . . . . . . . 8.61 7.17 6.32 5.96 5.65 5.35 4.54 3.90 3.89 3.98Other checkable deposits . . . . . . . . . . . . . . . . 1.32 1.20 1.17 1.33 1.41 1.29 1.20 1.25 1.24 1.46
Savings deposits (including MMDAs) . . . . . . 24.02 26.62 30.07 32.34 31.75 33.33 32.66 32.99 31.50 34.24Small time deposits . . . . . . . . . . . . . . . . . . . . . . . . 12.33 11.28 9.51 8.30 7.74 8.20 8.44 9.30 9.71 11.23
Managed liabilities3 . . . . . . . . . . . . . . . . . . . . . . . . . . 41.98 40.81 39.48 38.12 39.29 37.04 37.60 37.02 37.82 32.01Large time deposits . . . . . . . . . . . . . . . . . . . . . . . . 9.54 9.72 8.99 8.20 8.76 10.10 11.44 10.20 9.76 7.28Deposits booked in foreign offices . . . . . . . . . . 7.56 7.05 6.28 6.54 7.21 6.02 6.43 8.52 7.80 5.78Subordinated notes and debentures . . . . . . . . . 1.54 1.53 1.44 1.38 1.39 1.31 1.32 1.40 1.31 1.32Gross federal funds purchased and RPs . . . . . 9.28 9.71 9.66 9.69 8.95 7.17 6.74 6.79 6.72 6.63Other managed liabilities. . . . . . . . . . . . . . . . . . . 14.07 12.79 13.11 12.30 12.97 12.44 11.66 10.10 12.23 11.00
Revaluation losses held in trading accounts. . . . .41 .52 .44 .56 .40 .34 .29 .47 .85 1.10Other. . . . . . . . . . . . . . . . . . . . . . . . . . . . . . . . . . . . . . . . 2.91 3.54 3.80 4.05 3.64 3.30 3.35 3.48 3.16 2.98
Capital account . . . . . . . . . . . . . . . . . . . . . . . . . . . . . . . . 8.43 8.85 9.21 9.35 10.13 11.14 11.92 11.60 11.83 12.99
Memo
Commercial real estate loans4 . . . . . . . . . . . . . . . . . . . 12.06 12.06 12.24 12.10 12.85 13.93 15.05 15.95 16.01 15.04Other real estate owned5. . . . . . . . . . . . . . . . . . . . . . . . .03 .04 .05 .06 .05 .04 .05 .06 .10 .21Mortgage-backed securities . . . . . . . . . . . . . . . . . . . . . 8.52 9.63 10.93 11.93 11.81 11.81 11.27 11.01 9.42 8.93Federal Home Loan Bank advances . . . . . . . . . . . . . n.a. 4.07 4.85 4.75 4.65 5.19 5.54 5.35 6.45 4.82Balances at the Federal Reserve1 . . . . . . . . . . . . . . . .43 .36 .37 .37 .28 .21 .18 .19 3.89 4.73
Interest-earning . . . . . . . . . . . . . . . . . . . . . . . . . . . . . . n.a. n.a. n.a. n.a. n.a. n.a. n.a. n.a. 3.18 4.73Noninterest-earning . . . . . . . . . . . . . . . . . . . . . . . . . . .43 .36 .37 .37 .28 .21 .18 .19 .72 n.a.
Interest-earning balances at depositoriesother than the Federal Reserve . . . . . . . . . . . . . 2.71 2.88 3.33 3.26 3.29 2.24 2.22 2.72 3.43 1.75
Average net consolidated assets(billions of dollars) . . . . . . . . . . . . . . . . . . . . . . . 2,031 2,130 2,124 2,287 2,376 2,403 2,579 2,798 3,177 3,281
Profits and Balance Sheet Developments at U.S. Commercial Banks in 2009 A31

A.1. Portfolio composition, interest rates, and income and expense, U.S. banks, 2000–09—Continued
C. Banks ranked 11 through 100 by assets—Continued
Item 2000 2001 2002 2003 2004 2005 2006 2007 2008 2009
Effective interest rate (percent)6
Rates earnedInterest-earning assets . . . . . . . . . . . . . . . . . . . . . . . . . . 8.44 7.54 6.03 5.30 5.21 5.98 6.93 6.87 5.83 5.14
Taxable equivalent . . . . . . . . . . . . . . . . . . . . . . 8.48 7.58 6.07 5.33 5.24 6.02 6.97 6.91 5.85 5.16Loans and leases, gross . . . . . . . . . . . . . . . . . . . . . . 9.14 8.26 6.80 6.11 5.98 6.61 7.58 7.45 6.43 6.03
Net of loss provisions . . . . . . . . . . . . . . . . . . . 8.25 6.96 5.59 5.11 5.19 5.89 7.04 6.64 3.75 1.64Securities. . . . . . . . . . . . . . . . . . . . . . . . . . . . . . . . . . . . 6.64 5.96 4.79 3.80 3.63 4.18 4.99 5.25 4.78 4.01
Taxable equivalent . . . . . . . . . . . . . . . . . . . . . . 6.77 6.08 4.91 3.90 3.73 4.29 5.10 5.37 4.86 4.06Investment account . . . . . . . . . . . . . . . . . . . . . . . . 6.66 6.04 4.86 3.87 3.64 4.11 4.84 5.18 4.74 4.03
U.S. Treasury securities and U.S.government agency obligations(excluding MBS) . . . . . . . . . . . . . . . . . . . . . n.a. 5.83 4.28 3.17 2.94 3.47 4.28 4.85 3.92 1.95
Mortgage-backed securities . . . . . . . . . . . . . . n.a. 6.60 5.34 4.20 4.02 4.34 5.02 5.23 5.02 4.76Other . . . . . . . . . . . . . . . . . . . . . . . . . . . . . . . . . . . n.a. 5.13 4.22 3.61 3.29 4.06 4.87 5.28 4.42 3.56
Trading account . . . . . . . . . . . . . . . . . . . . . . . . . . . 6.25 4.83 3.59 2.56 3.39 5.30 6.74 5.94 5.06 3.87Gross federal funds sold and reverse RPs . . . . . 6.06 3.86 1.68 1.14 1.25 3.24 4.95 5.16 2.29 .38Interest-bearing balances at depositories1 . . . . . . 5.49 4.38 2.46 1.93 2.27 3.20 4.24 4.84 2.97 .54
Rates paidInterest-bearing liabilities . . . . . . . . . . . . . . . . . . . . . . . 4.97 3.94 2.22 1.61 1.56 2.44 3.48 3.72 2.38 1.34
Interest-bearing deposits . . . . . . . . . . . . . . . . . . . . . . 4.42 3.60 1.96 1.35 1.29 2.03 3.07 3.33 2.14 1.19In foreign offices . . . . . . . . . . . . . . . . . . . . . . . . . . 5.38 3.67 1.70 1.23 1.42 2.76 4.10 4.01 2.21 .38In domestic offices. . . . . . . . . . . . . . . . . . . . . . . . . 4.26 3.60 1.99 1.36 1.27 1.95 2.95 3.22 2.12 1.27
Other checkable deposits . . . . . . . . . . . . . . . . 2.57 2.32 .94 .64 .72 1.29 2.12 2.60 1.32 .45Savings deposits (including MMDAs) . . . . 2.94 2.30 1.08 .66 .65 1.30 2.14 2.44 1.32 .55Large time deposits. . . . . . . . . . . . . . . . . . . . . . 5.88 5.11 3.37 2.70 2.49 3.31 4.45 4.46 3.14 2.38Other time deposits. . . . . . . . . . . . . . . . . . . . . . 5.73 5.42 3.68 2.95 2.58 3.03 4.09 4.74 3.85 2.90
Gross federal funds purchased and RPs . . . . . . . 6.02 3.86 1.73 1.20 1.37 3.04 4.46 4.71 2.07 .64Other interest-bearing liabilities . . . . . . . . . . . . . . . 6.25 5.29 3.65 3.04 2.77 3.81 4.90 5.25 3.66 2.42
Income and expense as a percentage of average net consolidated assets
Gross interest income. . . . . . . . . . . . . . . . . . . . . . . . . . . 7.54 6.70 5.31 4.67 4.63 5.28 6.08 5.99 4.99 4.49Taxable equivalent . . . . . . . . . . . . . . . . . . . . . . . . . 7.57 6.73 5.34 4.70 4.65 5.31 6.11 6.02 5.01 4.50
Loans . . . . . . . . . . . . . . . . . . . . . . . . . . . . . . . . . . . . . . . 6.05 5.28 4.15 3.72 3.71 4.27 4.85 4.60 3.94 3.67Securities. . . . . . . . . . . . . . . . . . . . . . . . . . . . . . . . . . . . 1.09 1.06 .90 .75 .73 .77 .87 .93 .71 .65Gross federal funds sold and reverse RPs . . . . . .22 .15 .08 .04 .03 .06 .13 .17 .09 .01Other. . . . . . . . . . . . . . . . . . . . . . . . . . . . . . . . . . . . . . . . .18 .21 .18 .15 .15 .18 .23 .29 .24 .16
Gross interest expense . . . . . . . . . . . . . . . . . . . . . . . . . . 3.96 3.14 1.77 1.30 1.26 1.94 2.78 2.96 1.88 1.06Deposits . . . . . . . . . . . . . . . . . . . . . . . . . . . . . . . . . . . . . 2.41 2.01 1.09 .77 .74 1.18 1.84 2.04 1.26 .72Gross federal funds purchased and RPs . . . . . . . .56 .38 .17 .12 .13 .23 .30 .32 .14 .04Other. . . . . . . . . . . . . . . . . . . . . . . . . . . . . . . . . . . . . . . . .99 .75 .51 .41 .40 .53 .63 .59 .48 .30
Net interest income. . . . . . . . . . . . . . . . . . . . . . . . . . . . . 3.58 3.56 3.54 3.37 3.36 3.34 3.30 3.03 3.11 3.43Taxable equivalent . . . . . . . . . . . . . . . . . . . . . . . . . 3.61 3.59 3.57 3.40 3.39 3.37 3.33 3.06 3.13 3.45
Loss provisions7 . . . . . . . . . . . . . . . . . . . . . . . . . . . . . . . .68 .91 .80 .67 .55 .52 .41 .55 1.69 2.71
Noninterest income. . . . . . . . . . . . . . . . . . . . . . . . . . . . . 3.18 3.35 3.30 3.29 3.09 2.81 2.91 2.73 2.38 2.35Service charges on deposits. . . . . . . . . . . . . . . . . . . .42 .42 .42 .42 .40 .37 .35 .33 .32 .30Fiduciary activities . . . . . . . . . . . . . . . . . . . . . . . . . . . .52 .42 .42 .37 .42 .35 .41 .54 .41 .24Trading revenue . . . . . . . . . . . . . . . . . . . . . . . . . . . . . .07 .08 .08 .09 .07 .06 .07 .09 –.01 .26
Interest rate exposures . . . . . . . . . . . . . . . . . . . . . .02 .04 .04 .04 –.01 –.01 .02 * –.02 .18Foreign exchange rate exposures . . . . . . . . . . . .04 .03 .04 .04 .05 .04 .05 .08 .08 –.03Other commodity and equity exposures . . . . . * * * .01 .03 .02 * * * *Credit exposures. . . . . . . . . . . . . . . . . . . . . . . . . . . n.a. n.a. n.a. n.a. n.a. n.a. n.a. .01 –.06 .11
Other. . . . . . . . . . . . . . . . . . . . . . . . . . . . . . . . . . . . . . . . 2.18 2.43 2.37 2.41 2.20 2.03 2.09 1.77 1.65 1.56
Noninterest expense . . . . . . . . . . . . . . . . . . . . . . . . . . . . 4.00 3.95 3.73 3.64 3.55 3.36 3.34 3.45 3.56 3.29Salaries, wages, and employee benefits . . . . . . . . 1.44 1.47 1.49 1.47 1.45 1.37 1.34 1.32 1.22 1.14Occupancy . . . . . . . . . . . . . . . . . . . . . . . . . . . . . . . . . . .43 .42 .40 .41 .39 .37 .33 .34 .32 .31Other. . . . . . . . . . . . . . . . . . . . . . . . . . . . . . . . . . . . . . . . 2.14 2.07 1.84 1.76 1.70 1.62 1.68 1.79 2.02 1.85
Net noninterest expense . . . . . . . . . . . . . . . . . . . . . . . . .82 .60 .43 .35 .45 .55 .43 .72 1.18 .94
Gains on investment account securities . . . . . . . . . . –.05 .09 .10 .06 .03 * –.03 –.05 –.30 .01
Income before taxes and extraordinary items. . . . . 2.02 2.14 2.41 2.42 2.39 2.27 2.43 1.71 –.06 –.21Taxes. . . . . . . . . . . . . . . . . . . . . . . . . . . . . . . . . . . . . . . . .70 .74 .82 .82 .82 .77 .83 .59 .13 *Extraordinary items, net of income taxes . . . . . . * * * * * .01 .07 –.05 –.01 –.12
Net income . . . . . . . . . . . . . . . . . . . . . . . . . . . . . . . . . . . . 1.32 1.39 1.59 1.59 1.57 1.50 1.67 1.06 –.20 –.33Cash dividends declared. . . . . . . . . . . . . . . . . . . . . . .94 .96 .99 1.05 .95 1.00 1.37 1.26 .44 .18Retained income . . . . . . . . . . . . . . . . . . . . . . . . . . . . . .38 .43 .60 .54 .62 .50 .30 –.20 –.63 –.52
Memo: Return on equity. . . . . . . . . . . . . . . . . . . . . . . . 15.72 15.74 17.24 17.03 15.54 13.48 14.05 9.16 –1.67 –2.55
Note: Data are as of March 23, 2010.1. Effective October 1, 2008, the Federal Reserve began paying interest on
depository institutions’ required and excess reserve balances. Beginning withthe 2008:Q4 Call Report, balances due from Federal Reserve Banks are nowreported under “Interest-earning assets” rather than “Noninterest-earning assets.”
2. Includes allocated transfer risk reserve.3. Measured as the sum of large time deposits in domestic offices, deposits
booked in foreign offices, subordinated notes and debentures, federal fundspurchased and securities sold under repurchase agreements, Federal HomeLoan Bank advances, and other borrowed money.
4. Measured as the sum of construction and land development loans securedby real estate; real estate loans secured by nonfarm nonresidential properties or
by multifamily residential properties; and loans to finance commercial real es-tate, construction, and land development activities not secured by real estate.
5. Other real estate owned is a component of other noninterest-earningassets.
6. When possible, based on the average of quarterly balance sheet data re-ported on schedule RC-K of the quarterly Call Report.
7. Includes provisions for allocated transfer risk.* In absolute value, less than 0.005 percent.n.a. Not available.MMDA Money market deposit account.RP Repurchase agreement.MBS Mortgage-backed securities.
A32 Federal Reserve Bulletin h May 2010

A.1. Portfolio composition, interest rates, and income and expense, U.S. banks, 2000–09
D. Banks ranked 101 through 1,000 by assets
Item 2000 2001 2002 2003 2004 2005 2006 2007 2008 2009
Balance sheet items as a percentage of average net consolidated assets
Interest-earning assets1 . . . . . . . . . . . . . . . . . . . . . . . . . 91.50 91.16 91.36 91.34 91.56 91.32 91.07 91.28 91.28 91.30Loans and leases (net). . . . . . . . . . . . . . . . . . . . . . . . 62.15 62.46 61.46 61.32 63.33 65.15 67.04 68.85 70.52 67.68
Commercial and industrial . . . . . . . . . . . . . . . . . 12.95 13.03 12.38 11.50 11.52 11.78 11.68 12.07 12.58 11.38U.S. addressees . . . . . . . . . . . . . . . . . . . . . . . . . 12.60 12.65 12.06 11.20 11.21 11.48 11.45 11.80 12.31 11.17Foreign addressees . . . . . . . . . . . . . . . . . . . . . . .36 .38 .31 .31 .31 .30 .23 .27 .27 .21
Consumer . . . . . . . . . . . . . . . . . . . . . . . . . . . . . . . . . 10.19 9.76 8.13 6.80 6.33 5.42 5.50 5.35 5.15 4.73Credit card. . . . . . . . . . . . . . . . . . . . . . . . . . . . . . 3.27 3.65 2.63 1.82 1.91 1.24 1.63 1.88 1.76 1.23Installment and other . . . . . . . . . . . . . . . . . . . . 6.92 6.11 5.50 4.98 4.42 4.18 3.87 3.46 3.39 3.50
Real estate . . . . . . . . . . . . . . . . . . . . . . . . . . . . . . . . 36.93 37.64 38.92 40.95 43.38 45.86 47.88 49.50 50.78 50.00In domestic offices . . . . . . . . . . . . . . . . . . . . . . 36.91 37.62 38.89 40.90 43.32 45.78 47.78 49.41 50.77 49.99
Construction and land development . . . . 4.15 4.90 5.40 5.89 7.01 8.86 11.01 12.85 13.04 10.59Farmland . . . . . . . . . . . . . . . . . . . . . . . . . . . . . .65 .66 .73 .80 .91 .99 1.07 1.16 1.22 1.30One- to four-family residential. . . . . . . . . 17.17 16.18 15.39 15.71 15.33 15.17 14.76 14.08 14.16 14.64
Home equity . . . . . . . . . . . . . . . . . . . . . . . 2.10 2.21 2.51 2.92 3.46 3.60 3.25 3.01 3.19 3.39Other . . . . . . . . . . . . . . . . . . . . . . . . . . . . . . 15.06 13.97 12.88 12.79 11.87 11.57 11.51 11.07 10.97 11.24
Multifamily residential . . . . . . . . . . . . . . . . 1.58 1.69 1.83 2.00 2.24 2.37 2.32 2.33 2.41 2.48Nonfarm nonresidential . . . . . . . . . . . . . . . 13.36 14.18 15.55 16.51 17.82 18.39 18.63 18.99 19.95 21.00
In foreign offices . . . . . . . . . . . . . . . . . . . . . . . . .02 .02 .03 .05 .06 .08 .10 .09 * *To depository institutions and
acceptances of other banks . . . . . . . . . . . .37 .38 .37 .37 .25 .13 .14 .14 .27 .19Foreign governments . . . . . . . . . . . . . . . . . . . . . . .03 .03 .02 .02 .01 * * * * *Agricultural production . . . . . . . . . . . . . . . . . . . . .82 .85 .86 .83 .82 .81 .84 .88 .90 .92Other loans. . . . . . . . . . . . . . . . . . . . . . . . . . . . . . . . 1.22 1.22 1.18 1.25 1.32 1.36 1.20 1.22 1.37 1.47Lease-financing receivables . . . . . . . . . . . . . . . . .75 .74 .75 .67 .75 .75 .75 .65 .65 .49Less: Unearned income on loans . . . . . . . . . . . –.08 –.07 –.06 –.06 –.06 –.06 –.06 –.06 –.06 –.07Less: Loss reserves2 . . . . . . . . . . . . . . . . . . . . . . . –1.04 –1.12 –1.10 –1.02 –.98 –.90 –.88 –.91 –1.12 –1.43
Securities. . . . . . . . . . . . . . . . . . . . . . . . . . . . . . . . . . . . 24.34 22.81 23.86 24.36 23.59 21.57 19.55 18.30 16.96 17.28Investment account . . . . . . . . . . . . . . . . . . . . . . . . 24.25 22.70 23.80 24.23 23.54 21.50 19.47 18.10 16.80 17.19
Debt. . . . . . . . . . . . . . . . . . . . . . . . . . . . . . . . . . . . 23.46 22.28 23.30 23.79 23.18 21.21 19.20 17.69 16.27 16.72U.S. Treasury . . . . . . . . . . . . . . . . . . . . . . . . . 1.81 1.32 1.22 1.00 1.02 .83 .59 .47 .36 .48U.S. government agency and
corporation obligations . . . . . . . . . . . 15.56 14.70 15.85 16.96 16.70 15.05 13.55 12.32 11.32 11.53Government-backed mortgage pools . 6.22 6.27 6.55 7.03 6.80 5.73 4.83 4.57 5.24 5.34Collateralized mortgage obligations . . 3.04 3.08 3.69 3.69 3.41 3.16 2.81 2.60 2.42 2.81Other . . . . . . . . . . . . . . . . . . . . . . . . . . . . . . 6.30 5.35 5.60 6.24 6.49 6.16 5.90 5.15 3.66 3.39
State and local government . . . . . . . . . . . . 2.91 2.90 2.89 2.95 2.92 2.78 2.74 2.77 2.73 2.90Private mortgage-backed securities . . . . . .99 .94 .99 .87 1.08 1.17 1.08 1.01 .86 .83Other. . . . . . . . . . . . . . . . . . . . . . . . . . . . . . . . . 2.19 2.42 2.34 2.01 1.46 1.37 1.24 1.12 1.00 .98
Equity . . . . . . . . . . . . . . . . . . . . . . . . . . . . . . . . . . .79 .43 .50 .43 .36 .29 .27 .41 .53 .47Trading account . . . . . . . . . . . . . . . . . . . . . . . . . . . .09 .11 .06 .14 .05 .08 .07 .20 .17 .09
Gross federal funds sold and reverse RPs . . . . . 3.40 4.20 4.15 3.85 2.95 2.83 2.81 2.57 2.01 1.46Balances at depositories1 . . . . . . . . . . . . . . . . . . . . . 1.60 1.68 1.89 1.81 1.69 1.76 1.67 1.57 1.78 4.88
Noninterest-earning assets1 . . . . . . . . . . . . . . . . . . . . . 8.50 8.84 8.64 8.66 8.44 8.68 8.93 8.72 8.72 8.70Revaluation gains held in trading accounts . . . . .02 .01 .01 * * * .03 .04 .06 .03Other. . . . . . . . . . . . . . . . . . . . . . . . . . . . . . . . . . . . . . . . 8.49 8.84 8.64 8.66 8.44 8.68 8.90 8.67 8.66 8.67
Liabilities . . . . . . . . . . . . . . . . . . . . . . . . . . . . . . . . . . . . . . 90.95 90.32 89.93 89.68 89.18 89.10 89.01 88.87 89.24 89.52Core deposits . . . . . . . . . . . . . . . . . . . . . . . . . . . . . . . . 60.80 60.33 61.26 61.30 60.39 59.03 58.04 59.68 58.94 60.49
Transaction deposits . . . . . . . . . . . . . . . . . . . . . . . 12.29 11.48 11.37 11.50 11.77 11.15 9.82 8.43 7.74 8.27Demand deposits . . . . . . . . . . . . . . . . . . . . . . . . 8.97 8.23 8.05 7.96 8.12 7.87 6.99 5.94 5.32 5.51Other checkable deposits . . . . . . . . . . . . . . . . 3.32 3.25 3.32 3.54 3.64 3.28 2.83 2.49 2.42 2.76
Savings deposits (including MMDAs) . . . . . . 28.55 29.40 32.34 34.00 34.42 33.75 32.82 32.89 31.04 31.67Small time deposits . . . . . . . . . . . . . . . . . . . . . . . . 19.96 19.46 17.55 15.80 14.21 14.13 15.41 18.36 20.15 20.55
Managed liabilities3 . . . . . . . . . . . . . . . . . . . . . . . . . . 28.01 27.75 26.57 26.40 26.98 28.38 29.32 27.51 28.72 27.21Large time deposits . . . . . . . . . . . . . . . . . . . . . . . . 11.98 12.60 12.17 11.92 12.12 13.64 15.21 14.42 14.13 15.21Deposits booked in foreign offices . . . . . . . . . . 1.28 1.24 .88 .64 .65 .57 .52 .57 .72 .60Subordinated notes and debentures . . . . . . . . . .30 .31 .34 .35 .35 .27 .24 .22 .21 .16Gross federal funds purchased and RPs . . . . . 6.30 5.77 5.27 5.35 5.52 5.54 5.40 5.33 5.26 4.06Other managed liabilities. . . . . . . . . . . . . . . . . . . 8.15 7.84 7.90 8.13 8.34 8.35 7.94 6.97 8.39 7.18
Revaluation losses held in trading accounts. . . . * .01 .01 * * * .01 .01 .02 .02Other. . . . . . . . . . . . . . . . . . . . . . . . . . . . . . . . . . . . . . . . 2.13 2.23 2.08 1.98 1.81 1.69 1.64 1.66 1.57 1.80
Capital account . . . . . . . . . . . . . . . . . . . . . . . . . . . . . . . . 9.05 9.68 10.07 10.32 10.82 10.90 10.99 11.13 10.76 10.48
Memo
Commercial real estate loans4 . . . . . . . . . . . . . . . . . . . 19.32 21.03 23.05 24.62 27.28 29.84 32.22 34.52 35.86 34.51Other real estate owned5. . . . . . . . . . . . . . . . . . . . . . . . 0.07 0.08 0.10 0.11 0.10 0.08 0.08 0.11 0.27 0.62Mortgage-backed securities . . . . . . . . . . . . . . . . . . . . . 10.25 10.29 11.24 11.59 11.29 10.06 8.72 8.18 8.52 8.97Federal Home Loan Bank advances . . . . . . . . . . . . . n.a. 5.27 5.71 6.29 6.46 6.42 6.11 5.53 7.04 5.97Balances at the Federal Reserve1 . . . . . . . . . . . . . . . 0.57 0.54 0.52 0.59 0.55 0.47 0.36 0.29 1.46 3.34
Interest-earning . . . . . . . . . . . . . . . . . . . . . . . . . . . . . . n.a. n.a. n.a. n.a. n.a. n.a. n.a. n.a. 1.15 3.34Noninterest-earning . . . . . . . . . . . . . . . . . . . . . . . . . . 0.57 0.54 0.52 0.59 0.55 0.47 0.36 0.29 0.31 n.a.
Interest-earning balances at depositoriesother than the Federal Reserve . . . . . . . . . . . . . 1.60 1.68 1.89 1.81 1.69 1.76 1.67 1.57 1.54 1.53
Average net consolidated assets(billions of dollars) . . . . . . . . . . . . . . . . . . . . . . . 986 1,002 1,022 1,072 1,080 1,152 1,249 1,267 1,278 1,312
Profits and Balance Sheet Developments at U.S. Commercial Banks in 2009 A33

A.1. Portfolio composition, interest rates, and income and expense, U.S. banks, 2000–09—Continued
D. Banks ranked 101 through 1,000 by assets—Continued
Item 2000 2001 2002 2003 2004 2005 2006 2007 2008 2009
Effective interest rate (percent)6
Rates earnedInterest-earning assets . . . . . . . . . . . . . . . . . . . . . . . . . . 8.48 7.85 6.42 5.59 5.46 6.12 7.01 7.31 6.24 5.22
Taxable equivalent . . . . . . . . . . . . . . . . . . . . . . 8.56 7.94 6.50 5.67 5.53 6.19 7.08 7.38 6.30 5.28Loans and leases, gross . . . . . . . . . . . . . . . . . . . . . . 9.42 8.76 7.31 6.56 6.25 6.90 7.79 8.02 6.72 5.81
Net of loss provisions . . . . . . . . . . . . . . . . . . . 8.75 7.87 6.55 6.01 5.87 6.64 7.55 7.44 5.04 3.15Securities. . . . . . . . . . . . . . . . . . . . . . . . . . . . . . . . . . . . 6.45 5.96 4.95 3.81 3.79 4.03 4.53 4.86 4.76 4.20
Taxable equivalent . . . . . . . . . . . . . . . . . . . . . . 6.71 6.24 5.21 4.06 4.04 4.28 4.80 5.14 5.01 4.43Investment account . . . . . . . . . . . . . . . . . . . . . . . . 6.45 5.95 4.93 3.82 3.78 4.02 4.53 4.85 4.76 4.20
U.S. Treasury securities and U.S.government agency obligations(excluding MBS) . . . . . . . . . . . . . . . . . . . . . n.a. 5.85 4.54 3.42 3.15 3.47 4.19 4.74 4.45 3.19
Mortgage-backed securities . . . . . . . . . . . . . . n.a. 6.33 5.38 3.95 4.01 4.23 4.64 4.96 5.09 4.75Other . . . . . . . . . . . . . . . . . . . . . . . . . . . . . . . . . . . n.a. 5.40 4.51 4.07 4.21 4.42 4.81 4.81 4.42 3.97
Trading account . . . . . . . . . . . . . . . . . . . . . . . . . . . 9.30 6.60 14.05 3.07 10.30 6.59 4.92 5.25 4.44 4.17Gross federal funds sold and reverse RPs . . . . . 6.15 3.91 1.73 1.27 1.57 3.31 4.94 4.87 2.12 .50Interest-bearing balances at depositories1 . . . . . . 5.76 3.93 1.79 1.26 1.47 3.29 4.60 4.56 2.21 .44
Rates paidInterest-bearing liabilities . . . . . . . . . . . . . . . . . . . . . . . 4.79 3.97 2.45 1.80 1.65 2.36 3.38 3.78 2.79 1.92
Interest-bearing deposits . . . . . . . . . . . . . . . . . . . . . . 4.46 3.81 2.28 1.61 1.44 2.09 3.11 3.59 2.72 1.85In foreign offices . . . . . . . . . . . . . . . . . . . . . . . . . . 6.13 4.27 2.14 1.43 1.43 3.05 4.50 4.63 2.29 .59In domestic offices. . . . . . . . . . . . . . . . . . . . . . . . . 4.43 3.81 2.28 1.61 1.44 2.08 3.10 3.58 2.72 1.86
Other checkable deposits . . . . . . . . . . . . . . . . 2.27 1.81 1.06 .74 .72 1.18 1.74 1.89 1.17 .71Savings deposits (including MMDAs) . . . . 3.07 2.22 1.17 .75 .74 1.27 2.06 2.38 1.39 .78Large time deposits. . . . . . . . . . . . . . . . . . . . . . 6.00 5.27 3.32 2.58 2.33 3.21 4.42 4.90 3.91 2.71Other time deposits. . . . . . . . . . . . . . . . . . . . . . 5.74 5.51 3.77 2.86 2.51 3.10 4.19 4.83 4.03 2.97
Gross federal funds purchased and RPs . . . . . . . 5.95 3.82 1.83 1.29 1.45 2.94 4.52 4.49 2.30 1.15Other interest-bearing liabilities . . . . . . . . . . . . . . . 6.46 5.32 4.22 3.57 3.37 4.02 4.75 5.04 3.65 3.11
Income and expense as a percentage of average net consolidated assets
Gross interest income. . . . . . . . . . . . . . . . . . . . . . . . . . . 7.79 7.16 5.84 5.07 4.99 5.57 6.40 6.67 5.71 4.78Taxable equivalent . . . . . . . . . . . . . . . . . . . . . . . . . 7.86 7.23 5.91 5.15 5.06 5.64 6.46 6.74 5.76 4.82
Loans . . . . . . . . . . . . . . . . . . . . . . . . . . . . . . . . . . . . . . . 5.96 5.59 4.56 4.07 4.01 4.55 5.29 5.58 4.80 4.01Securities. . . . . . . . . . . . . . . . . . . . . . . . . . . . . . . . . . . . 1.58 1.33 1.15 .91 .88 .86 .89 .88 .80 .72Gross federal funds sold and reverse RPs . . . . . .21 .16 .07 .05 .05 .09 .14 .12 .04 .01Other. . . . . . . . . . . . . . . . . . . . . . . . . . . . . . . . . . . . . . . . .04 .08 .06 .05 .05 .07 .09 .09 .06 .04
Gross interest expense . . . . . . . . . . . . . . . . . . . . . . . . . . 3.79 3.14 1.92 1.41 1.29 1.84 2.67 3.00 2.24 1.55Deposits . . . . . . . . . . . . . . . . . . . . . . . . . . . . . . . . . . . . . 2.87 2.48 1.49 1.04 .92 1.34 2.04 2.41 1.81 1.28Gross federal funds purchased and RPs . . . . . . . .38 .22 .09 .07 .08 .16 .24 .24 .12 .05Other. . . . . . . . . . . . . . . . . . . . . . . . . . . . . . . . . . . . . . . . .54 .44 .34 .30 .29 .34 .39 .36 .31 .23
Net interest income. . . . . . . . . . . . . . . . . . . . . . . . . . . . . 4.00 4.02 3.92 3.67 3.70 3.73 3.73 3.67 3.47 3.22Taxable equivalent . . . . . . . . . . . . . . . . . . . . . . . . . 4.07 4.10 3.99 3.74 3.77 3.79 3.79 3.73 3.52 3.27
Loss provisions7 . . . . . . . . . . . . . . . . . . . . . . . . . . . . . . . .52 .65 .54 .40 .30 .24 .23 .47 1.25 1.88
Noninterest income. . . . . . . . . . . . . . . . . . . . . . . . . . . . . 2.35 2.37 2.36 2.30 2.26 2.02 1.98 1.88 1.52 1.57Service charges on deposits. . . . . . . . . . . . . . . . . . . .36 .39 .41 .41 .39 .36 .35 .36 .36 .34Fiduciary activities . . . . . . . . . . . . . . . . . . . . . . . . . . . .44 .40 .35 .34 .37 .35 .30 .31 .31 .27Trading revenue . . . . . . . . . . . . . . . . . . . . . . . . . . . . . .01 * * .01 .01 .01 .01 .01 –.01 .02
Interest rate exposures . . . . . . . . . . . . . . . . . . . . . .01 –.01 * .01 .01 .01 * * * *Foreign exchange rate exposures . . . . . . . . . . . * * * * * * * * * *Other commodity and equity exposures . . . . . * * * * * * * * –.01 *Credit exposures. . . . . . . . . . . . . . . . . . . . . . . . . . . n.a. n.a. n.a. n.a. n.a. n.a. n.a. * * .01
Other. . . . . . . . . . . . . . . . . . . . . . . . . . . . . . . . . . . . . . . . 1.55 1.58 1.60 1.54 1.49 1.30 1.32 1.20 .85 .94
Noninterest expense . . . . . . . . . . . . . . . . . . . . . . . . . . . . 3.84 3.88 3.72 3.59 3.54 3.37 3.35 3.26 3.42 3.36Salaries, wages, and employee benefits . . . . . . . . 1.59 1.61 1.64 1.64 1.64 1.61 1.59 1.57 1.46 1.42Occupancy . . . . . . . . . . . . . . . . . . . . . . . . . . . . . . . . . . .47 .46 .45 .43 .43 .41 .40 .40 .39 .39Other. . . . . . . . . . . . . . . . . . . . . . . . . . . . . . . . . . . . . . . . 1.78 1.81 1.63 1.53 1.48 1.36 1.35 1.28 1.58 1.55
Net noninterest expense . . . . . . . . . . . . . . . . . . . . . . . . 1.48 1.52 1.35 1.29 1.29 1.35 1.36 1.38 1.90 1.79
Gains on investment account securities . . . . . . . . . . –.04 .05 .04 .05 .02 –.01 –.01 –.01 –.22 –.02
Income before taxes and extraordinary items. . . . . 1.96 1.90 2.07 2.02 2.13 2.13 2.13 1.81 .09 –.47Taxes. . . . . . . . . . . . . . . . . . . . . . . . . . . . . . . . . . . . . . . . .67 .66 .67 .66 .68 .68 .69 .57 .14 *Extraordinary items, net of income taxes . . . . . . * .01 * .03 * * * * * *
Net income . . . . . . . . . . . . . . . . . . . . . . . . . . . . . . . . . . . . 1.29 1.25 1.39 1.39 1.45 1.45 1.43 1.23 –.05 –.47Cash dividends declared. . . . . . . . . . . . . . . . . . . . . . .92 1.33 1.19 1.64 .78 .87 .90 .91 .57 .34Retained income . . . . . . . . . . . . . . . . . . . . . . . . . . . . . .37 –.08 .20 –.25 .68 .58 .54 .32 –.62 –.80
Memo: Return on equity. . . . . . . . . . . . . . . . . . . . . . . . 14.21 12.93 13.83 13.46 13.42 13.33 13.05 11.08 –.50 –4.48
Note: Data are as of March 23, 2010.1. Effective October 1, 2008, the Federal Reserve began paying interest on
depository institutions’ required and excess reserve balances. Beginning withthe 2008:Q4 Call Report, balances due from Federal Reserve Banks are nowreported under “Interest-earning assets” rather than “Noninterest-earning assets.”
2. Includes allocated transfer risk reserve.3. Measured as the sum of large time deposits in domestic offices, deposits
booked in foreign offices, subordinated notes and debentures, federal fundspurchased and securities sold under repurchase agreements, Federal HomeLoan Bank advances, and other borrowed money.
4. Measured as the sum of construction and land development loans securedby real estate; real estate loans secured by nonfarm nonresidential properties or
by multifamily residential properties; and loans to finance commercial real es-tate, construction, and land development activities not secured by real estate.
5. Other real estate owned is a component of other noninterest-earningassets.
6. When possible, based on the average of quarterly balance sheet data re-ported on schedule RC-K of the quarterly Call Report.
7. Includes provisions for allocated transfer risk.* In absolute value, less than 0.005 percent.n.a. Not available.MMDA Money market deposit account.RP Repurchase agreement.MBS Mortgage-backed securities.
A34 Federal Reserve Bulletin h May 2010

A.1. Portfolio composition, interest rates, and income and expense, U.S. banks, 2000–09
E. Banks not ranked among the 1,000 largest by assets
Item 2000 2001 2002 2003 2004 2005 2006 2007 2008 2009
Balance sheet items as a percentage of average net consolidated assets
Interest-earning assets1 . . . . . . . . . . . . . . . . . . . . . . . . . 92.52 92.30 92.27 92.16 92.34 92.29 92.36 92.39 92.15 92.42Loans and leases (net). . . . . . . . . . . . . . . . . . . . . . . . 62.31 62.67 62.72 62.32 63.80 65.43 66.65 67.29 67.82 66.55
Commercial and industrial . . . . . . . . . . . . . . . . . 11.09 11.10 10.71 10.42 10.29 10.21 10.17 10.25 10.34 9.72U.S. addressees . . . . . . . . . . . . . . . . . . . . . . . . . 11.02 11.02 10.65 10.37 10.25 10.15 10.12 10.21 10.30 9.68Foreign addressees . . . . . . . . . . . . . . . . . . . . . . .07 .07 .06 .05 .04 .05 .04 .04 .04 .05
Consumer . . . . . . . . . . . . . . . . . . . . . . . . . . . . . . . . . 7.98 7.42 6.77 6.16 5.45 4.97 4.63 4.36 4.07 3.77Credit card. . . . . . . . . . . . . . . . . . . . . . . . . . . . . . .59 .59 .49 .51 .40 .36 .37 .37 .35 .31Installment and other . . . . . . . . . . . . . . . . . . . . 7.39 6.83 6.28 5.64 5.05 4.61 4.25 3.99 3.72 3.46
Real estate . . . . . . . . . . . . . . . . . . . . . . . . . . . . . . . . 39.29 40.30 41.52 42.30 44.75 46.97 48.54 49.28 50.10 49.93In domestic offices . . . . . . . . . . . . . . . . . . . . . . 39.29 40.30 41.52 42.30 44.74 46.97 48.53 49.28 50.10 49.93
Construction and land development . . . . 3.70 4.23 4.51 4.99 6.01 7.46 9.10 10.01 9.64 7.80Farmland . . . . . . . . . . . . . . . . . . . . . . . . . . . . . 3.06 3.04 3.08 3.13 3.22 3.25 3.26 3.38 3.49 3.64One- to four-family residential. . . . . . . . . 18.43 18.24 17.91 17.08 17.17 17.12 16.69 16.31 16.64 17.29
Home equity . . . . . . . . . . . . . . . . . . . . . . . 1.28 1.37 1.62 1.79 2.11 2.20 2.06 2.01 2.11 2.29Other . . . . . . . . . . . . . . . . . . . . . . . . . . . . . . 17.15 16.87 16.29 15.29 15.06 14.93 14.63 14.30 14.52 15.01
Multifamily residential . . . . . . . . . . . . . . . . 1.04 1.06 1.16 1.28 1.41 1.48 1.47 1.50 1.61 1.76Nonfarm nonresidential . . . . . . . . . . . . . . . 13.06 13.71 14.86 15.82 16.94 17.66 18.01 18.09 18.73 19.43
In foreign offices . . . . . . . . . . . . . . . . . . . . . . . . * * * * * * * * * *To depository institutions and
acceptances of other banks . . . . . . . . . . . .12 .12 .10 .09 .07 .05 .05 .06 .06 .06Foreign governments . . . . . . . . . . . . . . . . . . . . . . .01 * * * * * * * * *Agricultural production . . . . . . . . . . . . . . . . . . . . 3.85 3.76 3.64 3.40 3.26 3.21 3.22 3.26 3.24 3.20Other loans. . . . . . . . . . . . . . . . . . . . . . . . . . . . . . . . .69 .67 .65 .66 .68 .70 .70 .70 .73 .75Lease-financing receivables . . . . . . . . . . . . . . . . .27 .27 .31 .26 .25 .24 .26 .27 .26 .24Less: Unearned income on loans . . . . . . . . . . . –.11 –.09 –.07 –.06 –.06 –.05 –.05 –.04 –.04 –.04Less: Loss reserves2 . . . . . . . . . . . . . . . . . . . . . . . –.88 –.88 –.90 –.92 –.89 –.87 –.87 –.87 –.93 –1.09
Securities. . . . . . . . . . . . . . . . . . . . . . . . . . . . . . . . . . . . 25.40 22.80 23.34 23.47 23.34 21.92 20.54 19.65 19.20 19.22Investment account . . . . . . . . . . . . . . . . . . . . . . . . 25.38 22.79 23.33 23.43 23.34 21.91 20.52 19.58 19.16 19.18
Debt. . . . . . . . . . . . . . . . . . . . . . . . . . . . . . . . . . . . 24.82 22.49 23.05 23.12 23.07 21.70 20.35 19.41 18.97 19.00U.S. Treasury . . . . . . . . . . . . . . . . . . . . . . . . . 2.12 1.33 1.04 .90 .81 .71 .61 .47 .33 .37U.S. government agency and
corporation obligations . . . . . . . . . . . 16.95 15.27 16.07 16.23 16.57 15.64 14.73 14.01 13.44 13.12Government-backed mortgage pools . 3.47 3.78 4.54 4.84 4.76 4.23 3.62 3.55 4.80 5.15Collateralized mortgage obligations . . 1.70 1.94 2.30 2.20 1.96 1.71 1.50 1.55 1.76 1.88Other . . . . . . . . . . . . . . . . . . . . . . . . . . . . . . 11.78 9.56 9.23 9.19 9.85 9.70 9.61 8.92 6.88 6.09
State and local government . . . . . . . . . . . . 4.64 4.51 4.56 4.73 4.67 4.49 4.30 4.20 4.24 4.52Private mortgage-backed securities . . . . . .23 .27 .26 .21 .19 .22 .24 .29 .47 .48Other. . . . . . . . . . . . . . . . . . . . . . . . . . . . . . . . . .88 1.11 1.12 1.05 .83 .65 .48 .43 .49 .51
Equity . . . . . . . . . . . . . . . . . . . . . . . . . . . . . . . . . . .56 .30 .27 .31 .26 .20 .17 .17 .19 .18Trading account . . . . . . . . . . . . . . . . . . . . . . . . . . . .02 .01 .01 .04 .01 .02 .02 .07 .04 .03
Gross federal funds sold and reverse RPs . . . . . 3.22 5.01 4.26 4.27 3.33 3.24 3.53 3.92 3.29 2.44Balances at depositories1 . . . . . . . . . . . . . . . . . . . . . 1.59 1.82 1.95 2.11 1.86 1.69 1.64 1.54 1.84 4.21
Noninterest-earning assets1 . . . . . . . . . . . . . . . . . . . . . 7.48 7.70 7.73 7.84 7.66 7.71 7.64 7.61 7.85 7.58Revaluation gains held in trading accounts . . . . * * * * * * * * * *Other. . . . . . . . . . . . . . . . . . . . . . . . . . . . . . . . . . . . . . . . 7.48 7.70 7.73 7.84 7.66 7.71 7.64 7.61 7.85 7.58
Liabilities . . . . . . . . . . . . . . . . . . . . . . . . . . . . . . . . . . . . . . 89.88 89.59 89.73 89.58 89.55 89.49 89.35 88.95 89.12 89.53Core deposits . . . . . . . . . . . . . . . . . . . . . . . . . . . . . . . . 70.87 69.92 70.04 69.96 69.24 67.68 65.74 65.12 64.28 64.35
Transaction deposits . . . . . . . . . . . . . . . . . . . . . . . 23.20 22.35 22.66 23.18 23.36 22.72 20.81 18.66 17.75 17.99Demand deposits . . . . . . . . . . . . . . . . . . . . . . . . 12.64 12.16 12.24 12.58 12.77 12.77 11.97 10.73 10.07 9.87Other checkable deposits . . . . . . . . . . . . . . . . 10.57 10.19 10.42 10.60 10.59 9.95 8.84 7.93 7.68 8.12
Savings deposits (including MMDAs) . . . . . . 19.19 19.38 21.32 22.43 23.24 22.98 22.66 22.68 22.56 23.08Small time deposits . . . . . . . . . . . . . . . . . . . . . . . . 28.48 28.20 26.05 24.36 22.64 21.98 22.28 23.78 23.97 23.28
Managed liabilities3 . . . . . . . . . . . . . . . . . . . . . . . . . . 18.08 18.67 18.79 18.78 19.57 21.04 22.76 22.92 24.02 24.42Large time deposits . . . . . . . . . . . . . . . . . . . . . . . . 12.51 13.55 13.21 13.07 13.15 14.53 16.49 16.91 16.64 17.79Deposits booked in foreign offices . . . . . . . . . . .05 .06 .07 .06 .07 .06 .06 .05 .06 .05Subordinated notes and debentures . . . . . . . . . .02 .02 .04 .03 .04 .03 .03 .03 .03 .03Gross federal funds purchased and RPs . . . . . 2.06 1.55 1.51 1.52 1.76 1.74 1.82 1.82 1.87 1.49Other managed liabilities. . . . . . . . . . . . . . . . . . . 3.44 3.49 3.96 4.09 4.54 4.68 4.36 4.11 5.41 5.06
Revaluation losses held in trading accounts. . . . * * * * * * * * * *Other. . . . . . . . . . . . . . . . . . . . . . . . . . . . . . . . . . . . . . . . .93 1.00 .90 .84 .74 .77 .84 .91 .82 .76
Capital account . . . . . . . . . . . . . . . . . . . . . . . . . . . . . . . . 10.12 10.41 10.27 10.42 10.45 10.51 10.65 11.05 10.88 10.47
Memo
Commercial real estate loans4 . . . . . . . . . . . . . . . . . . . 17.91 19.15 20.67 22.23 24.50 26.77 28.81 29.88 30.34 29.28Other real estate owned5. . . . . . . . . . . . . . . . . . . . . . . . .11 .12 .14 .15 .14 .13 .12 .16 .35 .70Mortgage-backed securities . . . . . . . . . . . . . . . . . . . . . 5.39 5.99 7.10 7.25 6.91 6.16 5.36 5.39 7.03 7.51Federal Home Loan Bank advances . . . . . . . . . . . . . n.a. 3.34 3.71 3.87 4.32 4.46 4.14 3.93 5.20 4.78Balances at the Federal Reserve1 . . . . . . . . . . . . . . . .93 .76 .79 .87 .78 .70 .57 .45 1.26 2.09
Interest-earning . . . . . . . . . . . . . . . . . . . . . . . . . . . . . . n.a. n.a. n.a. n.a. n.a. n.a. n.a. n.a. .82 2.09Noninterest-earning . . . . . . . . . . . . . . . . . . . . . . . . . . .93 .76 .79 .87 .78 .70 .57 .45 .45 n.a.
Interest-earning balances at depositoriesother than the Federal Reserve . . . . . . . . . . . . . 1.59 1.82 1.95 2.11 1.86 1.69 1.64 1.54 1.71 2.12
Average net consolidated assets(billions of dollars) . . . . . . . . . . . . . . . . . . . . . . . 655 675 704 742 768 805 840 862 882 897
Profits and Balance Sheet Developments at U.S. Commercial Banks in 2009 A35

A.1. Portfolio composition, interest rates, and income and expense, U.S. banks, 2000–09—Continued
E. Banks not ranked among the 1,000 largest by assets—Continued
Item 2000 2001 2002 2003 2004 2005 2006 2007 2008 2009
Effective interest rate (percent)6
Rates earnedInterest-earning assets . . . . . . . . . . . . . . . . . . . . . . . . . . 8.44 7.92 6.79 5.94 5.73 6.23 7.01 7.26 6.34 5.53
Taxable equivalent . . . . . . . . . . . . . . . . . . . . . . 8.56 8.03 6.90 6.05 5.84 6.33 7.10 7.35 6.42 5.61Loans and leases, gross . . . . . . . . . . . . . . . . . . . . . . 9.51 9.01 7.83 7.08 6.72 7.17 7.94 8.13 7.03 6.32
Net of loss provisions . . . . . . . . . . . . . . . . . . . 9.14 8.60 7.39 6.72 6.45 6.94 7.74 7.81 6.12 4.87Securities. . . . . . . . . . . . . . . . . . . . . . . . . . . . . . . . . . . . 6.15 5.86 5.03 3.87 3.74 3.87 4.28 4.68 4.70 4.17
Taxable equivalent . . . . . . . . . . . . . . . . . . . . . . 6.54 6.27 5.43 4.26 4.11 4.24 4.65 5.05 5.04 4.51Investment account . . . . . . . . . . . . . . . . . . . . . . . . 6.15 5.86 5.02 3.87 3.73 3.86 4.28 4.68 4.70 4.16
U.S. Treasury securities and U.S.government agency obligations(excluding MBS) . . . . . . . . . . . . . . . . . . . . . n.a. 5.97 4.80 3.74 3.38 3.53 4.12 4.69 4.62 3.65
Mortgage-backed securities . . . . . . . . . . . . . . n.a. 6.20 5.47 3.58 3.90 4.17 4.59 4.96 5.08 4.67Other . . . . . . . . . . . . . . . . . . . . . . . . . . . . . . . . . . . n.a. 5.29 4.87 4.43 4.18 4.16 4.25 4.33 4.28 4.07
Trading account . . . . . . . . . . . . . . . . . . . . . . . . . . . 4.01 6.43 15.38 2.89 18.95 7.52 7.50 4.74 4.33 5.49Gross federal funds sold and reverse RPs . . . . . 6.24 3.82 1.63 1.08 1.32 3.21 4.95 5.05 2.17 .31Interest-bearing balances at depositories1 . . . . . . 6.38 4.56 2.68 1.97 2.02 3.21 4.64 5.06 3.03 1.15
Rates paidInterest-bearing liabilities . . . . . . . . . . . . . . . . . . . . . . . 4.84 4.43 2.93 2.14 1.88 2.44 3.42 3.91 3.06 2.16
Interest-bearing deposits . . . . . . . . . . . . . . . . . . . . . . 4.67 4.31 2.78 2.02 1.75 2.29 3.28 3.81 2.99 2.07In foreign offices . . . . . . . . . . . . . . . . . . . . . . . . . . 5.13 3.97 1.67 .85 1.04 2.86 4.27 4.66 2.28 .19In domestic offices. . . . . . . . . . . . . . . . . . . . . . . . . 4.67 4.31 2.78 2.02 1.75 2.29 3.28 3.80 2.99 2.07
Other checkable deposits . . . . . . . . . . . . . . . . 2.47 1.97 1.16 .78 .69 .99 1.45 1.62 1.11 .74Savings deposits (including MMDAs) . . . . 3.56 2.81 1.72 1.13 1.04 1.53 2.34 2.67 1.65 1.01Large time deposits. . . . . . . . . . . . . . . . . . . . . . 5.89 5.52 3.61 2.79 2.47 3.21 4.37 4.90 4.03 2.84Other time deposits. . . . . . . . . . . . . . . . . . . . . . 5.70 5.60 3.88 2.96 2.55 3.04 4.12 4.79 4.06 2.99
Gross federal funds purchased and RPs . . . . . . . 5.69 3.92 1.85 1.31 1.45 2.89 4.37 4.46 2.35 1.10Other interest-bearing liabilities . . . . . . . . . . . . . . . 9.13 8.08 6.82 5.31 4.59 5.01 5.70 5.81 4.49 3.89
Income and expense as a percentage of average net consolidated assets
Gross interest income. . . . . . . . . . . . . . . . . . . . . . . . . . . 7.83 7.33 6.31 5.46 5.32 5.78 6.49 6.73 5.87 5.12Taxable equivalent . . . . . . . . . . . . . . . . . . . . . . . . . 7.95 7.44 6.41 5.56 5.41 5.87 6.58 6.82 5.94 5.19
Loans . . . . . . . . . . . . . . . . . . . . . . . . . . . . . . . . . . . . . . . 5.99 5.73 5.01 4.47 4.35 4.76 5.35 5.53 4.83 4.27Securities. . . . . . . . . . . . . . . . . . . . . . . . . . . . . . . . . . . . 1.57 1.32 1.16 .89 .87 .85 .88 .92 .90 .79Gross federal funds sold and reverse RPs . . . . . .21 .20 .07 .05 .05 .11 .18 .20 .08 .01Other. . . . . . . . . . . . . . . . . . . . . . . . . . . . . . . . . . . . . . . . .05 .08 .06 .06 .05 .06 .08 .08 .07 .05
Gross interest expense . . . . . . . . . . . . . . . . . . . . . . . . . . 3.64 3.33 2.22 1.60 1.41 1.82 2.56 2.95 2.33 1.67Deposits . . . . . . . . . . . . . . . . . . . . . . . . . . . . . . . . . . . . . 3.30 3.07 1.98 1.41 1.22 1.58 2.27 2.67 2.08 1.48Gross federal funds purchased and RPs . . . . . . . .12 .06 .03 .02 .02 .05 .08 .08 .04 .02Other. . . . . . . . . . . . . . . . . . . . . . . . . . . . . . . . . . . . . . . . .21 .20 .21 .17 .17 .19 .21 .20 .21 .17
Net interest income. . . . . . . . . . . . . . . . . . . . . . . . . . . . . 4.20 4.00 4.08 3.86 3.91 3.96 3.94 3.79 3.54 3.45Taxable equivalent . . . . . . . . . . . . . . . . . . . . . . . . . 4.31 4.10 4.19 3.96 4.00 4.05 4.03 3.87 3.62 3.52
Loss provisions7 . . . . . . . . . . . . . . . . . . . . . . . . . . . . . . . .32 .33 .35 .29 .23 .21 .20 .28 .68 1.03
Noninterest income. . . . . . . . . . . . . . . . . . . . . . . . . . . . . 1.31 1.30 1.39 1.47 1.38 1.33 1.31 1.33 1.18 1.01Service charges on deposits. . . . . . . . . . . . . . . . . . . .43 .44 .45 .43 .43 .40 .38 .37 .36 .33Fiduciary activities . . . . . . . . . . . . . . . . . . . . . . . . . . . .20 .25 .27 .28 .31 .33 .36 .38 .33 .24Trading revenue . . . . . . . . . . . . . . . . . . . . . . . . . . . . . * * * * * * * * * *
Interest rate exposures . . . . . . . . . . . . . . . . . . . . . * * * * * * * * * *Foreign exchange rate exposures . . . . . . . . . . . * * * * * * * * * *Other commodity and equity exposures . . . . . * * * * * * * * * *Credit exposures. . . . . . . . . . . . . . . . . . . . . . . . . . . n.a. n.a. n.a. n.a. n.a. n.a. n.a. * * *
Other. . . . . . . . . . . . . . . . . . . . . . . . . . . . . . . . . . . . . . . . .67 .61 .67 .76 .64 .61 .57 .58 .50 .44
Noninterest expense . . . . . . . . . . . . . . . . . . . . . . . . . . . . 3.57 3.54 3.57 3.55 3.52 3.48 3.49 3.53 3.52 3.44Salaries, wages, and employee benefits . . . . . . . . 1.78 1.79 1.82 1.82 1.81 1.79 1.82 1.84 1.76 1.64Occupancy . . . . . . . . . . . . . . . . . . . . . . . . . . . . . . . . . . .47 .47 .46 .45 .45 .44 .44 .44 .44 .42Other. . . . . . . . . . . . . . . . . . . . . . . . . . . . . . . . . . . . . . . . 1.31 1.28 1.28 1.28 1.26 1.25 1.24 1.25 1.32 1.38
Net noninterest expense . . . . . . . . . . . . . . . . . . . . . . . . 2.26 2.24 2.18 2.09 2.14 2.15 2.18 2.19 2.33 2.42
Gains on investment account securities . . . . . . . . . . –.01 .04 .05 .04 .01 * –.01 * –.10 .02
Income before taxes and extraordinary items. . . . . 1.61 1.46 1.60 1.53 1.55 1.60 1.55 1.31 .42 .02Taxes. . . . . . . . . . . . . . . . . . . . . . . . . . . . . . . . . . . . . . . . .45 .39 .41 .38 .37 .38 .36 .30 .09 .04Extraordinary items, net of income taxes . . . . . . * * –.01 * * * * * * *
Net income . . . . . . . . . . . . . . . . . . . . . . . . . . . . . . . . . . . . 1.17 1.07 1.18 1.14 1.18 1.21 1.19 1.01 .33 –.02Cash dividends declared. . . . . . . . . . . . . . . . . . . . . . .79 .64 .68 .67 .64 .67 .65 .67 .57 .36Retained income . . . . . . . . . . . . . . . . . . . . . . . . . . . . . .38 .43 .50 .47 .54 .54 .53 .35 –.24 –.38
Memo: Return on equity. . . . . . . . . . . . . . . . . . . . . . . . 11.52 10.28 11.49 10.97 11.25 11.54 11.14 9.18 3.03 –.19
Note: Data are as of March 23, 2010.1. Effective October 1, 2008, the Federal Reserve began paying interest on
depository institutions’ required and excess reserve balances. Beginning withthe 2008:Q4 Call Report, balances due from Federal Reserve Banks are nowreported under “Interest-earning assets” rather than “Noninterest-earning assets.”
2. Includes allocated transfer risk reserve.3. Measured as the sum of large time deposits in domestic offices, deposits
booked in foreign offices, subordinated notes and debentures, federal fundspurchased and securities sold under repurchase agreements, Federal HomeLoan Bank advances, and other borrowed money.
4. Measured as the sum of construction and land development loans securedby real estate; real estate loans secured by nonfarm nonresidential properties or
by multifamily residential properties; and loans to finance commercial real es-tate, construction, and land development activities not secured by real estate.
5. Other real estate owned is a component of other noninterest-earningassets.
6. When possible, based on the average of quarterly balance sheet data re-ported on schedule RC-K of the quarterly Call Report.
7. Includes provisions for allocated transfer risk.* In absolute value, less than 0.005 percent.n.a. Not available.MMDA Money market deposit account.RP Repurchase agreement.MBS Mortgage-backed securities.
A36 Federal Reserve Bulletin h May 2010

A.2. Report of income, all U.S. banks, 2000–09
Millions of dollars
Item 2000 2001 2002 2003 2004 2005 2006 2007 2008 2009
Gross interest income . . . . . . . . . . . . . . . . . . . . . . 423,845 404,251 349,603 329,218 348,667 426,600 551,085 616,994 565,232 480,744Taxable equivalent . . . . . . . . . . . . . . . . . . . . 426,479 406,937 352,351 332,000 351,651 429,556 554,341 620,456 567,906 483,511
Loans. . . . . . . . . . . . . . . . . . . . . . . . . . . . . . . . . . . 326,804 311,539 269,397 257,697 269,408 328,088 421,922 464,878 426,025 367,691Securities . . . . . . . . . . . . . . . . . . . . . . . . . . . . . . . 67,666 63,061 59,311 53,316 58,577 65,864 78,913 82,710 81,547 85,803Gross federal funds sold and reverse
repurchase agreements . . . . . . . . . . . . . . . . 13,546 12,647 6,221 5,015 5,142 11,045 21,288 28,682 16,642 3,565Other . . . . . . . . . . . . . . . . . . . . . . . . . . . . . . . . . . . 15,829 17,006 14,672 13,189 15,538 21,602 28,960 40,723 41,019 23,687
Gross interest expense . . . . . . . . . . . . . . . . . . . . . 222,161 188,746 118,741 94,123 98,541 162,501 263,393 310,412 226,557 122,065Deposits . . . . . . . . . . . . . . . . . . . . . . . . . . . . . . . . 151,147 132,311 81,701 62,400 63,639 105,922 173,898 212,783 154,312 84,179Gross federal funds purchased and
repurchase agreements . . . . . . . . . . . . . . . . 26,860 19,583 9,920 7,590 8,842 19,161 33,776 37,715 19,755 4,846Other . . . . . . . . . . . . . . . . . . . . . . . . . . . . . . . . . . . 44,155 36,852 27,122 24,133 26,058 37,418 55,721 59,914 52,489 33,041
Net interest income . . . . . . . . . . . . . . . . . . . . . . . . 201,684 215,505 230,862 235,095 250,126 264,099 287,692 306,582 338,675 358,679Taxable equivalent . . . . . . . . . . . . . . . . . . . . 204,318 218,191 233,610 237,877 253,110 267,055 290,948 310,044 341,349 361,446
Loss provisions. . . . . . . . . . . . . . . . . . . . . . . . . . . . 29,386 43,084 45,206 32,742 23,894 25,579 25,386 56,749 170,777 231,927
Noninterest income . . . . . . . . . . . . . . . . . . . . . . . . 153,101 160,902 168,236 183,792 188,999 201,768 222,901 218,554 209,052 245,173Service charges on deposits . . . . . . . . . . . . . . 23,720 26,872 29,629 31,692 33,454 33,830 36,194 39,187 42,542 41,000Fiduciary activities . . . . . . . . . . . . . . . . . . . . . . 22,202 21,988 21,404 22,453 25,088 26,381 28,312 32,962 32,909 26,958Trading revenue . . . . . . . . . . . . . . . . . . . . . . . . . 12,235 12,382 10,794 11,605 10,303 14,375 19,170 5,289 –1,235 23,265Other . . . . . . . . . . . . . . . . . . . . . . . . . . . . . . . . . . . 94,945 99,658 106,410 118,042 120,154 127,180 139,226 141,116 134,839 153,952
Noninterest expense . . . . . . . . . . . . . . . . . . . . . . . 216,375 225,979 230,128 243,214 263,304 274,136 294,891 321,406 357,254 356,135Salaries, wages, and employee benefits . . . 89,016 94,196 100,447 108,446 115,254 124,038 135,869 144,700 147,502 152,289Occupancy. . . . . . . . . . . . . . . . . . . . . . . . . . . . . . 26,762 27,939 29,311 31,314 33,253 35,051 36,393 38,531 40,896 41,622Other . . . . . . . . . . . . . . . . . . . . . . . . . . . . . . . . . . . 100,598 103,846 100,368 103,453 114,797 115,048 122,630 138,177 168,855 162,224
Net noninterest expense . . . . . . . . . . . . . . . . . . . . 63,274 65,077 61,892 59,422 74,305 72,368 71,990 102,852 148,202 110,962
Gains on investment account securities . . . . . –2,280 4,630 6,411 5,633 3,393 –220 –1,320 –648 –16,432 –1,651
Income before taxes . . . . . . . . . . . . . . . . . . . . . . . 106,741 111,971 130,176 148,563 155,322 165,933 188,995 146,334 3,264 14,141Taxes . . . . . . . . . . . . . . . . . . . . . . . . . . . . . . . . . . . 37,249 37,284 42,816 48,498 50,264 53,568 60,969 44,230 2,469 4,283Extraordinary items, net of income taxes . –31 –324 –68 427 59 241 2,647 –1,672 5,382 –3,845
Net income . . . . . . . . . . . . . . . . . . . . . . . . . . . . . . . 69,461 74,363 87,291 100,494 105,115 112,604 130,674 100,431 6,178 5,220
Cash dividends declared . . . . . . . . . . . . . . . . . 52,547 54,844 67,230 77,757 59,523 64,624 82,360 85,266 43,327 43,445Retained income . . . . . . . . . . . . . . . . . . . . . . . . 16,915 19,519 20,062 22,738 45,591 47,981 48,312 15,166 –37,150 –38,226
Note: Data are as of March 23, 2010.
Profits and Balance Sheet Developments at U.S. Commercial Banks in 2009 A37