The Cockpit Effect 2011cockpitarts.com/wp-content/uploads/2015/02/Cockpit-Effect-2012.pdf · sole...
33
The Cockpit Effect 2012 Successful Craft Business Models Cockpit Arts www.cockpitarts.com October 2013
Transcript of The Cockpit Effect 2011cockpitarts.com/wp-content/uploads/2015/02/Cockpit-Effect-2012.pdf · sole...
The Cockpit Effect 2012
Successful Craft Business Models
Cockpit Arts www.cockpitarts.com
October 2013

The Cockpit Effect 2012
Page | 2
Foreword
Vanessa Swann, Chief Executive, Cockpit Arts
I am delighted to present this, the fourth in a series of annual research
reports into the growth and development of craft businesses at Cockpit
Arts. As a social enterprise, our organisation must be able to explain
and justify the value of the social, cultural and economic change we aim
to bring about. Whilst the report provides evidence of continually
improving performance of craft businesses and we recognise that
average profits reported by designer-makers at Cockpit are almost double the national
average; I would argue that Cockpit Arts is not solely addressing craft business growth in
economic and fiscal terms, [the focus of this report], but as a vehicle for wider social
change.
The context for Cockpit’s work is a belief that craft skills are at the heart of our creative
industries and cultural heritage. We need to ensure that talent is continually nurtured, so
that tomorrow’s designers and artisans can carry on these great traditions. We need to
capitalise on local skills; deliver a low carbon footprint, and a return to bespoke, hand-
made or batch produced products and locally based services is part of that approach.
Most craftspeople however, struggle to think holistically about their business beyond their
creativity, and consequently find it difficult to support themselves. Makers set up either as
sole traders or small partnerships and experience difficulties common to many small
businesses: Lack of start-up capital, limited business skills, inability to manage their
business on their own, as well as other social and financial disadvantages. For example,
entry routes to a craft career for those with raw talent but little or no formal education are
still almost non-existent, while few professional makers are earning an income
commensurate with their extensive training, skills and the long hours they work. This is
where Cockpit comes in.
We believe that supporting craft businesses to become more successful and profitable is
a means by which other societal problems can be addressed. Capacity building in the
sector enables services to be accessed by a wider pool of potential candidates and
extended to those at a disadvantage. As an example, we know that craft businesses that
The Cockpit Effect 2012
Page | 3
employ staff reach sustainable levels of profit more quickly, but that makers are
nonetheless wary of the risks involved in providing permanent employment to others. With
the right support, employment of others can and has risen at Cockpit Arts, with a
commensurate effect on employment opportunities in the sector. Consequently, through
the Creative Employment Programme, supported using public funding by Arts Council
England, we are now providing training to more craft employers based at Cockpit Arts to
take on apprentices or graduate interns, all of whom will be entering the job market for the
first time. Another example is the Creative Careers Programme, run in partnership with
The Prince’s Trust, which has been providing intensive support, including craft skill and
design development, over the past three years to previously unemployed young people,
as a gateway to a professional career in craft and design. To date, fourteen of the
seventeen young ‘NEETS’ on this programme have gained employment or self-
employment, and following the year 1 pilot, years 2 and 3 resulted in 100% success rate
in self-employment after two years of support. Now we are aiming [and able] to increase
the number of participants on the Creative Careers programme in line with our social
mission. We would argue that without capacity building and growth of craft businesses
based at Cockpit or elsewhere, such social change will not be possible.
For the first time the report also highlights the range of types of craft businesses at
Cockpit Arts, from artist maker to designer-maker, from batch producer to scalable craft
businesses, with more information on their particular business model. In the future we
plan to do more to contextualise the impact of business incubation, including the value
derived from a diverse mix of designer-makers operating within a creative community, as
well as the value of supporting particular craft skills in relation to revival of UK industries.
In the meantime, it only remains for me to thank the report author, Ellen O’Hara, Head of
Business Development, for her excellent work in designing, delivering and analysing the
business development strand of the Cockpit business incubator, as well as all other
members of the team, without whom the positive developments would not have been
possible: Josie Ballin, Sally Dodson, Hugo Godfrey, Imogen Gray, Beckie Kingman, Lucy
Kyle and Adrian Lee.

The Cockpit Effect 2012
Page | 4
CONTENTS
Executive summary 5
1.0 Introduction 7
1.1 Report Structure 7
1.2 Aims & Context 7
2.0 Key findings and trends 9
2.1 Growth 9
2.2 Turnover 10
2.3 Profit 11
2.4 Sources of income 13
2.5 Expenditure 14
2.6 Business profile 14
2.7 Strategic planning 16
2.8 Product innovation & development 16
2.9 Markets 16
2.10 Employment and outsourcing 18
2.11 Use of digital technology 19
3.0 Successful craft business models 20
3.1 The incubation journey 20
3.2 Key craft business models 20
3.3 The artist maker 22
3.4 The individual designer-maker 23
3.5 The small batch producer 24
3.6 The scalable craft business 25
4.0 Conclusion 27
APPENIDIX 28
Methodology 28
Data sample 30
References 33
Author’s biography 33

The Cockpit Effect 2012
Page | 5
Executive Summary
This report references on-going research undertaken by Cockpit Arts, with a focus on
business data collected from Cockpit Arts studio holders in 2012. Evidence from this
sample of 137 craft businesses is compared against benchmark data held by Cockpit Arts
collated between 2005 and 2011 and national data on craft businesses in the UK to help
identify general trends.
The results show that, for the seventh year running since Cockpit Arts began collecting
data, businesses here continue to break the mould, reporting growth and development
both financially and creatively:
Nearly three quarters (74%) reported growth in turnover in 2012 compared with
70% in 2011 and 65% in 2010.
Two thirds (62%) of Cockpit businesses reported an increase in profits in 2012
compared with 66% in 2011 and 51% in 2010.
Growth rates have remained healthy with turnover increasing by an average of
40% and profit by an average of 26% since 2011.
Business confidence at Cockpit Arts is high with 82% of businesses predicting an
increase in turnover, estimated at an average increase of 40%. 62% of makers are
predicting an increase in profits at an estimated average increase of 29%.
Furthermore, average turnover at Cockpit is 49% higher than the national average
at £35,089 compared with £23,485, with a high of over £380,000.
Similarly average profits reported by designer-makers at Cockpit are almost double
the national average at £12,147 in 2012 compared with £6,231.
The average year on year growth in turnover and profit since 2005, taking into
account inflation1, is 20% for turnover and 28% for profits.
Growth is being achieved through the diversification of markets and income streams, by
reaching new online, high value and overseas markets, as well as streamlining operations
and investing time in creative and productive development.
1 http://www.bankofengland.co.uk/education/Pages/inflation/calculator/index1.aspx

The Cockpit Effect 2012
Page | 6
On average, 85% of income is derived from sale of craft objects, compared with
83% in 2011.
However some significant changes in sources of income have been reported:
o income generated from wholesale orders and sale or return sales dropped
from an average of 29% to just 18%
o income derived from retail crafts fairs and shows fell from 23% to an
average of just 6%, while income from commissions rose from 13% to 29%
o income from online sales has also increased from an average of 8% to 22%
o income from Cockpit Arts Open Studios remained constant for the third year
running at an average of 10%
59% of respondents from Cockpit Arts reported having another source of income in
addition to sales of craft products.
46% work on their craft practice part time, which correlates with the increase in the
percentage of businesses that have been trading for five years or less.
Leading the field in terms of overall financial performance are jewellery, printed
textiles and silversmithing, as in previous years.
The proportion of businesses at Cockpit Arts exporting has remained high at 56%
compared to just 30% of makers nationally.
Use of PAYE employees remains low but has increased to 8%.
Outsourcing is common and is shown to have a positive impact on financial
performance. In 2012, 45% of business outsourced manufacture and 38%
contracted out other business functions such as sales and marketing, finance and
administration.
Use of digital technology in business has increased specifically with applications in
financial planning (50%), e-marketing (53%) and e-commerce (33%).
Qualitative approaches show that craft business at Cockpit Arts will move through the
incubation journey in different ways, influenced by many factors, including the business
model that has been adopted. We have identified 7 key craft business models
represented among the Cockpit Arts community and the can show that it takes between 3
and 10 years to reach business maturity.

The Cockpit Effect 2012
Page | 7
1.0 Introduction
This report references on-going research undertaken by Cockpit Arts, with a focus on
business data collected from Cockpit Arts studio holders in 2012.
1.1 Report structure
The report outlines the aims and context of our research, followed by a summary of the
key findings, headlined by the fact that craft businesses at Cockpit Arts continue to
evidence growth, despite a tough economic climate. Key growth trends are highlighted
and the report continues by describing seven craft business models, the specific support
needs that these businesses tend to have and how long on average it takes to reach
business maturity. Details of the research methodology employed and some of its
limitations are listed in the appendix along with supporting data and references.
1.2 Aims and context
Cockpit Arts is a social enterprise and the UK's only creative-business incubator for
designer-makers, catering for a range of craft disciplines. At Cockpit Arts, incubation
comprises a unique combination of affordable, managed studios and office services, onsite
one to one business development coaching, skills development workshops, low interest
loans, twice yearly Open Studios, and other showcasing and selling opportunities.
The research undertaken by Cockpit Arts reflects our aim to raise aspirations for improved
profitability and creative success amongst the designer-maker community. It arises from a
desire to better understand the business models and strategies of micro craft businesses,
and the role that incubation can play in craft sector development. Our research was
initially designed for internal purposes, and is based on key performance indicators
collated via a business review process. The research activity began in 2005, is ongoing
and consists of three key lines of enquiry:
1. To analyse the growth trends, drivers and challenges of studio holders at
Cockpit Arts.

The Cockpit Effect 2012
Page | 8
2. To provide an assessment of the impact that incubation has on business
activity and performance among studio holders at Cockpit Arts, measured
against external sources of data on craft businesses and other incubator based
businesses, where available.
3. To identify the business models and incubation services employed by the best
performing businesses. This process helps to compare the impact of
incubation between businesses at Cockpit Arts that engage in different aspects
of the incubation package.

The Cockpit Effect 2012
Page | 9
2.0 Key findings and trends
This section highlights key findings and trends for the 2012 sample of businesses at
Cockpit in comparison with previous years and national statistics, where available.
2.1 Growth
The analysis reveals that growth, in terms of financial change, among businesses at
Cockpit Arts has continued to improve year on year since the incubation model was
introduced in 2005. An increasing number of Cockpit Arts’ businesses are experiencing
growth with nearly three quarters (74%) reporting growth in turnover in 2012 compared
with 70% in 2011 and 65% in 2010. Two thirds (62 %) of Cockpit businesses reported an
increase in profits in 2012 compared with 66% in 2011 and 51% in 2010.
Average turnover continued to grow in 2012 at an average rate of 40% compared with just
19% in 2011 and 28% in 2010. Average growth rates for profits fell to 26% in 2012
compared with 44% the previous year. The average year on year growth in turnover and
profit since 2005, taking into account inflation2, is 20% for turnover and 28% for profits.
2 http://www.bankofengland.co.uk/education/Pages/inflation/calculator/index1.aspx
0%
10%
20%
30%
40%
50%
60%
70%
80%
90%
100%
2007 2008 2009 2010 2011 2012
Fig. 1: Percentage of businesses reporting growth by review year
Turnover
Profit

The Cockpit Effect 2012
Page | 10
Business confidence at Cockpit Arts is high with 82% of businesses predicting an increase
in turnover, estimated at an average increase of 40%. 62% of makers are predicting an
increase in profits at an estimated average increase of 29%.
2.2 Turnover
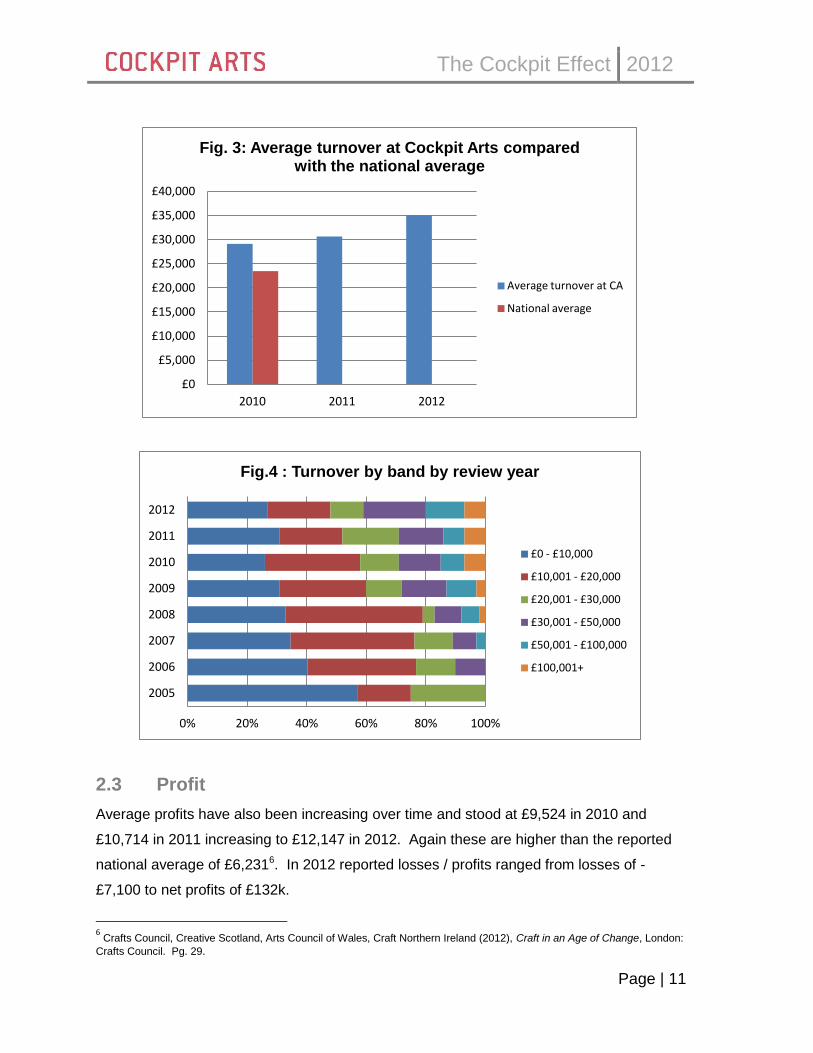
Average turnover stood at £35,089 in 2012 compared with £30,640 in 2011. Both figures
are significantly higher than the national average of £23,4853. Turnover of Cockpit
businesses reported in 2012 ranged from zero for some start-up businesses to £382,000,
compared to a high of £246,000 the previous year.
Figure 4 shows that an increasing number of businesses are reporting income of between
£20,001 and £50,000 as well as £50,001+ and a decreasing number report turnover of less
than £20,000. 80% of makers nationally reported gross income of £20,000 or less4 in 2010
compared to 48% of the Cockpit sample in 2012. Nationally, just 4% of businesses
generate a turnover of more than the VAT threshold5 (currently £79,000) compared with
9% of businesses at Cockpit Arts in 2012.
3 Crafts Council, Creative Scotland, Arts Council of Wales, Craft Northern Ireland (2012), Craft in an Age of Change, London:
Crafts Council. Pg 26. 4 Crafts Council, Creative Scotland, Arts Council of Wales, Craft Northern Ireland (2012), Craft in an Age of Change, London:
Crafts Council. Pg. 26. 5 Craft in an Age of Change, Creative Scotland, Arts Council of Wales, Craft Northern Ireland (2012), Craft in an
Age of Change, London: Crafts Council. Pg. 17.
0%
20%
40%
60%
80%
100%
120%
140%
160%
180%
2007 2008 2009 2010 2011 2012
Fig. 2: Average growth in turnover and profit by review year
Turnover
Profit
The Cockpit Effect 2012
Page | 11
2.3 Profit
Average profits have also been increasing over time and stood at £9,524 in 2010 and
£10,714 in 2011 increasing to £12,147 in 2012. Again these are higher than the reported
national average of £6,2316. In 2012 reported losses / profits ranged from losses of -
£7,100 to net profits of £132k.
6 Crafts Council, Creative Scotland, Arts Council of Wales, Craft Northern Ireland (2012), Craft in an Age of Change, London:
Crafts Council. Pg. 29.
£0
£5,000
£10,000
£15,000
£20,000
£25,000
£30,000
£35,000
£40,000
2010 2011 2012
Fig. 3: Average turnover at Cockpit Arts compared with the national average
Average turnover at CA
National average
0% 20% 40% 60% 80% 100%
2005
2006
2007
2008
2009
2010
2011
2012
Fig.4 : Turnover by band by review year
£0 - £10,000
£10,001 - £20,000
£20,001 - £30,000
£30,001 - £50,000
£50,001 - £100,000
£100,001+

The Cockpit Effect 2012
Page | 12
Average net margins have increased to a high of 30% up from 19% in 2011 and 25% in
2009.
Figure 6 shows that the percentage of businesses reporting profits of £10,000 and less
has fallen for the fifth year running while an increasing number of businesses are reporting
profits of £20,001 and over.
£0
£2,000
£4,000
£6,000
£8,000
£10,000
£12,000
£14,000
2010 2011 2012
Fig. 5: Average profit at Cockpit Arts compared with national average profit
Average profit at Cockpit Arts
National average profit
0% 20% 40% 60% 80% 100%
2006
2007
2008
2009
2010
2011
2012
Fig. 6: Profit by band by review year
£0 - £10,000
£10,001 - £20000
£20,001 - £30,000
£30,0001 - £50,000
£50,001 -£75K

The Cockpit Effect 2012
Page | 13
2.4 Sources of income
As in previous years, makers at Cockpit Arts are defying the downturn by diversifying their
income streams to spread risk, investing time in creative and productive development,
reaching new online, high value and overseas markets and streamlining operations.
On average, 85% of income is derived from sale of craft objects, compared with 83% in
2011. Yet some significant changes in sources of income have been reported: Income
generated from wholesale orders and sale or return sales dropped from an average of
29% to just 18%. Income derived from retail crafts fairs and shows fell from 23% to an
average of just 6%. Conversely, income from commissions rose from 13% to 29%.
Income from online sales has also increased from an average of 8% to 22% while income
from Open Studios remained constant for the third year running at an average of 10%.
59% of respondents from Cockpit reported having another source of income in addition to
sales of craft products, compared with 68% in the previous year. Of these 79% derive
income from a craft related skill such as teaching, freelancing making or designing.
In 2011, 38% reported to be working on their craft practice part time which increased to
46% in 2012, which reflects the proportion of businesses that have been trading for four
years or less. On average 15% of income is derived from non-sales activities.
29%
22% 18%
10%
6%
15%
Fig 7: Sources of Income
Commisions
Online sales
Wholesale orders & SOR
Open Studios
Retail shows and fairs
Non sales related income

The Cockpit Effect 2012
Page | 14
2.5 Expenditure
In 2011 direct costs such as materials, production outworkers and packaging represented
a larger proportion of turnover, up on average to 41% in 2011 from 27% in 2010 and 29%
in 2009. This fluctuation resulted from a combination of increased commodity prices which
had not been reflected in increased prices, as well as increases in the volume of stock
held by some businesses as a strategy for responding to wholesale orders more
effectively. In 2012, this had returned to an average 29%.
Other costs such as studio and related costs, marketing and sales costs and other indirect
costs have remained largely unchanged since 2009.
Table 1: Average costs in relation to turnover over time
Average costs in relation
to turnover
2009 2010 2011 2012
Direct costs 29% 27% 41% 29%
Studio and related costs 24% 22% 20% 21%
Marketing & sales costs 12% 12% 10% 10%
Other indirect costs 10% 12% 10% 10%
Net margins 25% 27% 19% 30%
2.6 Business profile
The research findings have identified that profile variables such as craft discipline, age of
business and work rate all affect financial performance.
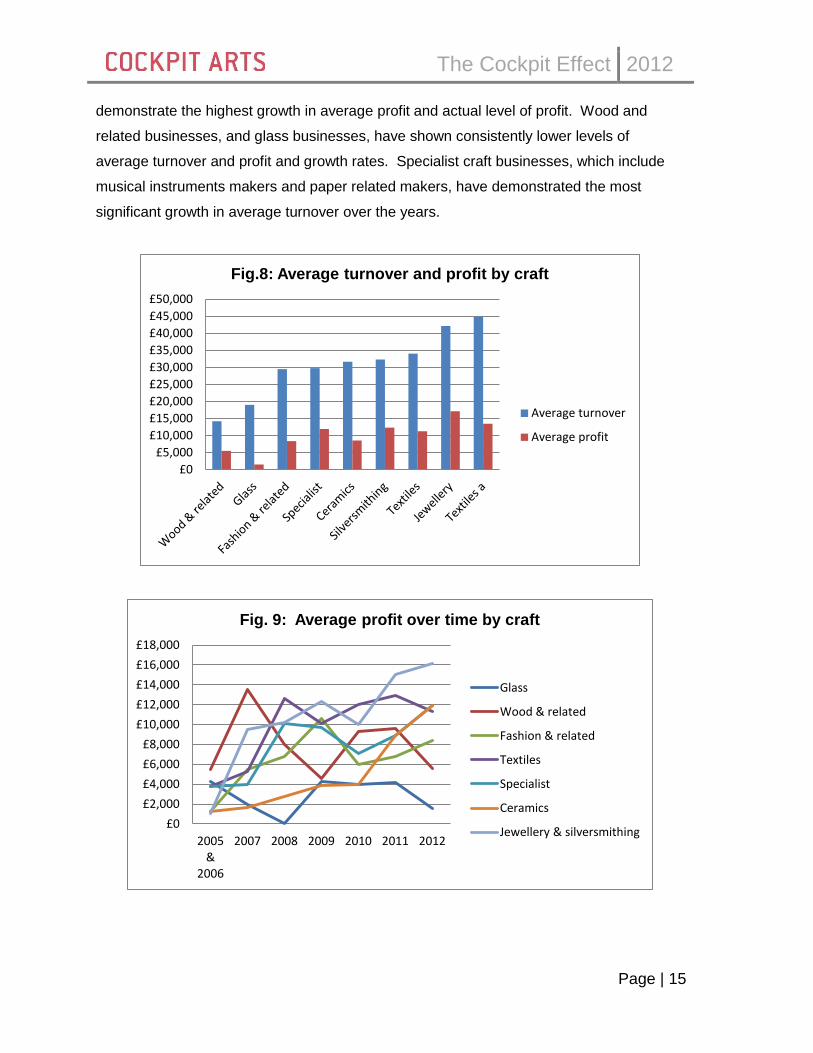
As in previous years, ceramic businesses have experienced the highest growth in average
turnover since 2005 and the second highest growth in profit after jewellery and
silversmithing. Unlike previous years, average levels of turnover and profit among
ceramics businesses has improved at a higher rate than other craft disciplines. This is a
result of a number of businesses in the sample successfully overcoming growth challenges
by either successfully scaling up, licensing designs to manufacture or, at the other end of
the spectrum, successfully developing a fine art business model. Leading the field in
terms of overall financial performance are jewellery and silversmithing businesses which
The Cockpit Effect 2012
Page | 15
demonstrate the highest growth in average profit and actual level of profit. Wood and
related businesses, and glass businesses, have shown consistently lower levels of
average turnover and profit and growth rates. Specialist craft businesses, which include
musical instruments makers and paper related makers, have demonstrated the most
significant growth in average turnover over the years.
£0
£5,000
£10,000
£15,000
£20,000
£25,000
£30,000
£35,000
£40,000
£45,000
£50,000
Fig.8: Average turnover and profit by craft
Average turnover
Average profit
£0
£2,000
£4,000
£6,000
£8,000
£10,000
£12,000
£14,000
£16,000
£18,000
2005 &
2006
2007 2008 2009 2010 2011 2012
Fig. 9: Average profit over time by craft
Glass
Wood & related
Fashion & related
Textiles
Specialist
Ceramics
Jewellery & silversmithing

The Cockpit Effect 2012
Page | 16
Five years in business continues to be the mode for the best performers and those makers
working five days or more, on average, report higher turnover and profit.
Those businesses working part time (four days a week and less) reported an average
turnover of £16,983 and average profit of £5,552, while those working full time on their
practice reported significantly higher average turnover and profit at £44,872 and £15,770
respectively. The average turnover and profit for a full time maker at Cockpit Arts who has
been in business for at least five years was £60,975 and £22,080 respectively.
2.7 Strategic planning
The percentage of businesses at Cockpit with strategic business plans remained static at
70%, having increased from 63% in 2010, 61% in 2009 and just 13% in 2007. Occurrence
of marketing plans are shown to have the greatest correlation with turnover particularly for
emerging businesses, whereas more strategic business plans are shown to correlate with
higher profits in the longer term.
2.8 Product innovation and development
Creative and product development continues to bear a strong correlation to improved
financial performance. In 2012, 42% reported to have developed new products or services
in the last twelve months compared with 55% the previous year. The average proportion
of time spent on design development activities was similar to previous years at 14% and
regression analysis suggests that those makers who spend more time on design
development generate higher turnover.
2.9 Markets
The percentage of businesses that target the contemporary craft market has remained
constant since 2005 at an average of 74%. The proportion of businesses that operate in
interiors, gift and fashion markets has been significantly higher since 2008 and regression
analysis confirms that those businesses operating in more than one market generate
higher levels of turnover and profit. The exception to this rule are precious metal jewellers
that target only the contemporary craft market and are among some of the best performers
in financial terms.

The Cockpit Effect 2012
Page | 17
The proportion of businesses at Cockpit Arts exporting has been consistently high, ranging
from 36% to 44% between 2005 and 2010. In 2011, this rose again to 57% compared
with just 30% of makers nationally7 and remained steady at 55% in 2012. The two most
predominant export destinations are the USA with 46% of exporters selling there, followed
by France at 34%, which had been the most predominant in previous years. Germany
overtook Japan as the third most predominant export destination with 26% of exporters
selling there, and the number of exporters selling to Japan falling by almost half from 33%
to just 17%.
As in previous years, market diversification, including exporting, is shown to contribute to
both level of turnover and turnover growth among the Cockpit sample. Time series
analysis confirms that exporting has been significant in explaining financial performance
since 2005, with exporting businesses reporting higher average turnover and higher profit
growth than those that do not export.
7 Crafts Council, Creative Scotland, Arts Council of Wales, Craft Northern Ireland (2012), Craft in an Age of Change, London:
Crafts Council. Pg. 41.
0%
5%
10%
15%
20%
25%
30%
35%
40%
2005 2006 2007 2008 2009 2010 2011 2012
Fig. 10: Pecentage of businesses operating in each market over time
Public Art
Product
Fine Art
Fashion
Gift
Interiors

The Cockpit Effect 2012
Page | 18
2.10 Employment and outsourcing
Use of PAYE employees has increased from 2% in 2009 to 4% in 2010 and 8% in 2012.
This correlates with national data8 which states that 82% of craft businesses employ less
than five people.
Outsourcing manufacture on a contractual basis stood at 49% in 2009, an increase from
36% in 2007, down slightly to 47% in 2011 and comparable with 45% in 2012.
Outsourcing manufacture was also shown to be one of the most consistently significant
factors in explaining level of turnover and profit over time for businesses at Cockpit.
In 2010, respondents were asked for the first time to comment on whether they outsourced
other business functions such as sales and marketing, finance and administration. In 2010
23% contracted out other services, rising to 25% in 2011 and 38% in 2012.
37% reported to offer work placement opportunities to students in 2010 which rose to 55%,
dropping back down to 36% in 2012.
8 Creative & Cultural Skills (2009), Craft: Impact and Footprint, London: Creative & Cultural Skills.
0%
10%
20%
30%
40%
50%
60%
2010 2011 2012
Fig. 11: Business exporting at Cockpit Arts compared with the national average
Businesses exporting at Cockpit Arts
National average
The Cockpit Effect 2012
Page | 19
Those makers who outsource aspects of production tend to report higher levels of turnover
and profit. Qualitative evidence reveals that outsourcing production leads to increased
production capacity, efficiency and simultaneously reduces lead times. This not only
improves productivity, but allows the businesses to respond to increases in demand more
effectively, and for the business owner to spend time on the added value aspects of the
business such as design development.
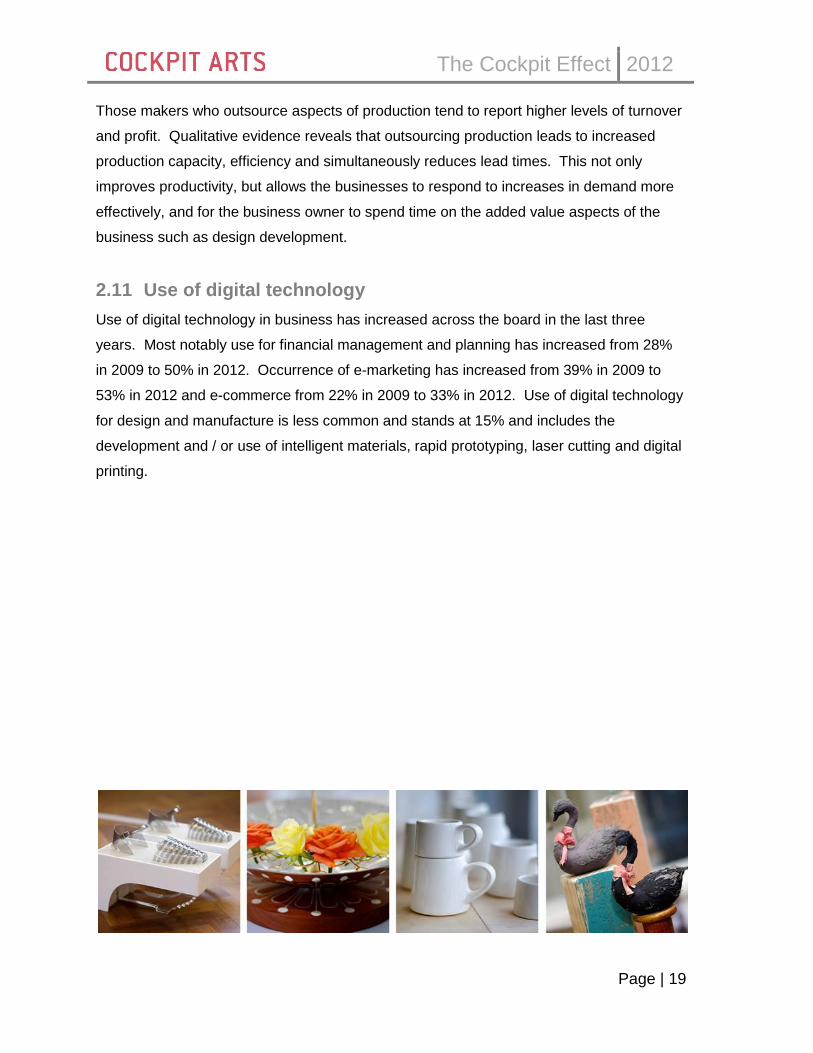
2.11 Use of digital technology
Use of digital technology in business has increased across the board in the last three
years. Most notably use for financial management and planning has increased from 28%
in 2009 to 50% in 2012. Occurrence of e-marketing has increased from 39% in 2009 to
53% in 2012 and e-commerce from 22% in 2009 to 33% in 2012. Use of digital technology
for design and manufacture is less common and stands at 15% and includes the
development and / or use of intelligent materials, rapid prototyping, laser cutting and digital
printing.

The Cockpit Effect 2012
Page | 20
3.0 Successful craft business models
This section of the report explains the typical incubation journey of a business based at
Cockpit Arts and how this may vary according to the business model.
3.1 The incubation journey
A key element of the incubation process at Cockpit Arts is to work with each individual
designer-maker to design a business model that fulfils their creative aspirations whilst
meeting their financial needs and social aims. Our previous research demonstrates that
the best performers, in financial terms, access different combinations of support services
that meet their needs at the different stages of business growth. The diagram below shows
the typical phases of business growth and maps this against a typical business incubation
journey and years in business for each stage.
Fig. 12: Typical growth stage, incubation journey and average years in business for
each
3.2 Key craft business models
Qualitative approaches show that craft business at Cockpit Arts will move through this
journey in different ways, influenced by some of the factors already mentioned such as the
vision and values of the business owner, the nature of and market for the work and the
business model that has been adopted. We have identified 7 key craft business models
Growth stage
Start-up Early stage
growth Mid-career Maturity
Incubation journey
Entry Intensive incubation
Growth related support
Exit planning
Years in business
Less than 1 year
2-3 years 3-7 years
7+ years

The Cockpit Effect 2012
Page | 21
represented among the Cockpit Arts community and the table below provides a summary
of each one. In each case the distinguishing factor is how the business creates and adds
value.
Table 2: Seven key craft business models
Business model Value creation
Educator Through lecturing, teaching, guest speaking and mentoring in a
specific field of expertise.
Craft & design
consultant
Through the use of making skills and materials knowledge in
the provision of free lance design services and / or consultancy.
Maker service provider Through the highly skilled production of work to the
specification of the client. This group includes restorers, crafts
trades people, outworkers and small batch producers.
Artist maker Through the creation of one off and limited edition works with a
leaning towards the conceptual.
Individual designer-
maker
Through the design and highly skilled production of labour
intensive, one off, limited editions and collections of functional
and non functional craft objects.
Small batch producer (of
own work)
Through the design, production, (distribution) and sale of
products made in small batches.
Scalable craft business Through the application of design to products that are
manufactured on a relatively large scale.
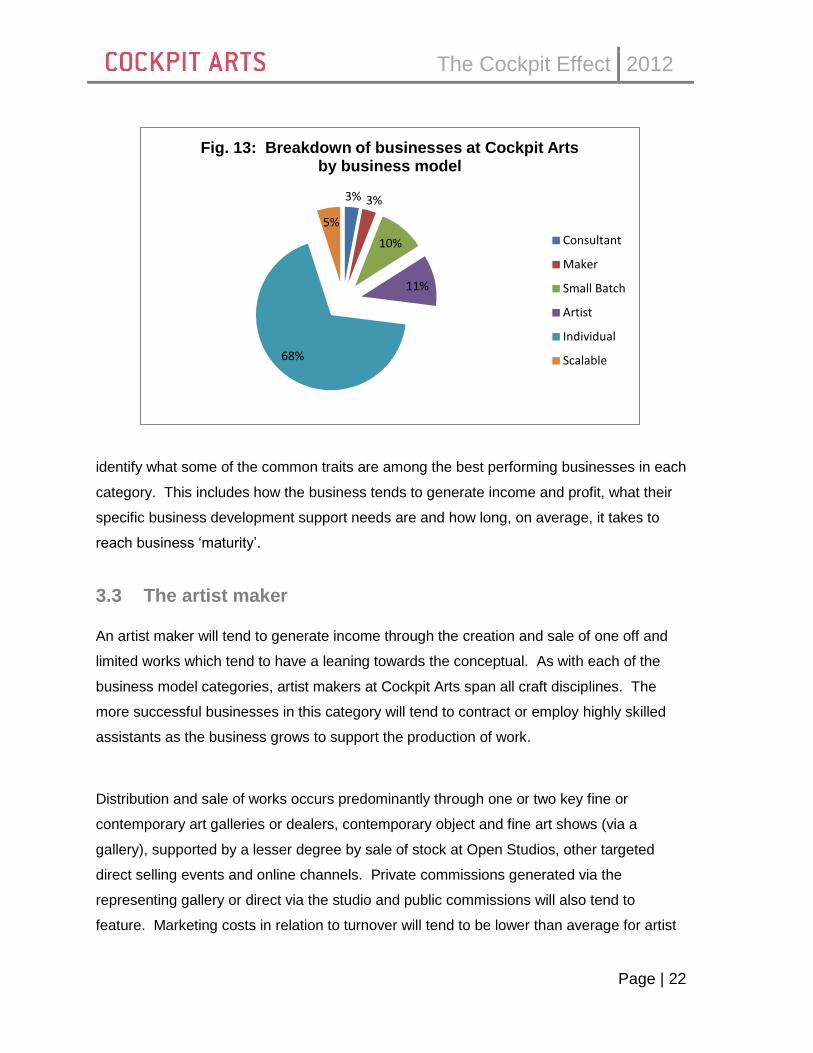
A proportion of makers at Cockpit have developed a practice that comprises more than
one of these approaches to generating income and making a profit. However one
approach will tend to be dominant and Fig.13 shows the current break down of businesses
at Cockpit by business model.
By examining individual case histories for artist makers, individual designer-makers, small
batch producers (of own work) and scalable businesses in particular, it is possible to
The Cockpit Effect 2012
Page | 22
identify what some of the common traits are among the best performing businesses in each
category. This includes how the business tends to generate income and profit, what their
specific business development support needs are and how long, on average, it takes to
reach business ‘maturity’.
3.3 The artist maker An artist maker will tend to generate income through the creation and sale of one off and
limited works which tend to have a leaning towards the conceptual. As with each of the
business model categories, artist makers at Cockpit Arts span all craft disciplines. The
more successful businesses in this category will tend to contract or employ highly skilled
assistants as the business grows to support the production of work.
Distribution and sale of works occurs predominantly through one or two key fine or
contemporary art galleries or dealers, contemporary object and fine art shows (via a
gallery), supported by a lesser degree by sale of stock at Open Studios, other targeted
direct selling events and online channels. Private commissions generated via the
representing gallery or direct via the studio and public commissions will also tend to
feature. Marketing costs in relation to turnover will tend to be lower than average for artist
3% 3%
10%
11%
68%
5%
Fig. 13: Breakdown of businesses at Cockpit Arts by business model
Consultant
Maker
Small Batch
Artist
Individual
Scalable

The Cockpit Effect 2012
Page | 23
makers. The more successful businesses will have both a national and international
profile, and have work in both public and private collections. Examples include Katharine
Morling, an award-winning artist producing figurative one off pieces and limited editions in
ceramics.
Specific support needs will tend to include support with securing gallery representation,
making applications for grant funding, writing submissions for commissions and exhibition
opportunities, general profile raising and employment related issues where relevant. The
estimated average time to reach business maturity for an artist is 10 years.
“My time here has seen my practice
grow and change. It is a very
encouraging and supportive
atmosphere in which to make brave
choices and become more business
savvy, which in the end gives more
time to be creative.” Katharine Morling
3.3 The individual designer-maker
The individual designer-maker is the most predominant business model at Cockpit Arts
making up 68% of the total. Income and profit is generated through the design and highly
skilled production of one off, limited editions, and collections of functional and non
functional craft objects. Sales of stock are likely to be supported by an element of working
to commission, but with the design process led by the designer-maker.
As with the artist-maker, the more successful businesses in this category will tend to
contract making assistants to support the production of work at peak times.

The Cockpit Effect 2012
Page | 24
Isolating the best performers in this category reveals that the vast majority are jewellers,
silversmiths or accessory producers (milliners, shoemakers, fashion accessories). They
have all successfully accessed high value niche markets in the craft and / or fashion
sectors. These markets tend to be reached through niche direct selling events such as
Goldsmiths’ Fair. Income generated through private commissions tends to feature
prominently alongside wholesale orders and direct retails sales, ensuring that average net
margins among the best performers are higher than average at 40%. Marketing spend in
relation to turnover will tend to be slighter higher than the average, while studio related
costs will tend to be lower than average. Examples of businesses in this group include
Jessica Poole, Jacqueline Cullen, Jo Hayes Ward and Jane Adam.
Specific support needs include niche marketing, positioning and branding approaches, and
managing commissions effectively. As design and making skills improve with time,
reputation, profile and value of the final works increase.
Estimated average time to reach business maturity for an individual designer maker is 7
years.
“I have received invaluable one-to-one
business support from Cockpit, which has
enabled me to examine my business and
focus on developing and growing in new
directions.” Jo Hayes Ward.
3.5 The small batch producer
10% of the businesses at Cockpit can be described as small batch producers, producing
their own work from the studio. As volumes increase, production is either outsourced on a
small scale to other highly skilled makers, or production assistants are employed in the
studio.

The Cockpit Effect 2012
Page | 25
The best performers in this group tend to be producing work for the gift, interiors and / or
fashion accessories markets, tend to report higher than average levels of wholesale
activity and higher than average online sales.
These businesses will tend to benefit from specialist support in people and production
management, export, maximising online presence and may also require access to finance.
An example of a successful business in this category is ceramics business sjm* which, as
a result of support from manufacture specialist and coach Nigel Rust via Cockpit Arts, has
become more efficient reporting improvements in productivity by as much as a third (33%).
Small batch producers will take between 3 and 7 years to reach maturity and have the
potential to continue growing once they have exited the incubator.
“We are better able to respond to high
customer demand during busy periods such
as the run-up to Christmas as a result of the
support we have received at Cockpit
Arts…” Sarah J Miller.
3.6 The scalable craft business
5% of the businesses at Cockpit can be described as scalable retail businesses where
design development and sampling / prototyping will tend to take place in the studio with
the majority of production being outsourced to larger scale units. These businesses are
most likely to have PAYE staff to manage the different aspects of the business from
production, to marketing and sales, and finance.
Income from wholesale orders and online sales in relation to turnover will both tend to be
higher than average and may also be supported by an element of license fee income.

The Cockpit Effect 2012
Page | 26
Although actual costs across the board will tend to be higher for these businesses, the
scale they are able to achieve ensures that net profit margins remain relatively high at an
average of 32%. The majority of businesses in this category are printed textiles business
producing for the gift and interiors market, with examples including Lush Designs and
Thornback & Peel.
These businesses will tend to benefit from specialist support in people, production and
premises management, export, maximising online presence and may also require access
to finance. Due to a greater potential for licensing and brand development, these
businesses are also most likely to require specialist legal advice in intellectual property.
Estimated time to reach maturity is 5 years, although, as with small batch producers, these
more scalable businesses have the potential to continue growing significantly beyond this.
‘… Cockpit has supported us at every
stage. The loan scheme in particular
has provided us with the means and
motivation to grow our business and
build our brand’. Thornback & Peel.

The Cockpit Effect 2012
Page | 27
4.0 Conclusions
The research provides evidence of the continuously improving financial performance of
craft businesses at Cockpit Arts despite tough retail conditions. Specifically makers at
Cockpit are reporting higher growth, higher average turnover, higher average profit and
higher net profit margins than in previous years. The evidence highlights a number of key
drivers contributing to this growth including strategic planning, creative and product
innovation, income and market diversification including e-commerce, a move to high value
markets such as high end fashion, export and outsourcing.
While reductions in average income generated from wholesale orders, SOR sales and
retail fairs represents a challenge, the evidence suggests these challenges are being
overcome. The more successful businesses at Cockpit are accessing new high value
markets, taking advantage of the opportunities presented by a growing appetite for
commissioning, and growing their online sales.
Our previous research shows that there is no set package of support that is guaranteed to
lead to improved financial performance. One size does not fit all. Studying case histories
shows that business survival and growth depends on the capacity of the craft business
owner-manager to develop strong creative and managerial competencies in order that they
can exploit opportunities and overcome challenges, in a way that is relevant to them and
their practice. Section 3 of the report demonstrates that the business model that a maker
adopts will be a significant factor in determining the business development supports needs
of that business and how long it is likely to take to become sustainable and reach maturity.
Our findings show that for individual designer-makers, the most predominant business
model among the sample, typical time to reach maturity is between 5 and 7 years. These
results will continue to influence how we develop our incubator model and the specific
support strands that meet the needs of different craft business models at Cockpit Arts.

The Cockpit Effect 2012
Page | 28
APPENDIX
Methodology
The scope of the research is largely defined by the scope of the business review, which
explores financial performance, business model and business process (managerial, sales
and marketing, and operational). In addition, respondents answer questions relating to
business development progress, contributing factors, and future support needs. Business
review evidence for 2012 is drawn from a total sample of 137 businesses. Respondents
span a range of years in business and craft disciplines including jewellery, ceramics, glass,
fashion and accessories, silversmithing, wood and book art. See Appendix for full sample
breakdown.
Data is also drawn from individual designer-maker records which show which incubation
products and services each studio holder has benefitted from over time e.g. participation in
Open Studios, one to one coaching etc.
Quantitative analysis was conducted based on the 2012 results to identify general trends
providing descriptive statistics on a number of key performance indicators. Comparative
analysis was then conducted with two key sources:
● data provided by the Cockpit Arts studio sample between 2005 and 2011, with a
focus on 2011.
● data on craft businesses in the UK published in Craft in an Age of Change, Crafts
Council, Creative Scotland, Arts Council of Wales, Craft Northern Ireland, 2012.
Regression analysis was used to help explain which variables are most likely to contribute
significantly to turnover and profit and how much turnover or profit can be attributed to each
variable. The Ordinary Least Squares (OLS) method of modeling was used to help
describe the relationship between a dependent and an independent variable, such as
turnover and craft discipline, and seeks to explain how significant craft discipline is in
explaining differences in turnover among the sample. Time series analysis was also used
to test the significance of different variables over time.
Comparative data on the performance of businesses within other incubators is not readily
available. While many incubators monitor the development of their business to fulfill

The Cockpit Effect 2012
Page | 29
funding requirements, this data is not in the public domain. UKBI, the national professional
body for the business incubation industry, recognises the need for a national monitoring
study to provide tracking and benchmark data on incubator firms in their 2009 report, UK
Incubators, Identifying Better Practice. This is echoed by NESTA in their 2008 policy
briefing, Business incubation in challenging times, which concludes that there is no
academic consensus on the best means to assess business incubation, worsened by the
relative weakness of statistics on the growth trajectories of firms within the incubator
environment.
Face-to-face interviews were conducted with 20 Cockpit Arts studio holders to provide
further insight into particular lines of enquiry. Together with information gathered from the
670 one-to-one coaching sessions delivered during 2011 and 2012 to individual studio
holders, the qualitative information was analysed using elements of grounded theory to
contextualise the data and help inform the overall conclusions.
The Cockpit Effect 2012
Page | 30
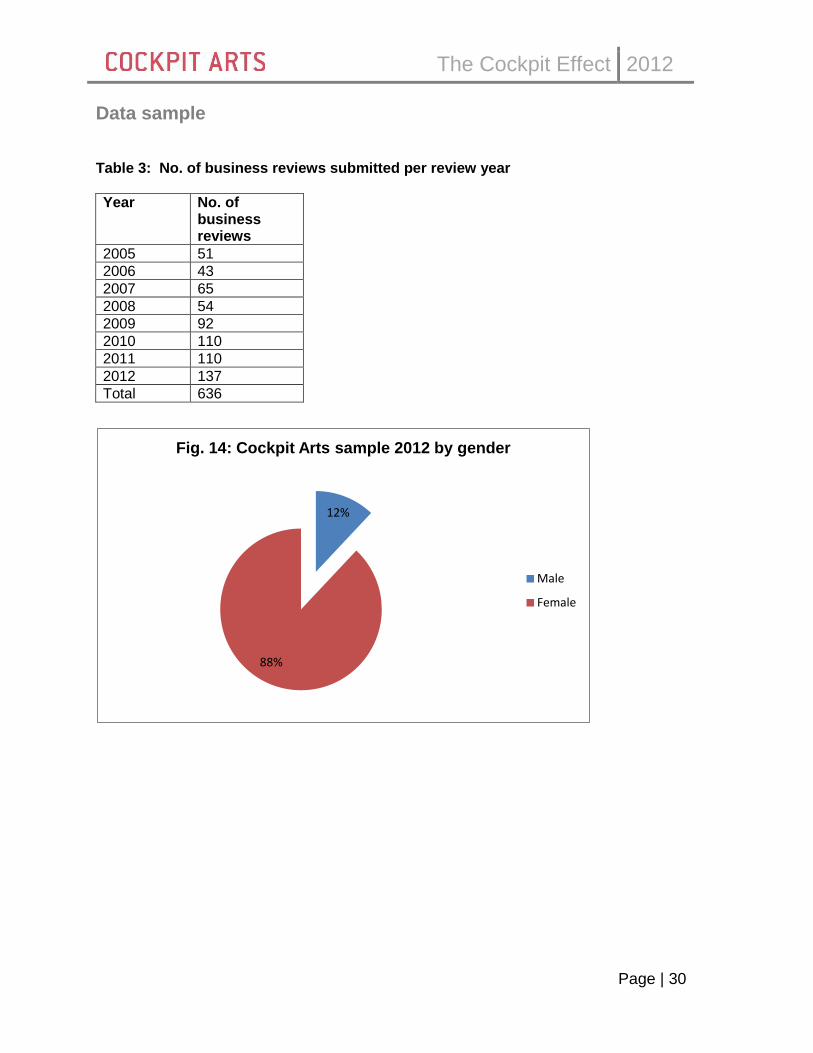
Data sample
Table 3: No. of business reviews submitted per review year
Year No. of business reviews
2005 51
2006 43
2007 65
2008 54
2009 92
2010 110
2011 110
2012 137
Total 636
12%
88%
Fig. 14: Cockpit Arts sample 2012 by gender
Male
Female
The Cockpit Effect 2012
Page | 31
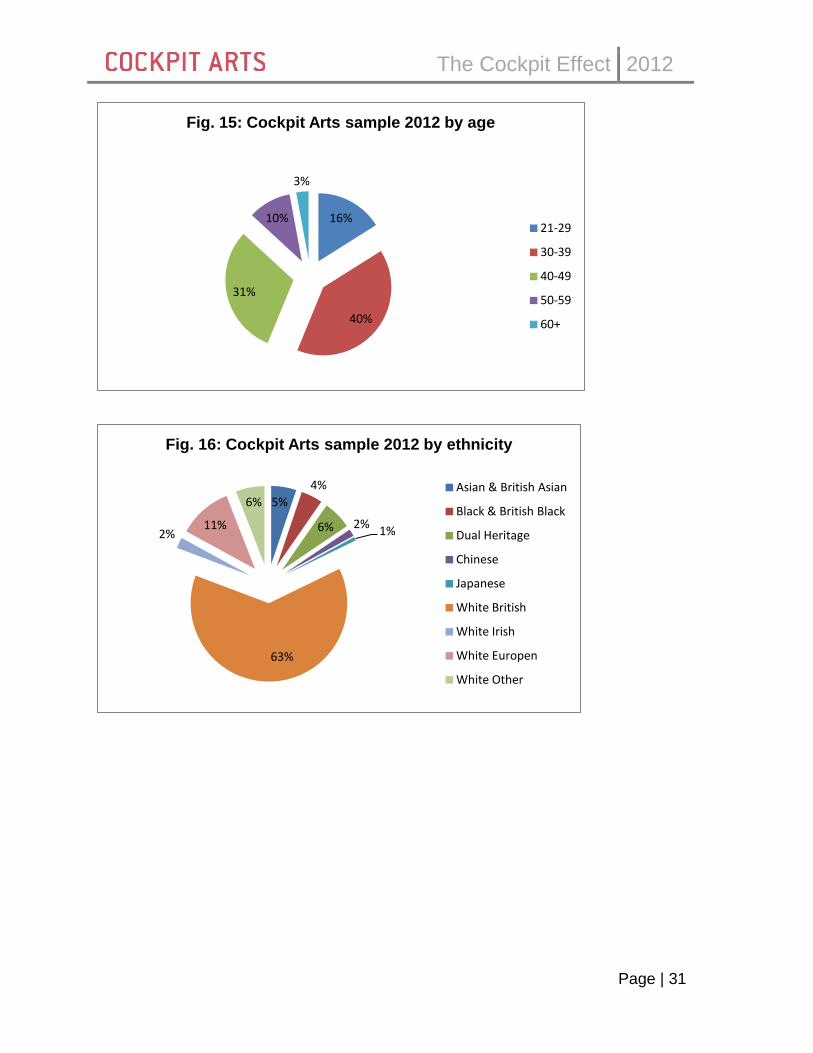
16%
40%
31%
10%
3%
Fig. 15: Cockpit Arts sample 2012 by age
21-29
30-39
40-49
50-59
60+
5%
4%
6% 2% 1%
63%
2% 11%
6%
Fig. 16: Cockpit Arts sample 2012 by ethnicity
Asian & British Asian
Black & British Black
Dual Heritage
Chinese
Japanese
White British
White Irish
White Europen
White Other

The Cockpit Effect 2012
Page | 32
29%
27%
28%
16%
Fig.17: Cockpit Arts 2012 sample by years in business
Less than 2 years
3-5 years
6-10 years
11+ years
24%
23%
18%
12%
10%
6%
4% 3%
Fig 18: Cockpit Arts 2012 sample by craft
Textiles
Jewellery
Fashion & related
Ceramics
Specialist
Silvermsithing
Glass
Wood & related

The Cockpit Effect 2012
Page | 33
References
Cockpit Arts (2009), Raising the Bar, London: Cockpit Arts.
Cockpit Arts (2012), Measuring the impact of incubation, London: Cockpit Arts & Pro Bono
Economics.
Cockpit Arts (2012), The Cockpit Effect: Incubating Craft Businesses and Defying
the Downturn, London: Cockpit Arts.
Crafts Council, Creative Scotland, Arts Council of Wales, Craft Northern Ireland (2012), Craft in an
Age of Change, London: Crafts Council.
Creative & Cultural Skills (2009), Craft: Impact and Footprint, London: Creative & Cultural Skills.
Lord Young (2013), Growing your business: a report on growing micro businesses, London: Lord Young.
NESTA (2008), Business incubation in challenging times, London: NESTA.
The Work Foundation and NESTA (2007), Staying Ahead, London: The Work Foundation.
UKBI (2009), UK Incubators, Identifying Better Practice, London: UKBI.
Author’s Biography
Ellen O’Hara holds a degree in Economics and Econometrics from the University of
Birmingham and a postgraduate diploma in administrative management.
She joined Cockpit Arts in 2006 where she is responsible for the design of
the business development strand of the incubation offer. She leads
Cockpit Arts' research projects which have a focus on craft business
models and the impact of incubation on growth. Ellen previously worked
for The Prince’s Trust, Arts Council England and Andersen management
consultancy. She sits on the Board of Directors for You Make It, a not for
profit organisation that provides enterprise development opportunities for young people not
in education, employment or training.