The Bike-Sharing System as an Element of Enhancing ...
29
sustainability Article The Bike-Sharing System as an Element of Enhancing Sustainable Mobility—A Case Study based on a City in Poland El˙ zbieta Macioszek 1, * , Paulina ´ Swierk 2 and Agata Kurek 1 1 Transport Systems and Traffic Engineering Department, Faculty of Transport and Aviation Engineering, Silesian University of Technology, Krasi´ nskiego 8 Street, 40-019 Katowice, Poland; [email protected] 2 Metropolitan Transport Board, Silesian Voivodeship, Barbary 21A Street, 40-053 Katowice, Poland; [email protected] * Correspondence: [email protected] Received: 20 March 2020; Accepted: 15 April 2020; Published: 17 April 2020 Abstract: The bike-sharing system allows urban residents to rent a bike at one of the rental stations located in the city, use them for their journey, and return them to any other or the same station. In recent years, in many cities around the world, such systems were established to encourage their residents to use bikes as an element of enhancing sustainable mobility and as a good complement to travel made using other modes of transport. The main purpose of this article is to present the results of an analysis of the functioning of the bike-sharing system in Warsaw (Poland). Moreover, the article presents an analysis of the accessibility to individual stations. An important aspect is that the bike-sharing system has been popular among users and that more people use it. Therefore, the city should be provided with a dense network of conveniently located bike-sharing stations. Also, the quality of the bike-sharing system should be an adjustment to the user’s expectations. In connection with the above, the article also presents the results of the analysis of factors affecting bike-sharing system usage as well as the level of satisfaction connected with bike-sharing system usage. The results of the analysis showed that there is a strong positive correlation between these variables. The obtained results can be helpful for carrying out activities whose purpose is to increase the bike-sharing system usage as well as to increase the level of satisfaction connected with bike-sharing system usage. Keywords: bike-sharing system; bike; sustainable mobility; road traffic engineering; road transport 1. Introduction Cities radically change into smart cities because of the increasing mobility of societies, urban growth, new products, and technological innovations [1–3]. Also, these factors enforce the need to properly shape travellers’ behaviour. Currently, in many cities in urban areas, the biggest challenge is to overcome the problem of the prevailing use of private cars [4–7]. Bike-sharing systems are considered to be an effective tool for popularizing alternative ways of traveling, and can be used as an element of enhancing sustainable mobility in cities. Sustainable mobility is the communication behavior of users shaped in this way in the spatial structure and transport, in which the length of the travel route is rationalized, individual motorization does not degrade public transport and non-motorized transport (walking and cycling), and the functioning of the transport system makes it possible to maintain harmony with the environment. Sustainable transport is conducive to improving the city’s image and spatial order, as well as creating good quality public space, and also reduces the diversity in the development and quality of life of individual city areas [8]. Contemporary system solutions that connect space and transport planning aim for greater use of the bike as a means of transport. Journeys made by private bikes as well as by bike with the bike-sharing system contribute to significant Sustainability 2020, 12, 3285; doi:10.3390/su12083285 www.mdpi.com/journal/sustainability
Transcript of The Bike-Sharing System as an Element of Enhancing ...

sustainability
Article
The Bike-Sharing System as an Element of EnhancingSustainable Mobility—A Case Study based on a Cityin Poland
Elzbieta Macioszek 1,* , Paulina Swierk 2 and Agata Kurek 1
1 Transport Systems and Traffic Engineering Department, Faculty of Transport and Aviation Engineering,Silesian University of Technology, Krasinskiego 8 Street, 40-019 Katowice, Poland; [email protected]
2 Metropolitan Transport Board, Silesian Voivodeship, Barbary 21A Street, 40-053 Katowice, Poland;[email protected]
* Correspondence: [email protected]
Received: 20 March 2020; Accepted: 15 April 2020; Published: 17 April 2020�����������������
Abstract: The bike-sharing system allows urban residents to rent a bike at one of the rental stationslocated in the city, use them for their journey, and return them to any other or the same station. In recentyears, in many cities around the world, such systems were established to encourage their residents touse bikes as an element of enhancing sustainable mobility and as a good complement to travel madeusing other modes of transport. The main purpose of this article is to present the results of an analysisof the functioning of the bike-sharing system in Warsaw (Poland). Moreover, the article presentsan analysis of the accessibility to individual stations. An important aspect is that the bike-sharingsystem has been popular among users and that more people use it. Therefore, the city should beprovided with a dense network of conveniently located bike-sharing stations. Also, the quality ofthe bike-sharing system should be an adjustment to the user’s expectations. In connection with theabove, the article also presents the results of the analysis of factors affecting bike-sharing systemusage as well as the level of satisfaction connected with bike-sharing system usage. The results of theanalysis showed that there is a strong positive correlation between these variables. The obtainedresults can be helpful for carrying out activities whose purpose is to increase the bike-sharing systemusage as well as to increase the level of satisfaction connected with bike-sharing system usage.
Keywords: bike-sharing system; bike; sustainable mobility; road traffic engineering; road transport
1. Introduction
Cities radically change into smart cities because of the increasing mobility of societies, urbangrowth, new products, and technological innovations [1–3]. Also, these factors enforce the need toproperly shape travellers’ behaviour. Currently, in many cities in urban areas, the biggest challenge is toovercome the problem of the prevailing use of private cars [4–7]. Bike-sharing systems are consideredto be an effective tool for popularizing alternative ways of traveling, and can be used as an elementof enhancing sustainable mobility in cities. Sustainable mobility is the communication behavior ofusers shaped in this way in the spatial structure and transport, in which the length of the travelroute is rationalized, individual motorization does not degrade public transport and non-motorizedtransport (walking and cycling), and the functioning of the transport system makes it possible tomaintain harmony with the environment. Sustainable transport is conducive to improving the city’simage and spatial order, as well as creating good quality public space, and also reduces the diversityin the development and quality of life of individual city areas [8]. Contemporary system solutionsthat connect space and transport planning aim for greater use of the bike as a means of transport.Journeys made by private bikes as well as by bike with the bike-sharing system contribute to significant
Sustainability 2020, 12, 3285; doi:10.3390/su12083285 www.mdpi.com/journal/sustainability

Sustainability 2020, 12, 3285 2 of 29
savings and benefits for both bike users and the natural environment (i.e., no negative impact on thequality of life in the city (no noise and no emissions) protection of monuments and flora; better use ofspace, both for movement and parking; less degradation of the road network; improvement of theattractiveness of the city center (business, culture, recreation, social life); reduction of congestion andeconomic losses; increased traffic flow; greater attractiveness of public transport; better access to urbanservices for the whole society; saving time and money of parents who are exempted from taking theirchildren to school; significant saving of time for cyclists on short and medium distances; no possiblenecessity owning a second car by the household (budget increase) [9–11]).
However, travel by bike is not able to meet all mobility needs. In large cities and agglomerations,in highly urbanized areas, as well as in the outskirts and rural areas, the car will still be used. In thesecases, solutions should be implemented that enable it to be used more effectively. D. Jankowska-Karpaand A. Wnuk in their work [9] proposed changes that may contribute to limiting traffic and at the sametime promoting travels by bikes in cities. This may contribute to an increase in the role of travel bybikes in shaping sustainable mobility. These were the following changes:
• At short distances, residents should be encouraged to restrict car use, especially if the journey isshort and begins and ends at home (e.g., home-shop-home). In this case, several solutions can beproposed: bike paths, facilities for pedestrians and cyclists to allow free movement, developmentof convenient infrastructure, e.g., parking spaces, etc.;
• Modernization of streets ensuring the safe and comfortable movement of pedestrians and cyclistsat a distance of at least 1 km around each school and promotion of “pedestrian and bicycle buses”for children, which would contribute the reduction of parking lots and traffic flow around schools;
• Many trips by car taken from work during the lunch break. Initiatives should be taken to promotemore environmentally friendly means of transport around jobs and planning public spaces inoffice districts to reduce the number of cars. Employers can support such initiatives, by creatingbike parking, free bike rentals, installing lockers at workplaces for storing personal things, etc.;
• The so-called “time policy” can be developed to adapt the offer to the needs of mobility. For example,due to heavy traffic during peak hours, in consultation with employers and authorities, it ispossible to synchronize activities and services. This would reduce congestion on some transportnetwork at certain hours. These solutions have already been implemented in some European cities.
The bike-sharing system allows users to rent a bike in one of the automatic stations located in thecity, use it during the journey, and return it at the same or any other station. In recent years, systems ofthis type have been created in many cities around the world to encourage residents to use the bike as anecological mode of transport or as a part of the journey using other modes of transport. The basic ideaof the bike-sharing concept is sustainable transportation. Such systems often operate as part of the city’spublic transport system. They provide fast and easy access, have different business models, and makeuse of applied technology like smart cards and/or mobile phones. Table 1 presents the classification ofbike-sharing systems currently functioning in the world, due to their operating principles.
The area systems can be divided into four generations. The first generation (bike-sharing on thestreets) is the Dutch “Witte Fietsplan” (White Bike Plan), which was announced in 1965 in Amsterdam.Its author was Luud Schimmelpenninck. The purpose of the plan was to provide a maximally simpleto use, widely available communication alternative to growing motorization.

Sustainability 2020, 12, 3285 3 of 29
Table 1. The classification of bike-sharing systems currently functioning in the world, due to theiroperating principles. Source: Own research based on data presented in [12,13].
Operating Principles ofBike-Sharing Systems Bike-Sharing System Description
Point systems
Bike rental and return take place at one or no more than a few points. Thesepoints can be automated or operated by staff. In this case, there are both
typical commercial rentals and public systems that support cycling mobilityby offering free access. A frequent limitation, in this case, is the limited time
of renting and returning bikes within a day.
Area systems
Bike rental and return take place at numerous, any points located on a largearea (usually in the whole area of dense urban development). In this case,
the rental and return procedure is always automated and takes manydifferent forms. This procedure is not usually hourly limited as in the caseof the point systems. Due to the greatest potential for cycling mobility, thisis the most popular form of the bike-sharing system. Its development can be
grouped into subsequent generations.
Point-area systems
Developed based on a close connection between the bike-sharing systemand public transport operators, most often based on railway stations. Inthese systems, bike rental usually takes place at a single point, i.e., at the
railway station node. The return can take place at the rental point but alsoby leaving the bike anywhere in the designated area after completing the
appropriate return procedure.
Long-term bike rental systems
These are systems completing the bike-sharing system in the area andmixed type. These systems based on renting bikes for a longer time (from
months to years). The fee may be one-off or divided into installments in theamount of part of the costs of buying and utilization a private bike. In
systems of this type, users may be required by the regulations, e.g., to userented bikes for a specified number of journeys to nodes and continue thejourney by public transport. These types of systems are a very attractive
alternative to other (open) bike-sharing systems, especially inless-populated, peripheral urban areas and in isolated towns with smallersurface and with lower population density. A variant of this type of systems
is the long-term rental of electric bikes.
At that time, it began to create huge spatial and environmental problems on the narrow streets ofAmsterdam [14,15].
The second generation (bike-sharing systems on bail) started in 1995 in Copenhagen under thename “Bycyclen”. It was the world’s first area-based and automated bike-sharing system consisting of1000 bikes and 110 bike rental and return stations. The principles of its functioning were a generationalbreakthrough: the bike could be rented by placing a coin (deposit) in a special slot. When the bikewas returned, the coin was recovered. Apart from a returnable deposit, the system was free to use.The system was available 24 hours a day, 7 days a week, from mid-April to November. The bikeswere also specially designed—they were very simplified, they had full wheels without spokes andconsisted of parts of unusual sizes connected by custom screws (to prevent stealing of bikes for parts).The operating costs of the system were borne by the city of Copenhagen, private companies, e.g.,Coca Cola, placing ads on bikes, and to some extent the Danish government. The system operatorwas a foundation established by the city authorities. The system only allowed movement aroundthe city center. The users were punishable by a fine when they traveled outside the designated area.In this way, the supervision of bikes was improved. The problem was that in this way it preventedthe main target group from using the bike-sharing system, i.e., people commuting to the center fromneighboring districts. As a result, the system was mainly for tourists. It was a very recognizable andvalued symbol of the city’s tourist attractiveness [16,17].
The beginning of the third generation (smart docks) can be regarded the creation of the “Bikeabout”system in the city Portsmouth in England. At first, the system covered classic student rentals. In 1996
Sustainability 2020, 12, 3285 4 of 29
the system was expanded and fully automated by using personal magnetic cards. The introduction offull user identification for the first time in the history of the bike-sharing systems contributed to thecreation of a system in which no bike has been stolen or damaged. The next step in the development ofthe third-generation bike-sharing systems was the appearance of systems characterized by a muchgreater range and number of stations. Additionally, the use of teleinformatics was the most importantfor supervision and management and introducing relocation to compensate the level of filling thebikes-sharing stations. France has become a significant area of the evolution of the third-generationbike-sharing system. In 1998, the “Velo a la Carte” bike-sharing system was launched in Rennes.It was the first computerized bike-sharing system in the world. This system included 200 bikes,25 docking stations connected to the central management, three service employees, and a special car fortransporting bikes. The system was available to all residents of the city and neighboring metropolitanareas and required a personal magnetic card. Using the vehicle was free within two hours of renting.The business model was based on the public-private partnership of the city authorities with the ClearChannel advertising group [18,19].
The fourth generation (smart bikes): a feature that distinguishes the fourth-generation bike-sharingsystems is the departure from the “smart dock” idea that allows rental and return bikes in dockingstations, towards “smart bikes”. These bikes have built-in identification, rental, closing, and returnof bikes. The role of the dock is taken over by a bike, which is equipped with an electric lockand multi-system electronic supervision in real-time (thanks to the GPS (Global Positioning System)and/or GSM (Global System for Mobile Communications) tracking module). The role of the rentalterminal in the dock was known from the third generation—partly taken over by the smartphonewith Internet access, partly the active rental panel built into the fourth-generation system bike andpowered by dynamos (battery, photovoltaic panel). The second characteristic of the fourth generation,presented in the literature [20,21], is much greater integration of the bike-sharing systems with publictransport systems and car-sharing systems. It is important to create common channels of remoteaccess to information and services, integrated tariffs and fees for systems operating in the same area,and the implementation of integrated electronic access cards (agglomeration city cards, communication,etc.) [22].
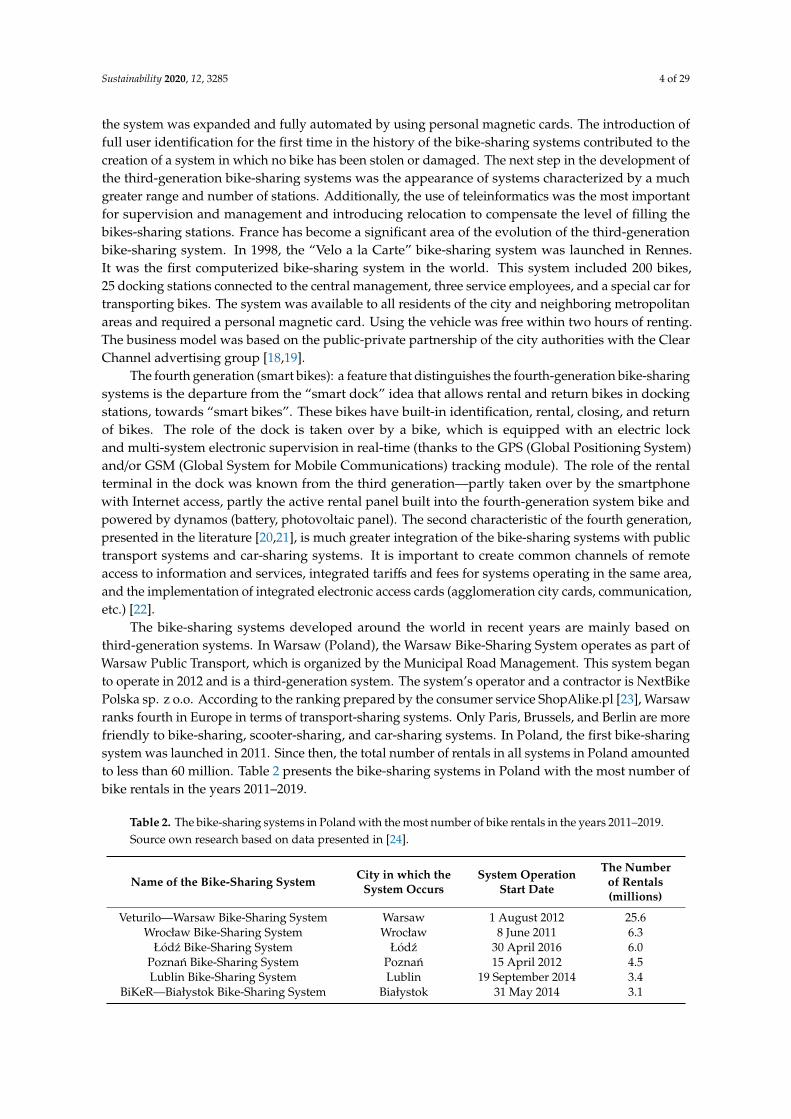
The bike-sharing systems developed around the world in recent years are mainly based onthird-generation systems. In Warsaw (Poland), the Warsaw Bike-Sharing System operates as part ofWarsaw Public Transport, which is organized by the Municipal Road Management. This system beganto operate in 2012 and is a third-generation system. The system’s operator and a contractor is NextBikePolska sp. z o.o. According to the ranking prepared by the consumer service ShopAlike.pl [23], Warsawranks fourth in Europe in terms of transport-sharing systems. Only Paris, Brussels, and Berlin are morefriendly to bike-sharing, scooter-sharing, and car-sharing systems. In Poland, the first bike-sharingsystem was launched in 2011. Since then, the total number of rentals in all systems in Poland amountedto less than 60 million. Table 2 presents the bike-sharing systems in Poland with the most number ofbike rentals in the years 2011–2019.
Table 2. The bike-sharing systems in Poland with the most number of bike rentals in the years 2011–2019.Source own research based on data presented in [24].
Name of the Bike-Sharing System City in which theSystem Occurs
System OperationStart Date
The Numberof Rentals(millions)
Veturilo—Warsaw Bike-Sharing System Warsaw 1 August 2012 25.6Wrocław Bike-Sharing System Wrocław 8 June 2011 6.3
Łódz Bike-Sharing System Łódz 30 April 2016 6.0Poznan Bike-Sharing System Poznan 15 April 2012 4.5Lublin Bike-Sharing System Lublin 19 September 2014 3.4
BiKeR—Białystok Bike-Sharing System Białystok 31 May 2014 3.1
Sustainability 2020, 12, 3285 5 of 29
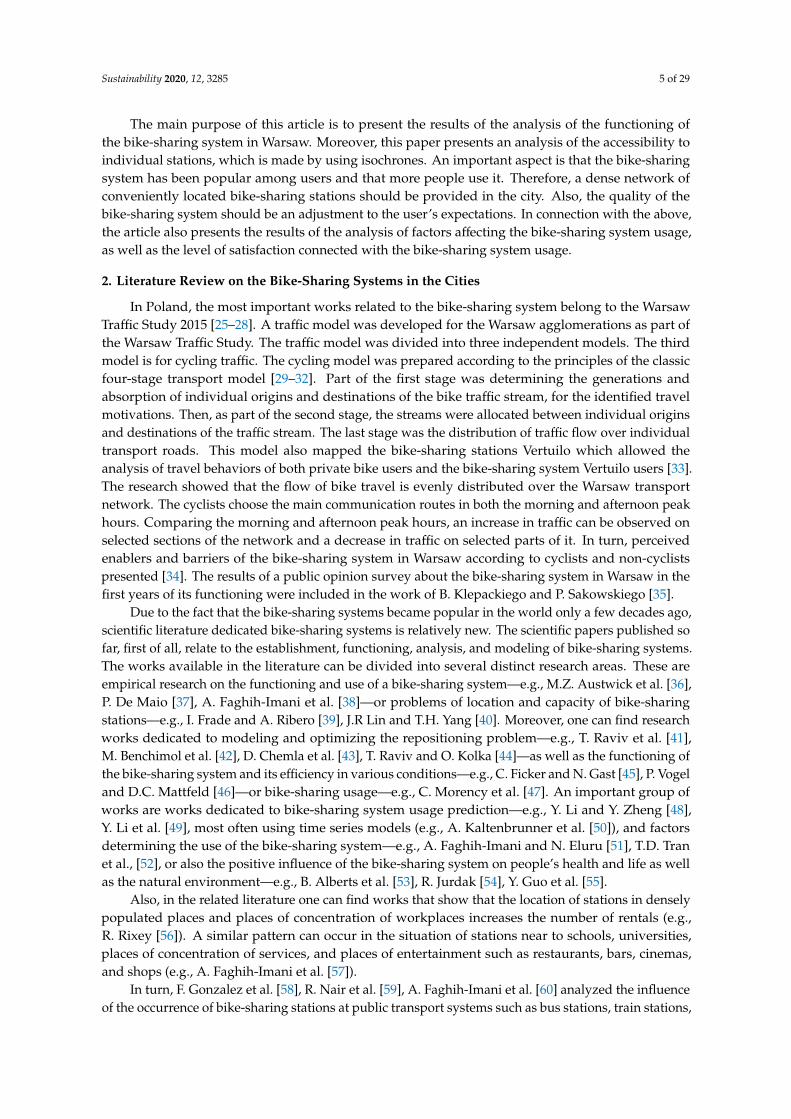
The main purpose of this article is to present the results of the analysis of the functioning ofthe bike-sharing system in Warsaw. Moreover, this paper presents an analysis of the accessibility toindividual stations, which is made by using isochrones. An important aspect is that the bike-sharingsystem has been popular among users and that more people use it. Therefore, a dense network ofconveniently located bike-sharing stations should be provided in the city. Also, the quality of thebike-sharing system should be an adjustment to the user’s expectations. In connection with the above,the article also presents the results of the analysis of factors affecting the bike-sharing system usage,as well as the level of satisfaction connected with the bike-sharing system usage.
2. Literature Review on the Bike-Sharing Systems in the Cities
In Poland, the most important works related to the bike-sharing system belong to the WarsawTraffic Study 2015 [25–28]. A traffic model was developed for the Warsaw agglomerations as part ofthe Warsaw Traffic Study. The traffic model was divided into three independent models. The thirdmodel is for cycling traffic. The cycling model was prepared according to the principles of the classicfour-stage transport model [29–32]. Part of the first stage was determining the generations andabsorption of individual origins and destinations of the bike traffic stream, for the identified travelmotivations. Then, as part of the second stage, the streams were allocated between individual originsand destinations of the traffic stream. The last stage was the distribution of traffic flow over individualtransport roads. This model also mapped the bike-sharing stations Vertuilo which allowed theanalysis of travel behaviors of both private bike users and the bike-sharing system Vertuilo users [33].The research showed that the flow of bike travel is evenly distributed over the Warsaw transportnetwork. The cyclists choose the main communication routes in both the morning and afternoon peakhours. Comparing the morning and afternoon peak hours, an increase in traffic can be observed onselected sections of the network and a decrease in traffic on selected parts of it. In turn, perceivedenablers and barriers of the bike-sharing system in Warsaw according to cyclists and non-cyclistspresented [34]. The results of a public opinion survey about the bike-sharing system in Warsaw in thefirst years of its functioning were included in the work of B. Klepackiego and P. Sakowskiego [35].
Due to the fact that the bike-sharing systems became popular in the world only a few decades ago,scientific literature dedicated bike-sharing systems is relatively new. The scientific papers published sofar, first of all, relate to the establishment, functioning, analysis, and modeling of bike-sharing systems.The works available in the literature can be divided into several distinct research areas. These areempirical research on the functioning and use of a bike-sharing system—e.g., M.Z. Austwick et al. [36],P. De Maio [37], A. Faghih-Imani et al. [38]—or problems of location and capacity of bike-sharingstations—e.g., I. Frade and A. Ribero [39], J.R Lin and T.H. Yang [40]. Moreover, one can find researchworks dedicated to modeling and optimizing the repositioning problem—e.g., T. Raviv et al. [41],M. Benchimol et al. [42], D. Chemla et al. [43], T. Raviv and O. Kolka [44]—as well as the functioning ofthe bike-sharing system and its efficiency in various conditions—e.g., C. Ficker and N. Gast [45], P. Vogeland D.C. Mattfeld [46]—or bike-sharing usage—e.g., C. Morency et al. [47]. An important group ofworks are works dedicated to bike-sharing system usage prediction—e.g., Y. Li and Y. Zheng [48],Y. Li et al. [49], most often using time series models (e.g., A. Kaltenbrunner et al. [50]), and factorsdetermining the use of the bike-sharing system—e.g., A. Faghih-Imani and N. Eluru [51], T.D. Tranet al., [52], or also the positive influence of the bike-sharing system on people’s health and life as wellas the natural environment—e.g., B. Alberts et al. [53], R. Jurdak [54], Y. Guo et al. [55].
Also, in the related literature one can find works that show that the location of stations in denselypopulated places and places of concentration of workplaces increases the number of rentals (e.g.,R. Rixey [56]). A similar pattern can occur in the situation of stations near to schools, universities,places of concentration of services, and places of entertainment such as restaurants, bars, cinemas,and shops (e.g., A. Faghih-Imani et al. [57]).
In turn, F. Gonzalez et al. [58], R. Nair et al. [59], A. Faghih-Imani et al. [60] analyzed the influenceof the occurrence of bike-sharing stations at public transport systems such as bus stations, train stations,

Sustainability 2020, 12, 3285 6 of 29
metro stations, and bus stops. The results of these analyses show that the location of the bike-sharingstations at public transport systems also increases the bike-sharing stations usage.
Analyzing articles on bike-sharing systems, they indicate that the analyses contained in these worksare most often based on data obtained from surveying bike-sharing system users or managers—e.g.,E. Fishman et al. [61], Y. Tang et al. [62], S. Kaplan et al. [63], or surveying the bike-sharing systemoperator—e.g., T. Raviv et al. [41], P. Swierk [64], A. Kurek [65], or online sources of usage atstations—e.g., P. Jimenez et al. [66], R. Hampshire [67], X. Wang et al. [68].
In cities where bike-sharing systems have been operating for a long time, research has beenconducted to obtain information from bike-sharing system users about the quality of system functioning.These data can be used by decision-makers to improve the offer and functioning of the bike-sharingsystem so that it meets users’ expectations as much as possible. Studies on factors affecting onbike-sharing system usage as well as the level of satisfaction connected with bike-sharing system usagehave been conducted so far, e.g., Y. Guo et al. [69]. The purpose of this research was to understandthe factors affecting the low bike-sharing system usage in Ningbo (China). Based on their research afew conclusions connected with planning, engineering, and public advocacy were discussed in orderto increase the bike-sharing system usage in the mentioned city. A similar survey was performedby L. Caggiani et al. [70]. They proposed an optimization model able to determine how to employa given budget to enhancing a bike-sharing system, maximizing global user satisfaction. In turn,C. Etienne and O. Latifa proposed a model for the bike-sharing system in Paris [71], which identifiesthe latent factors that shape the geography of trips, and the results offer insights into the relationshipsbetween station neighborhood type and the generated mobility patterns. G. Manzi and G. Saibene [72]analyzed the level of satisfaction connected with bike-sharing service usage through surveys carriedout in Milan.
In the literature, there are many different scientific papers about the attempt to determine the levelof satisfaction with the bike-sharing system usage, which were conducted in various cities aroundthe world, e.g., F. Xin et al. [73] conducted this type of research for Shanghai, D. Efthymiou et al. [74]for Greece, J. Shi et al. [75] for China. Analyzing these works, it can be stated that the approachesto conducting research were very different in terms of the method of obtaining data for analysis,the number of research samples, the manner of conducting analyses, as well as the conclusions obtained.
3. Veturilo—Warsaw Bike-Sharing System
The operator and contractor of the Warsaw Bike-Sharing System (Veturilo) is the companyNextbike Polska z o.o., which operates under the license of Nextbike GmbH [76]. The Nextbike systemis popular in the world. Currently, it operates in over 200 cities in the world, in 16 countries on4 continents. In Poland, Nextbike operates in dozens of cities. According to the data from the systemoperator, in 2019 in Poland had access for over 8 million people to the bike-sharing system. In Warsaw,it operates in 17 districts (no system in the Wesoła district) and consists of 377 stations (which 335 arecity stations and 42 are sponsor stations, i.e., financed by private parties) (see Figure 1).
Figure 1 shows statistical data characterizing the number of stations, bikes, users and rentals inthe Veturilo system in Warsaw in 2012–2019.
Figure 2 shows the schematic location of the Veturilo bike-sharing stations in Warsaw. At thestations are 5337 bikes, which are available in the following types [78]:
• standard;• children 4+ (dedicated to children over 4 years and 110 cm tall, these bikes have 18-inch wheels);• children 6+ (designed for children over 6 years and 120 cm tall, these bikes have 20-inch wheels);• tandem (designed for two people who sit one behind the other. The tandem has one frame and
two wheels, while each person has its own steering wheel, saddle and pedals. The maximum loadof a tandem is 227 kg);

Sustainability 2020, 12, 3285 7 of 29
• electric (equipped with an electric motor, which covers up to 82% of the effort associated withdriving. The battery allows travel from 60 to 130 km. Electric support works at speeds up to25 km/h);
• bike with cardan shaft (it is not equipped with a chain but with a set of joints that drive the bike.This type of bike is definitely less emergency than a standard bike with a chain).
Sustainability 2020, 11, x FOR PEER REVIEW 7 of 31
Sustainability 2020, 12, x; doi: FOR PEER REVIEW www.mdpi.com/journal/sustainability
0
1000
2000
3000
4000
5000
6000
2012 2013 2014 2015 2016 2017 2018 2019
Years [year]
Number of docking stations Number of bicycles (a) (b)
Figure 1. Characteristics of the Veturilo system in Warsaw in 2012-2019; (a) number of docking stations and bikes; (b) number of bike-sharing systems users and bikes rental.
Figure 1 shows statistical data characterizing the number of stations, bikes, users and rentals in the Veturilo system in Warsaw in 2012-2019.
Figure 2 shows the schematic location of the Veturilo bike-sharing stations in Warsaw. At the stations are 5337 bikes, which are available in the following types [78]:
• standard;
• children 4+ (dedicated to children over 4 years and 110 cm tall, these bikes have 18-inch wheels);
• children 6+ (designed for children over 6 years and 120 cm tall, these bikes have 20-inch wheels);
• tandem (designed for two people who sit one behind the other. The tandem has one frame and two wheels, while each person has its own steering wheel, saddle and pedals. The maximum load of a tandem is 227 kg);
• electric (equipped with an electric motor, which covers up to 82% of the effort associated with driving. The battery allows travel from 60 to 130 km. Electric support works at speeds up to 25 km/h);
• bike with cardan shaft (it is not equipped with a chain but with a set of joints that drive the bike. This type of bike is definitely less emergency than a standard bike with a chain).
The children’s bikes are available at selected stations. The children may use these bikes only in the care of an adult. In turn, the tandem bikes increase the attractiveness of the system in terms of recreation journey and give the possibility of a joint journey of people with the same origin and destination. In addition, a tandem is a great solution, e.g., for people with disabilities who can use this mode of transport only in this form. In Warsaw, the electric bike has been available for rent since August 2017 at one of the eleven selected stations. The electric bikes have a separate price list. Renting an electric bike is more expensive than renting other types of bikes.
Figure 1. Characteristics of the Veturilo system in Warsaw in 2012–2019; (a) number of docking stationsand bikes; (b) number of bike-sharing systems users and bikes rental. Source: Own research based ondata presented in [76–79].Sustainability 2020, 11, x FOR PEER REVIEW 8 of 31
Sustainability 2020, 12, x; doi: FOR PEER REVIEW www.mdpi.com/journal/sustainability
Figure 2. Locations of the Veturilo system stations in Warsaw.
To start using the Veturilo system, it is necessary to register as a user in the system. This can be done in four ways, i.e., by completing the registration form on the website www.veturilo.waw.pl, using the terminal located at each station, using the Veturilo mobile application, or by contacting the 24-hour call center.
Then, the newly created account must be topped up with an initial payment of 10 PLN or a credit card added as a payment method. Account activation is done by clicking on the verification link, which is sent to the e-mail address provided in the registration. After registering, the user receives an SMS and an e-mail containing the PIN code. The PIN code together with the user’s phone number are identifiers in the Veturilo system.
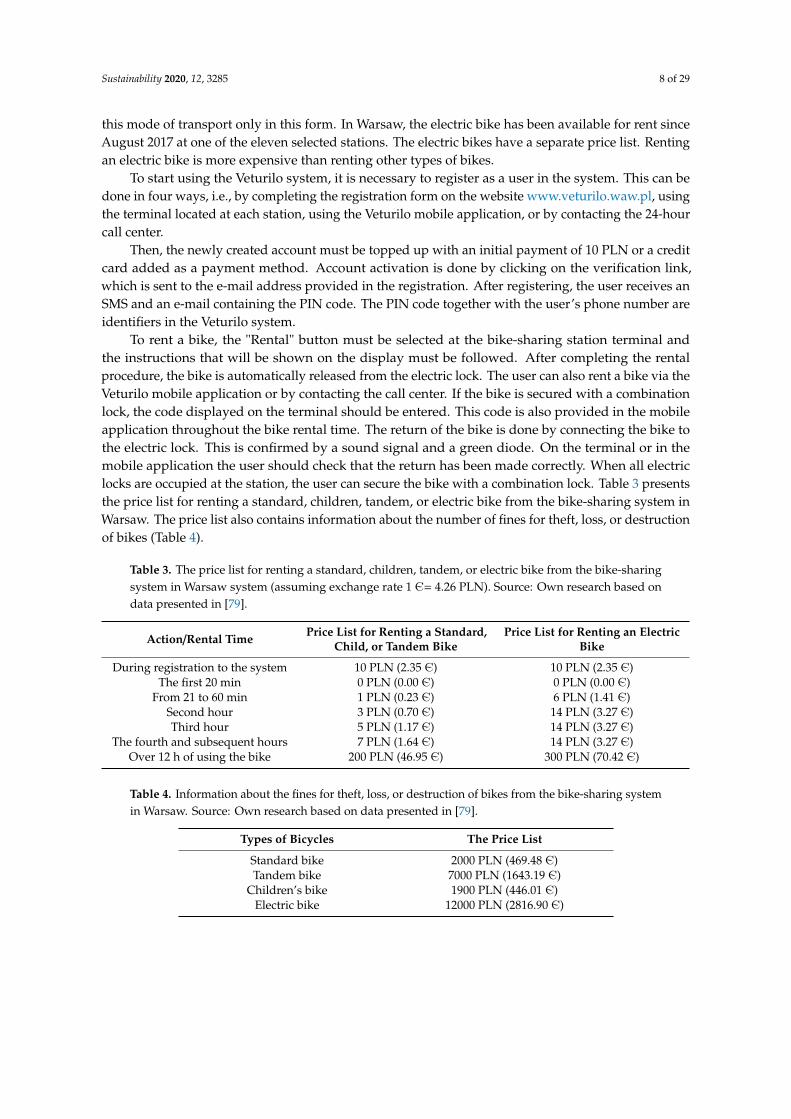
To rent a bike, the "Rental" button must be selected at the bike-sharing station terminal and the instructions that will be shown on the display must be followed. After completing the rental procedure, the bike is automatically released from the electric lock. The user can also rent a bike via the Veturilo mobile application or by contacting the call center. If the bike is secured with a combination lock, the code displayed on the terminal should be entered. This code is also provided in the mobile application throughout the bike rental time. The return of the bike is done by connecting the bike to the electric lock. This is confirmed by a sound signal and a green diode. On the terminal or in the mobile application the user should check that the return has been made correctly. When all electric locks are occupied at the station, the user can secure the bike with a combination lock. Table 3 presents the price list for renting a standard, children, tandem, or electric bike from the bike-sharing system in Warsaw. The price list also contains information about the number of fines for theft, loss, or destruction of bikes (Table 4).
Table 3. The price list for renting a standard, children, tandem, or electric bike from the bike-sharing system in Warsaw system (assuming exchange rate 1 Є = 4.26 PLN). Source: Own research based on data presented in [79].
Figure 2. Locations of the Veturilo system stations in Warsaw. Source: Own research based on datapresented in [64,76,78,79].
The children’s bikes are available at selected stations. The children may use these bikes onlyin the care of an adult. In turn, the tandem bikes increase the attractiveness of the system in termsof recreation journey and give the possibility of a joint journey of people with the same origin anddestination. In addition, a tandem is a great solution, e.g., for people with disabilities who can use
Sustainability 2020, 12, 3285 8 of 29
this mode of transport only in this form. In Warsaw, the electric bike has been available for rent sinceAugust 2017 at one of the eleven selected stations. The electric bikes have a separate price list. Rentingan electric bike is more expensive than renting other types of bikes.
To start using the Veturilo system, it is necessary to register as a user in the system. This can bedone in four ways, i.e., by completing the registration form on the website www.veturilo.waw.pl, usingthe terminal located at each station, using the Veturilo mobile application, or by contacting the 24-hourcall center.
Then, the newly created account must be topped up with an initial payment of 10 PLN or a creditcard added as a payment method. Account activation is done by clicking on the verification link,which is sent to the e-mail address provided in the registration. After registering, the user receives anSMS and an e-mail containing the PIN code. The PIN code together with the user’s phone number areidentifiers in the Veturilo system.
To rent a bike, the "Rental" button must be selected at the bike-sharing station terminal andthe instructions that will be shown on the display must be followed. After completing the rentalprocedure, the bike is automatically released from the electric lock. The user can also rent a bike via theVeturilo mobile application or by contacting the call center. If the bike is secured with a combinationlock, the code displayed on the terminal should be entered. This code is also provided in the mobileapplication throughout the bike rental time. The return of the bike is done by connecting the bike tothe electric lock. This is confirmed by a sound signal and a green diode. On the terminal or in themobile application the user should check that the return has been made correctly. When all electriclocks are occupied at the station, the user can secure the bike with a combination lock. Table 3 presentsthe price list for renting a standard, children, tandem, or electric bike from the bike-sharing system inWarsaw. The price list also contains information about the number of fines for theft, loss, or destructionof bikes (Table 4).
Table 3. The price list for renting a standard, children, tandem, or electric bike from the bike-sharingsystem in Warsaw system (assuming exchange rate 1 Є= 4.26 PLN). Source: Own research based ondata presented in [79].
Action/Rental Time Price List for Renting a Standard,Child, or Tandem Bike
Price List for Renting an ElectricBike
During registration to the system 10 PLN (2.35 Є) 10 PLN (2.35 Є)The first 20 min 0 PLN (0.00 Є) 0 PLN (0.00 Є)
From 21 to 60 min 1 PLN (0.23 Є) 6 PLN (1.41 Є)Second hour 3 PLN (0.70 Є) 14 PLN (3.27 Є)Third hour 5 PLN (1.17 Є) 14 PLN (3.27 Є)
The fourth and subsequent hours 7 PLN (1.64 Є) 14 PLN (3.27 Є)Over 12 h of using the bike 200 PLN (46.95 Є) 300 PLN (70.42 Є)
Table 4. Information about the fines for theft, loss, or destruction of bikes from the bike-sharing systemin Warsaw. Source: Own research based on data presented in [79].
Types of Bicycles The Price List
Standard bike 2000 PLN (469.48 Є)Tandem bike 7000 PLN (1643.19 Є)
Children’s bike 1900 PLN (446.01 Є)Electric bike 12000 PLN (2816.90 Є)
Sustainability 2020, 12, 3285 9 of 29
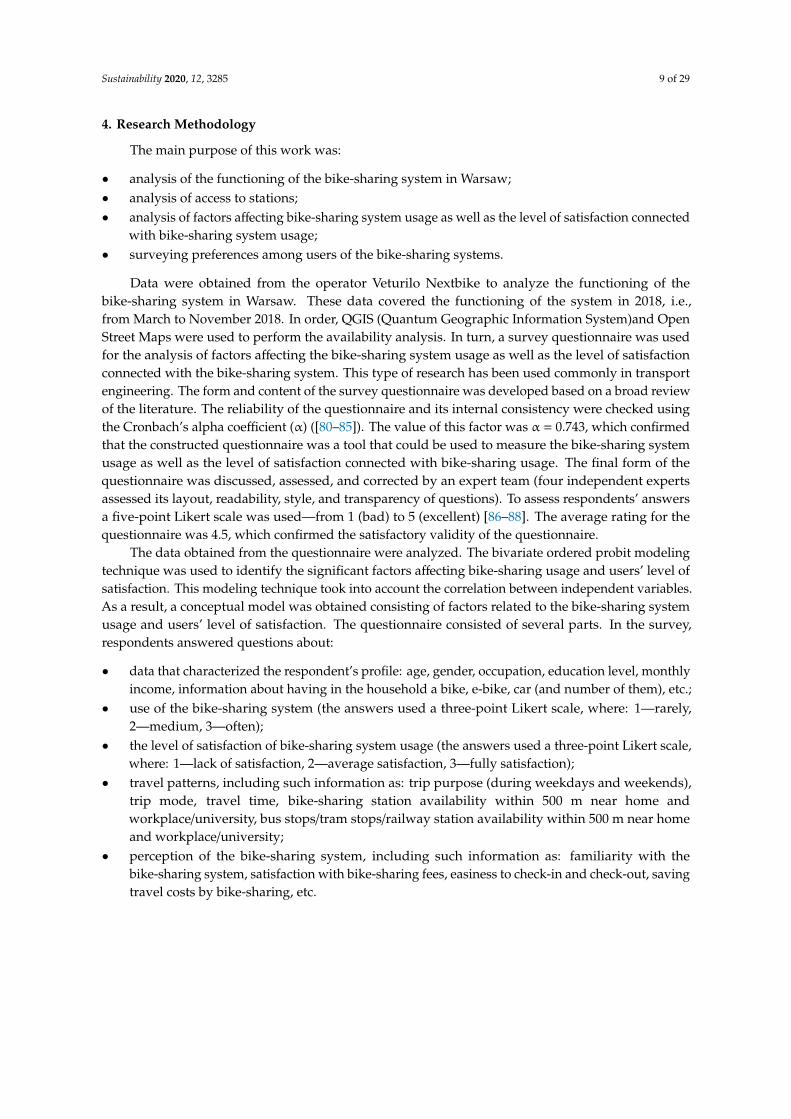
4. Research Methodology
The main purpose of this work was:
• analysis of the functioning of the bike-sharing system in Warsaw;• analysis of access to stations;• analysis of factors affecting bike-sharing system usage as well as the level of satisfaction connected
with bike-sharing system usage;• surveying preferences among users of the bike-sharing systems.
Data were obtained from the operator Veturilo Nextbike to analyze the functioning of thebike-sharing system in Warsaw. These data covered the functioning of the system in 2018, i.e.,from March to November 2018. In order, QGIS (Quantum Geographic Information System)and OpenStreet Maps were used to perform the availability analysis. In turn, a survey questionnaire was usedfor the analysis of factors affecting the bike-sharing system usage as well as the level of satisfactionconnected with the bike-sharing system. This type of research has been used commonly in transportengineering. The form and content of the survey questionnaire was developed based on a broad reviewof the literature. The reliability of the questionnaire and its internal consistency were checked usingthe Cronbach’s alpha coefficient (α) ([80–85]). The value of this factor was α = 0.743, which confirmedthat the constructed questionnaire was a tool that could be used to measure the bike-sharing systemusage as well as the level of satisfaction connected with bike-sharing usage. The final form of thequestionnaire was discussed, assessed, and corrected by an expert team (four independent expertsassessed its layout, readability, style, and transparency of questions). To assess respondents’ answersa five-point Likert scale was used—from 1 (bad) to 5 (excellent) [86–88]. The average rating for thequestionnaire was 4.5, which confirmed the satisfactory validity of the questionnaire.
The data obtained from the questionnaire were analyzed. The bivariate ordered probit modelingtechnique was used to identify the significant factors affecting bike-sharing usage and users’ level ofsatisfaction. This modeling technique took into account the correlation between independent variables.As a result, a conceptual model was obtained consisting of factors related to the bike-sharing systemusage and users’ level of satisfaction. The questionnaire consisted of several parts. In the survey,respondents answered questions about:
• data that characterized the respondent’s profile: age, gender, occupation, education level, monthlyincome, information about having in the household a bike, e-bike, car (and number of them), etc.;
• use of the bike-sharing system (the answers used a three-point Likert scale, where: 1—rarely,2—medium, 3—often);
• the level of satisfaction of bike-sharing system usage (the answers used a three-point Likert scale,where: 1—lack of satisfaction, 2—average satisfaction, 3—fully satisfaction);
• travel patterns, including such information as: trip purpose (during weekdays and weekends),trip mode, travel time, bike-sharing station availability within 500 m near home andworkplace/university, bus stops/tram stops/railway station availability within 500 m near homeand workplace/university;
• perception of the bike-sharing system, including such information as: familiarity with thebike-sharing system, satisfaction with bike-sharing fees, easiness to check-in and check-out, savingtravel costs by bike-sharing, etc.

Sustainability 2020, 12, 3285 10 of 29
The surveys were conducted among users of the bike-sharing system in Warsaw, aroundbike-sharing stations, from 2016 to 2019. All persons participating in the survey had previouslyagreed to participate in the survey. The survey was conducted on weekdays and weekends to obtaina large size and varied answers of the respondents. The random sampling technique was used inorder to select the bike-sharing system users. People over 18 years took part in the survey. A total of1600 questionnaires were collected. The questionnaires were examined in terms of data correctnessand completeness (e.g., the questionnaires were rejected in which: respondents indicated that theywere using the system for the first time; respondents said that they contained incomplete information;respondents could not indicate their assessment, e.g., “I do not know”, “I have no opinion of my own”,“I have not such as situation”). A total of 1584 survey questionnaires remained in the database as aresult of the selection. These data were the basis for analysis.
5. Analysis of the Functioning of Warsaw Bike-Sharing System in 2018
5.1. The Characteristics of System Users and the Structure of Using Bike-Sharing Stations
According to [89], the number of users of the bike-sharing system in Warsaw was 785,000. Figure 3ashows the age structure of users. The obtained data indicated that most users are between 25 and35 years old (which is 37.13% of the total, i.e., about 291,500 people). Another numerous age group ofpeople using Veturilo is the range from 19 to 25 years old. This range is 29.47% of all users (i.e., around231,500 people). The least numerous group of the bike-sharing system users are elderly people overthe age of 66 (6240 users). The average age of people using the system in 2018 was 32 years.
Sustainability 2020, 11, x; doi: FOR PEER REVIEW www.mdpi.com/journal/sustainability
(a) (b)
Figure 3. (a) Age structure; (b) sex structure of people using Veturilo in Warsaw in 2018.
The obtained data also made it possible to state that in 2018 standard bikes were the most often rented (95.5%) and the least often rented were bikes for children 4+ (which was 0.1% of all rentals—i.e., 5821 rentals)—see Figure 4a. In turn, Figure 4b presents data on bike rentals on weekdays and weekends. A total of 72% of all rentals took place on weekdays. In the analyzed period, this was the majority of all rentals. On weekdays, the bikes were rented on average 22,150 times a day. Weekend rentals were 28% of all rentals.
72%
28%
Weekdays Weekend
(a) (b)
Figure 4. The number of bike rentals from the Veturilo system in Warsaw in 2018 (a) considering types of bikes; (b) on weekdays and weekends.
Moreover, Figure 5a shows the number of bike rentals from March to November on weekdays and weekends. The most rentals were in May. In April, June, July, and August, the number of rentals were at a similar level. From August to November a decrease could be observed in the number of Veturilo bike rentals. The least rentals were in March and November. It is possible that this was caused by weather conditions in Poland at this time of the year. The most rentals on weekends took place in April. The number of rentals decreased in each subsequent month. The least rentals on weekends were in March and November, as on weekdays.
Figure 3. (a) Age structure; (b) sex structure of people using Veturilo in Warsaw in 2018. Source:Own research based on data presented in [77].
Figure 3b shows the gender structure of the bike-sharing system users. The data indicate thatslightly more men (55.5%) than women (44.5%) use the bike-sharing system in Warsaw.
The obtained data also made it possible to state that in 2018 standard bikes were the most oftenrented (95.5%) and the least often rented were bikes for children 4+ (which was 0.1% of all rentals—i.e.,5821 rentals)—see Figure 4a. In turn, Figure 4b presents data on bike rentals on weekdays andweekends. A total of 72% of all rentals took place on weekdays. In the analyzed period, this was themajority of all rentals. On weekdays, the bikes were rented on average 22,150 times a day. Weekendrentals were 28% of all rentals.

Sustainability 2020, 12, 3285 11 of 29
Sustainability 2020, 11, x; doi: FOR PEER REVIEW www.mdpi.com/journal/sustainability
(a) (b)
Figure 3. (a) Age structure; (b) sex structure of people using Veturilo in Warsaw in 2018.
The obtained data also made it possible to state that in 2018 standard bikes were the most often rented (95.5%) and the least often rented were bikes for children 4+ (which was 0.1% of all rentals—i.e., 5821 rentals)—see Figure 4a. In turn, Figure 4b presents data on bike rentals on weekdays and weekends. A total of 72% of all rentals took place on weekdays. In the analyzed period, this was the majority of all rentals. On weekdays, the bikes were rented on average 22,150 times a day. Weekend rentals were 28% of all rentals.
72%
28%
Weekdays Weekend
(a) (b)
Figure 4. The number of bike rentals from the Veturilo system in Warsaw in 2018 (a) considering types of bikes; (b) on weekdays and weekends.
Moreover, Figure 5a shows the number of bike rentals from March to November on weekdays and weekends. The most rentals were in May. In April, June, July, and August, the number of rentals were at a similar level. From August to November a decrease could be observed in the number of Veturilo bike rentals. The least rentals were in March and November. It is possible that this was caused by weather conditions in Poland at this time of the year. The most rentals on weekends took place in April. The number of rentals decreased in each subsequent month. The least rentals on weekends were in March and November, as on weekdays.
Figure 4. The number of bike rentals from the Veturilo system in Warsaw in 2018 (a) considering typesof bikes; (b) on weekdays and weekends. Source: Own research based on data presented in [77].
Moreover, Figure 5a shows the number of bike rentals from March to November on weekdaysand weekends. The most rentals were in May. In April, June, July, and August, the number of rentalswere at a similar level. From August to November a decrease could be observed in the number ofVeturilo bike rentals. The least rentals were in March and November. It is possible that this was causedby weather conditions in Poland at this time of the year. The most rentals on weekends took place inApril. The number of rentals decreased in each subsequent month. The least rentals on weekends werein March and November, as on weekdays.
Sustainability 2020, 11, x FOR PEER REVIEW 2 of 31
Sustainability 2020, 12, x; doi: FOR PEER REVIEW www.mdpi.com/journal/sustainability
0
100 000
200 000
300 000
400 000
500 000
600 000
700 000
800 000
Mar
ch
Apr
il
May
June
July
Aug
ust
Sept
embe
r
Oct
ober
Nov
embe
r
Month
Num
ber
of re
ntal
s [re
ntal
]
Weekdays Weekend
0
100 000
200 000
300 000
400 000
500 000
600 000
700 000
00:0
0:00
-00:
59:5
901
:00:
00-0
1:59
:59
02:0
0:00
-02:
59:5
903
:00:
00-0
3:59
:59
04:0
0:00
-04:
59:5
905
:00:
00-0
5:59
:59
06:0
0:00
-06:
59:5
907
:00:
00-0
7:59
:59
08:0
0:00
-08:
59:5
909
:00:
00-0
9:59
:59
10:0
0:00
-10:
59:5
911
:00:
00-1
1:59
:59
12:0
0:00
-12:
59:5
913
:00:
00-1
3:59
:59
14:0
0:00
-14:
59:5
915
:00:
00-1
5:59
:59
16:0
0:00
-16:
59:5
917
:00:
00-1
7:59
:59
18:0
0:00
-18:
59:5
919
:00:
00-1
9:59
:59
20:0
0:00
-20:
59:5
921
:00:
00-2
1:59
:59
22:0
0:00
-22:
59:5
923
:00:
00:2
3:59
:59
Hour [hour]
Num
ber o
f ren
tals
[ren
tal]
(a) (b)
Figure 5. The number of bike rentals from the Veturilo system in Warsaw in 2018; (a) from March to November on weekdays and weekends; (b) at particular hours of the day.
Figure 5b shows the number of bike rentals at particular hours of the day. The largest number of rentals were between 17:00 and 17:59 and between 16:00 and 16:59. In the following hours, the number of rentals decreased, up to hours between 04:00 and 04:59, when the number of rentals was the lowest. Between 07:00 and 11:59, the number of rentals was around 200,000 rentals per hour. In the afternoon this number increased with each subsequent hour until it was maximum value between 17:00 and 17:59.
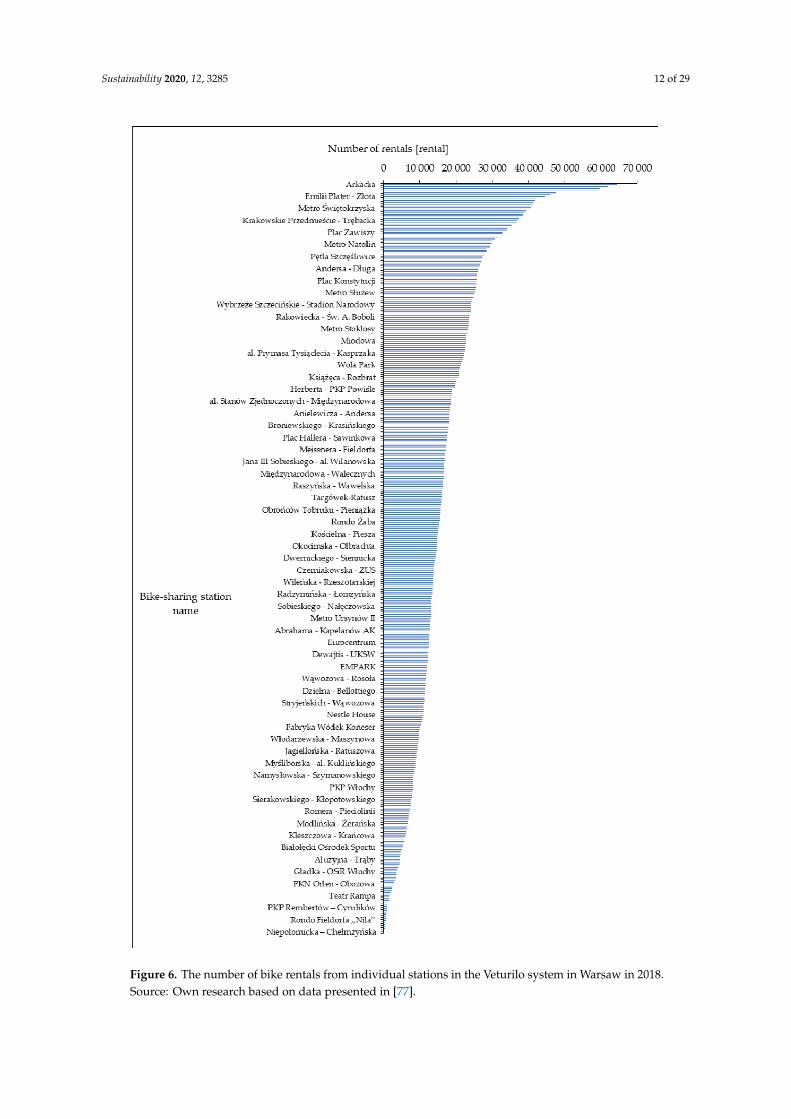
Figure 6 and Figure 7 present the number of bike rentals and returns on particular stations. The most bikes were rented from the stations Arkadia, Plac Wileński, Metro Centrum Nauki Kopernik, and Al. Niepodległości-Batorego, whereas the least were from the stations Komandosów-Niedziałkowskiego, Paderewskiego-Dziewanowska, Frontowa—Czerwonych Beretów, PKN Orlen-Wydawnicza, and Niepołomicka-Chełmżyńska.
In the case of bike returns, the most bikes were returned to the stations Arkadia, Plac Wileński, Metro Centrum Nauki Kopernik, and Al. Niepodległości-Batorego. In turn, the least returns were to the stations Komandosów-Niedziałkowskiego, PKN Orlen-Wersalska, Frontowa-Czerwonych Beretów, PKN Orlen-Wydawnicza, and Niepołomicka-Chełmżyńska.
The average number of rentals and returns from and to each station was around 16,000 rentals/stations in 2018.
Figure 5. The number of bike rentals from the Veturilo system in Warsaw in 2018; (a) from March toNovember on weekdays and weekends; (b) at particular hours of the day. Source: Own research basedon data presented in [77].
Figure 5b shows the number of bike rentals at particular hours of the day. The largest number ofrentals were between 17:00 and 17:59 and between 16:00 and 16:59. In the following hours, the numberof rentals decreased, up to hours between 04:00 and 04:59, when the number of rentals was the lowest.Between 07:00 and 11:59, the number of rentals was around 200,000 rentals per hour. In the afternoonthis number increased with each subsequent hour until it was maximum value between 17:00 and 17:59.
Figures 6 and 7 present the number of bike rentals and returns on particular stations.The most bikes were rented from the stations Arkadia, Plac Wilenski, Metro CentrumNauki Kopernik, and Al. Niepodległosci-Batorego, whereas the least were from the stationsKomandosów-Niedziałkowskiego, Paderewskiego-Dziewanowska, Frontowa—Czerwonych Beretów,PKN Orlen-Wydawnicza, and Niepołomicka-Chełmzynska.
Sustainability 2020, 12, 3285 12 of 29
Sustainability 2020, 11, x FOR PEER REVIEW 3 of 31
Sustainability 2020, 12, x; doi: FOR PEER REVIEW www.mdpi.com/journal/sustainability
Figure 6. The number of bike rentals from individual stations in the Veturilo system in Warsaw in 2018.
Figure 6. The number of bike rentals from individual stations in the Veturilo system in Warsaw in 2018.Source: Own research based on data presented in [77].

Sustainability 2020, 12, 3285 13 of 29
Sustainability 2020, 11, x FOR PEER REVIEW 4 of 31
Sustainability 2020, 12, x; doi: FOR PEER REVIEW www.mdpi.com/journal/sustainability
Figure 7. The number of bike returns to individual stations in the Veturilo system in Warsaw in 2018.
5.2. The Bike-Sharing Stations in the Criterion of Popularity among Users
Figure 7. The number of bike returns to individual stations in the Veturilo system in Warsaw in 2018.Source: Own research based on data presented in [77].

Sustainability 2020, 12, 3285 14 of 29
In the case of bike returns, the most bikes were returned to the stations Arkadia, Plac Wilenski,Metro Centrum Nauki Kopernik, and Al. Niepodległosci-Batorego. In turn, the least returns were tothe stations Komandosów-Niedziałkowskiego, PKN Orlen-Wersalska, Frontowa-Czerwonych Beretów,PKN Orlen-Wydawnicza, and Niepołomicka-Chełmzynska.
The average number of rentals and returns from and to each station was around 16,000rentals/stations in 2018.
5.2. The Bike-Sharing Stations in the Criterion of Popularity among Users
Figure 8 shows the bike-sharing stations which were the most and the least popular amongsystem users in 2018. The most popular stations included: Metro Centrum Nauki Kopernik, Arkadia,Plac Wilenski, Al. Niepodległosci-Batorego, Port Czerniakowski, Rondo Jazdy Polskiej, EmiliiPlater-Złota, Plac Unii Lubelskiej, Stefana Banacha-UW, Metro Nowy Swiat-Uniwersytet, MetroSwietokrzyska, Rondo ONZ, Sanguszki-Wybrzeze Gdanskie, Al. Jerozolimskie-Emilii Plater, Al. JanaPawła II- Plac Mirowski, Metro Dworzec Gdanski, Krakowskie Przedmiescie-Trebacka, Al. Jana PawłaII-Grzybowska, Czerniakowska-Gagarina, Plac na Rozdrozu, Rondo Waszyngtona-Stadion Narodowy,Al. Jana Pawła II-Al. Solidarnosci, Belwederska-Gagarina, Grójecka-Bitwy Warszawskiej 1920 roku,Metro Kabaty, Rondo Wiatraczna, Sobieskiego-Chełmska, and Metro Imielin. In turn, the least popularstations included: Niepołomicka-Chełmzynska, PKN Orlen-Wydawnicza, PKN Orlen-Wersalska,Frontowa-Czerwonych Beretów, Paderewskiego-Dziewanowska, Komandosów-Niedziałkowskiego,Rondo Fieldorfa “Nila”, PKN Orlen-Migdałowa, CH Marywilska 44, PKP Rembertów-Marsa, and PKNOrlen-Powsinska.
Sustainability 2020, 11, x FOR PEER REVIEW 5 of 31
Sustainability 2020, 12, x; doi: FOR PEER REVIEW www.mdpi.com/journal/sustainability
Figure 8 shows the bike-sharing stations which were the most and the least popular among system users in 2018. The most popular stations included: Metro Centrum Nauki Kopernik, Arkadia, Plac Wileński, Al. Niepodległości-Batorego, Port Czerniakowski, Rondo Jazdy Polskiej, Emilii Plater-Złota, Plac Unii Lubelskiej, Stefana Banacha-UW, Metro Nowy Świat-Uniwersytet, Metro Świętokrzyska, Rondo ONZ, Sanguszki-Wybrzeże Gdańskie, Al. Jerozolimskie-Emilii Plater, Al. Jana Pawła II- Plac Mirowski, Metro Dworzec Gdański, Krakowskie Przedmieście-Trębacka, Al. Jana Pawła II-Grzybowska, Czerniakowska-Gagarina, Plac na Rozdrożu, Rondo Waszyngtona-Stadion Narodowy, Al. Jana Pawła II-Al. Solidarności, Belwederska-Gagarina, Grójecka-Bitwy Warszawskiej 1920 roku, Metro Kabaty, Rondo Wiatraczna, Sobieskiego-Chełmska, and Metro Imielin. In turn, the least popular stations included: Niepołomicka-Chełmżyńska, PKN Orlen-Wydawnicza, PKN Orlen-Wersalska, Frontowa-Czerwonych Beretów, Paderewskiego-Dziewanowska, Komandosów-Niedziałkowskiego, Rondo Fieldorfa “Nila”, PKN Orlen-Migdałowa, CH Marywilska 44, PKP Rembertów-Marsa, and PKN Orlen-Powsińska.
Figure 8. The bike-sharing stations; (a) the most popular among users; (b) the least popular among users in 2018.
As can be seen in Figure 8, in the area of two districts of Warsaw, the bike-sharing stations which were the least popular among users are located near the bike-sharing stations which were the most popular among users. In the case of bike-sharing stations located in the Ursynów district, the reason may be that both the bike-sharing stations which were the most popular among users are located near the metro line stations. However, the bike-sharing station which was the least popular among users is located at the Orlen petrol station. Another district in which this is the case is Praga Południe. The bike-sharing station which was the least popular among users, also as in the previous case, is located at the Orlen petrol station. However, the bike-sharing stations which were the most popular among users located in the same district and on the same side of the Vistula River are located near public transport stops, which are served by a large number of bus and tram lines. The above analyses indicate that probably in the case of the most popular among users bike-sharing stations which are located at metro line stations and public transport stops, users are people who use bike-sharing stations as a continuation of their journey.
5.3. Pedestrian Accessibility to the Bike-Sharing Stations
The quality of bike-sharing stations functioning depends on, e.g., time of arrival at the nearest station, the accessible bikes at the station, the technical condition of the bikes, prices for using the
Figure 8. The bike-sharing stations; (green) the most popular among users; (red) the least popularamong users in 2018. Source: Own research based on data presented in [77].
As can be seen in Figure 8, in the area of two districts of Warsaw, the bike-sharing stations whichwere the least popular among users are located near the bike-sharing stations which were the mostpopular among users. In the case of bike-sharing stations located in the Ursynów district, the reasonmay be that both the bike-sharing stations which were the most popular among users are locatednear the metro line stations. However, the bike-sharing station which was the least popular amongusers is located at the Orlen petrol station. Another district in which this is the case is Praga Południe.The bike-sharing station which was the least popular among users, also as in the previous case,

Sustainability 2020, 12, 3285 15 of 29
is located at the Orlen petrol station. However, the bike-sharing stations which were the most popularamong users located in the same district and on the same side of the Vistula River are located nearpublic transport stops, which are served by a large number of bus and tram lines. The above analysesindicate that probably in the case of the most popular among users bike-sharing stations which arelocated at metro line stations and public transport stops, users are people who use bike-sharing stationsas a continuation of their journey.
5.3. Pedestrian Accessibility to the Bike-Sharing Stations
The quality of bike-sharing stations functioning depends on, e.g., time of arrival at the neareststation, the accessible bikes at the station, the technical condition of the bikes, prices for using the bikeas well as cleanliness and equipment of the bike, weather conditions. ArcGIS (Geographic InformationSystems) technologies with the Network Analyst extension were used to analyze pedestrian accessibilityto the bike-sharing stations in Warsaw. It allows realizing various network analyses, e.g., modelingpedestrian or car movements using existing roads. The areas were designated from which it is possibleto get to the bike-sharing station at the assumed travel time (time distance of 5 and 10 min) only on foot.Then, the obtained information was compared with data on the location of residential buildings inWarsaw. This was transformed into indicators showing the spatial extent of accessibility areas and thenumber of inhabitants for which access to particular stations is the best. This made it possible to makea general assessment of the location of stations in terms of the time of arrival using different methods.
The necessary information was used to model the accessibility of the bike-sharing stations(i.e., vector data illustrating the location of single-family and multi-family buildings accessible in theTopographic Objects Database, vector data regarding the streets in Warsaw, data illustrating the locationof bike-sharing stations, obtained as a result of a query of the information in the OpenStreetMap [90]database). The obtained data about the bike-sharing stations were checked and corrected using mapsaccessible on Google Maps [91]. Then, the information was converted to GTFS (General Transit FeedSpecification) format by exporting to text. Figure 9 presents the final results of the analysis of pedestrianaccess to individual bike-sharing stations in Warsaw in the time category (time distance of 5 and10 min). This accessibility is marked on the map with isochrones.
Sustainability 2020, 11, x FOR PEER REVIEW 6 of 31
Sustainability 2020, 12, x; doi: FOR PEER REVIEW www.mdpi.com/journal/sustainability
bike as well as cleanliness and equipment of the bike, weather conditions. ArcGIS (Geographic Information Systems) technologies with the Network Analyst extension were used to analyze pedestrian accessibility to the bike-sharing stations in Warsaw. It allows realizing various network analyses, e.g., modeling pedestrian or car movements using existing roads. The areas were designated from which it is possible to get to the bike-sharing station at the assumed travel time (time distance of 5 and 10 minutes) only on foot. Then, the obtained information was compared with data on the location of residential buildings in Warsaw. This was transformed into indicators showing the spatial extent of accessibility areas and the number of inhabitants for which access to particular stations is the best. This made it possible to make a general assessment of the location of stations in terms of the time of arrival using different methods.
The necessary information was used to model the accessibility of the bike-sharing stations (i.e., vector data illustrating the location of single-family and multi-family buildings accessible in the Topographic Objects Database, vector data regarding the streets in Warsaw, data illustrating the location of bike-sharing stations, obtained as a result of a query of the information in the OpenStreetMap [90] database). The obtained data about the bike-sharing stations were checked and corrected using maps accessible on Google Maps [91]. Then, the information was converted to GTFS (General Transit Feed Specification) format by exporting to text. Figure 9 presents the final results of the analysis of pedestrian access to individual bike-sharing stations in Warsaw in the time category (time distance of 5 and 10 minutes). This accessibility is marked on the map with isochrones.
(a) (b)
Figure 9. Pedestrian access to the bike-sharing station in Warsaw; (a) on the assumption of an average travel time of 5 minutes to the station; (b) on the assumption of an average travel time of 10 minutes to the station.
On the basis of data presented on Figure 9, it can be stated that pedestrian accessibility to bike-sharing stations is very good, assuming travel times to the station of 5 and 10 minutes for stations located in the city center and some districts distant from the center, e.g., Wilanów, Bródno, and Natolin. Pedestrian accessibility deteriorates in districts away from the city center, close to the administrative borders of Warsaw, which is due to the small number of bike-sharing stations in these districts.
6. Analysis of Factors Determining the Bike-Sharing System Usage as Well as the Level of Satisfaction Connected with Bike-Sharing Usage
Figure 9. Pedestrian access to the bike-sharing station in Warsaw; (a) on the assumption of an averagetravel time of 5 min to the station; (b) on the assumption of an average travel time of 10 min to thestation. Source: Own research based on data presented in [77].

Sustainability 2020, 12, 3285 16 of 29
On the basis of data presented on Figure 9, it can be stated that pedestrian accessibility tobike-sharing stations is very good, assuming travel times to the station of 5 and 10 min for stationslocated in the city center and some districts distant from the center, e.g., Wilanów, Bródno, and Natolin.Pedestrian accessibility deteriorates in districts away from the city center, close to the administrativeborders of Warsaw, which is due to the small number of bike-sharing stations in these districts.
6. Analysis of Factors Determining the Bike-Sharing System Usage as Well as the Level ofSatisfaction Connected with Bike-Sharing Usage
6.1. Features of Respondents, Household of Respondents and Travel Patterns
Table 5 presents the results of the cross-tabulation of the respondents in the field bike-sharingsystem usage and level of satisfaction connected with bike sharing-system usage. The bike-sharingsystem usage was defined as a typical ordinal variable according to three groups: (1) rarely—one–twodays per week, (2) average—three–four days per week, and (3) often—five–seven days per week.In turn, the level of satisfaction was also defined as a typical ordinal variable according to three groups:(1) lack of, (2) average, (3) fully.
Table 5. Respondents’ bike-sharing system usage and level of satisfaction connected with using thebike-sharing system.
Usage SatisfactionTotal
Fully Average Lack of
Often 229 102 7 338 (21.34%)Medium 385 212 11 608 (38.38%)Rarely 325 286 27 638 (40.28%)Total 939 (59.28%) 600 (37.88%) 45 (2.84%) 1584 (100%)
Respondents who often used the bike-sharing system were 21.34% of the total, while 38.38% ofall respondents were people who used the bike-sharing system an average amount. This value iscomparable to those who rarely use the bike-sharing system (40.28%). The results confirmed that thebike-sharing system is not used often by users (most of the answers were “average” and “rarely”).
In the case of the level of satisfaction connected with the bike-sharing system usage, it can be statedthat the majority of respondents were fully satisfied with the bike-sharing system and its functionsand they assessed the bike-sharing system at a very high level (59.28%). A total of 37.88% of allrespondents assessed the level of satisfaction connected with the bike-sharing usage at an averagelevel without indicating the disadvantages or advantages of the system. Meanwhile, 2.84% of allrespondents expressed dissatisfaction with the system. The conclusion is that most of all respondentspositively assessed the functioning of the bike-sharing system.
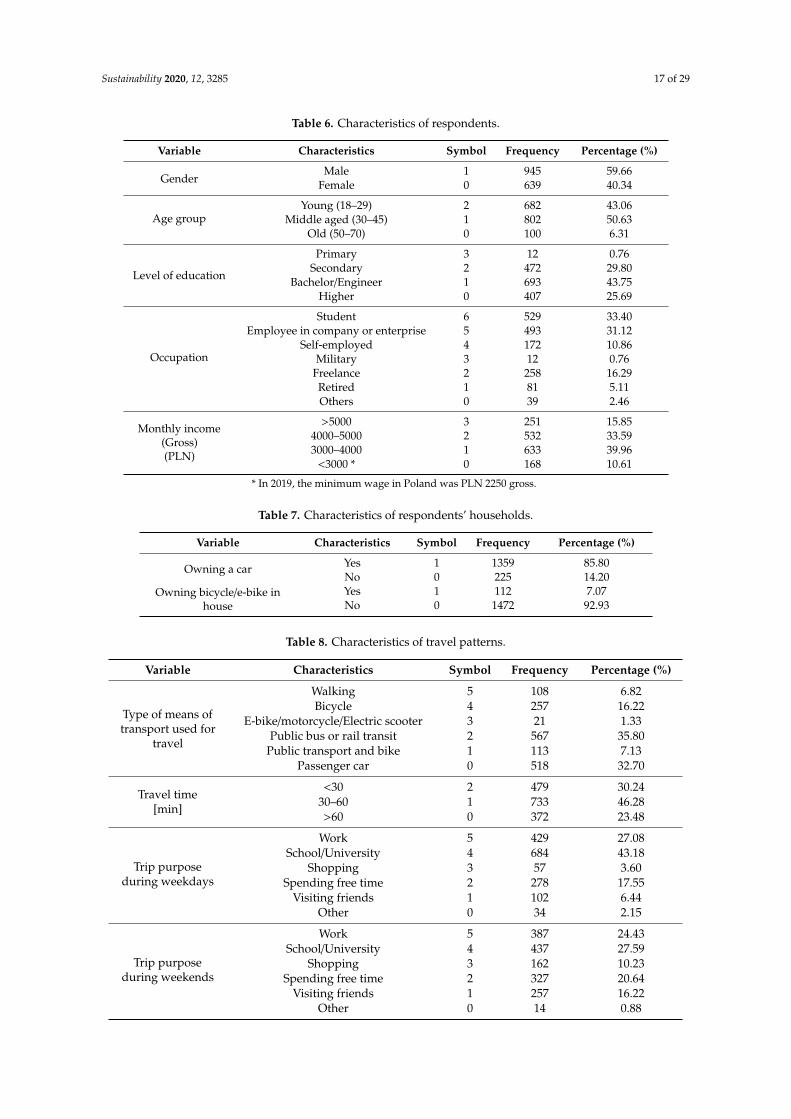
The questions included in the survey allowed the selection of many explanatory variables(independent, endogenous). Then, these variables were used to determine their impact (or no impact)on bike-sharing system usage and users’ level of satisfaction connected with using the bike-sharingsystem. Tables 6–9 present information about the characteristics of households of respondents,travel patterns, and information on the environment in which respondents live (bike-sharing stationavailability close to home/workplace/school/university and bus station/tram stop/railway stationavailability near home/workplace/school/university (within 500 m)).
Sustainability 2020, 12, 3285 17 of 29
Table 6. Characteristics of respondents.
Variable Characteristics Symbol Frequency Percentage (%)
GenderMale 1 945 59.66
Female 0 639 40.34
Age groupYoung (18–29) 2 682 43.06
Middle aged (30–45) 1 802 50.63Old (50–70) 0 100 6.31
Level of education
Primary 3 12 0.76Secondary 2 472 29.80
Bachelor/Engineer 1 693 43.75Higher 0 407 25.69
Occupation
Student 6 529 33.40Employee in company or enterprise 5 493 31.12
Self-employed 4 172 10.86Military 3 12 0.76
Freelance 2 258 16.29Retired 1 81 5.11Others 0 39 2.46
Monthly income(Gross)(PLN)
>5000 3 251 15.854000–5000 2 532 33.593000–4000 1 633 39.96
<3000 * 0 168 10.61
* In 2019, the minimum wage in Poland was PLN 2250 gross.
Table 7. Characteristics of respondents’ households.
Variable Characteristics Symbol Frequency Percentage (%)
Owning a car Yes 1 1359 85.80No 0 225 14.20
Owning bicycle/e-bike inhouse
Yes 1 112 7.07No 0 1472 92.93
Table 8. Characteristics of travel patterns.
Variable Characteristics Symbol Frequency Percentage (%)
Type of means oftransport used for
travel
Walking 5 108 6.82Bicycle 4 257 16.22
E-bike/motorcycle/Electric scooter 3 21 1.33Public bus or rail transit 2 567 35.80
Public transport and bike 1 113 7.13Passenger car 0 518 32.70
Travel time[min]
<30 2 479 30.2430–60 1 733 46.28>60 0 372 23.48
Trip purposeduring weekdays
Work 5 429 27.08School/University 4 684 43.18
Shopping 3 57 3.60Spending free time 2 278 17.55
Visiting friends 1 102 6.44Other 0 34 2.15
Trip purposeduring weekends
Work 5 387 24.43School/University 4 437 27.59
Shopping 3 162 10.23Spending free time 2 327 20.64
Visiting friends 1 257 16.22Other 0 14 0.88
Sustainability 2020, 12, 3285 18 of 29
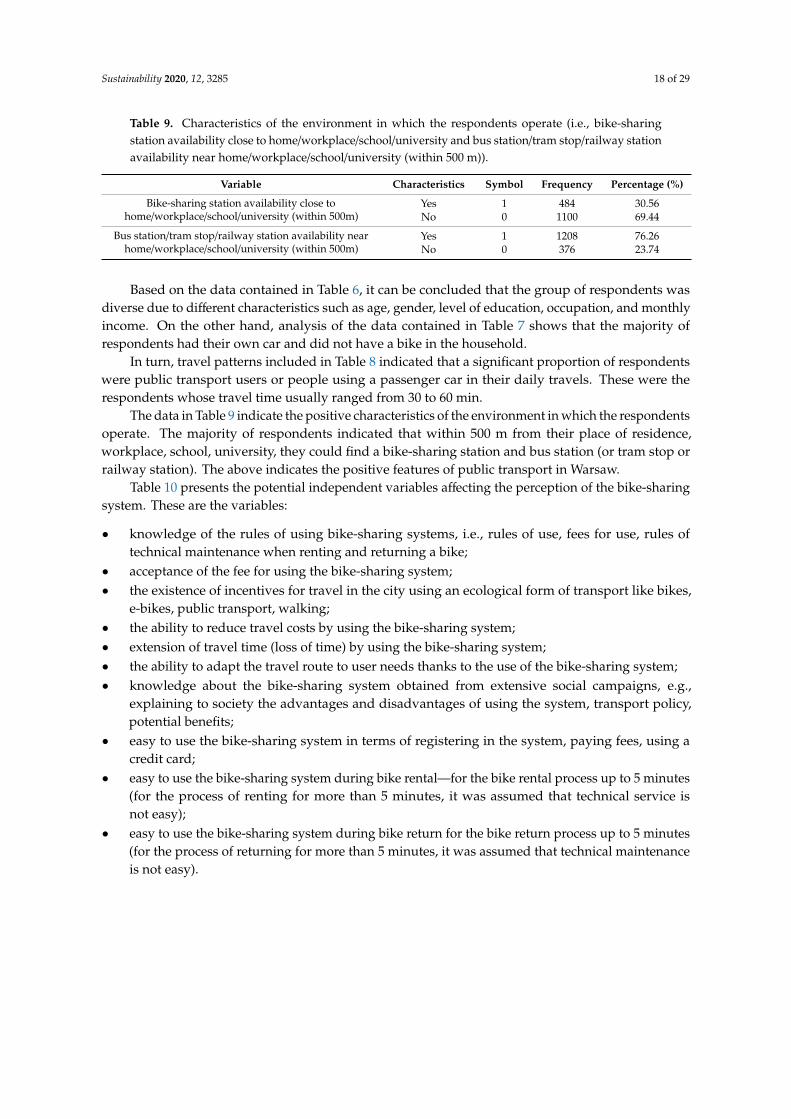
Table 9. Characteristics of the environment in which the respondents operate (i.e., bike-sharingstation availability close to home/workplace/school/university and bus station/tram stop/railway stationavailability near home/workplace/school/university (within 500 m)).
Variable Characteristics Symbol Frequency Percentage (%)
Bike-sharing station availability close tohome/workplace/school/university (within 500m)
Yes 1 484 30.56No 0 1100 69.44
Bus station/tram stop/railway station availability nearhome/workplace/school/university (within 500m)
Yes 1 1208 76.26No 0 376 23.74
Based on the data contained in Table 6, it can be concluded that the group of respondents wasdiverse due to different characteristics such as age, gender, level of education, occupation, and monthlyincome. On the other hand, analysis of the data contained in Table 7 shows that the majority ofrespondents had their own car and did not have a bike in the household.
In turn, travel patterns included in Table 8 indicated that a significant proportion of respondentswere public transport users or people using a passenger car in their daily travels. These were therespondents whose travel time usually ranged from 30 to 60 min.
The data in Table 9 indicate the positive characteristics of the environment in which the respondentsoperate. The majority of respondents indicated that within 500 m from their place of residence,workplace, school, university, they could find a bike-sharing station and bus station (or tram stop orrailway station). The above indicates the positive features of public transport in Warsaw.
Table 10 presents the potential independent variables affecting the perception of the bike-sharingsystem. These are the variables:
• knowledge of the rules of using bike-sharing systems, i.e., rules of use, fees for use, rules oftechnical maintenance when renting and returning a bike;
• acceptance of the fee for using the bike-sharing system;• the existence of incentives for travel in the city using an ecological form of transport like bikes,
e-bikes, public transport, walking;• the ability to reduce travel costs by using the bike-sharing system;• extension of travel time (loss of time) by using the bike-sharing system;• the ability to adapt the travel route to user needs thanks to the use of the bike-sharing system;• knowledge about the bike-sharing system obtained from extensive social campaigns, e.g.,
explaining to society the advantages and disadvantages of using the system, transport policy,potential benefits;
• easy to use the bike-sharing system in terms of registering in the system, paying fees, using acredit card;
• easy to use the bike-sharing system during bike rental—for the bike rental process up to 5 minutes(for the process of renting for more than 5 minutes, it was assumed that technical service isnot easy);
• easy to use the bike-sharing system during bike return for the bike return process up to 5 minutes(for the process of returning for more than 5 minutes, it was assumed that technical maintenanceis not easy).

Sustainability 2020, 12, 3285 19 of 29
Table 10. Potential variables affecting the perception of the bike-sharing system.
Sustainability 2020, 11, x FOR PEER REVIEW 10 of 31
Sustainability 2020, 12, x; doi: FOR PEER REVIEW www.mdpi.com/journal/sustainability
Table 10. Potential variables affecting the perception of the bike-sharing system.
Variable Characteristics Symbol Frequency Percentage
(%)
Knowledge of the principles of using
bike-sharing systems
(i.e., rules of use, fees for use, rules of
maintenance when renting and returning a
bike)
Yes 1 1557 98.30
No 0 27 1.70
The existence of incentives for travel in the
city using an ecological form of transport
(like bikes, e-bikes, public transport,
walking)
Yes 1 251 15.85
No 0 1333 84.15
Acceptance of fees for using a bike-sharing
system
Yes 1 749 47.29
No 0 835 52.71
Extending travel time (loss of time) by
using a bike-sharing system
Yes 1 301 19.00
No 0 1283 81.00
The possibility of reducing travel costs by
using a bike-sharing system
Yes 1 489 30.87
No 0 1095 69.13
Knowledge of the bike-sharing system
obtained from extensive social campaigns
(regarding, among others, explaining to
the public the advantages and
disadvantages of using the system,
transport policy, potential benefits)
Yes 1 61 3.85
No 0 1523 96.15
The option of adapting the travel route to
your needs thanks to the use of a
bike-sharing system
Yes 1 692 43.69
No 0 892 56.31
Easy to use of the bike-sharing system in
terms of registration in the system,
payment of fees, use of a credit card
Yes 1 990 62.50
No 0 594 37.50
Easy to use the bike-sharing system during
the bike rental process up to 5 minutes
Yes 1 1428 90.15
No 0 156 9.85
Easy to use the bike-sharing system during
bike return measured by the time of the
bike return process up to 5 minutes
Yes 1 1390 87.75
No 0 194 12.25
6.2. Bivariate Ordered Probit Model Formulation
A bivariate ordered probit model (BOP) is a hierarchical structure of two equations that can be
used to model the simultaneous relationship of two variables. BOP makes it posisble to solve
potential endogenous problems, e.g., the correlation between the explained variable and the
explanatory variable in the model [92]. The bivariate ordered probit model has been used many
times in modeling the variability of the phenomenon occurring in road transport [93–96].
This study aimed to identify factors that simultaneously determine the bike-sharing system
usage as well as the level of satisfaction connected with bike-sharing system usage. Discrete
modeling techniques were used as the dependent variables consist of category variables. At the
beginning, for each observation ordinal data were defined [94–98]:
6.2. Bivariate Ordered Probit Model Formulation
A bivariate ordered probit model (BOP) is a hierarchical structure of two equations that can beused to model the simultaneous relationship of two variables. BOP makes it posisble to solve potentialendogenous problems, e.g., the correlation between the explained variable and the explanatory variablein the model [92]. The bivariate ordered probit model has been used many times in modeling thevariability of the phenomenon occurring in road transport [93–96].
This study aimed to identify factors that simultaneously determine the bike-sharing system usageas well as the level of satisfaction connected with bike-sharing system usage. Discrete modelingtechniques were used as the dependent variables consist of category variables. At the beginning,for each observation ordinal data were defined [94–98]: y∗i,1 = β1Xi,1 + ei,1, yi,1 = j i f λ j−1 < y∗i,1 < λ j, j = 0, . . . , J
y∗i,2 = β2Xi,2 + ei,2, yi,2 = k i f γk−1 < y∗i,2 < γk, k = 0, . . . , K, (1)

Sustainability 2020, 12, 3285 20 of 29
where y is the integer ordering, y∗i,1, y∗i,2 are the hidden dependent variables,yi,1, yi,2 are the bike-sharingsystem usage results according to the ordinal scale (1, 2, 3) and according to the ordinal scale for levelof satisfaction connected with bike-sharing system usage (1, 2, 3), Xi,1, Xi,2 are vectors consisting ofexplanatory variables in two models, β1, β2 are the parameter vectors for estimation, ei,1, ei,2 are therandom error for the models with normal distribution with mean = 0 and variance = 1, i is individualobservations, j is bike-sharing system usage, k is the level of satisfaction connected with bike sharingusage, λ, γ are the estimated threshold parameters, which define yi,1 and yi,2.
The cross-equation of correlated errors in the BOP model can be written as:[ei,1ei,2
]≈ N
([00
],[
1 rr 1
]), (2)
where r is the correlation coefficient between ei,1 and ei,2.If random errors have the bivariate normal distribution, a common probability for yi,1 = j and
yi,2 = k can be written as:
P(yi,1 = j, yi,2 = k
∣∣∣Xi,1, Xi,2)= Pr
(λ j−1 < y∗i,1 < λ j; γk−1 < y∗i,2 < γk
)= Pr
(λ j−1 < β1Xi,1 + ei,1 < λ j; γk−1 < β2Xi,2 + ei,2 < γk
)= Pr
(λ j−1 − β1Xi,1 < ei,1 < λ j − β1Xi,1;γk−1 − β2Xi,2 < ei,2 < γk − β2Xi,2
)= Ψ2
[(λ j − β1Xi,1
), (γk − β2Xi,2), r
]−Ψ2
[(λ j−1 − β1Xi,1
), (γk − β2Xi,2), r
]−Ψ2
[(λ j − β1Xi,1
), (γk−1 − β2Xi,2), r
]+ Ψ2
[(λ j−1 − β1Xi,1
), (γk−1 − β2Xi,2), r
],
(3)
where Ψ is the cumulative distribution function.Parameters in the BOP model can be calculated by maximizing the log-likelihood function and
are given by:
LL =n∑
i=1
J∑j=0
K∑k=0
δ jk
Ψ2[(λ j − β1Xi,1
), (γk − β2Xi,2), r
]−Ψ2
[(λ j−1 − β1Xi,1
), (γk − β2Xi,2), r
]−Ψ2
[(λ j − β1Xi,1
), (γk−1 − β2Xi,2), r
]+ Ψ2
[(λ j−1 − β1Xi,1
), (γk−1 − β2Xi,2), r
] , (4)
where i = 1,2,3, . . . , and n is the size of the sample.The signs of the factors connected with explanatory variables indicate the positive and negative
effects of the variable on the results. The positive sign means the probability increases of the moststrong result and the probability decreases of the least strong result. In the case of the negative sign,the opposite is true. These coefficients do not determine the quantitative impact of these variables.Also, they cannot be interpreted, in particular for intermediate categories. To determine the influenceon intermediate categories, the marginal effects are calculated at the average sample for each categoryof explanatory variable Xi,1 for yi,1 as [94,99]:
P(yi,1 = j)∂Xi,1
=[τ(λ j−1 − β1Xi1
)− τ
(λ j − β1Xi,1
)]β1, (5)
where P(yi,1 = j) is the probability that bike-sharing system usage is on level j, τ(. . .) is the probabilitymass function of the standard normal distribution, j is the levels of importance ordered by integers,λ is the thresholds.
Thus, the marginal effect of explanatory variable Xi,2 for yi,2 is given as:
P(yi,2 = k)∂Xi,2
= [τ(γk−1 − β2Xi2) − τ(γk − β2Xi,2)]β2. (6)

Sustainability 2020, 12, 3285 21 of 29
6.3. Bivariate Ordered Probit Model Results
In order to determine the factors affecting the bike-sharing system usage as well as the level ofsatisfaction connected with the bike-sharing system usage the bivariate ordered probit model wasdetermined. Table 6 to Table 8 present the explanatory variables and descriptive statistics. In turn,Table 9 presents bivariate ordered probit model results. The obtained results show a significantcorrelation between the bike-sharing system usage as well as the level of satisfaction connected withthe bike-sharing system usage. The obtained results seem logical and find confirmation in reality.Regular users of the bike-sharing system were satisfied with the offered services. In contrast to them,people who rarely used the system indicated its disadvantages. In the final form of the model, variableswere only included which were significant at the 95% confidence level. The correlation parameter waspositive (p = 0.128, p-value = 0.027) which allows us to state that a higher level of satisfaction connectedwith bike-sharing system usage could increase the likelihood of the bike-sharing system usage.
Based on Table 11, it can be concluded that there were 12 significant variables in the model ofthe bike-sharing system usage and 10 significant variables in the model of the level of satisfactionconnected with the bike-sharing system usage. The bivariate ordered probit model results presentedin Table 11 represent the general direction of influence of factors determining bike-sharing systemusage as well as the level of satisfaction connected with bike-sharing system usage. In turn, Tables 12and 13 show the numerical values for those variables that had marginal effects for the bivariate orderedprobit model. The most desirable group of respondents were those who were characterized by “often”bike-sharing system usage and a “fully” level of satisfaction connected with bike-sharing system usage.
Table 11. Bivariate ordered probit model results.
VariableBike-Sharing System Usage
Level of SatisfactionConnected with
Bike-Sharing Usage
βStandard
Error p-Value βStandard
Error p-Value
Gender 0.315 0.062 0.001 - - -Monthly income (Gross) 2000–4000 (PLN) - - - 0.462 0.215 0.036
Monthly income (Gross)4001−∞ (PLN) - - - 0.594 0.273 0.002
Travel time(< 30 min) 0.405 0.123 0.006 - - -Trip mode (bicycle) 0.701 0.164 0.001 - - -
Trip mode (public transport and bicycle) 0.704 0.178 0.002 - - -Bicycle/e-bike in household 0.11 0.082 0.023 - - -
Satisfaction with bike-sharing fees 0.312 0.097 0.018 0.572 0.093 0.000Bike-sharing station close to
home/workplace 0.629 0.201 0.003 0.342 0.171 0.022
Familiarity with bike-sharing system 0.736 0.101 0.001 0.638 0.112 0.034Saving travel cost by bike-sharing - - - 0.407 0.173 0.022
Encouragement of green travel 0.301 0.250 0.00 - - -Flexible route by bike-sharing system 0.328 0.152 0.010 0.418 0.162 0.002Wasting travel time by bike-sharing −0.159 0.101 0.009 - - -
Great effort on the introduction to thepublic 0.482 0.146 0.000 0.389 0.099 0.001
Easy to check-in - - - 0.378 0.141 0.002Easy to check-out - - - 0.302 0.159 0.001
ρ 0.128 0.036 0.027 - - -µ1 2.789 - - - - -µ2 4.276 - - - - -θ1 −0.904 - - - - -θ2 1.538 - - - - -
Number of observations 1584Log-likelihood convergence −1622.03

Sustainability 2020, 12, 3285 22 of 29
Table 12. Numeric values for variables that had marginal effects for the bivariate ordered probit modelin the case of bike-sharing system usage.
Bike-Sharing System Usage Rarely Medium Often
Gender −0.1172 0.0463 0.0709Trip mode (bicycle) −0.2358 0.0250 0.2108
Trip mode (public transport and bicycle) −0.3718 0.0246 0.3472Bicycle, e-bike in household −0.0983 0.0681 0.0302
Travel time (< 30 min) −0.1426 0.0471 0.0955Familiarity with bike-sharing system −0.2199 0.1082 0.1117
Bike-sharing station close to home/workplace −0.3018 0.0967 0.2051Satisfaction with bike-sharing fees −0.0938 0.0429 0.0509
Wasting travel time by bike-sharing 0.0892 −0.0572 −0.0320Encouragement of green travel −0.1702 0.0857 0.0845Flexible route by bike-sharing −0.0798 0.0610 0.0188
Great effort on the introduction to the public −0.3219 0.0529 0.2690
Table 13. Numeric values for variables that had marginal effects for the bivariate ordered probit modelin the case of level of satisfaction connected with bike-sharing system usage.
Level of Satisfaction Connected withBike-Sharing System Usage Lack of Average Fully
Familiarity with bike-sharing −0.3081 −0.2138 0.5219Monthly income (Gross) 2000–4000 (PLN) −0.0078 −0.2394 0.2472Monthly income (Gross) 4001−∞ (PLN) −0.0143 −0.3192 0.3335
Bike-sharing station close to home/workplace −0.0074 −0.0903 0.0977Satisfaction with bike-sharing fees −0.0328 −0.2790 0.3118
Flexible route by bike-sharing −0.0085 −0.2014 0.2099Saving cost by bike-sharing −0.0261 −0.1839 0.2100
Great effort on the introduction to the public −0.0326 −0.2106 0.2432Easy to check-in −0.0267 −0.1523 0.1790
Easy to check-out −0.0084 −0.0623 0.0707
7. Discussion
The analysis presented in the article makes it possible to state that the bike-sharing system playsthe role of an element enhancing sustainable mobility in the city. The data presented in the paper forWarsaw (Poland) indicated that from year to year the number of bike-sharing system users increases.These users are mainly young people in a group of age 19–45, using standard bikes, most often inthe afternoon (from 3:00 p.m. to 9:00 p.m.) and mostly on working days, in the months from Aprilto September. An important aspect is that the bike-sharing system has been popular among usersand that more people use it. Therefore, a dense network of conveniently located bike-sharing stationsshould be provided in the city. Also, the quality of the bike-sharing system should be an adjustment tothe users’ expectations. Hence, this article presented an analysis of the factors the bike-sharing systemusage as well as the level of satisfaction connected with bike-sharing system usage. The results ofthe analysis showed that there is a strong positive correlation between these variables. The obtainedresults can be helpful for carrying out activities to increase bike-sharing system usage as well as thelevel of satisfaction connected with bike-sharing system usage. The analysis presented in this articleallowed us to formulate the following conclusion that respondents do not use often the bike-sharingsystem (they asked about the frequency of using the system, the answers “average” and “rarely” were,respectively, 38.38% and 40.28%), nevertheless, most of the respondents were fully satisfied with thefunctioning of the bike-sharing system and assessed it at a very high level (59.28%). A total of 37.88%of respondents rated the level of satisfaction connected with bike-sharing usage at an average levelwithout indicating the disadvantages or advantages of the system. Meanwhile, respondents who werenot satisfied with the functioning of the system represented 2.84% of the total. Conducted analyses

Sustainability 2020, 12, 3285 23 of 29
allowed us to establish that there is a significant correlation between bike-sharing system usage aswell as the level of satisfaction connected with bike-sharing system usage. The obtained results seemlogical and find confirmation in reality. Regular users of the bike-sharing system are satisfied withthe offered services. In contrast to them, people who rarely use the system indicate its disadvantages.The correlation parameter was positive (p = 0.128, p-value = 0.027) which makes it possible to state thata higher level of satisfaction connected with bike-sharing system usage could increase the likelihood ofbike-sharing system usage. Analysis has shown that men use the bike-sharing system 7% more oftenthan women. The obtained conclusion is consistent with the results of previous research conducted byE. Fishman [100], J. Pucher et al. [101], C.C. Hsu et al. [102]. Moreover, respondents who indicated thatthey have a bike or e-bike in their households more often used the bike-sharing system. This result canbe explained by the fact that those respondents are familiarized with cycling, so they willingly decide touse a bike during their journey. The marginal effect indicated that the probability of bike-sharing systemusage for this group is about 3% higher than respondents without a bike or e-bike in their household.This conclusion is consistent with the obtained results by other authors, e.g., by Y. Guo et al. [69].
Respondents used the bike as well as public transport and bike on their daily journey, they oftenused the bike-sharing system. Marginal effects indicated that the probability of bike-sharing systemusage increases by about 21%–35% for people who travel with these two modes of transport. Similarresearch results are presented in the paper R.B. Noland et al. [103]—metro stations located a shortdistance from the bike-sharing stations contributed to increasing the number of trips. In turn,respondents who indicated that their travel time was less than thirty minutes were 9.55% morelikely to use the bike-sharing system than respondents whose travel time was longer. This conclusionis also confirmed by earlier scientific papers in which travel time using a bike was usually about30 minutes [104–106].
In the case that the availability of the bike-sharing stations is in the distance up to 500 m of home,workplace, school, university, then the probability of “often” bike-sharing system usage increases by20.51%. Additionally, the probability of full satisfaction connected with bike-sharing system usageincreases by 9.77%. M. Austwick et al. [36], Y. Guo et al. [69], and E. Eren et al. [107] obtained similarresults in their works. They indicated that an increasing number of bike-sharing stations causeincreasing bike-sharing system usage, whereas the authors W. El-Assi et al. [108] indicated that thedistance between stations affects the number of trips using a bike-sharing system.
A total of 11.17% of respondents who knew the rules of the bike-sharing system well used thebike-sharing system more often. In addition, the probability of their full satisfaction increased byas much as 52.19%. This conclusion is important because it indicates the need to familiarize thesociety with the principles of the functioning and operation of the bike-sharing system. Activitiesin this area may be conducted by information campaigns or social consultations. These types ofactivities should contribute to increasing the number of bike-sharing system users. Respondents whoaccepted and who expressed their satisfaction with the current fees for using the bike-sharing systemwere characterized by 5.09% higher probability of often using the bike-sharing system. Additionally,they were characterized by 31.18% higher probability of full satisfaction connected with bike-sharingsystem usage. This conclusion is consistent with the results of the works of A. Faghih-Imani and N.Eluru [51], and E. Fishman [100]. The results from these scientific studies showed the relationshipbetween the bike-sharing system usage and respondents financial savings. As shown in the work of Z.Li et al. [109], people usually minimize travel costs.
Respondents who did not want to incur a loss of time in connection with a cycling trip were 3.20%less likely to choose this form of transport. In turn, a great effort connected with the introductionof the bike-sharing system to the city in order to enhance to sustainable mobility also increased thebike-sharing system usage and level of satisfaction respectively by 26.90% and 24.32%. This conclusionconfirms the effectiveness of existing social campaigns and all other activities aimed at encouraging thelocal community to travel using pro-ecological forms of transport and promotes sustainable transport
Sustainability 2020, 12, 3285 24 of 29
development. Respondents who were environmentally friendly and who support ecological forms oftransport were 8.45% more likely to often use bike-sharing systems.
Respondents who recognized the flexible route offered to them by the bike-sharing system tendedto use it often and were fully satisfied with bike-sharing system usage. Marginal effects in these casesshow that the probability of often using bike-sharing systems and full satisfaction connected withbike-sharing system usage increased in this case by 1.88% and 20.99%, respectively. Respondents alsoindicated that easy check-in and easy check-out increase the probability of full satisfaction connectedwith bike-sharing system usage. In this case, the marginal effects show that the probability of fullsatisfaction increased by 17.90% and 7.07%, respectively. Results of analysis also indicated that monthlyincome gross was positively correlated with the level of satisfaction connected with bike-sharingsystem usage. For the respondents with a monthly gross income of 2000–4000 PLN, marginal effectsshowed that the probability of full satisfaction increase by 24.72%. In the case of respondents withmonthly income gross over 4000 PLN the probability of full satisfaction increased by 33.35%. A similarconclusion was found from research carried out by K.M. Gámez-Pérez et al. [110]. In this work it wasindicated that as the socioeconomic level increases, the likelihood that a person will be a user of abike-sharing system decreases.
However, the presented system is not without defects. Its main disadvantages include aninsufficient number of bikes for the disabled, tricycles that could be used by older users, or bikeswith manual drive. In addition, it should consider extending the season by winter, especially in mildwinter. It is also critical to approach children’s bikes and the security level offered by the systemfor this type of user. This disadvantage of the system is also the malfunction of bikes and stations,which the respondents pointed out in their answers. As reported in [111], there were 59,380 reports onbike defects (which accounted for 0.92% of all rentals) and 22,861 reports of station defects in 2018.There was also a decrease in the popularity of the bike-sharing system associated with the increase inthe popularity of electric scooters.
In addition, future analysis would have to be done of the city’s configuration which mightcontribute to strengthening the obtained results about the most integrated bike-sharing routes, as wellas the level of connectivity within the bike-sharing network. In Warsaw agglomeration, where thereare several transport subsystems (pedestrian, bike, individual, and public transport), ensuring a highdegree of their integration is of particular importance. This integration must consist of the continuousmodernization of transport nodes so that users of the bike-sharing system in Warsaw can get anywhereand that they have places to park the bike. The customer service systems should be improved thatsometimes does not work well. Particular importance will be attributed to the qualitative change in thefunctioning of the main transport nodes related to the railway system and the increase in the numberof stations and bikes at stations. To encourage new customers to use these solutions, the cost of useshould not be forgotten, which must be at a level achievable by every resident. It can certainly bestated that the Vertuilo system is integrated with other modes of urban transport. It makes it fasterand healthier to arrive at the previously selected destination. Warsaw is perceived as a city which iscyclist-friendly and choosing innovative solutions that are friendly to the natural environment, thanksto investments and implementation of new projects in the bike-sharing system.
Author Contributions: Conceptualization, E.M., and P.S.; methodology, E.M.; software, A.K.; validation, E.M.,P.S. and A.K.; formal analysis, E.M., and P.S; investigation, P.S. and A.K; resources, P.S. and A.K.; data curation,E.M.; writing—original draft preparation, E.M.; writing—review and editing, E.M.; visualization, A.K., and P.S.;supervision, E.M. All authors have read and agreed to the published version of the manuscript.
Funding: This research received no external funding.
Acknowledgments: The authors wish to acknowledge Nextbike Poland Company for providing access to data forresearch and analysis purposes as well as for their contributions in the understanding of the system. The Authorswould like to also thanks the Students, PhD Student, Graduate from Transport Systems and Traffic EngineeringDepartment, Faculty of Transport and Aviation Engineering, Silesian University of Technology in Katowice whotake part in field questionnaires survey collection.
Sustainability 2020, 12, 3285 25 of 29
Conflicts of Interest: The authors declare no conflict of interest.
References
1. Mrówczynska, B.; Ciesla, M.; Król, A.; Sładkowski, A. Application of artificial intelligence in prediction ofroad freight transportation. Promet Traffic Transp. 2017, 29, 363–370. [CrossRef]
2. Sładkowski, A.; Ciesla, M. Analysis and Development Perspective Scenarios of Transport CorridorsSupporting Eurasian Trade. In Transport Systems and Delivery of Cargo on East–West Routes; Studies in Systems,Decision and Control; Sładkowski, A., Ed.; Springer: Cham, Switzerland, 2018; Volume 155, pp. 70–120.
3. Ciesla, M. Outsourcing strategy selection for transportation services based on the make-or-buy decision.Transp. Probl. 2015, 10, 91–98. [CrossRef]
4. Macioszek, E. Roundabout entry capacity calculation—A case study based on roundabouts in Tokyo, Japan,and Tokyo surroundings. Sustainability 2020, 12, 1533. [CrossRef]
5. Macioszek, E. The Passenger Car Equivalent Factors for Heavy Vehicles on Turbo Roundabouts. Frontiers inBuilt Environment. Sect. Transp. Transit Syst. 2019, 5, 1–13. [CrossRef]
6. Macioszek, E. Changes in Values of Traffic Volume—Case Study Based on General Traffic Measurementsin Opolskie Voivodeship (Poland). In Directions of Development of Transport Networks and Traffic Engineering;Lecture Notes in Networks and Systems 51; Macioszek, E., Sierpinski, G., Eds.; Springer: Cham, Switzerland,2019; pp. 66–76.
7. Macioszek, E. Models of Critical Gaps and Follow-up Headways for turbo Roundabouts. In Roundaboutsas Safe and Modern Solutions in Transport Networks and Systems; Lecture Notes in Networks and Systems 52;Macioszek, E., Akçelik, R., Sierpinski, G., Eds.; Springer: Cham, Switzerland, 2019; pp. 124–134.
8. Rudnicki, A. Zrównowazona mobilnosc a rozwój przestrzenny miasta (Sustainable mobility and spatialdevelopment of a city). Archit. Czas. Tech. 2010, 1-A, 57–74.
9. Jankowska-Karpa, D.; Wnuk, A. System roweru publicznego (Bike Sharing System—BBS) jako elementpolityki zrównowazonej mobilnosci na przykładzie Francji i Polski. Logistyka - Nauka 2014, 6, 4803–4812.
10. Kwiatkowski, M. Bike-sharing boom—Development of new forms of sustainable transport in Poland on theexample of a public bicycle. Transp. Geogr. Pap. Polich Geogr. Soc. 2018, 21, 60–69.
11. Drynda, P. Influence of Bike-share system for sustainable transport on the example of the Opole on bikes.Studia Miej. 2012, 6, 105–115.
12. Metropolitan Area of Gdansk, Gdynia, Sopot: Conceptual study of the Bicycle System Metropolitan Area forthe Metropolitan Area Gdansk—Gdynia—Sopot; Metropolitan Area of Gdansk, Gdynia, Sopot: Gdansk,Poland, 2016.
13. Wazna, A.; Bielinski, T. New Generation of Bike-Sharing Systems in China: Lessons for European Cities.J. Manag. Financ. Sci. 2018, 11, 25–42.
14. Shaheen, S.A.; Guzman, S.; Zhang, H. Bikesharing in Europe, the Americas and Asia: Past, Present andFuture. Transportation Research Record. J. Transp. Res. Board 2010, 2143, 159–167. [CrossRef]
15. Patel, S.J.; Patel, C.R. An Infrastructure Review of Public Bicycle Sharing System (PBSS): Global and IndianScenario. In Innovative Research in Transportation Infrastructure; Deb, D., Balas, V.E., Dey, R., Shah, J., Eds.;Springer: Singapore, 2019; pp. 111–120.
16. Shaheen, S.; Guzman, S. Worldwide bikesharing. Access Mag. 2011, 1, 22–27.17. Parkes, S.D.; Marsden, G.; Shaheen, S.A.; Cohen, A.P. Understanding the diffusion of public bikesharing
systems: Evidence from Europe and North America. J. Transp. Geogr. 2013, 31, 94–103. [CrossRef]18. Frade, I.; Ribeiro, A. Bicycle sharing systems demand. Procedia-Soc. Behav. Sci. 2014, 111, 518–527. [CrossRef]19. Midgley, P. Bicycle-sharing schemes: Enhancing sustainable mobility in urban areas. United Nations Dep.
Econ. Soc. Aff. 2011, 8, 1–12.20. Mátrai, T.; Tóth, J. Comparative assessment of public bike sharing systems. Transp. Res. Procedia 2016, 14,
2344–2351. [CrossRef]21. Dell’Olio, L.; Ibeas, A.; Moura, J.L. Implementing bike-sharing systems. Proc. Inst. Civ. Eng. Munic. Eng.
2011, 164, 89–101. [CrossRef]22. Shen, Y.; Zhang, X.; Zhao, J. Understanding the usage of dockless bike sharing in Singapore. Int. J.
Sustain. Transp. 2018, 12, 686–700. [CrossRef]

Sustainability 2020, 12, 3285 26 of 29
23. Competition for Veturilo You Borrow a Bike and Take it Where You Need. Availableonline: https://warszawa.wyborcza.pl/warszawa/7,54420,22279830,konkurencja-dla-veturilo-pozyczasz-rower-i-oddajesz-go-gdzie.html (accessed on 21 March 2019).
24. Wrocławski Rower Miejski. Available online: https://wroclawskirower.pl/miliony-kilometrow-przejechanych-na-rowerach-miejskich-nextbike-polska/ (accessed on 3 January 2020).
25. Szarata, A., with the Team, Jacyna, M., with the Team: WBR 2005, Warsaw Traffic Study along with theDevelopment of a Traffic Model: Synthesis. BPRW S.A. Available online: http://transport.um.warszawa.pl/wbr-2015 (accessed on 2 February 2020).
26. Szarata, A., with the Team, Jacyna, M., with the Team: WBR, 2015, Warsaw Traffic Study along with theDevelopment of a Traffic Model. Roads and Public Transportation Department of the Capital City of Warsaw.Available online: http://transport.um.warszawa.pl/warszawskie-badanie-ruchu-2015/model-ruchu (accessedon 15 January 2020).
27. Szarata, A., with the Team, Jacyna, M., with the Team: WRR, 2015, Warsaw Bike Report. Roads and PublicTransportation Department of the Capital City of Warsaw. Available online: http://www.transport.um.warszawa.pl/sites/default/files/Raport%20rowerowy%202015.pdf (accessed on 10 January 2020).
28. Jacyna, M.; Wasiak, M.; Gołebiowski, P. Model ruchu rowerowego dla Warszawy według WarszawskiegoBadania Ruchu 2015. Transp. Miej. I Reg. 2016, 10, 5–11.
29. Jacyna, M. Modelowanie i Ocena Systemów Transportowych; Oficyna Wydawnicza Politechniki: Warszawskiej,Warszawa, 2009.
30. Jacyna, M.; Wasiak, M. Modelowanie podziału zadan przewozowych w segmencie przewozów pasazerskich.In Zeszyty Naukowo-Techniczne Stowarzyszenia Inzynierów i Techników Komunikacji w Krakowie; MateriałyKonferencyjne: Seria, Brunei, 2014; Volume 1, pp. 123–135, Association of Polish Engineers andCommunication Technicians, Kracow, Poland.
31. Jacyna-Gołda, I.; Zak, J.; Gołebiowski, P. Models of traffic flow distribution for various scenarios of thedevelopment of proecological transport system. Arch. Transp. 2014, 32, 17–28. [CrossRef]
32. Jacyna, M.; Wasiak, M. Data Exploration for Determining the Parameters of Volume-Delay Function forSections in the Traffic Models for Heavily Urbanized Areas. In Proceedings of the 20th International ScientificConference Transport Means, Juodkrante, Lithuania, 5–7 October 2016; Technologija: Kaunas, Lithuania,2016; pp. 866–871.
33. Jacyna, M.; Wasiak, M.; Kłodawski, M.; Gołebiowski, P. Modelling of bicycle traffic in the Cities using Visum.Procedia Eng. 2017, 187, 435–441. [CrossRef]
34. Iwanska, K.; Blicharska, M.; Pierotti, L.; Tainio, M.; deNazelle, A. Cycling in Warsaw, Poland—Perceivedenablers and barriers according to cyclists and non-cyclists. Transp. Res. Part A 2018, 113, 291–301. [CrossRef][PubMed]
35. Klepacki, B.; Sakowski, P. Warsaw public bicycles network in its users opinion. Logist. Sci. 2014, 4, 3562–3569.36. Austwick, M.Z.; O’Brien, O.; Strano, E.; Viana, M. The structure of spatial networks and communities in
bicycle sharing systems. PLoS ONE 2013, 8, 1–17.37. De Maio, P. Bike-sharing: History, impacts, models of provision, and future. J. Public Transp. 2009, 12, 41–56.
[CrossRef]38. Faghih-Imani, A.; Hampshire, R.; Marla, L.; Eluru, N. An empirical analysis of bike sharing usage and
rebalancing: Evidence from Barcelona and Seville. Transp. Res. Part A 2017, 97, 177–191. [CrossRef]39. Frade, I.; Ribeiro, A. Bike-sharing stations: A maximal covering location approach. Transp. Res. Part A 2015,
82, 216–227. [CrossRef]40. Lin, J.R.; Yang, T.H. Strategic design of public bicycle sharing systems with service level constrains. Transp. Res.
Part E 2011, 47, 284–294. [CrossRef]41. Raviv, T.; Tzur, M.; Forma, I.A. Static repositoring in a bike-sharing system: Models and solution approaches.
Eur. J. Transp. Logist. 2013, 2, 187–229. [CrossRef]42. Benchimol, M.; Benchimol, P.; Chappert, B.; Taille, A.D.L.; Laroche, F.; Meunier, F.; Robinet, L. Balancing the
stations of a self service “bike hire” system. Rairo Oper. Res. 2011, 45, 37–61. [CrossRef]43. Chemla, D.; Meunier, F.; Calvo, R.W. Bike sharing systems: Solving the static rebalancing problem.
Discret. Optim. 2013, 10, 120–146. [CrossRef]44. Raviv, T.; Kolka, O. Optimal inventory management of a bike-sharing station. IIE Trans. 2013, 45, 1077–1093.
[CrossRef]

Sustainability 2020, 12, 3285 27 of 29
45. Fricker, C.; Gast, N. Incentives and Regulations in Bike Sharing Systems with Stations of Finite Capacity.Available online: https://arxiv.org/pdf/1201.1178.pdf (accessed on 6 July 2019).
46. Vogel, P.; Mattfeld, D.C. Modeling of repositioning activities in bike-sharing systems. In Proceeding ofthe 12th world conference on transport research, Transport Research Conference, Lisbon, Portugal, 11–15July 2010.
47. Morency, C.; Trepanier, M.; Paez, A.; Verreault, H.; Faucher, J. Modelling Bikesharing Usage in Montreal over6 Years; Cirrelt, Interuniversity Research Centre on Enterprise Networks, Logistics and Transportation:Montreal, QC, Canada, 2017; pp. 1–16.
48. Li, Y.; Zheng, Y. Citywide Bike Usage Prediction in a Bike-Sharing System. In IEEE Transactions on Knowledgeand Data Engineering; IEEE: Piscataway, NJ, USA, 2019; pp. 1–12.
49. Li, Y.; Zheng, Y.; Zhang, H.; Chen, L. Traffic Prediction in a Bike-Sharing System. In Proceedings of the 23rdACM International Conference on Advances in Geographical Information System, Seattle, DC, USA, 3–6November 2015.
50. Kaltenbrunner, A.; Meza, R.; Grivolla, J.; Codina, J.; Banchs, R. Urban cycles and mobility patterns: Exploringand predicting trends in a bicycle-based public transport system. Pervasive Mob. Comput. 2010, 6, 455–466.[CrossRef]
51. Faghih-Imani, A.; Eluru, N. Incorporating the impact of spatio-temporal interactions on bicycle sharingsystem demand: A case study of New York CityBike system. J. Transp. Geogr. 2016, 54, 218–227. [CrossRef]
52. Tran, T.D.; Ovtracht, N.; d’Arcier, B.F. Modeling bike sharing system using built envinronment factors.Procedia Cirp 2015, 30, 293–298. [CrossRef]
53. Alberts, B.; Palumbo, J.; Perce, E. Vehicle 4 Change: Health Implications of the Capital Bikeshare Program;The George Washington University: Washington, DC, USA, 2012; pp. 1–37.
54. Jurdak, R. The impact of cost and network topology on urban mobility: A study of public bicycle usage in 2US cities. PLoS ONE 2013, 8, 1–6. [CrossRef] [PubMed]
55. Guo, Y.Y.; Liu, P.; Bai, L.; Xu, C.C.; Chen, J. Red light running behavior of electric bicycles at signalizedintersections in China. Transp. Res. Rec. J. Transp. Res. Board 2014, 2468, 28–37. [CrossRef]
56. Rixey, R. Station-level forecasting of bikesharing ridership: Station network effects in three US systems.Transp. Res. Rec. J. Transp. Res. Board 2013, 2387, 46–55. [CrossRef]
57. Faghih-Imani, A.; Eluru, N.; El-Geneidy, A.; Rabbat, M.; Haq, U. How does land-use and urban form impactbicycle flows: Evidence from the bicycle-sharing system (BIXI) in Montreal. J. Transp. Geogr. 2014, 41,306–314. [CrossRef]
58. Gonzalez, F.; Melo-Riquelme, C.; De Grange, L. A combined destination and route choice model for a bicyclesharing system. Transportation 2015, 43, 1–17. [CrossRef]
59. Nair, R.; Miller-Hooks, E.; Hampshire, R.; Busic, A. Large-scale vehicle sharing systems: Analysis of Velib.J. Sustain. Transp. 2013, 7, 85–106. [CrossRef]
60. Faghih-Imani, A.; Eluru, N. Analyzing Bicycle Sharing System User Destination ChoicePreferences: An Investigation of Chicago’s Divvy System. Available online: https://www.semanticscholar.org/paper/Analysing-Bicycle-Sharing-System-User-Destination-%3A-Faghih-Imani/fac01190574742c25ac366035ebb0aa2e22e6e23 (accessed on 2 January 2019).
61. Fishman, E.; Washington, S.; Haworth, N.; Watson, A. Factors influencing bike share membership: An analysisof Melbourne and Brisbane. Transp. Res. Part A 2015, 71, 17–30. [CrossRef]
62. Tang, Y.; Pan, H.; Shen, Q. Bike-sharing systems in Beijing, Shanghai, and Hanghou and their impact ontravel behavior. In Proceedings of the Transportation Research Board 90th Annual Meeting, TransportationResearch Board, Washington, DC, USA, 24–27 January 2011; pp. 1–12.
63. Kaplan, S.; Manca, F.; Nielsen, T.; Prato, C. Intentions to use bike-sharing for holiday cycling: An applicationof the theory of planned behavior. Tour. Manag. 2015, 47, 34–46. [CrossRef]
64. Swierk, P. The Analysis of the Functioning of Bike-Sharing Systems in Warsaw and Cracow. Master’s Thesis,Silesian University of Technology, Faculty of Transport and Aviation Engineering, Transport Systems andTraffic Engineering Department, Katowice, Poland, September 2019.
65. Kurek, A. Analysis of Transport Availability of Warsaw City. Master’s Thesis, Silesian University ofTechnology, Faculty of Transport and Aviation Engineering, Transport Systems and Traffic EngineeringDepartment, Katowice, Poland, June 2019.
Sustainability 2020, 12, 3285 28 of 29
66. Jimenez, P.; Nogal, M.; Caulfield, B.; Pilla, F. Perceptually important points of mobility patterns to characterisebike sharing systems: The Dublin case. J. Transp. Geogr. 2016, 54, 228–239. [CrossRef]
67. Hampshire, R.C.; Marla, L. An analysis of bike sharing usage: Explanation trip generation and attraction fromobserved demand. In Proceedings of the Transportation Research Board 91st Annual Meeting, Washington,DC, USA, 22–26 January 2012; pp. 1–17.
68. Wang, X.; Lindsey, G.; Schoner, J.E.; Harrinson, A. Modeling bike share station activity: The effects of nearbybusinesses and jobs on trips to and from stations. In Proceedings of the Transportation Research Board 92ndAnnual Meeting, Washington, DC, USA, 13–17 January 2013; pp. 1–14.
69. Guo, Y.; Zhou, J.; Wu, Y.; Li, Z. Identifying factors affecting bike-sharing usage and degree of satisfaction inNingbo, China. PLoS ONE 2017, 12, 1–19. [CrossRef]
70. Caggiani, L.; Camporeale, R.; Marinelli, M.; Ottomanelli, M. User satisfaction based model for resourceallocation in bike-sharing systems. Transp. Policy 2019, 80, 117–126. [CrossRef]
71. Etienne, C.; Latifa, O. Model-Based Count series clustering for bike sharing system usage mining: A casestudy with the Velib’System of Paris. Acm Trans. Intell. Syst. Technol. 2014, 5, 39-1–39-21. [CrossRef]
72. Manzi, G.; Saibene, G. Are they telling the truth? Revealing hidden traits of satisfaction with a publicbike-sharing service. Int. J. Sustain. Transp. 2018, 12, 2532–2570. [CrossRef]
73. Xin, F.; Chen, Y.; Wang, X. Cyclist satisfaction evaluation model for free-floating bike-sharing system: A casestudy on Shanghai. Transp. Res. Rec. J. Transp. Res. Board 2018, 2672, 21–32. [CrossRef]
74. Efthymiou, D.; Antoniou, C.; Wadell, P. Factors affecting the adoption of vehicle sharing systems by youngdrivers. Transp. Policy 2013, 29, 64–73. [CrossRef]
75. Shi, J.; Si, H.; Wu, G.; Su, Y.; Lan, J. Critical factors to achieve dockless bike-sharing sustainability in China:A stakeholder-oriented network perspective. Sustainability 2018, 10, 90. [CrossRef]
76. Systemy Rowerów Miejskich. Nextbike. Available online: https://nextbike.pl/ (accessed on 29 December2019).
77. Nextbike Poland Company: Data on Bike-Sharing System in Warsaw. Warsaw 2019, unpublished data.78. Miasto Stołeczne Warszawa. To Był Dobry Rok—Rowerowe Podsumowanie. 2018. Available
online: http://www.um.warszawa.pl/aktualnosci/dobry-rok-rowerowe-podsumowanie-2018 (accessed on 29December 2019).
79. Veturilo. Warszawski Rower Publiczny. Available online: https://www.veturilo.waw.pl/cennik/ (accessed on11 July 2019).
80. Carmines, E.G.; Zeller, R.A. Reliability and Validity Assessment, 5th ed.; Sage Publications Inc.: Beverly Hills,CA, USA, 1982.
81. Cronbach, L.J. Coefficient alpha and the internal structure of tests. Psychometrica 1951, 16, 297–334. [CrossRef]82. Yurdugul, H. Minimum sample size for Cronbach’s coefficient alpha: A Monte-Carlo study. Hacet. Univ.
J. Educ. 2008, 35, 397–405.83. Cortina, J.M. What is Coefficient Alpha? An Examination of Theory and Applications. J. Appl. Psychol. 1993,
104, 78–98. [CrossRef]84. Streiner, D. Starting at the beginning: An introduction to coefficient alpha and internal consistency. J. Personal.
Assess. 2003, 80, 99–103. [CrossRef]85. Tavakol, M.; Dennick, R. Making sense of Cronbach’s alpha. Int. J. Med Educ. 2011, 2, 53–55. [CrossRef]86. Allen, E.; Seaman, C.A. Likert Scales and Data Analyses. Quality Progress 2007. Available online:
http://rube.asq.org/quality-progress/2007/07/statistics/likert-scales-and-data-analyses.html (accessed on 1February 2019).
87. Boone, H.N.; Boone, D.A. Analyzing Likert Data. J. Ext. 2012, 50, 1–5.88. Jamieson, S. Likert scales: How to (ab) use them. Med. Educ. 2004, 38, 1212–1218. [CrossRef]89. Podsumowanie Sezonu Roweru Publicznego w Aglomeracji Warszawskiej. Available online: https://www.
veturilo.waw.pl/podsumowanie-sezonu-roweru-publicznego-w-aglomeracji-warszawskiej/ (accessed on 29December 2019).
90. OpenStreetMap. Available online: https://www.openstreetmap.org/#map=6/51.507/21.560 (accessed on 8August 2019).
91. Google Maps. Available online: https://www.google.pl/maps (accessed on 6 June 2019).92. Greene, W. Estimating Econometric Models with Fixes Effects; Department of Economics, Stern School of
Business, New York University: New York, NY, USA, 2001; pp. 1–14.

Sustainability 2020, 12, 3285 29 of 29
93. Chiou, Y.C.; Hwang, C.C.; Chang, C.C.; Fu, C. Modeling two-vehicle crash severity by a bivariate generalizedordered probit approach. Accid. Anal. Prev. 2013, 51, 175–184. [CrossRef]
94. Anastasopoulos, P.; Karlaftis, M.; Haddock, J.; Mannering, F. Household automobile and motorcycleownership analyzed with random parameters bivariate ordered probit model. Transp. Res. Rec. 2012, 2279,12–20. [CrossRef]
95. Russo, B.J.; Savolainen, P.T.; Schneider, W.H.; Anastasopoulos, P.C. Comparison of factors affecting injuryseverity in angle collisions by fault status using a random parameters bivariate ordered probit model.Anal. Methods Accid. Res. 2014, 2, 21–29. [CrossRef]
96. Weiss, A.A. A bivariate ordered probit model with truncation: Helmet use and motorcycle injuries. J. R. Stat.Soc. Ser. C (Appl. Stat.) 1993, 42, 487–499. [CrossRef]
97. Greene, W.H.; Hensher, D.A. Modeling Ordered Choices, 1st ed.; Cambridge University Press: Cambridge,UK, 2009.
98. Sajaia, Z. Maximum likelihood estimation of a bivariate ordered probit model: Implementation and MonteCarlo simulations. Stata J. 2009, 2, 1–18.
99. Washington, S.; Karlaftis, M.; Mannering, F. Statistical and Econometric Methods for Transportation Data Analysis,2nd ed.; Chapman and Hall/CRC: Boca Raton, FL, USA, 2011.
100. Fishman, E. Bikeshare: A review of recent literature. Transp. Rev. 2016, 36, 92–113. [CrossRef]101. Pucher, J.; Buehler, R.; Seinen, M. Bicycling renaissance in North America? An update and re-appraisal of
cycling trends and policies. Transp. Res. Part A Policy Pract. 2011, 45, 451–475. [CrossRef]102. Hsu, C.C.; Liou, J.J.; Lo, H.W.; Wang, Y.C. Using a hybrid method for evaluating and improving the service
quality of public bike-sharing systems. J. Clean. Prod. 2018, 202, 1131–1144. [CrossRef]103. Noland, R.B.; Smart, M.J.; Guo, Z. Bikeshare trip generation in New York city. Transp. Res. Part A Policy Pract.
2016, 94, 164–181. [CrossRef]104. Mei, Z.; Wang, D.; Chen, J.; Wang, W. Investigation of bicycle travel time estimation using bluetooth sensors
for low sampling rates. Promet Traffic Transp. 2014, 26, 383–391. [CrossRef]105. Shafizadeh, K.; Niemeier, D. Bicycle journey-to-work: Travel behavior characteristics and spatial attributes.
Transp. Res. Rec. J. Transp. Res. Board 1997, 1578, 84–90. [CrossRef]106. Caulfield, B.; O’Mahony, M.; Brazil, W.; Weldon, P. Examining usage patterns of a bike-sharing scheme in a
medium sized city. Transp. Res. Part A Policy Pract. 2017, 100, 152–161. [CrossRef]107. Eren, E.; Uz, V.E. A Review on Bike-Sharing: The Factors Affecting Bike-Sharing Demand. Sustain. Cities Soc.
2019, 54, 101882. [CrossRef]108. El-Assi, W.; Mahmoud, M.S.; Habib, K.N. Effects of built environment and weather on bike sharing demand:
A station level analysis of commercial bike sharing in Toronto. Transportation 2017, 44, 589–613. [CrossRef]109. Li, Z.; Wang, W.; Yang, C.; Ragland, D.R. Bicycle commuting market analysis using attitudinal market
segmentation approach. Transp. Res. Part A Policy Pract. 2013, 47, 56–68. [CrossRef]110. Gámez-Pérez, K.M.; Arroyo-López, P.; Cherry, C.R. Defining a primary market for bikesharing programs:
A study of habits and usage intentions in León, Mexico. Transp. Res. Rec. 2017, 2634, 50–56. [CrossRef]111. Veturilo do garazu. A drogowcy szykuja zmiany. Available online: https://tvn24.pl/tvnwarszawa/najnowsze/
warszawa-koniec-sezonu-veturilo-2416326 (accessed on 3 April 2020).
© 2020 by the authors. Licensee MDPI, Basel, Switzerland. This article is an open accessarticle distributed under the terms and conditions of the Creative Commons Attribution(CC BY) license (http://creativecommons.org/licenses/by/4.0/).