Bike Sharing Demand: Akshay Patil
15
Bike Sharing Demand Prediction PRESENTED BY:- AKSHAY PATIL 14MCB1031 [email protected] RESEARCH FACILITATOR: PROF. BVANSS PRABHAKAR RAO M.TECH 1 ST YEAR RBL FIRST REVIEW PRESENTATION VIT-CHENNAI.
-
Upload
akshay-patil -
Category
Data & Analytics
-
view
224 -
download
5
Transcript of Bike Sharing Demand: Akshay Patil

Bike Sharing Demand Prediction
PRESENTED BY:-AKSHAY PATIL14MCB1031
RESEARCH FACILITATOR:PROF. BVANSS PRABHAKAR RAO
M.TECH 1ST YEAR RBL FIRST REVIEW PRESENTATIONVIT-CHENNAI.
Objective
Primary Objective:To build a superior statistical model to predict the number of bicycles that can be rented with availability of data.
Secondary Objectives:1)To learn how real time data is represented in datasets.2)To understand how to pre-process such data.3)To study comparison of results achieved by various Machine Learning techniques such as Regression, Decision Trees, RandomForests and SVM’s.
Research Scope
Introduction to Bike Sharing Systems.
Use of Data Analysis in such Systems.
Literature Survey
Regression:Package used: lm
Decision Trees:Package Used: rpart, ctree
RandomForests:Package Used: randomForest
SVM:Package Used: e1071
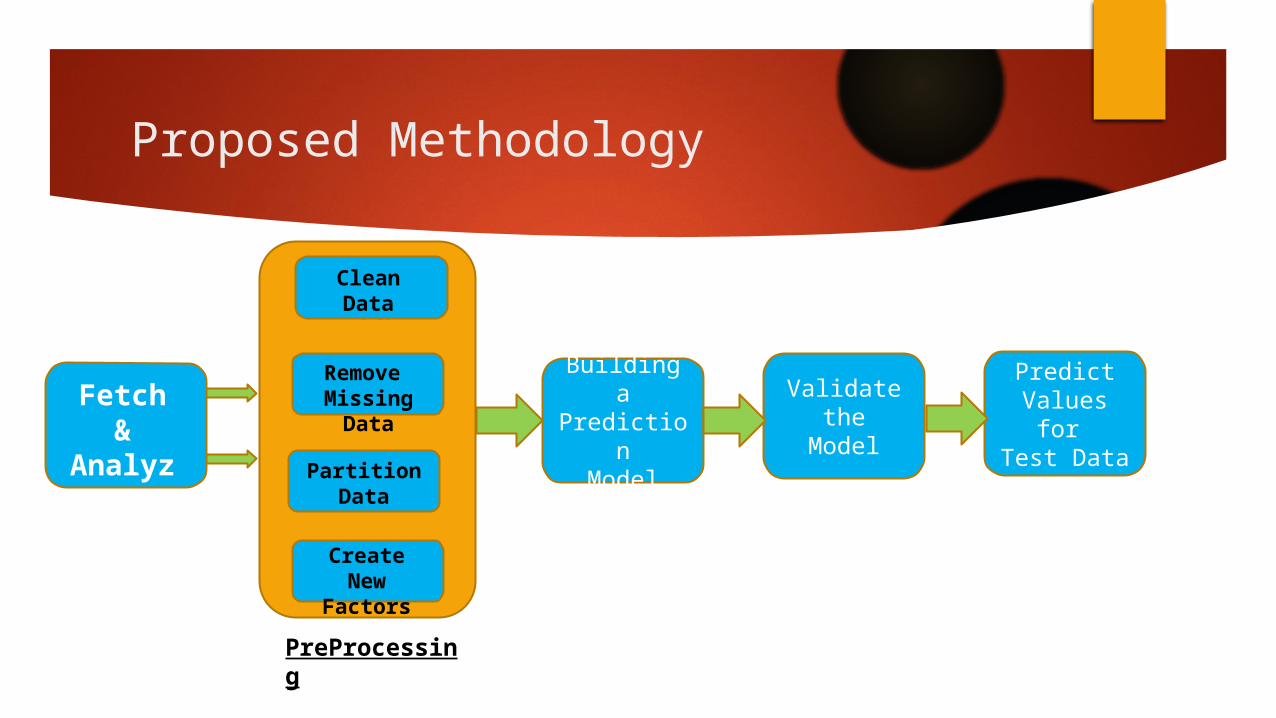
Proposed Methodology
Fetch &
Analyze Data
Clean Data
Partition Data
Remove Missing
Data
CleanData
CreateNew
Factors
PreProcessing
Building aPrediction
Model
Validatethe
Model
Predict Values for Test Data
About Data:
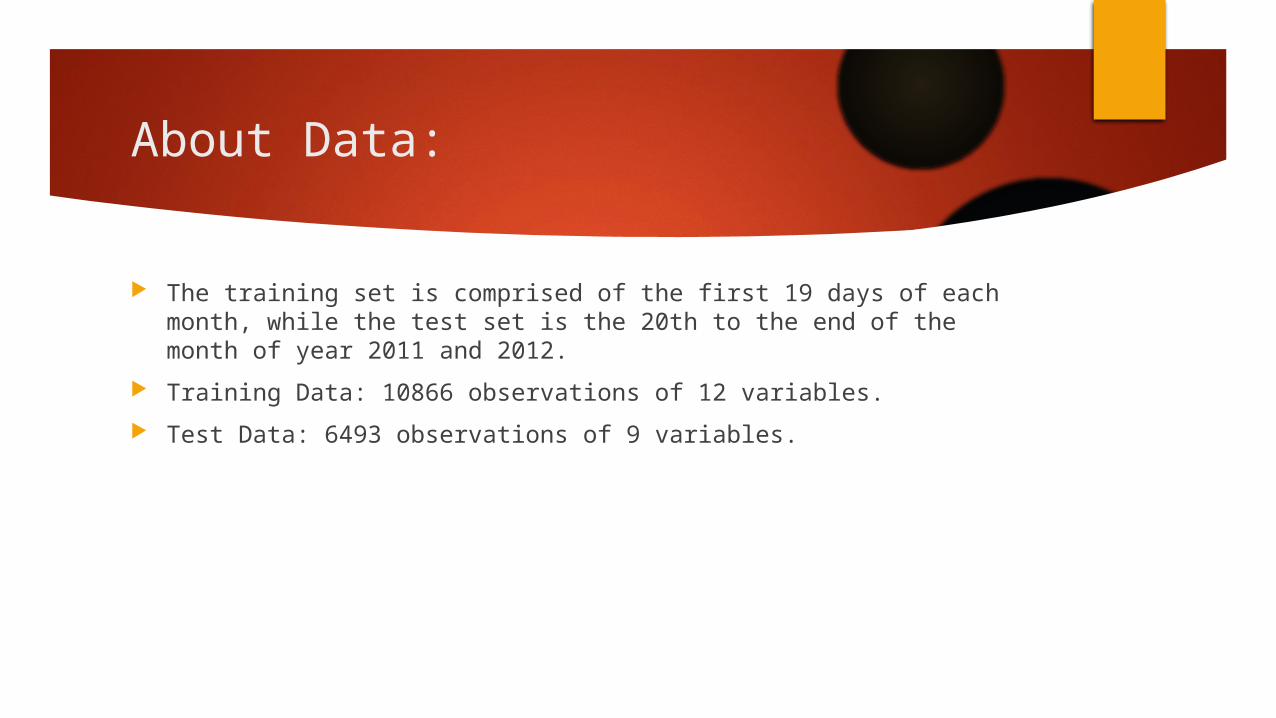
The training set is comprised of the first 19 days of each month, while the test set is the 20th to the end of the month of year 2011 and 2012.
Training Data: 10866 observations of 12 variables.
Test Data: 6493 observations of 9 variables.
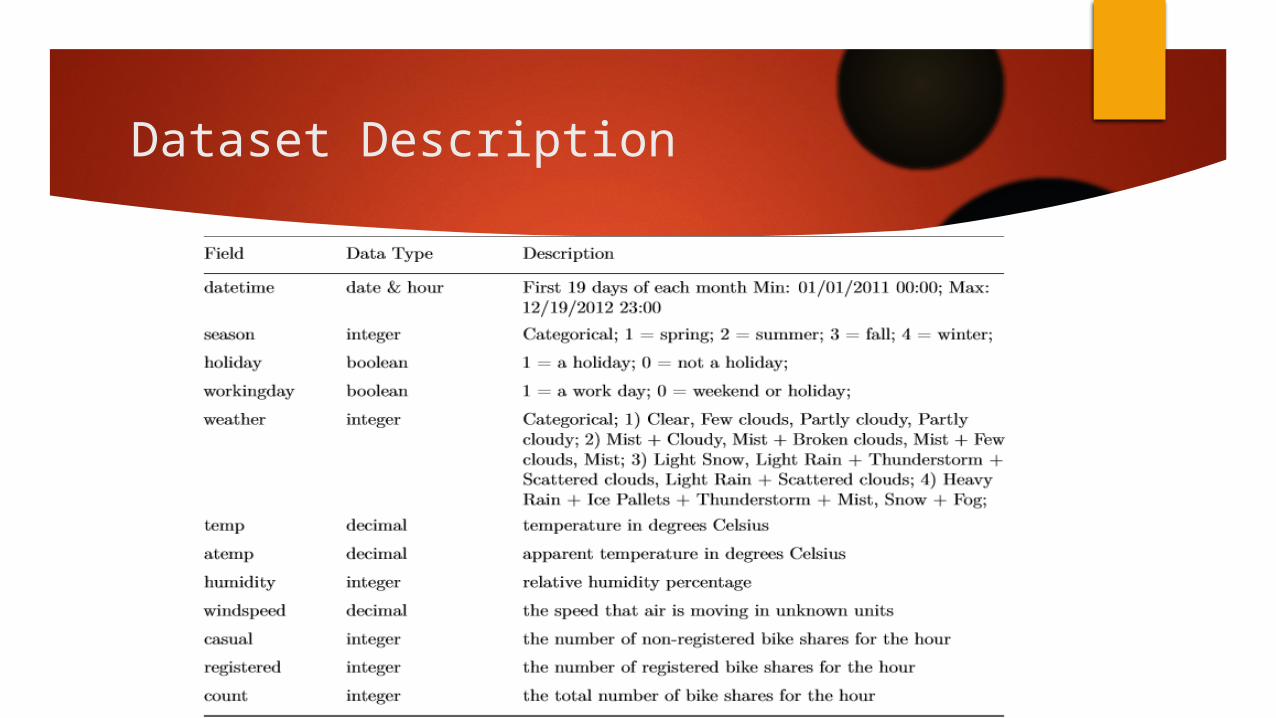
Dataset Description
Implementation Tools
R Weka
Work Done:
Understanding Data
Factorize training set and test set
Create time column by stripping out timestamp
Create new timestamp column
Create day of week column
Create and factorize Sunday variable
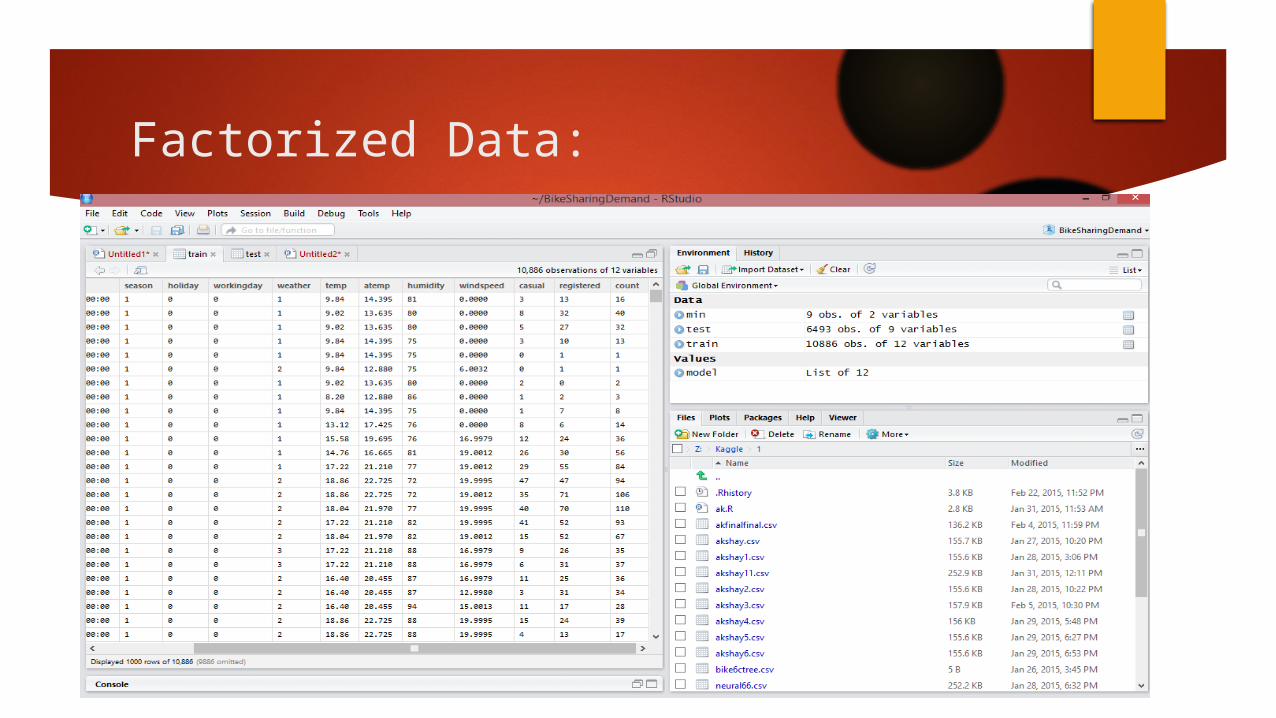
Factorized Data:
Timeline
Till 20th January: Finalizing RBL topic
20th January – 5th February: Understanding dataset and gaining domain knowledge
6th February – 20th February: Literature Survey and methods.
21st February – 20th March: Implementation
21st March- 10th April: Testing and improving model
11th April – 30th April: Writing Paper
Stats:
“In the world of data analysis, Analysts require only 20% of the total project time in building the actual models, about 60% of the period is spent in understanding and pre-processing the data”
- Mat McHogan,
Data Scientist,
SVDS.com
References
1] Bike Sharing Demand: http://www.kaggle.com/c/bike-sharing-demand
2] Fanaee-T, Hadi, and Gama, Joao, Event labeling combining ensemble detectors and background knowledge, Progress in Artificial Intelligence (2013): pp. 1-15, Springer Berlin Heidelberg.
3]Decision Tree Learning: http://www.cs.cmu.edu/afs/cs/project/theo-20/www/mlbook/ch3.pdf4]A Tour of Machine Learning Algorithms: http://machinelearningmastery.com/a-tour-of-machine-learning-algorithms/

AnySuggestions?

Thank You