The Best Practices in Program Portfolio Evaluation - Competitive Intensity
36
Confidential www.GrayAssociates.com 1 Confidential Academic Program Selection and Assessment Choosing Which Programs to Start, Stop, Sustain, or Grow March 2017
-
Upload
gray-associates-inc -
Category
Education
-
view
47 -
download
1
Transcript of The Best Practices in Program Portfolio Evaluation - Competitive Intensity

Confidential www.GrayAssociates.com 1 Confidential
Academic Program Selection and Assessment
Choosing Which Programs to Start, Stop, Sustain, or Grow
March 2017
Confidential www.GrayAssociates.com 2
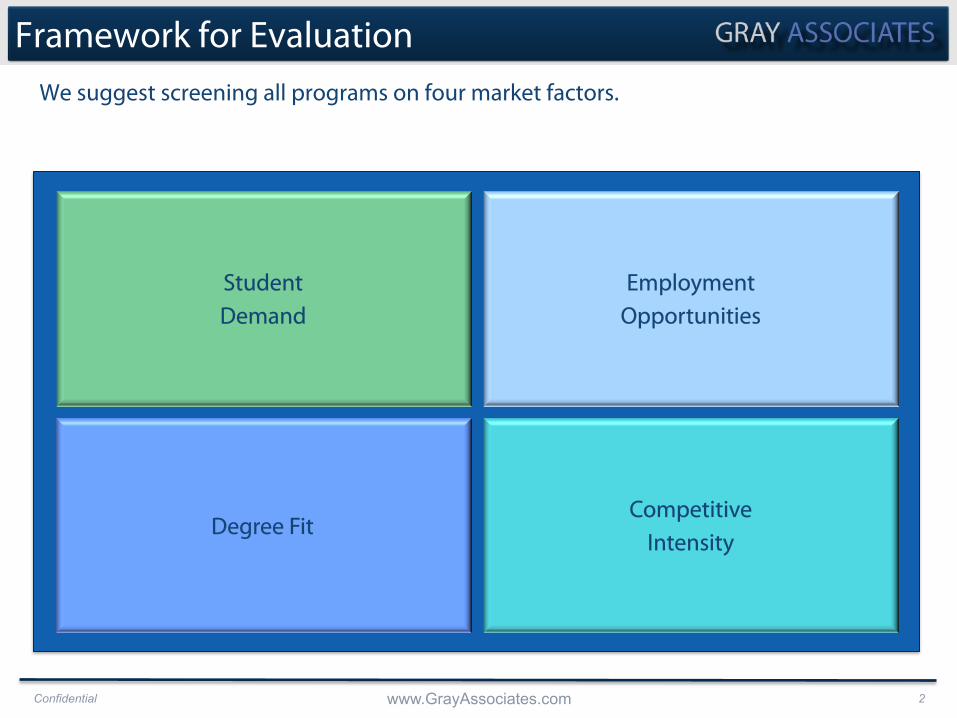
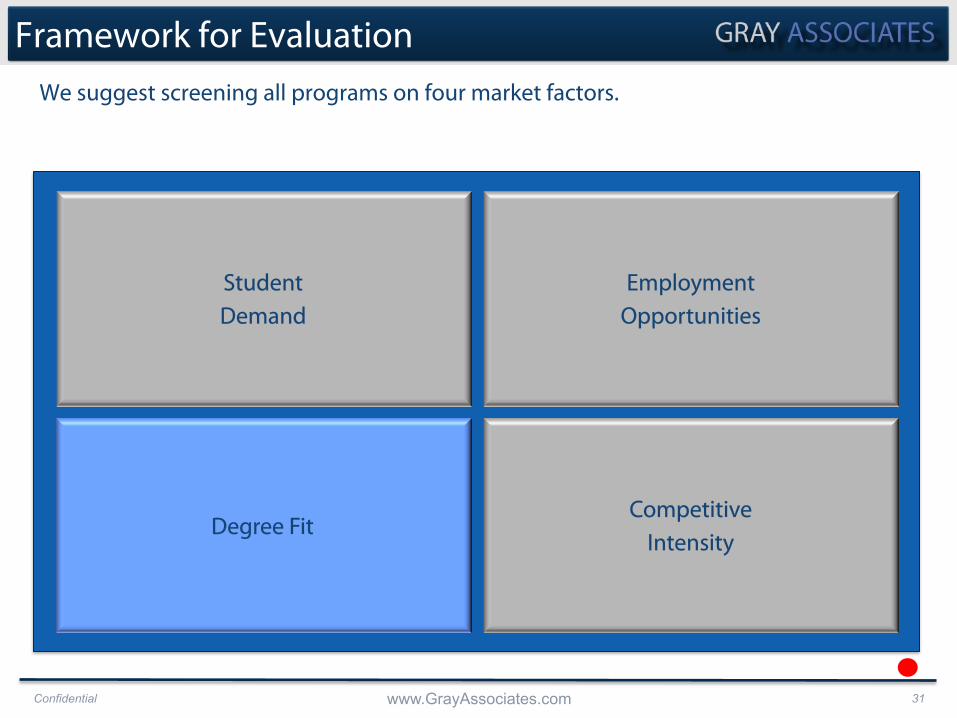
Framework for Evaluation We suggest screening all programs on four market factors.
Student Demand
Employment Opportunities
Degree Fit Competitive
Intensity
Confidential www.GrayAssociates.com 3
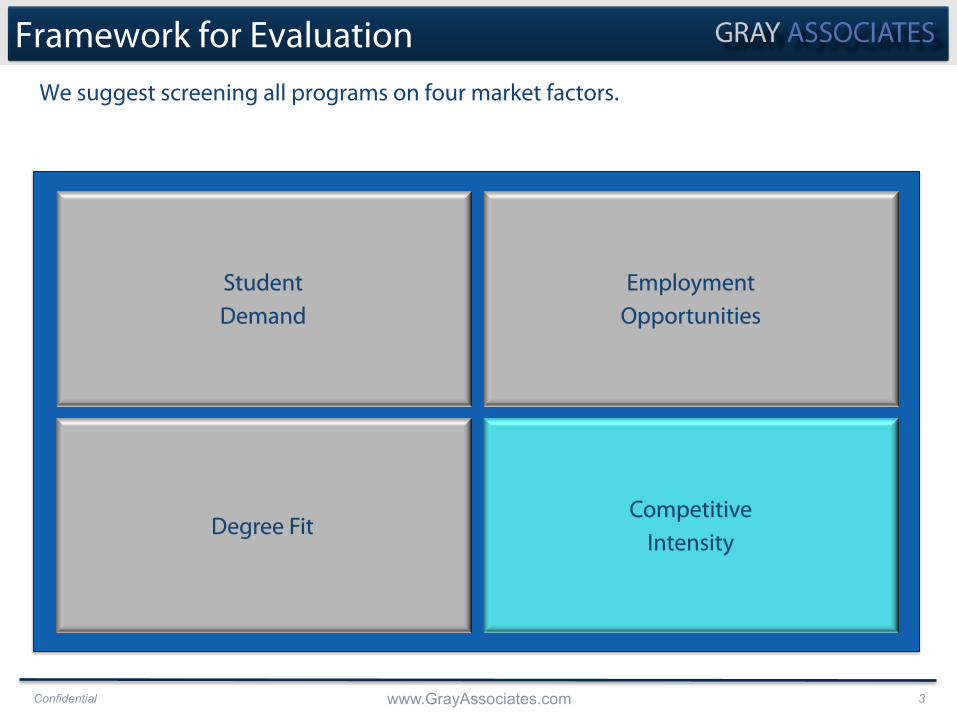
Framework for Evaluation We suggest screening all programs on four market factors.
Student Demand
Employment Opportunities
Degree Fit Competitive
Intensity

Confidential www.GrayAssociates.com 4
Why Worry About Competition?
Confidential www.GrayAssociates.com 5
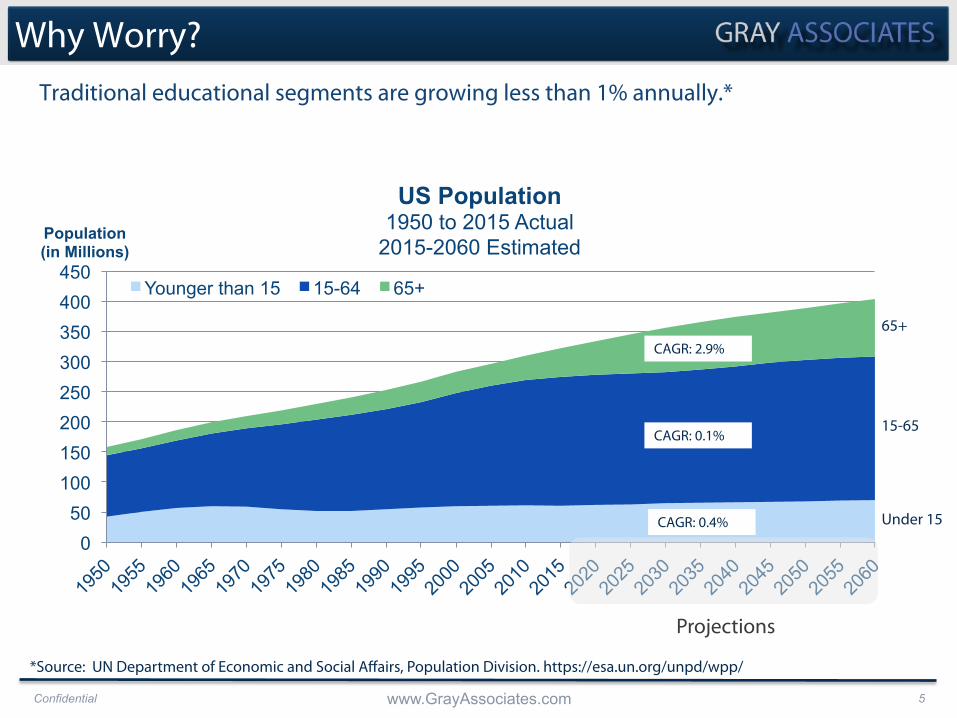
Why Worry? Traditional educational segments are growing less than 1% annually.*
0 50
100 150 200 250 300 350 400 450
Population (in Millions)
US Population 1950 to 2015 Actual
2015-2060 Estimated Younger than 15 15-64 65+
CAGR: 0.4%
CAGR: 0.1%
CAGR: 2.9%
Projections
*Source: UN Department of Economic and Social Affairs, Population Division. https://esa.un.org/unpd/wpp/
65+
15-65
Under 15

Confidential www.GrayAssociates.com 6
2.8 2.9 3.0 3.1 3.2
1.1 1.1 1.1 1.1 1.2
0.9 0.9 0.8 0.8 0.7
0
1
2
3
4
5
6
2011 2012 2013 2014 2015
Completions (Millions)
Completions by Sector (Millions)
Private for profit
Private not-for profit
Public +3%
4.8 5.0 5.0 5.0 5.1
+1%
-5%
Annual Growth
Rate
Total
Private For-Profit
Private Not For-Profit
Public
+1%
Why Worry? Overall, traditional higher education is not growing–or shrinking.
Source: Gray Associates, 2011-2015 IPEDS National completions for all CIPs, all award levels.

Confidential www.GrayAssociates.com 7
Winners: Competency-Based Education But, some institutions are taking share and growing.
3,987
5,895
8,313
10,822
13,186
48%
41%
30%
22%
0
2,000
4,000
6,000
8,000
10,000
12,000
14,000
2011 2012 2013 2014 2015
Western Governors University Completions
Source: Gray Associates, 2011-2015 IPEDS completions for all CIPs, all award levels.
Confidential www.GrayAssociates.com 8
What Markets Do You Serve?

Confidential www.GrayAssociates.com 9
Brand search volumes can highlight your served markets by state.
What Markets Do You Serve?
1637.88
116.26
40.38
26.82
23.08
18.04
12.78
11.34
9.47
7.05
6.59
6.05
4.99
4.36
0 200 400 600 800 1000 1200 1400 1600 1800
Indiana ���Illinois
���Kentucky ���Michigan Ohio
Florida Georgia
North Carolina ���Virginia
���Missouri
Google Search Volume by State Example: Ivy Tech Community College
Searches: 000s

Confidential www.GrayAssociates.com 10
What Markets Do You Serve?
§ Keywords Used – Black Hawk College – BHC Illinois – Black Hawk College Illinois – Black Hawk College IL – Black Hawk College Moline IL – Black Hawk College tuition
Google Search volumes by county highlight served markets.

Confidential www.GrayAssociates.com 11
What Markets Do You Serve?
§ Regional and national market definitions are often used for online programs.
Distance is a common way to define markets for on-campus programs.
29%
57%
74%
83% 92%
95% 97% 98% 98% 99% 99% 99%
0%
10%
20%
30%
40%
50%
60%
70%
80%
90%
100%
Miles from Student’s Home to Campus
Students: Distance to Campus
Market Definition: 35-Mile Radius
Percentage of Students
Confidential www.GrayAssociates.com 12
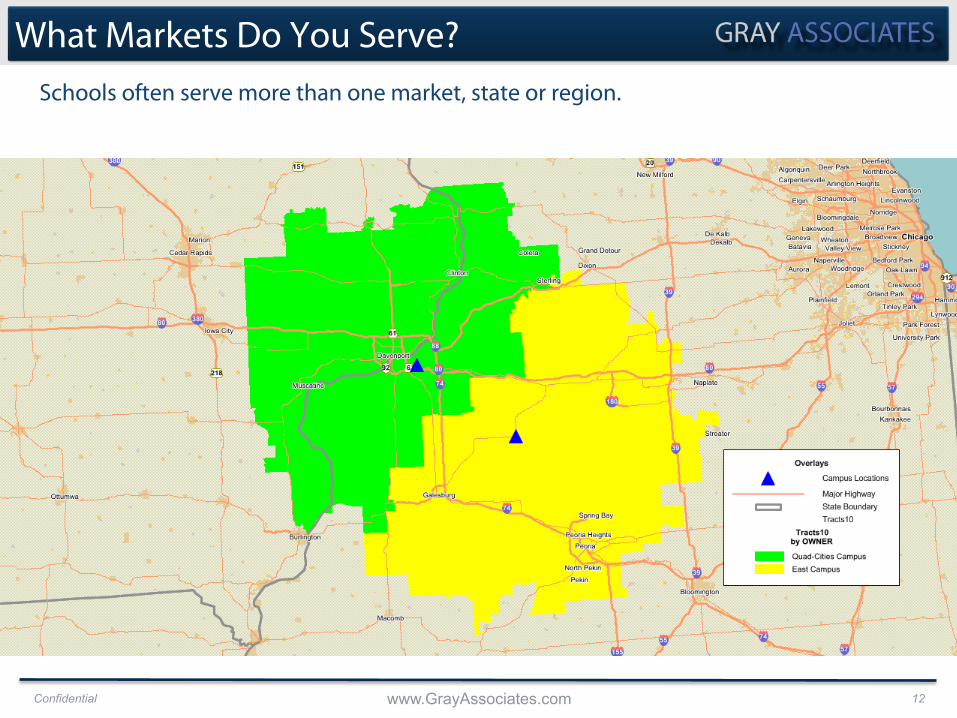
Schools often serve more than one market, state or region.
What Markets Do You Serve?

Confidential www.GrayAssociates.com 13
Competition
Confidential www.GrayAssociates.com 14
Competition: Foundational Data
Confidential www.GrayAssociates.com 15
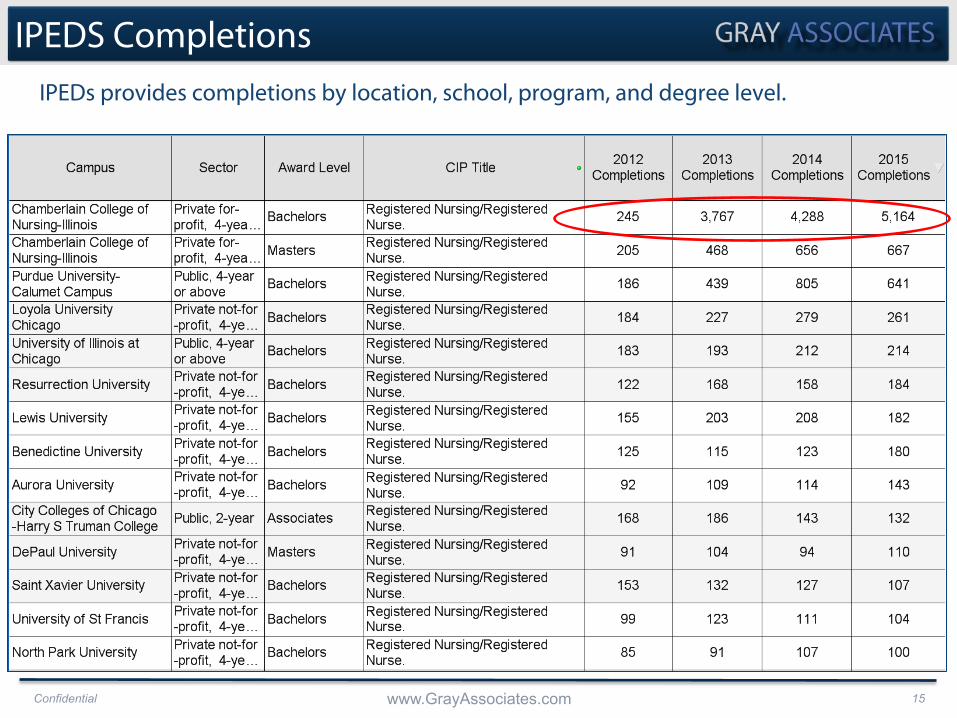
IPEDS Completions IPEDs provides completions by location, school, program, and degree level.

Confidential www.GrayAssociates.com 16
Completions reveal past market share, but anomalies are common.
IPEDS Completions
12%
53% 55% 61%
6%
6% 9%
7%
0%
10%
20%
30%
40%
50%
60%
70%
80%
90%
100%
2012 2013 2014 2015
Competitors by Share of Completions Registered Nursing in Chicago
University of Illinois at Chicago
Resurrection University
Loyola University Chicago
Purdue University-Calumet Campus
Chamberlain College of Nursing-Illinois
CIP Code 51.3801, Registered Nursing
Confidential www.GrayAssociates.com 17
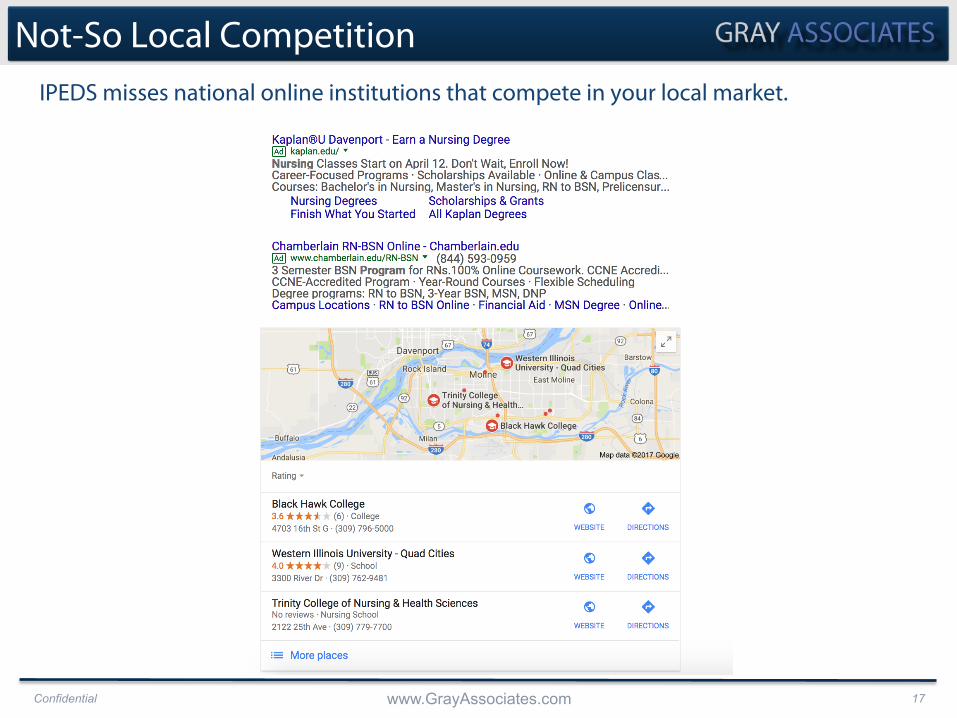
Not-So Local Competition IPEDS misses national online institutions that compete in your local market.

Confidential www.GrayAssociates.com 18
Non-Title IV Competition Some schools operate without Title IV funds–or submissions to IPEDS.

Confidential www.GrayAssociates.com 19
Number of Courses
MOOCs
§ The number of MOOC courses is growing exponentially. § Combined, Coursera, edX, and Udacity have over 30 million users. § This is roughly equivalent to the total enrollment in degree-granting institutions. § Their enrollment may be a bell-weather for popular courses.
The hype has died down, but MOOCs continue to grow, outside of IPEDS.
Source: Chart data is from Class-Central, https://www.class-central.com/report/moocs-2015-stats/
MOOC Trends Number of Courses Offered
4,000 4,000
3,000
2,000
1,000
0
Confidential www.GrayAssociates.com 20
Competitive Intensity
Confidential www.GrayAssociates.com 21
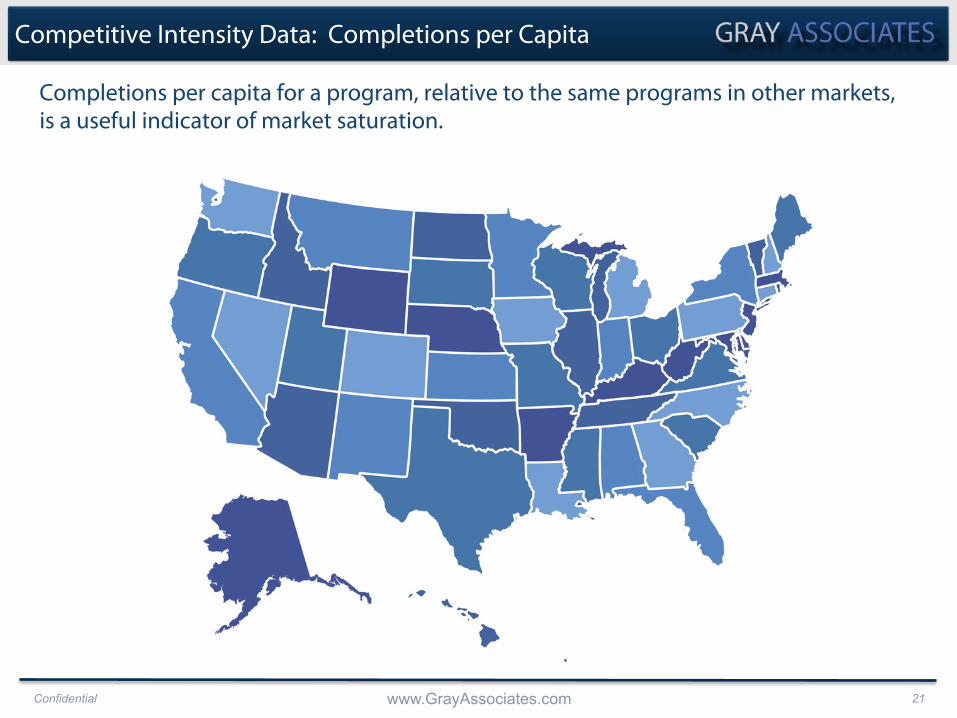
Competitive Intensity Data: Completions per Capita
Completions per capita for a program, relative to the same programs in other markets, is a useful indicator of market saturation.

Confidential www.GrayAssociates.com 22
Competitive Intensity Data: Cost per Inquiry
§ Inquiries for Management Science are very expensive: $114 each. § Finance inquiries are lower-priced: $47.94.
Higher cost per inquiry is an indicator of more intense competition.
Philadelphia Bachelor’s Degree Programs
Confidential www.GrayAssociates.com 23
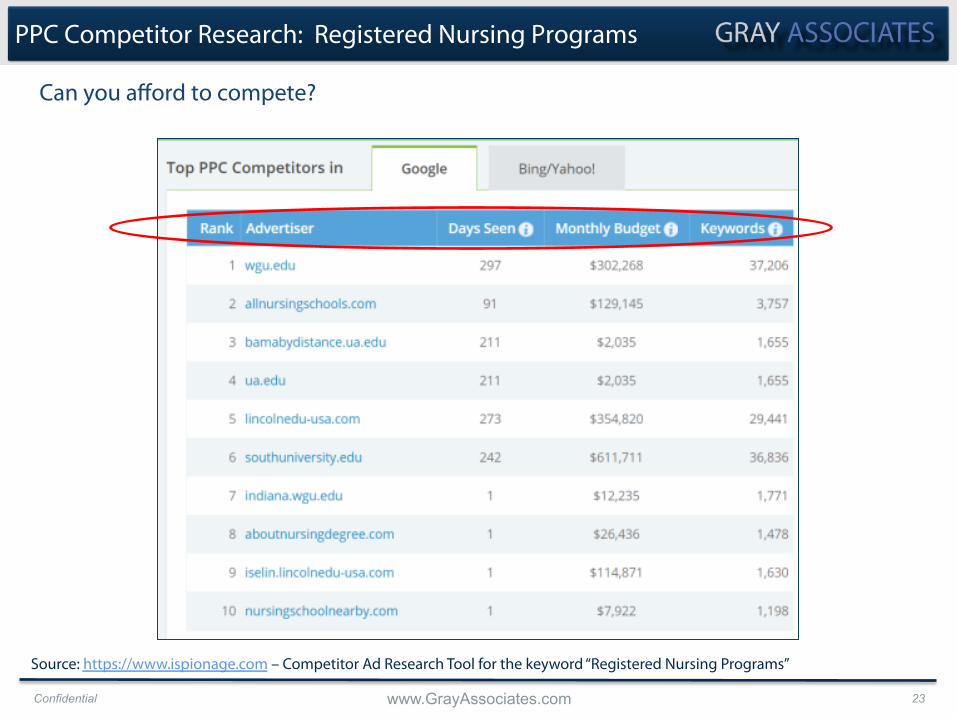
Can you afford to compete?
PPC Competitor Research: Registered Nursing Programs
Source: https://www.ispionage.com – Competitor Ad Research Tool for the keyword “Registered Nursing Programs”

Confidential www.GrayAssociates.com 24
Can you afford to compete?
PPC Competitor Research: Registered Nursing Programs
Source: https://www.ispionage.com – Competitor Ad Research Tool for the keyword “Registered Nursing Programs”

Confidential www.GrayAssociates.com 25
Student Demand Data: Student Inquiries
Share of student inquiries can create a current view of program size and trends.

Confidential www.GrayAssociates.com 26
Competition for Inquiries Share of Inquiries helps distinguish market growth and decline from program health.
0%
10%
20%
30%
40%
50%
60%
0
100,000
200,000
300,000
400,000
500,000
600,000
700,000
800,000
900,000
1,000,000
Jan Feb Mar Apr May Jun Jul Aug Sep Oct Nov Dec
Share of Inquiries All Programs and Award Levels
Market Inquiries College A Inquiries College A Share

Confidential www.GrayAssociates.com 27
Scoring for Competitive Intensity
§ Specifically, percentiles help you set thresholds for scoring.
Percentiles provide context for the numbers on programs and markets.

Confidential www.GrayAssociates.com 28
Scoring for Competitive Intensity
§ It compares a program in your market to the same program in 100 US markets.
Completions per capita is a useful metric for market saturation.

Confidential www.GrayAssociates.com 29
Program Size and Competition
§ Change in median program size is also an indicator of saturation.
Median Program Size helps define program potential.

Confidential www.GrayAssociates.com 30
Competitive Intensity Metrics: Interpretation
We currently track three measures on competition and competitive intensity.
National Competitive Metrics for Program X
Confidential www.GrayAssociates.com 31
Framework for Evaluation We suggest screening all programs on four market factors.
Student Demand
Employment Opportunities
Degree Fit Competitive
Intensity

Confidential www.GrayAssociates.com 32
The degree granted for each program should enable graduates to win jobs.
Degree Fit
25%
43%
22%
8%
2%
0% 20% 40% 60%
No College
Certificate
Associates
Bachelors
Graduate
Medical Assisting % of Completions
5%
10%
9%
53%
23%
0% 20% 40% 60%
No College
Certificate
Associates
Bachelors
Graduate
Accounting % of Workforce
Confidential www.GrayAssociates.com 33
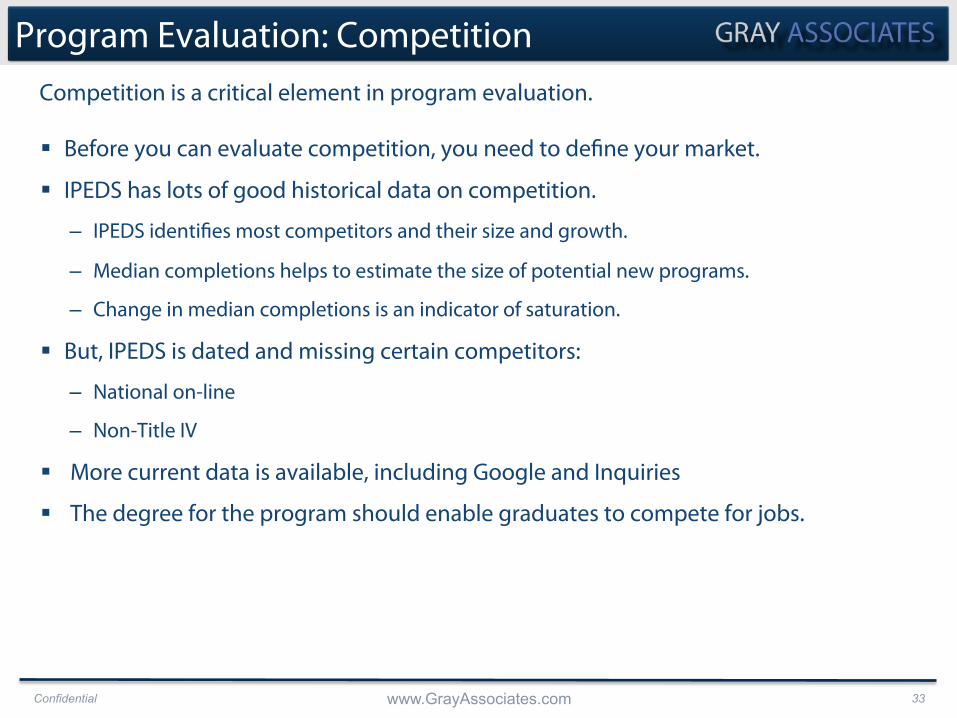
Program Evaluation: Competition
§ Before you can evaluate competition, you need to define your market.
§ IPEDS has lots of good historical data on competition.
– IPEDS identifies most competitors and their size and growth.
– Median completions helps to estimate the size of potential new programs.
– Change in median completions is an indicator of saturation.
§ But, IPEDS is dated and missing certain competitors:
– National on-line
– Non-Title IV
§ More current data is available, including Google and Inquiries
§ The degree for the program should enable graduates to compete for jobs.
Competition is a critical element in program evaluation.

Confidential www.GrayAssociates.com 34
Market Share Higher Education is not growing. To grow, you must take share.
Confidential www.GrayAssociates.com 35
Cooperative Process Good program decisions take more than numbers…
Running An Effective Program Planning Process 2:00 to 3:00 EDT
April 27, 2017
Please Join Us!
Confidential www.GrayAssociates.com 36
For More Information…
To contact Gray Associates:
Bob Atkins CEO
Gray Associates, Inc.
[email protected] 617-366-2836