
Competitive Intensity and Corruption Risks in the ... · Competitive Intensity and Corruption Risks...
55
Competitive Intensity and Corruption Risks in the Hungarian Public Procurement 2009-2015 Main Findings & Descriptive Statistics May 2016
Transcript of Competitive Intensity and Corruption Risks in the ... · Competitive Intensity and Corruption Risks...
Competitive Intensity and Corruption Risks in the Hungarian Public
Procurement 2009-2015
Main Findings & Descriptive Statistics
May 2016

2
The Corruption Research Center Budapest was created in November 2013 in response to the growing need for independent research on corruption and quality of government
in Hungary. Hence, the Center was established as a non-partisan research institute independent of governments, political parties or special interest groups. The aims of
the Center are to systematically explore the causes, characteristics, and consequences of low quality of government, corruption, and regulatory failure using an inter-disciplinary approach. The Center also aims to help citizens to hold governments
accountable through the use of empirical evidence.
Competitive Intensity and Corruption Risks in the Hungarian Public Procurement 2009-2015. Main Findings & Descriptive Statistics / Versenyerősség és korrupciós kockázatoka magyar közbeszerzéseknél 2009-2015.
Fontosabb eredmények és leíró statisztikák.
Supporting partners:
3gteam ltd: http://www.3gteam.hu/ Precognox ltd: http://precognox.hu/
Regionaldata project: http://www.regionaldata.org Staff:
Bank, Nóra research assistant Herczog, Elvira economist
Katona, Hajnalka research assistant Markson, Samuel physicist Molnár, Balázs sociologist
Ungár, Klára economist Purczeld, Eszer research assistant
Szalai, Bálint economist Tóth, István János economist & sociologist Vit, Eszter research assistant
Experts:
Gyenese, Jenő software engineer József, Magda lawyer
Kelemen, Zoltán lawyer
Nagy, Zoltán economist Székely, Attila procurement specialist
The report edited by Tóth, István János
Corruption Research Center Budapest e-mail: [email protected] internet: http://www.crcb.eu/
Date of publication: May 13 2016.

3
„When you can measure what you are speaking about, and express it in numbers, you know something about it; but when you cannot express it in
numbers, your knowledge is of a meagre and unsatisfactory kind...”
Lord Kelvin

4
Contents
Abstract ............................................................................................................ 5
Introduction ...................................................................................................... 6
1. Main Findings ................................................................................................ 8
2. Tables & Figures .......................................................................................... 12
2.1. Hungarian Public Procurement 2009-2015 – main statistics ......................... 12
2.2. The Index of Competitive Intensity (ICI) ................................................... 21
2.3. Transparency of Hungarian Public Procurement .......................................... 26
2.4. Procurement without Competition: the Single Bidder (SB) ........................... 31
2.5. Corruption Risk Indicator (CR2) ............................................................... 36
2.6. Price Distortion and Overpricing ............................................................... 41
Annex ............................................................................................................ 51
A1. Definition of variables used ...................................................................... 52
A2. Some specific problems and errors of the official data management of the Hungarian public procurement ........................................................................ 54

5
Abstract
This short report examines data from Hungarian public procurement between
2009-2015. The data from 127,776 contracts and 135,300 awardees were used for the analysis. The data were downloaded from the website of the Hungarian
Public Procurement Authority (http://www.kozbeszerzes.hu/). The Public Procurement Bulletin available online interface was used for data collection, and
after data clarification procedures, the data were structured into a database. The data of analysed public tenders are downloadable from the website managed by
CRCB (http://tendertracking.eu/).
The paper basically uses descriptive statistics and it reviews aspects of the
contracts awarded in Hungary between the years of 2009-2015. The analysis
primarily focuses on information regarding the competitive intensity, price distortion, and corruption risks. Based on these data we examine the trends of
the public procurement procedures in different groups (type of procedure, EU funding and non EU funding, the size of contract value, market type, industrial
differences). We also deal with the appearance of crony capitalism in Hungarian public procurement procedures. Price distortion was analysed using the
Benford’s Law.
The results show that between 2009-2015 the Hungarian public procurement
are characterised by a reduction in competition, and increase in the number of procurements without competition, reduced transparency, and rising tendency
toward price distortion and corruption risks.
The EU funded procurements have worse performance in case of corruption risks,
competitive intensity, and transparency, compared with Hungarian-funded ones. The former ones are characterised by weaker competition, lower transparency,
a higher level of price distortion, and higher corruption risks. The result points
out the effects of crony capitalism on weakening competition and increasing price distortion, especially in EU funded public procurement.
According to our results in Hungary, the EU funds – besides their positive influence on the development of the Hungarian economy – have a special and
perverse effect: they foster the practice of political favouritism and fuel crony capitalism.
Keywords: public procurement, corruption, competitive intensity, price distortion,
crony capitalism, Benford’s law, big data

6
Introduction
This brief report examines the competition intensity, the corruption risks and the
price distortion of public procurement contracts in Hungary using the available data between 2009 and 2015. The data pertaining to 127,776 contracts and
those of 135,300 awardees downloaded from the website of the Hungarian Public Procurement Authority and from the online version of the Public Procurement
Bulletin were used for the analysis 1 . These data were cleansed and then structured into a statistical database2. Most significant data are available on and
downloadable from our database, a continuously updated application started by CRCB on December 8th 2014 http://tendertracking.eu/ 3
The database 4 allows us to statistically analyse the Hungarian public procurement data, on the one hand, to learn when, how much, on what, and
how the Hungarian state institutions spent money. On the other hand, it also allows us to monitor and study the impacts of the changes in public procurement
regulations on those concerned in public procurement, the patterns of public money spending, the existence of competition, procurement prices, and the
nature of corruption frequently accompanying public procurement. Furthermore, a special focus is given to how these phenomena have changed during the years.
All these researches serve the interests of the European – among them the
Hungarian – citizens.
The report surveys public procurements for the period of 2009 – 2015 by using descriptive statistics, and by certain points of emphasis demonstrated in 43
figures and 6 tables. Primarily, we focus on information pertaining to competition
intensity and corruption risks, and we provide correlations based on our database.
The study of corruption risks is the study of the conditions of corruption.
1 See http://www.kozbeszerzes.hu/ 2 In order to accomplish this study seven years were needed, exactly the same time
span that our analysis of the results of public procurement encompasses. Seven years with
numerous enthusiastic colleagues, volunteers, IT experts, system administrators, lawyers,
procurement experts, sociologists, economists, mathematicians, journalists, and about fifty
university students and professionals to record and to cleanse the data, research assistants
whose contribution to this analysis was indispensable. We would like to express our thanks for
their enthusiasm, accuracy and tireless efforts. 3 The ’Microdata’, a group of researchers at CEU, has also elaborated on and published
data on Hungarian public procurement. Their cleansed data for the period of 1997-2013 are
available at http://kozbeszerzes.ceu.hu/about.xhtml. 4 The database (MaKAB) used in the analysis was sponsored by funds from the European
Union (ANTICORRP project, grant agreement no: 290529), by individuals volunteer work, by
donations from Hungarian companies and, by the CRCB’s financial resources.

7
If somebody wants to cheat (to be corrupt), then he/she sets up conditions to
generate cheating. Corruption risk means that these conditions for cheating exist in the examined public procurement. But it is also true that conditions favourable
for corruption and the existence of these do not necessarily indicate corruption. It is possible that these conditions are either ‘accidentally’ present, or that these
conditions appear without any intention for corruption. It may also happen that after creating these conditions the corrupt actor does not make use of them, and
in the end backs out of corruption. This latter form is an atypical result that contradicts the original corrupt plans of the actor, and could be extremely rare.
The most significant hurdle in achieving our planned goals is the quality of the
data provided by the Hungarian government. The Hungarian public procurement data, and the setup procedures of the public procurement database administered
by the Hungarian government, reveal fundamental errors, and above all, they have some minor or major deficiencies, some of which cannot be remedied5.
While sorting and cleansing the data, it became evident that a significant part of
the data of about 180,000 contracts of the Hungarian public procurement from 1997 can no longer be found or fixed. While sorting and cleansing the data, it
became evident that a significant part of the data pertaining to 180,000 contracts of the Hungarian public procurement from 1997 is missing or
incompatible. Consequentially, that part of the original database was unusable6. The database we use for our statistical analysis is the result of our data cleaning
and data reconstruction activity. We have a database with fewer errors and inconsistencies than the database of the Public Procurement Authority with its
partially organised data.
This report is meant to be the first step of an analysis of relationships amongst competition intensity, corruption risks, and price distortion over time.
In the following, the most significant results will be given, and then figures related to the findings will be presented.
5 We have already drawn attention to these issues, and we have also analysed the roots
of these errors in several reports. See in Hungarian 1, 2, 3, 4, 5, 6, and via volunteer work we
have also made proposals how to fix and improve the setup procedures that create the public
procurement database 7. 6 The more problems we faced during data cleansing (a part of which we managed to
solve), the more problems this phenomenon generated at the next step of our study. We did
not succeed in finding any solution to these problems because of the lack of data or because of
data inconsistency. (See the Annex 2.)

8
1. Main Findings
1. The analysis of 127,776 Hungarian public procurement contracts demonstrate
that between 2009 and 2014 the competition intensity of public procurement significantly decreased (F2.2.1., F2.2.2.). This tendency seems to stagnate in
2015.
2. The level of transparency of the Hungarian public procurement deteriorated
during the years examined (F2.3.1., F2.3.2.). As a result of the modification of the public procurement law in 2010, from 2011 onward there were fewer
announcements before public procurements than earlier.
3. The rate of successful public procurements without competition (with one
bidder only) was above 30% between 2009-2010; later that rate declined (26-
27%), and in 2014-2015 it started to increase again (31-32%) (F2.4.1., F2.4.2.).
4. The lack of competition was highly represented in public procurements
targeting IT services and products among product markets between 2009-2010. 64-68% of these won without any competition with just one bidder in the tender.
Among the product markets the level of transparency was the lowest in IT tenders during these two years (F2.4.3.).
5. The corruption risk index defined by the level of transparency and single bidders indicate that the Hungarian public procurement for the period of 2009-
2014 was wholly characterized by raising tendency of corruption risk. This tendency stopped in 2015, when some improvement can be observed (F2.5.1.
F2.5.2.).
6. We analysed the price distortion in the Hungarian public procurement by the
distribution of the first digit in the contract prices based on Benford’s law.
According to Benford's law (also known as the First-Digit Phenomenon) in a non-
artificially generated set of numbers (in any numeral system) the first digits in
each, local values are distributed neither arbitrarily nor uniformly ; the distribution instead follows the distribution set by Benford’s law7. The distribution
of first digits in the decimal system (1,..,9) according to Benford’s law is in Table 1.1.
7 A set of numbers is said to satisfy Benford's law if the leading digit d (in 10 digit
system, d ∈ {1, ..., 9}) occurs with probability: P (d) = log10 (d +1) - log10 (d) = log10 (1 +
1/d). See https://en.wikipedia.org/wiki/Benford%27s_law

9
Table 1.1. The distribution of first digit according to the Benford’s law in the
decimal system
First digit %
1 30.1
2 17.6
3 12.5
4 9.7
5 7.9
6 6.7
7 5.8
8 5.1
9 4.6
The economist Hal Varian first suggested in 1972 that Benford’s law could be
used to detect possible fraud in socio-economic data, and that it the performance of forecasting models could be evaluated8. Mark Nigrini pointed out 25 years
later that Benford's Law is useful in forensic accounting and auditing as a tool to detect fraud and collusion9. Ever since, Benford’s Law has been common and it
is a widely used method in several areas of social research for fraud detection10.
For the analysis of irregularities in public procurement, we can use the
information on procurement prices because these are public (a); and as such these may carry information on the process of price formation (b). Our research
questions related to the price formation are the followings: whether the price
formation differs significantly amongst different group of public procurement created by competitive intensity (i), the level of transparency ( ii ); the risks of
corruption ( iii ), and the existence of political relations of the bidders ( iv ).
We examine these relationships with comparison of observed first digit’s
distribution to theoretical (Benford’s) distribution of contact prices of tenders in
8 See Varian, H. R (1972): Benford’s law, The American Statistician, 26. Vol. no.3. pp.
65–66. 9 See Nigrini, M. J. (1996): A taxpayer compliance application of Benford’s law, Journal of
the American Taxation Association, Vol. 18. no 1. pp. 72–91; Drake, P. D. – Nigrini, M. J.
(2000): Computer assisted analytical procedures using Benford’s law, Journal of Accounting
Education, Vol. 18. no. 2. pp. 127-146; see also Durtschi, C. - Hillison, W.- Pacini, C. (2004):
The Effective Use of Benford's Law to Assist in. Detecting Fraud in Accounting Data, Journal of
Forensic Accounting, Vol V. pp. 17-34, http://bit.ly/1QSUOER 10 See Nigrini, M. J. (ed.) (2012): Benford's Law. Applications for Forensic Accounting,
Auditing, and Fraud Detection, John Wiley & Sons, Hobonken, New Jersey, USA and S. J. Miller
(ed.) (2015): Benford’s Law: Theory and Applications, Princeton University Press, Princeton &
Oxford, New Jersey, USA.

10
several analysed groups of the Hungarian public procurement.
7. The analysis of first digits indicates that the contract prices of all Hungarian
public procurement fits into the theoretical distribution for the whole period (2009-15) (F2.6.1 and T2.6.1).
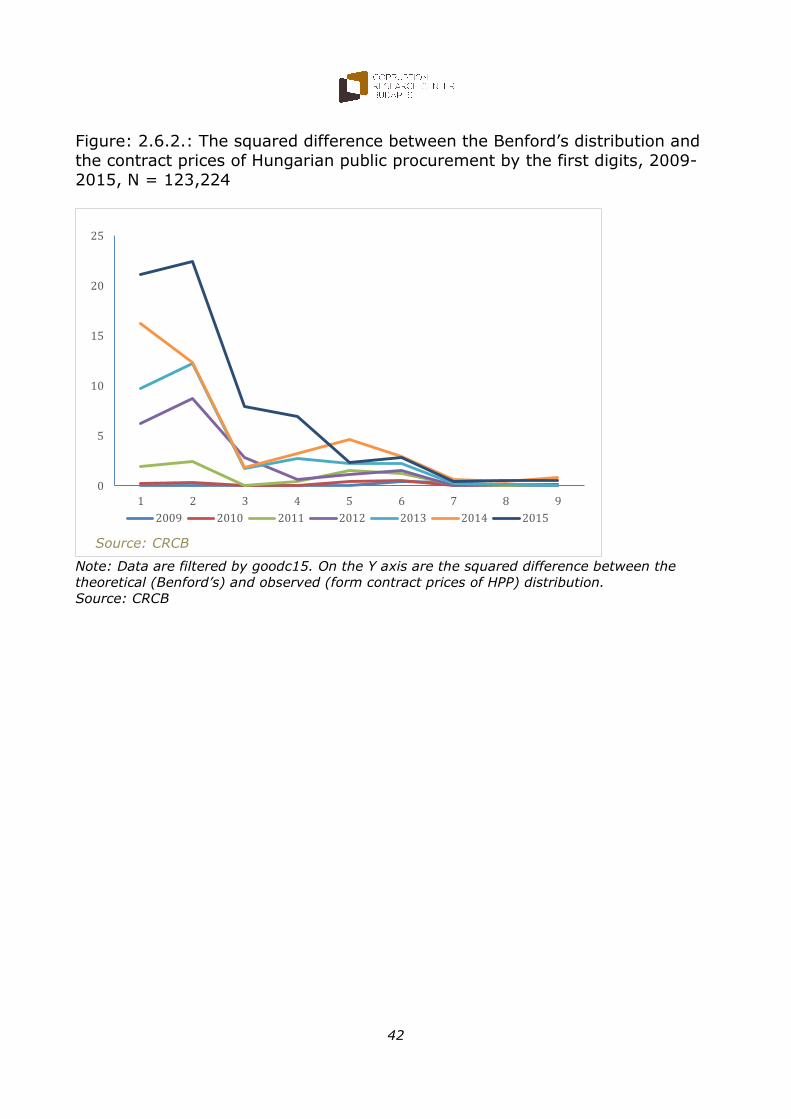
8. There are crucial differences in price distortion among the contract prices in each year. Price distortion was increasing throughout the whole period; while in
2009 and 2010 contract prices fitted well into the theoretical distribution, after those years the ratio of price distortion got more and more significant (F2.6.2.,
F2.6.3.). Our assumption is that this phenomenon indicates the frequency and the growing tendency of overpricing, which also signifies the weakening of
competition and the increasing corruption risks.
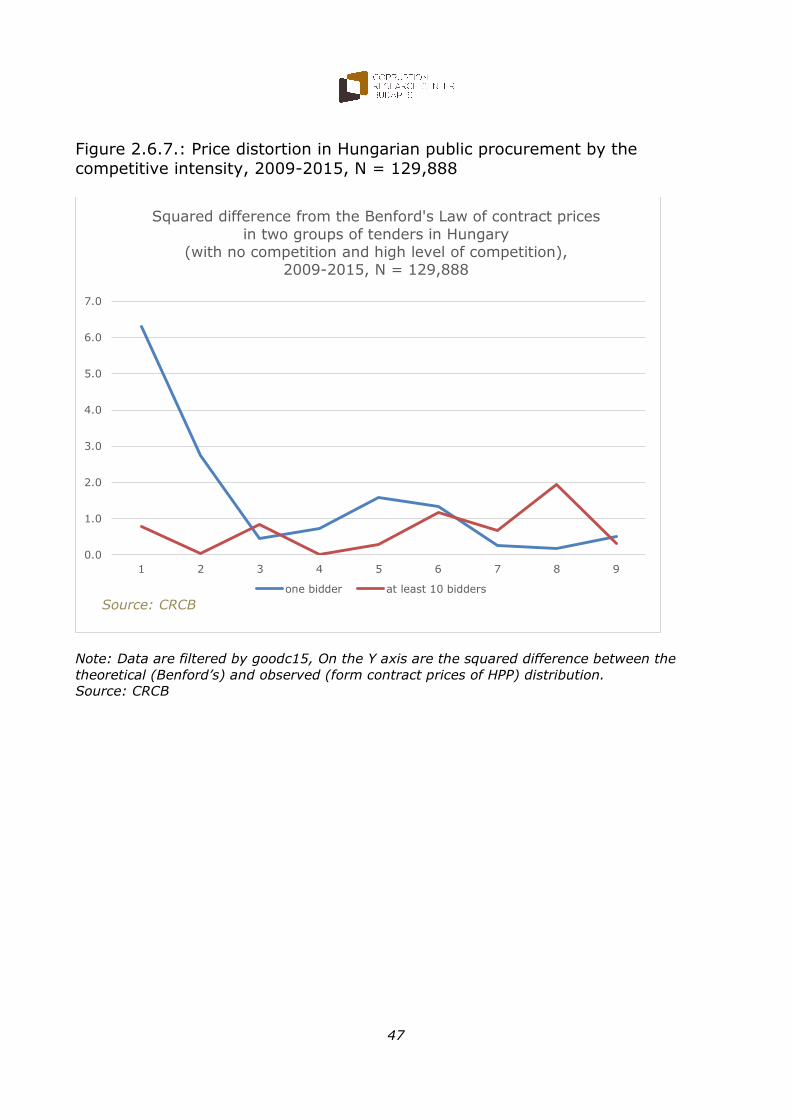
9. Our results points out that the strength of price distortion decreases as
competition intensity becomes more significant (F2.6.7.). The prices of public procurement are remarkably distorted when there is no competition and the
level of transparency is low compared to those successful tenders with competition and transparency (F2.6.6., F2.6.8.). Our results indicate that the
strength of price distortion increases significantly with the increase of corruption
risk (F2.6.9.).
10. The transparency of public procurement projects funded by the EU
deteriorated even more during the period, and after 2011 the level of transparency was much lower than the level of transparency in public
procurement financed domestically (F2.3.5).
11. In 2009-2011 the rate of public procurements without competition was
higher among EU projects, in 2012-2013 this rate got lower and in 2014-2015 the rate did not significantly differ from the rate of domestic projects. For the
whole period there was no competition in 31% of the public procurements funded by the EU (F2.4.5.).
12. Except for 2009 the level of corruption risk was continuously higher in public procurements funded by the EU than those financed domestically (F2.5.5.).
13. Between the years 2009 and 2014 the pace of corruption risks accelerated in EU funded projects compared to domestically financed ones (F2.5.5.).
14. We assume that in 2015 the decrease in corruption risks could be attributed
to the tendency change in purely EU funded projects.
15. Throughout the period, the price distortion of projects funded by the EU was
stronger than that of the non-EU projects (F2.6.5.).
16. While the prices of projects financed domestically loosely fit into the
theoretically expected distribution, those financed by the EU do not fit at all. Therefore, the phenomenon of overpricing could be much more frequent or it
could have a much wider scale in EU funded public procurements than in case of other public procurements (T2.6.1.).
17. All of the findings suggest that in Hungary between 2009-2015 public

11
procurements financed with EU funds compared to non-EU financed ones were
delivered at a higher corruption level (F2.5.5.).
18. It can be observed how the way the EU funds were spent in Hungary had anegative impact on the Hungarian economy in three fields in the period of 2009-
2015. Public procurements financed by the EU
(i) increased the corruption risks of public procurement;
(ii) they decreased competition intensity;
(iii) they enhanced the rate of overpricing within the Hungarian public
procurement.
22. Therefore, based on our results of the analysis of public procurement tenders
in the period 2009-2019 we should reject our initial hypothesis about the lack of political favouritism in the Hungarian public procurement.
23. We detected some negative characteristics of public procurement financed by the EU (high probability of lack of competition, less competitive intensity, less
transparency and consequently higher corruption risks, and finally greater level of price distortion); we also discovered that the crony companies liked to get
involved in and win public procurement financed by the EU; and the public
procurement won by companies with political connections can be described with similar characteristics, such as the EU financed ones.
These results indicate a very special scenario: the practice of spending of the EU funds by public procurement in Hungary has probably a positive effect, i.e. it
helps the convergence of the Hungarian economy with the EU countries, but - as a perverse effect – it results in the emergence and reinforcement of the
economic model of crony capitalism as well.

12
2. Tables & Figures
2.1. Hungarian Public Procurement 2009-2015 – main statistics
Figure 2.1.1.: Number of public procurement announcements in Hungary
2009-2015, N = 127,776
Note: data are filtered by goodc15
Source: CRCB

13
Figure 2.1.2.: Number of public procurement announcements in Hungary
financed by the EU, 2009-2015, N = 49,946
Note: data are filtered by goodc15
Source: CRCB

14
Figure 2.1.3.: Share of EU financed public procurement tenders in total
Hungarian public procurement tenders, %, 2009-2015, N = 125,555
Note: data are filtered by goodc15
Source: CRCB

15
Figure 2.1.4.: Net contract value of Hungarian public procurement by year, in
billion EUR, 2009-2015, N = 123,224
Note: data are filtered by goodc15; we excluded the contracts with unit prices and framework
agreements
Source: CRCB

16
Figure 2.1.5.: Net contact value of Hungarian public procurement financed by EU, in billion EUR, 2009-2015, N = 49,946
Note: data are filtered by goodc15; we excluded the contracts with unit prices and framework
agreements
Source: CRCB

17
Figure: 2.1.6.: Share of net contract value of PP financed by the EU in total contract value, %, monthly data, 2009-2015, N=123,224
Note: data are filtered by goodc15; we excluded the contracts with unit prices and framework
agreements
Source: CRCB
0
10
20
30
40
50
60
70
80
90
100
20
09
J M M Jl Sz N2
01
0 J M M Jl Sz N
20
11
J M M Jl Sz N2
01
2 J M M Jl Sz N
20
13
J M M Jl Sz N2
01
4 J M M Jl Sz N
20
15
J M M Jl Sz N

18
Figure 2.1.7.: Share of net contract value of public procurement financed by the EU in total contract value by year, %, 2009-2015, N=123,224
Note: data are filtered by goodc15; we excluded the contracts with unit prices and framework
agreements
Source: CRCB
0
10
20
30
40
50
60
70
2009 2010 2011 2012 2013 2013 2015
19
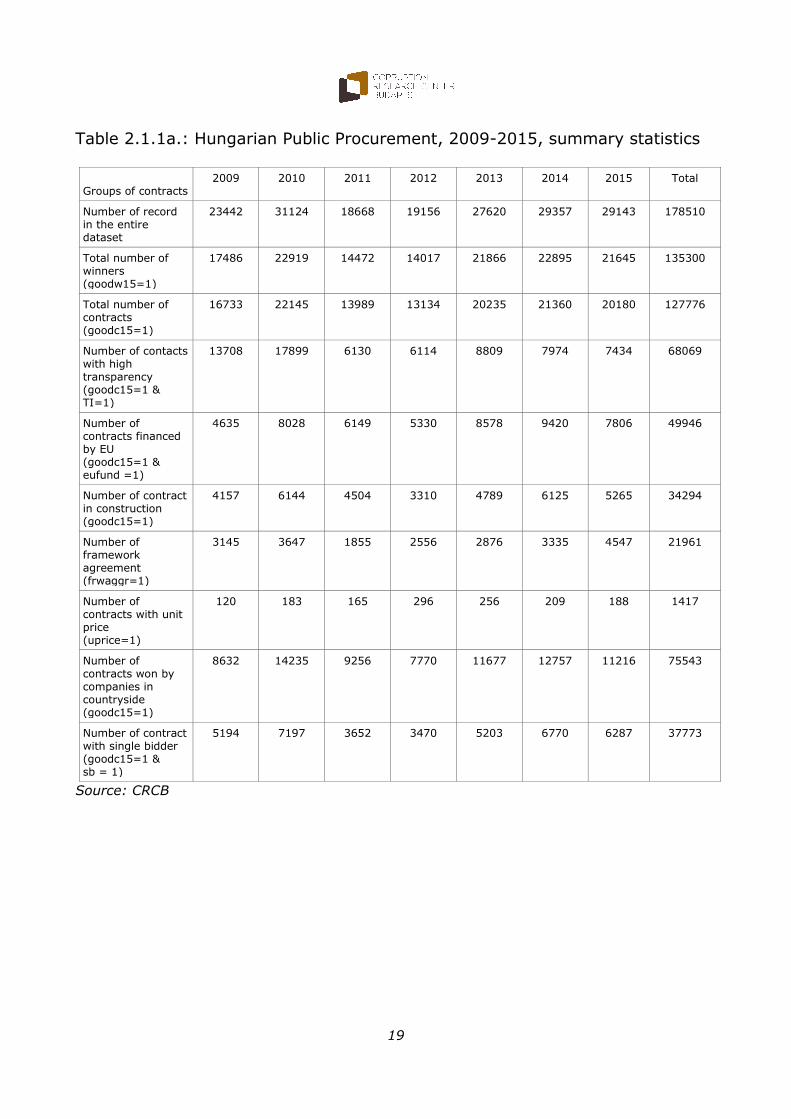
Table 2.1.1a.: Hungarian Public Procurement, 2009-2015, summary statistics Groups of contracts
2009 2010 2011 2012 2013 2014 2015 Total
Number of record in the entire dataset
23442 31124 18668 19156 27620 29357 29143 178510
Total number of winners (goodw15=1)
17486 22919 14472 14017 21866 22895 21645 135300
Total number of contracts (goodc15=1)
16733 22145 13989 13134 20235 21360 20180 127776
Number of contacts with high transparency (goodc15=1 & TI=1)
13708 17899 6130 6114 8809 7974 7434 68069
Number of contracts financed by EU (goodc15=1 & eufund =1)
4635 8028 6149 5330 8578 9420 7806 49946
Number of contract in construction (goodc15=1)
4157 6144 4504 3310 4789 6125 5265 34294
Number of framework agreement (frwaggr=1)
3145 3647 1855 2556 2876 3335 4547 21961
Number of contracts with unit price (uprice=1)
120 183 165 296 256 209 188 1417
Number of contracts won by companies in countryside (goodc15=1)
8632 14235 9256 7770 11677 12757 11216 75543
Number of contract with single bidder (goodc15=1 & sb = 1)
5194 7197 3652 3470 5203 6770 6287 37773
Source: CRCB
20
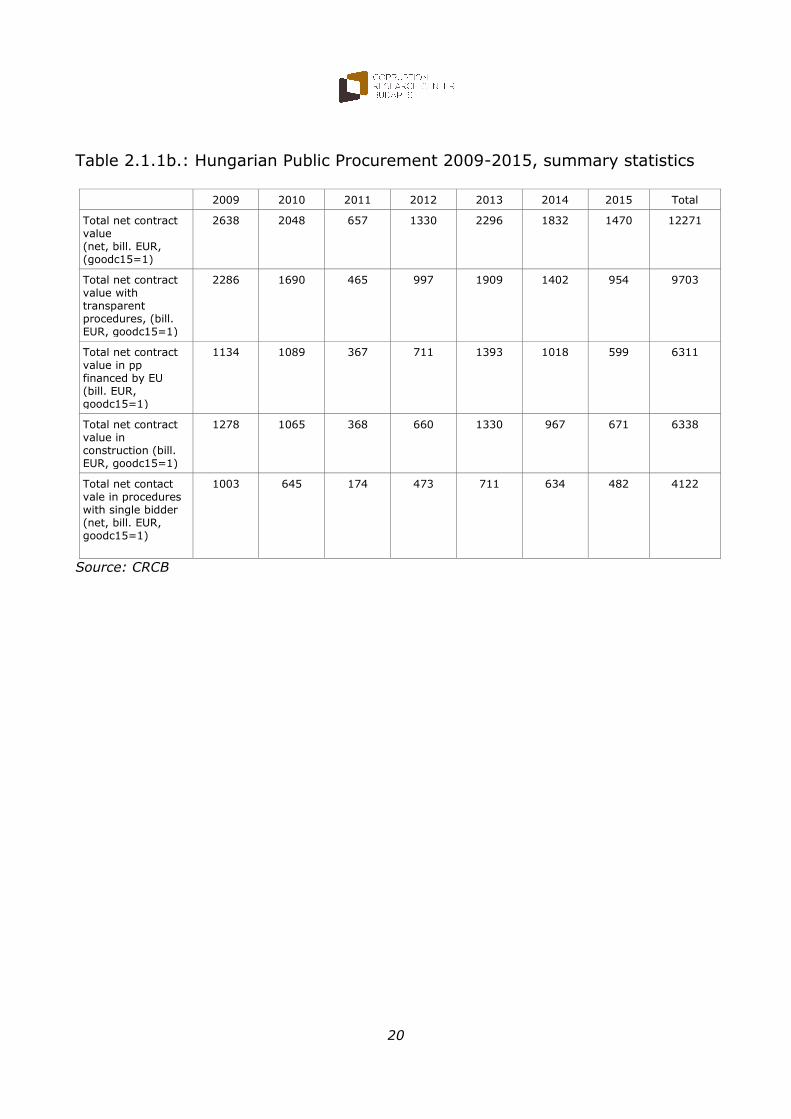
Table 2.1.1b.: Hungarian Public Procurement 2009-2015, summary statistics 2009 2010 2011 2012 2013 2014 2015 Total
Total net contract value (net, bill. EUR, (goodc15=1)
2638 2048 657 1330 2296 1832 1470 12271
Total net contract value with transparent procedures, (bill. EUR, goodc15=1)
2286 1690 465 997 1909 1402 954 9703
Total net contract value in pp financed by EU (bill. EUR, goodc15=1)
1134 1089 367 711 1393 1018 599 6311
Total net contract value in construction (bill. EUR, goodc15=1)
1278 1065 368 660 1330 967 671 6338
Total net contact vale in procedures with single bidder (net, bill. EUR, goodc15=1)
1003 645 174 473 711 634 482 4122
Source: CRCB

21
2.2. The Index of Competitive Intensity (ICI)
Figure 2.2.1.: The Index of Competitive Intensity in Hungarian public procurement, monthly data, 2009-2015, N = 88,254
Note: data are filtered by goodc15;
Source: CRCB

22
Figure 2.2.2.: The Index of Competitive Intensity (ICI) in the Hungarian public
procurement, 2009-2015, yearly data, N = 88,254
a: Y axis’ (ICI) minimum: 0.0 b: Y axis’ (ICI) minimum: 0.46
Note: data are filtered by goodc15;
Source: CRCB

23
Figure 2.2.3. The Index of Competitive Intensity (ICI) in Hungarian public
procurement by industry, 2009-2015, yearly data, N = 87,980
Note: data are filtered by goodc15;
Source: CRCB

24
Figure 2.2.4.: The Index of Competitive Intensity (ICI) in Hungarian public
procurement by quintiles of contract value, 2009-2015, yearly data, N = 81,951
Note: data are filtered by goodc15;
Source: CRCB

25
Figure 2.2.5.: The Index of Competitive Intensity (ICI) in Hungarian public
procurement in EU funded and non-EU funded tenders, 2009-2015, yearly data, N = 86,722
Note: the data are filtered by goodc15;
Source: CRCB

26
2.3. Transparency of Hungarian Public Procurement
Figure 2.3.1.: The Transparency Index (TI) of Hungarian public procurement, 2009-2015, monthly data, N = 121,849
Note: data are filtered by goodc15;
Source: CRCB

27
Figure 2.3.2.: The Transparency Index (TI) of Hungarian public procurement,
2009-2015, yearly data, N = 121,849
Note: data are filtered by goodc15;
Source: CRCB

28
Figure 2.3.3.: The Transparency Index (TI) by industry 2009-2015, yearly data,
N = 121,536
Note: data are filtered by goodc15;
Source: CRCB

29
Figure 2.3.4.: The Transparency Index (TI) in Hungarian public procurement by
quintiles of contract value, 2009-2015, yearly data, N = 111,761
Note: data are filtered by goodc15;
Source: CRCB

30
Figure 2.3.5.: The Transparency Index (TI) in Hungarian public procurement in
EU funded and non-Eu funded tenders, 2009-2015, yearly data, N = 120,432
Note: data are filtered by goodc15;
Source: CRCB

31
2.4. Procurement without Competition: the Single Bidder (SB)
Figure 2.4.1.: Share of public procurement tenders with Single Bidder (SB) in total number of tenders, 2009-2015, monthly data, N = 127,776
Note data are filtered by goodc15;
Source: CRCB

32
Figure 2.4.2.: Share of public procurement tenders with Single Bidder (SB) in
total number of tenders, 2009-2015, yearly data, N = 127,776
Note: data are filtered by goodc15;
Source: CRCB

33
Figure 2.4.3.: Share of public procurement tenders with Single Bidder (SB) in
total number of tenders by Industry, 2009-2015, yearly data, N = 133,069
Note: data are filtered by goodc15;
Source: CRCB

34
Figure 2.4.4.: Share of public procurement tenders with Single Bidder (SB) in
total number of tenders by quintiles of contract value, 2009-2015, yearly data, N = 129,888
Note: data are filtered by goodc15;
Source: CRCB

35
Figure 2.4.5.: Share of public procurement tenders with Single Bidder (SB) in Eu funded and non-EU funded tenders, 2009-2015, yearly data, N = 131,208
Note: data are filtered by goodc15;
Source: CRCB

36
2.5. Corruption Risk Indicator (CR2)
Figure 2.5.1.: The Corruption Risk Indicator (CR2) in Hungarian public procurement (CR2), 2009-2015, monthly data, N = 120,221
Note: data are filtered by goodc15;
Source: CRCB

37
Figure 2.5.2.: The Corruption Risk Indicator (CR2) in Hungarian public
procurement (CR2), 2009-2015, yearly data, N = 120,221
Note: data are filtered by goodc15;
Source: CRCB

38
Figure 2.5.3.: The Corruption Risk Indicator (CR2) in Hungarian public
procurement (CR2) by Industry, 2009-2015, yearly data, N = 119,916
Note: data are filtered by goodc15;
Source: CRCB

39
Figure 2.5.4.: The Corruption Risk Indicator (CR2) in Hungarian public
procurement (CR2) by quintiles of contract value, 2009-2015, yearly data, N = 111,180
Note: data are filtered by goodc15;
Source: CRCB

40
Figure 2.5.5.: The Corruption Risk Indicator (CR2) in Hungarian public
procurement (CR2) in EU funded and non-EU funded tenders, 2009-2015, yearly data, N = 118,843
Note: data are filtered by goodc15;
Source: CRCB

41
2.6. Price Distortion and Overpricing
Figure 2.6.1.: The distribution of first digits by the Benford’s Law and by the
contract prices of Hungarian public procurement, 2009-2015, N = 123,224
Note: Data are filtered by goodc15
Source: CRCB
1 2 3 4 5 6 7 8 9
Benford's Law 30.1 17.6 12.5 9.7 7.9 6.7 5.8 5.1 4.6
Prices of Hungarian PP 32.6 20.2 11.3 8.5 6.7 5.6 5.4 4.6 5.0
0
5
10
15
20
25
30
35
The distribution of 1st digits by the Benford's Law and by the contract prices of Hungarian public procurement, 2009-2015,
N = 123,224
42
Figure: 2.6.2.: The squared difference between the Benford’s distribution and
the contract prices of Hungarian public procurement by the first digits, 2009-2015, N = 123,224
Note: Data are filtered by goodc15. On the Y axis are the squared difference between the
theoretical (Benford’s) and observed (form contract prices of HPP) distribution.
Source: CRCB
0
5
10
15
20
25
1 2 3 4 5 6 7 8 9
2009 2010 2011 2012 2013 2014 2015
Source: CRCB

43
Figure 2.6.3.: The mean squared error (MSE) of contract prices of HPP from
the theoretical (Benford’s) distribution by year, first digits, 2009-2015, N = 123,224
Note: Data are filtered by goodc15
MSE = 1
𝑛∑ (�̂�𝑖 − 𝑌)2𝑛𝑖=1 where �̂� is the predicted value and Y is the observed value in percentages.
On the Y axis are the MSE values by year.
Source: CRCB
0.00
1.00
2.00
3.00
4.00
5.00
6.00
7.00
8.00
2009 2010 2011 2012 2013 2014 2015
Source: CRCB

44
Figure 2.6.4.: The squared difference between the Benford’s distribution and
the contract prices of Hungarian public procurement by digits and by Industry, 2009-2015, N = 123,224
Note: Data are filtered by goodc15. On the Y axis are the squared difference between the
theoretical (Benford’s) and observed (form contract prices of HPP) distribution.
Source: CRCB
0
10
20
30
40
50
60
70
80
90
1 2 3 4 5 6 7 8 9Industrial goods Construction works and services
IT works and services Real estate and business services
Engineering, R&D and financial services Other services
Source: CRCB

45
Figure 2.6.5.: Price distortion of contract prices of Hungarian public
procurement by EU funded and non-EU funded tenders, 2009-2015, N = 128,422
Note: Data are filtered by goodc15=1, The Cramer’s V values are on the Y axis.
Source: CRCB
0
0.02
0.04
0.06
0.08
0.1
0.12
0.14
0.16
EUFUND=0 EUFUND=1
Price distortion of contract prices of HPP by EU fundend and non-EU funded tenders,
2009-2015, N =128,422
Source: CRCB

46
Figure 2.6.6.: Price distortion of contract prices of Hungarian public
procurement by procurement methods, 2009-2015, N = 124,693
Note: Data are filtered by goodc15=1, The Cramer’s V values are on the Y axis.
Source: CRCB
0
0.05
0.1
0.15
0.2
0.25
0.3
0.35
open procedures negotiations withannouncement
negotiations withoutannouncement
restricted tendering +others
Price distortion of contract prices of HPP by procurement methods, 2009-2015, N = 124,693
Source: CRCB
47
Figure 2.6.7.: Price distortion in Hungarian public procurement by the
competitive intensity, 2009-2015, N = 129,888
Note: Data are filtered by goodc15, On the Y axis are the squared difference between the
theoretical (Benford’s) and observed (form contract prices of HPP) distribution.
Source: CRCB
0.0
1.0
2.0
3.0
4.0
5.0
6.0
7.0
1 2 3 4 5 6 7 8 9
Squared difference from the Benford's Law of contract prices
in two groups of tenders in Hungary (with no competition and high level of competition),
2009-2015, N = 129,888
one bidder at least 10 bidders
Source: CRCB

48
Figure 2.6.8.: Price distortion in Hungarian public procurement by level of the
transparency, 2009-2015, N = 124,693
Note: Data are filtered by goodc15=1, The Cramer’s V values are on the Y axis.
Source: CRCB
0
0.05
0.1
0.15
0.2
0.25
tenders with announcement tenders without announcement
Source: CRCB

49
Figure 2.6.9.: Price distortion in the Hungarian public procurement by level of
the Corruption Risk Indicator (CR2), 2009-2015, N = 124,062
Note: The Cramer's V value are on the Y axis.
Source: CRCB
0
0.05
0.1
0.15
0.2
0.25
CR2=0 CR2=0.5 CR2=1
Price distortion in the Hungarian public procudement by level of
the Corruption Risk Indicator (CR2) using the Benford's Law, 2009-2015, N = 124,062
Source: CRCB

50
Table 2.6.1.: Price distortion of contract price in Hungarian public procurement by several tender subgroups 2009-2015
tender subgroups chi2 Cramer's V MAD N
Industrial goods [SECTOR6=1] 559,7231 0,1085 0,0107 47582
Construction works and services [SECTOR6=2] 426,0375 0,1082 0,0098 36406
IT works and services [SECTOR6=3] 438,2328 0,3051 0,0308 4708
Real estate and business services[SECTOR6=4] 603,6278 0,2341 0,0239 11014
Engineering, R&D and financial services [SECTOR6=5] 213,4399 0,1297 0,0125 12696
Other services [SECTOR6=6] 477,1312 0,1638 0,0176 17776
10 or more bidders [X11=1] 36,0084 0,0931 0,0071 4152
2009 32,9524 0,0439 0,0032 17112
2010 45,7192 0,0459 0,0037 21678
2011 96,4456 0,0832 0,0080 13948
2012 196,3701 0,1192 0,0122 13812
2013 442,4965 0,1458 0,0151 20823
2014 701,3961 0,1770 0,0188 22386
2015 909,4062 0,2088 0,0224 20850
minimal corruption risk [CR2=0] 22,7685 0,0216 0,0019 48626
CR2=0.5 1680,6321 0,1691 0,0175 58760
maximal corruption risk [CR2=1] 625,8054 0,1937 0,0209 16676
EUFUND=0 635,8625 0,0917 0,0096 75685
EUFUND=1 1135,0194 0,1467 0,0150 52737
open procedure [PTYPE=4] 105,2030 0,0410 0,0037 62618
negotiation with announcement [PTYPE=3] 63,5620 0,0822 0,0077 9409
negotiation without announcement [PTYPE=2] 837,1757 0,1670 0,0174 30014
restricted and other procedures [PTYPE=1] 1849,5806 0,2857 0,0310 22652
mgts = 1 10,3966 0,1537 0,0152 440
without announcement [PTRANS=0] 2810,3491 0,2256 0,0241 55210
with announcement [PTRANS=1] 61,1593 0,0297 0,0027 69483
GOODW15=1 1636,061 0,11192 0,0113 130609
Note: MAD: The sum of absolute values of the difference between the theoretical (Benford’s)
and observed distribution – indicator suggested by Nigrini, 2000. If MAD < 0.006 there is good
fit,; 0.006 ≤ MAD < 0.012 is acceptable fit; 0.012 ≤ MAD < 0.015 is weak fit; and 0.015 ≤
MAD shows the lack of fit. See Nigrini, 2012, p. 160. Table 7.1.
The dark green cells show the good fit, the cells with light green show good and acceptable fit.
The white cells show the lack of fit, in these groups the contract prices are distorted.
Source: CRCB

51
Annex
52
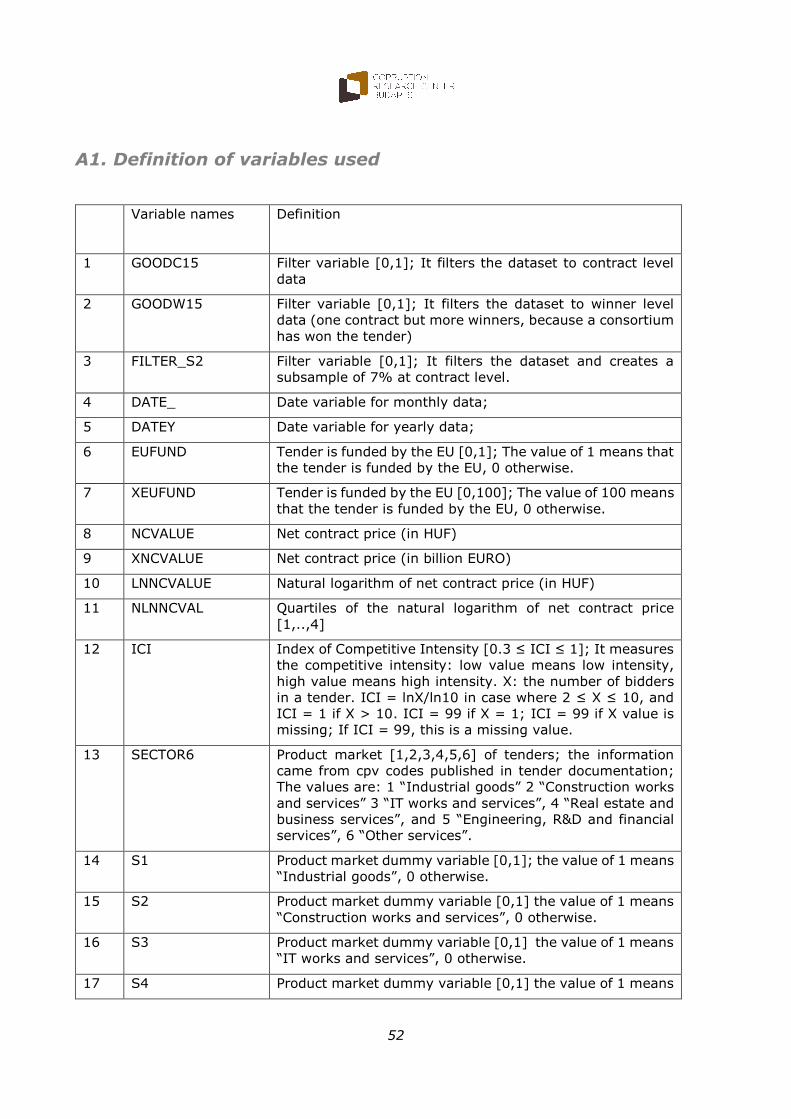
A1. Definition of variables used
Variable names Definition
1 GOODC15 Filter variable [0,1]; It filters the dataset to contract level
data
2 GOODW15 Filter variable [0,1]; It filters the dataset to winner level
data (one contract but more winners, because a consortium
has won the tender)
3 FILTER_S2 Filter variable [0,1]; It filters the dataset and creates a
subsample of 7% at contract level.
4 DATE_ Date variable for monthly data;
5 DATEY Date variable for yearly data;
6 EUFUND Tender is funded by the EU [0,1]; The value of 1 means that
the tender is funded by the EU, 0 otherwise.
7 XEUFUND Tender is funded by the EU [0,100]; The value of 100 means
that the tender is funded by the EU, 0 otherwise.
8 NCVALUE Net contract price (in HUF)
9 XNCVALUE Net contract price (in billion EURO)
10 LNNCVALUE Natural logarithm of net contract price (in HUF)
11 NLNNCVAL Quartiles of the natural logarithm of net contract price
[1,..,4]
12 ICI Index of Competitive Intensity [0.3 ≤ ICI ≤ 1]; It measures
the competitive intensity: low value means low intensity,
high value means high intensity. X: the number of bidders
in a tender. ICI = lnX/ln10 in case where 2 ≤ X ≤ 10, and
ICI = 1 if X > 10. ICI = 99 if X = 1; ICI = 99 if X value is
missing; If ICI = 99, this is a missing value.
13 SECTOR6 Product market [1,2,3,4,5,6] of tenders; the information
came from cpv codes published in tender documentation;
The values are: 1 “Industrial goods” 2 “Construction works
and services” 3 “IT works and services”, 4 “Real estate and
business services”, and 5 “Engineering, R&D and financial
services”, 6 “Other services”.
14 S1 Product market dummy variable [0,1]; the value of 1 means
“Industrial goods”, 0 otherwise.
15 S2 Product market dummy variable [0,1] the value of 1 means
“Construction works and services”, 0 otherwise.
16 S3 Product market dummy variable [0,1] the value of 1 means
“IT works and services”, 0 otherwise.
17 S4 Product market dummy variable [0,1] the value of 1 means

53
“Real estate and business services”, 0 otherwise.
18 S5 Product market dummy variable [0,1] the value of 1 means
5 “Engineering, R&D and financial services”, 0 otherwise.
19 TI Transparency Index [0,1]; the value of 0 means the tender
was issued without announcement; the value of 1 means
the tender was issued with announcement.
20 SB Single bidder [0,1]; the value of 0 means there were more
than one bidder; the value of 1 means there was only one
bidder.
21 XSB Single bidder [0,100]; the value of 0 means there were
more than one bidder; the value of 100 means there was
only one bidder.
22 CR2 Corruption Risk Indicator [0, 0.5, 1]; The value of 0 means
low corruption risk (more than one bidder and tender with
announcement), the value of 1 means high corruption risk
(only one bidder and tender without announcement).
23 BENFORD The first digit of contract prices [1,…,9];

54
A2. Some specific problems and errors of the official data
management of the Hungarian public procurement
Our data collection procedure revealed several problems regarding the official data management of the public procurement in Hungary. These problems
basically derive from the lack of validation of the fields on the data sheets. Several fields can be filled in as free text even if the requested information can
be categorized.
The most problematic parts of the data sheet are about the contract value. The
usage of thousand separators is not consistent, as both spaces11 and dots12 are used if there are separators at all13. We could detect five cases between 2012
and 2013 when the contract value was entered repeatedly14 by inspecting the top ten raw contract values. In some cases we suspect that this fault occurred
because the submitter of the data was not sure about the required form and entered the value several times but in different ways15. Also the use of the ‘.-
‘ suffix that is for monetary sums in Hungary is inconsistent; in some cases the contract value ends with ‘.-‘16 but in other cases not17.
The decision whether the contract value is defined as a unit price or not is quite
uncertain as unit prices can only be indicated indirectly by the specification of the unit after contract value18. However, in several cases there is no unit
described, but the amount of the contract value suggests that it is calculated as
a unit price19. The indication of the VAT rate also demonstrated in an inconsistent way. The 27% Hungarian standard VAT rate is indicated in four ways:
0,2720;
27,21; 27,022;
1,2723.
11 http://www.kozbeszerzes.hu/adatbazis/mutat/hirdetmeny/portal_7483_2012/ 12 http://www.kozbeszerzes.hu/adatbazis/mutat/hirdetmeny/portal_1235_2012/ 13 http://www.kozbeszerzes.hu/adatbazis/mutat/hirdetmeny/portal_7483_2013/ 14 http://www.kozbeszerzes.hu/adatbazis/mutat/hirdetmeny/portal_1793_2012/ 15 http://www.kozbeszerzes.hu/adatbazis/mutat/hirdetmeny/portal_5747_2012/ 16 http://www.kozbeszerzes.hu/adatbazis/mutat/hirdetmeny/portal_19240_2012/ 17 http://www.kozbeszerzes.hu/adatbazis/mutat/hirdetmeny/portal_1120_2012/ 18 http://www.kozbeszerzes.hu/adatbazis/mutat/hirdetmeny/portal_11150_2012/ 19 http://kozbeszerzes.hu/adatbazis/mutat/hirdetmeny/portal_10751_2013/ 20 http://www.kozbeszerzes.hu/adatbazis/mutat/hirdetmeny/portal_16473_2014/ 21 http://www.kozbeszerzes.hu/adatbazis/mutat/hirdetmeny/portal_20362_2014/ 22 http://www.kozbeszerzes.hu/adatbazis/mutat/hirdetmeny/portal_10142_2012/ 23 http://www.kozbeszerzes.hu/adatbazis/mutat/hirdetmeny/portal_12141_2014/

55
The indication method of the main activity of the contracting body gives the
opportunity for the submitter to mark several activities24 from a list with twenty predefined items; or by choosing the “Other” option, the submitter can describe
the activity of the contracting body by his or her own words25.
24 http://kozbeszerzes.hu/adatbazis/mutat/hirdetmeny/portal_10031_2013/ 25 http://kozbeszerzes.hu/adatbazis/mutat/hirdetmeny/portal_10127_2013/