THE BABY BOOM CHART BOOK 1997 - Yardeni · PDF fileDeutsche Morgan Grenfell US Equity Research...
29
Deutsche Morgan Grenfell US Equity Research #35 The Economic Consequences Of The Peace #36 Conference Call With Alan Blinder #37 New Era Recession? #38 Fed’s Stock Market Model Finds Overvaluation Portfolio Strategy Service Topical Study #39 THE BABY BOOM CHART BOOK 1997 November 11, 1997 ❖ Dr. Edward Yardeni Amalia Quintana E-Mail: Web Site: [email protected] http://www.yardeni.com/
Transcript of THE BABY BOOM CHART BOOK 1997 - Yardeni · PDF fileDeutsche Morgan Grenfell US Equity Research...

Deutsche Morgan GrenfellUS EquityResearch
#35 The Economic Consequences Of The Peace
#36 Conference Call With Alan Blinder
#37 New Era Recession?
#38 Fed’s Stock Market Model Finds Overvaluation
Portfolio Strategy Service
Topical Study #39
THE BABY BOOMCHART BOOK 1997
November 11, 1997
❖
Dr. Edward YardeniAmalia Quintana
E-Mail:Web Site:
[email protected]://www.yardeni.com/

1910
1915
1920
1925
1930
1935
1940
1945
1950
1955
1960
1965
1970
1975
1980
1985
1990
1995
2.0
2.5
3.0
3.5
4.0
4.5
2.0
2.5
3.0
3.5
4.0
4.5
96
#1 In
200
0, t
he
Bab
y B
oo
mer
s w
ill b
e 36
-54
year
s o
ld.
LIV
E B
IRT
HS
*(m
illio
ns)
* F
igur
es in
par
enth
eses
are
the
youn
gest
and
old
est a
ges
of g
roup
mem
bers
dur
ing
1997
.
"Gra
ndpa
rent
s"44
mill
ion
(73-
87)
"Par
ents
"55
mill
ion
(52-
72)
Bab
yB
oom
76 m
illio
n(3
3-51
)
Bab
yB
ust
41 m
illio
n(2
1-32
)
Bab
yB
oom
let
64 m
illio
n(0
-20)
ww
w.y
arde
ni.c
om
Page 2 / November 11, 1997 / Deutsche Morgan Grenfell Topical Study #39

52 54 56 58 60 62 64 66 68 70 72 74 76 78 80 82 84 86 88 90 92 94 96 9835
40
45
50
55
60
65
35
40
45
50
55
60
65
Q3
Q3
AGE COMPOSITION OF LABOR FORCE*(percent) 1962
1975
1980
1987
16-34 Year Olds
35-64 Year Olds
* Oldest and youngest Baby Boomers turned 16 in 1962 and 1980, respectively.
www.yardeni.com
#2
In 1980, the Baby Boomers all turned 16 years or older. Maturity will increase through 2010. The labor force is the most mature since the mid-1960s.
19551957
19591961
19631965
19671969
19711973
19751977
19791981
19831985
19871989
19911993
19951997
19992001
20032005
20072009
2011
32
34
36
38
40
42
44
46
48
50
52
32
34
36
38
40
42
44
46
48
50
52
Oct
THE AGE WAVE
Age Composition ofAdult Population:15-34 Year Olds*(percent)
Age Composition ofLabor Force:16-34 Year Olds(percent)
* Projected data start in 1994. Adult population is 15 years and older, and includes armed forces overseas.
www.yardeni.com
#3#3
- The Age Wave -
Deutsche Morgan Grenfell Topical Study #39 / November 11, 1997 / Page 3

60 62 64 66 68 70 72 74 76 78 80 82 84 86 88 90 92 94 96 98 00.4
.5
.6
.7
.8
.9
1.0
1.1
1.2
1.3
1.4
1.5
1.6
1.7
1.8
1.9
2.0
2.1
2.2
2.3
44
46
48
50
52
54
56
58
60
62
Oct
Sep
THE AGE WAVE & STOCK PRICES
Age Wave*
Ratio of S&P 500 Stock Indexto Personal Consumption Expenditures
* Percent of labor force 35-64 years old.
www.yardeni.com
#4
Stock prices have risen faster than consumption and home prices as the Baby Boomers have aged. But the best gains may be over for stocks for a while.
68 70 72 74 76 78 80 82 84 86 88 90 92 94 96 98 001
2
3
4
5
6
7
44
46
48
50
52
54
56
58
60
Oct
THE AGE WAVE & ASSET PRICES
Age Wave*
Ratio of S&P 500 Stock Indexto Average Existing Home Prices
* Percent of labor force 35-64 years old.
www.yardeni.com
#5#5
- The Age Wave -
Page 4 / November 11, 1997 / Deutsche Morgan Grenfell Topical Study #39

60 62 64 66 68 70 72 74 76 78 80 82 84 86 88 90 92 94 96 98 000
2
4
6
8
10
12
35
40
45
50
55
Oct
THE AGE WAVE & INFLATION
Inflation Trend**
Age Wave*
** Five-year moving average of yearly percent change in CPI. * Percent of labor force 16-34 years old.
www.yardeni.com
#6
Age Wave is a big influence on inflation trend and suggests inflation will remain subdued at least through end of the century. The Baby Boomers will be 36-54 years old by the year 2000. That’s bullish for bonds. We expect the government bond yield to fall to 4% in 2000.
60 62 64 66 68 70 72 74 76 78 80 82 84 86 88 90 92 94 96 98 002
3
4
5
6
7
8
9
10
11
12
13
36
38
40
42
44
46
48
50
52
Oct
Oct
THE AGE WAVE & BOND YIELD
Ten-Year GovernmentBond Yield**
Age Wave*
** Five-year moving average of ten-year government bond yield. * Percent of labor force 16-34 years old.
www.yardeni.com
#7#7
- The Age Wave -
Deutsche Morgan Grenfell Topical Study #39 / November 11, 1997 / Page 5

10
15
20
25
30
35
40
45
50
10
15
20
25
30
35
40
45
50
25-34
10
15
20
25
30
35
40
45
50
10
15
20
25
30
35
40
45
50
35-44
10
15
20
25
30
35
40
45
50
10
15
20
25
30
35
40
45
50
45-54
10
15
20
25
30
35
40
45
50
10
15
20
25
30
35
40
45
50
55-64
1960 1965 1970 1975 1980 1985 1990 1995 2000 2005 2010
10
15
20
25
30
35
40
45
50
10
15
20
25
30
35
40
45
50
65 & Over
#8 US POPULATION BY AGE (millions)
Source: Bureau of the Census, U.S. Department of Commerce
www.yardeni.com
- Population: Numbers -
Page 6 / November 11, 1997 / Deutsche Morgan Grenfell Topical Study #39

-1.5
-.5
.5
1.5
2.5
-1.5
-.5
.5
1.5
2.5
25-34
-1
0
1
2
-1
0
1
2
35-44
-.5
.5
1.5
2.5
-.5
.5
1.5
2.545-54
#9 US POPULATION BY AGE (annual change, millions)
-1
0
1
2
-1
0
1
255-64
1960 1965 1970 1975 1980 1985 1990 1995 2000 2005 2010-1
0
1
2
-1
0
1
2
65 & Over
www.yardeni.com
Source: Bureau of the Census, U.S. Department of Commerce
- Population: Numbers -
Deutsche Morgan Grenfell Topical Study #39 / November 11, 1997 / Page 7

-4
-2
0
2
4
6
8
-4
-2
0
2
4
6
8
25-34
-4
-2
0
2
4
6
8
-4
-2
0
2
4
6
8
35-44
-4
-2
0
2
4
6
8
-4
-2
0
2
4
6
8
45-54
-4
-2
0
2
4
6
8
-4
-2
0
2
4
6
8
55-64
1960 1965 1970 1975 1980 1985 1990 1995 2000 2005 2010
-4
-2
0
2
4
6
8
-4
-2
0
2
4
6
8
65 & Over
#10 US POPULATION BY AGE (yearly percent change)
Source: Bureau of the Census, U.S. Department of Commerce
www.yardeni.com
- Population: Numbers -
Page 8 / November 11, 1997 / Deutsche Morgan Grenfell Topical Study #39

62 64 66 68 70 72 74 76 78 80 82 84 86 88 90 92 94 96 98 00.8
1.0
1.2
1.4
1.6
1.8
2.0
2.2
2.4
2.6
2.8
3.0
.8
1.0
1.2
1.4
1.6
1.8
2.0
2.2
2.4
2.6
2.8
3.0
Oct
Sep
POPULATION(yearly percent change in 12-month avg)
Civilian NoninstitutionalWorking-Age Population**
TotalPopulation*
* Population used to calculate per capita income. Includes military in US. Source: Census Bureau.** Source: US Department of Labor, Bureau of Economic Analysis.
www.yardeni.com
#11
The working-age population grew much faster than the total population during the late 1960s and 1970s as the Baby Boomers flooded into the labor markets. The growth rate has been at record lows through most of the 1990s.
62 64 66 68 70 72 74 76 78 80 82 84 86 88 90 92 94 96 98 00.0
.5
1.0
1.5
2.0
2.5
3.0
3.5
4.0
.0
.5
1.0
1.5
2.0
2.5
3.0
3.5
4.0
96
HOUSEHOLD FORMATION(millions)
5-year moving average
Source: US Department of Commerce, Bureau of the Census, Series P-20.
www.yardeni.com
#12
The Baby Boomers are no longer young adults. As a result, household formation has declined sharply from 1.6 million per year, on average, during the 1980s to 1.0 million per year from 1990 to 1996.
- Population: Numbers -
Deutsche Morgan Grenfell Topical Study #39 / November 11, 1997 / Page 9

48 50 52 54 56 58 60 62 64 66 68 70 72 74 76 78 80 82 84 86 88 90 92 94 96 982.6
2.7
2.8
2.9
3.0
3.1
3.2
3.3
3.4
3.5
3.6
3.7
3.8
2.6
2.7
2.8
2.9
3.0
3.1
3.2
3.3
3.4
3.5
3.6
3.7
3.8
96
96
AVERAGE POPULATION
Per Family
Per Household
Source: Current Population Reports
www.yardeni.com
#13Since the mid-1960s there has been a significant downtrend in the average number of people in both family and household living units. However, both have flattened in recent years. Households are smaller than families, on average, because there are many single-person households: People are marrying later, getting divorced, and living longer.
67 68 69 70 71 72 73 74 75 76 77 78 79 80 81 82 83 84 85 86 87 88 89 90 91 92 93 94 95 96 97 980
2
4
6
8
10
12
0
2
4
6
8
10
12
96
NONFAMILY HOUSEHOLDS BY AGE OF HEAD(as a percent of total households)
65 +
25-34
35-44
45-54
55-64
15-24
Source: US Department of Commerce, Bureau of the Census, Series P-20.
www.yardeni.com
#14
In 1996, 30% of all households were not families, up from 18% in 1967. One-third of the nonfamily households are senior citizens.
- Population: Characteristics -
Page 10 / November 11, 1997 / Deutsche Morgan Grenfell Topical Study #39

40 42 44 46 48 50 52 54 56 58 60 62 64 66 68 70 72 74 76 78 80 82 84 86 88 90 92 94 96 9820
21
22
23
24
25
26
27
28
20
21
22
23
24
25
26
27
28
95
95
MEDIAN AGE AT FIRST MARRIAGE
Men
Women
Source: Current Population Reports
www.yardeni.com
#15
People are getting married for the first time at a later age. The medium age for men is up to 27 from about 23 twenty years ago. Women are waiting until their mid-twenties to marry. During the 1950s and 1960s, they tended to marry in their early twenties.
40 42 44 46 48 50 52 54 56 58 60 62 64 66 68 70 72 74 76 78 80 82 84 86 88 90 92 94 96 98 000
5
10
15
20
0
5
10
15
20
96
96
MARRIAGE & DIVORCE(rate per 1000 population)
Marriages
Divorces
Source: US National Center for Health Statistics, Vital Statistics of the United States.
www.yardeni.com
#16
The marriage rate has been moving lower in recent years, while the divorce rate has been relatively steady.
- Population: Characteristics -
Deutsche Morgan Grenfell Topical Study #39 / November 11, 1997 / Page 11

27
28
29
30
31
32
33
34
35
36
27
28
29
30
31
32
33
34
35
36
96
52 54 56 58 60 62 64 66 68 70 72 74 76 78 80 82 84 86 88 90 92 94 96 98 0067
69
71
73
75
77
67
69
71
73
75
7796LIFE EXPECTANCY AT BIRTH**
(years)
POPULATION: MEDIAN AGE IN YEARS*
** Source: US National Center for Health Statistics, Vital Statistics of the United States.
* Source: US Bureau of the Census, Population Division, release PPL-57, United States Population Estimates by Age, Sex, Race and Hispanic Origin.
www.yardeni.com
#17
The medium age of the population is 35, up from 29 twenty years ago, and it will continue to rise over the rest of the decade because the Baby Boomers are aging and senior citizens are living longer. Life expectancy is up over 76 years compared to about 70 years during the late 1960s.
15-19 20-24 25-29 30-34 45-64 65-74 75-84 85 & Over 0
5
10
15
20
25
30
35
40
45
0
5
10
15
20
25
30
35
40
45MOBILITY STATUS BY AGE GROUP, 1993-94(percent movers)
18
36
31
18
9
6 5 6
Source: Bureau of the Census, Geographical Mobility: March 1992 to March 1993,Current Population Reports, Series P-20.
www.yardeni.com
#18
Older people tend to move less than younger ones.
- Population: Characteristics -
Page 12 / November 11, 1997 / Deutsche Morgan Grenfell Topical Study #39

62 64 66 68 70 72 74 76 78 80 82 84 86 88 90 92 94 96 98 0050
55
60
65
70
75
80
85
90
95
100
105
110
7000
8000
9000
10000
11000
12000
13000
14000
15000
16000
17000
18000
19000
20000
21000
22000
23000Sep
Sep
Q2
REAL PERSONAL INCOME & CONSUMPTION PER CAPITAVS PRODUCTIVITY
Real Personal IncomePer Capita(1992 dollars, 12-month sum)
Real Consumption Per Capita(1992 dollars, 12-month sum)
Nonfarm Productivity(1977=100)
www.yardeni.com
#19
Per capita real personal income and consumption are at record highs. Productivity is the main determinant of these three measures of the standard of living and it is also at a record.
67 68 69 70 71 72 73 74 75 76 77 78 79 80 81 82 83 84 85 86 87 88 89 90 91 92 93 94 95 96 97 98 998
9
10
11
12
13
14
15
16
17
18
19
20
21
22
23
8
9
10
11
12
13
14
15
16
17
18
19
20
21
22
23Sep
96
INCOME PER CAPITA(thousands of dollars)
Adjusted Mean HouseholdIncome Per Capita*(1996 dollars)
Personal Income Per Capita(1992 dollars, 12-month sum)
* Mean income of households divided by average population per household.
www.yardeni.com
#20
Both median and mean family household income data show virtually no growth over the past 25 years. Both measures need to be divided by the average size of the household unit, which has been falling. Adjusted this way, mean household income per capita has been growing in line with personal income per capita!
- Income & Spending -
Deutsche Morgan Grenfell Topical Study #39 / November 11, 1997 / Page 13

62 64 66 68 70 72 74 76 78 80 82 84 86 88 90 92 94 96 98 00-2
0
2
4
6
8
10
-2
0
2
4
6
8
10
Sep
REAL PERSONAL INCOME(yearly percent change in 12-month avg)
5.3%
3.6%
2.7%
2.0%
* Dashed lines show decades’ annual averages.
www.yardeni.com
#21
Real personal income growth was on a downtrend over the past three decades as growth in productivity stagnated. This long-term trend is already getting reversed in the current decade.
62 64 66 68 70 72 74 76 78 80 82 84 86 88 90 92 94 96 98 00-2.5-2.0-1.5-1.0-.5.0.51.01.52.02.53.03.54.04.55.05.56.06.57.07.58.08.5
-2.5-2.0-1.5-1.0-.5.0.5
1.01.52.02.53.03.54.04.55.05.56.06.57.07.58.08.5
Sep
REAL PER CAPITA PERSONAL INCOME(yearly percent change in 12-month avg)
4.0%
2.5% 1.8%1.0%
* Dashed lines show decades’ annual averages.
www.yardeni.com
#22#22
- Income & Spending -
Page 14 / November 11, 1997 / Deutsche Morgan Grenfell Topical Study #39

62 64 66 68 70 72 74 76 78 80 82 84 86 88 90 92 94 96 98 00-2
0
2
4
6
8
-2
0
2
4
6
8
Sep
REAL CONSUMPTION EXPENDITURES(yearly percent change in 12-month avg)
4.9%
3.6% 3.0%
2.1%
* Dashed lines show decades’ annual averages.
www.yardeni.com
#23
Consumer spending growth has been on a downtrend for quite some time because income growth has been on a downtrend. Income growth is improving. Consumption growth should follow unless Baby Boomers decide to save more.
62 64 66 68 70 72 74 76 78 80 82 84 86 88 90 92 94 96 98 00-2
0
2
4
6
8
-2
0
2
4
6
8
Sep
REAL CONSUMPTION PER CAPITA(yearly percent change in 12-month avg)
3.6%
2.5%2.0%
1.1%
* Dashed lines show decades’ annual averages.
www.yardeni.com
#24#24
- Income & Spending -
Deutsche Morgan Grenfell Topical Study #39 / November 11, 1997 / Page 15

62 64 66 68 70 72 74 76 78 80 82 84 86 88 90 92 94 96 98 00800
1000
1200
1400
1600
1800
2000
2200
2400
2600
2800
3000
3200
3400
800
1000
1200
1400
1600
1800
2000
2200
2400
2600
2800
3000
3200
3400SepREAL CONSUMPTION PER CAPITA
(1992 dollars, saar)Rent &Utilities*
Food
MedicalCare
* Rent includes owner- and tenant-occupied rent. Utilities include electricity, gas, water and other sanitary services, fuel oil and coal.
www.yardeni.com
#25
On a per capita basis, the fastest growing categories of real consumption are medical care and recreation. The other major categories are showing relatively little growth per capita.
62 64 66 68 70 72 74 76 78 80 82 84 86 88 90 92 94 96 98 00200
400
600
800
1000
1200
1400
1600
1800
2000
2200
2400
200
400
600
800
1000
1200
1400
1600
1800
2000
2200
2400
Sep
REAL CONSUMPTION PER CAPITA(1992 dollars, saar)
Transportation
PersonalBusiness*
Clothing & Shoes
Recreation
* Includes brokerage charges and investment counseling, bank service charges, services furnished without payment by financial intermediaries except life insurance carriers and private noninsured pension plans, expense of handling life insurance legal services, funeral and burial expenses and other.
www.yardeni.com
#26#26
- Income & Spending -
Page 16 / November 11, 1997 / Deutsche Morgan Grenfell Topical Study #39

60 62 64 66 68 70 72 74 76 78 80 82 84 86 88 90 92 94 96 98 009
10
11
12
13
14
15
16
17
18
19
20
21
22
23
24
25
26
27
28
9
10
11
12
13
14
15
16
17
18
19
20
21
22
23
24
25
26
27
28
Sep
REAL CONSUMPTION BY CATEGORY(as a percent of total real consumption)
Rent &Utilities*
Food
MedicalCare
* Rent includes owner- and tenant-occupied rent. Utilities include electricity, gas, water and other sanitary services, fuel oil and coal.
www.yardeni.com
#27
For the first time ever, consumers are spending more of their budgets on medical care than on food. The proportion of total consumption spent on food has been declining for a long time, as consumers spend relatively more on medical care and recreation.
60 62 64 66 68 70 72 74 76 78 80 82 84 86 88 90 92 94 96 98 002
4
6
8
10
12
14
16
2
4
6
8
10
12
14
16
Sep
REAL CONSUMPTION BY CATEGORY(as a percent of total real consumption)
Transportation
PersonalBusiness*
Clothing & Shoes
Recreation
* Includes brokerage charges and investment counseling, bank service charges, services furnished without payment by financial intermediaries except life insurance carriers and private noninsured pension plans, expense of handling life insurance legal services, funeral and burial expenses and other.
www.yardeni.com
#28#28
- Income & Spending -
Deutsche Morgan Grenfell Topical Study #39 / November 11, 1997 / Page 17

67 68 69 70 71 72 73 74 75 76 77 78 79 80 81 82 83 84 85 86 87 88 89 90 91 92 93 94 95 96 97 9815
20
25
30
35
40
45
50
55
60
65
15
20
25
30
35
40
45
50
55
60
65
96
MEAN INCOME OF HOUSEHOLDS BY AGE OF HEAD(thousands of 1996 dollars)
45-54
35-44
55-64
All*
25-34
65 +
* Includes 15-24 year olds. Source: Bureau of the Census, Income Statistics Branch, unpublished data.
www.yardeni.com
#29
Older workers tend to earn more than younger ones, presumably because they are more experienced, productive, and committed to their jobs. By the year 2000, the Baby Boomers will be 36-54 years old. So there will be more households earning more money than ever before.
67 68 69 70 71 72 73 74 75 76 77 78 79 80 81 82 83 84 85 86 87 88 89 90 91 92 93 94 95 96 97 9810
12
14
16
18
20
22
24
26
10
12
14
16
18
20
22
24
26
96
NUMBER OF HOUSEHOLDS BY AGE OF HEAD(millions)
25-34
35-44
45-54
55-64
65 +
Source: Bureau of the Census, Income Statistics Branch, unpublished data.
www.yardeni.com
#30
During the 1980s, all household age groups shown here increased in numbers except the 55-64 group. During the 1990s, only the 35-44 and 45-54 year olds are growing.
- Income & Spending -
Page 18 / November 11, 1997 / Deutsche Morgan Grenfell Topical Study #39

67 68 69 70 71 72 73 74 75 76 77 78 79 80 81 82 83 84 85 86 87 88 89 90 91 92 93 94 95 96 97 98200
300
400
500
600
700
800
900
1000
1100
1200
1300
1400
200
300
400
500
600
700
800
900
1000
1100
1200
1300
1400
96AGGREGATE MONEY INCOMEBY AGE OF HOUSEHOLD*(billions of 1996 dollars)
* Mean income times number of households.
25-34
35-44
55-64
45-54
65 +
www.yardeni.com
#31
During the 1990s, the only age groups showing significant gains in total group money income are people 35-44 and 45-54.
67 68 69 70 71 72 73 74 75 76 77 78 79 80 81 82 83 84 85 86 87 88 89 90 91 92 93 94 95 96 97 9810
15
20
25
30
10
15
20
25
30
96
96
AGGREGATE MONEY INCOMEBY AGE OF HOUSEHOLD*(as a percent of total money income)
* Mean income in 1996 dollars times number of households.
35-44
45-54
25-34
55-64
65 +
www.yardeni.com
#32
By the year 2000, 35-54 year olds will probably account for 65% of personal income, up from over 53% currently.
- Income & Spending -
Deutsche Morgan Grenfell Topical Study #39 / November 11, 1997 / Page 19

60 62 64 66 68 70 72 74 76 78 80 82 84 86 88 90 92 94 96 98 003.5
4.0
4.5
5.0
5.5
6.0
6.5
7.0
7.5
8.0
8.5
9.0
9.5
10.0
3.5
4.0
4.5
5.0
5.5
6.0
6.5
7.0
7.5
8.0
8.5
9.0
9.5
10.0
Sep
PERSONAL SAVINGS RATE(12-month avg, percent)
www.yardeni.com
#33
So far the aging of the Baby Boomers hasn’t boosted the personal savings rate. Instead, it is still falling.
1981 1982 1983 1984 1985 1986 1987 1988 1989 1990 1991 1992 1993 1994 1995 1996 1997 1998-50
0
50
100
150
200
250
300
-50
0
50
100
150
200
250
300
Sep
Sep
PERSONAL SAVINGS VSCONSUMER INSTALLMENT BORROWING(12-month sum, billion dollars)
PersonalSavings
PersonalBorrowing
www.yardeni.com
#34
Borrowing pace is in cyclical decline. Personal savings still below peak of early 1990s.
- Personal Savings -
Page 20 / November 11, 1997 / Deutsche Morgan Grenfell Topical Study #39

60 62 64 66 68 70 72 74 76 78 80 82 84 86 88 90 92 94 96 98-100
-50
0
50
100
150
200
250
300
350
400
-100
-50
0
50
100
150
200
250
300
350
400
96
96
96
PERSONAL SAVING AND ITS COMPONENTS(billion dollars)
Personal Saving
Impersonal Components
Truly Personal Components
www.yardeni.com
#35
Personal savings includes two big "impersonal" sources of income which are not taxed and can only be saved. They exceed $300 billion and currently exceed total personal savings. Indeed, excluding these two, "truly" personal savings has been mostly negative since 1987.
60 62 64 66 68 70 72 74 76 78 80 82 84 86 88 90 92 94 96 980
100
200
300
0
100
200
300
96
96
"IMPERSONAL" COMPONENTS OF PERSONAL INCOME(billion dollars)
Imputed Interest Received FromPrivate Noninsured Pension PlansAnd From Life Insurance Carriers
Employer Contributions ToPrivate Pension Funds
www.yardeni.com
#36#36
- Personal Savings -
Deutsche Morgan Grenfell Topical Study #39 / November 11, 1997 / Page 21

50 52 54 56 58 60 62 64 66 68 70 72 74 76 78 80 82 84 86 88 90 92 94 96 98 0025
30
35
40
45
50
55
60
65
70
75
80
25
30
35
40
45
50
55
60
65
70
75
80
Oct
CIVILIAN LABOR FORCE(as a percent of total labor force)
Female
Male
www.yardeni.com
#37
Males now account for less than 55% of the labor force, down from 70% in the early 1950s. Females account for 46%, up from 29% in the early 1950s.
50 52 54 56 58 60 62 64 66 68 70 72 74 76 78 80 82 84 86 88 90 92 94 96 98 0015
20
25
30
35
40
45
50
55
60
65
70
15
20
25
30
35
40
45
50
55
60
65
70
OctCIVILIAN LABOR FORCE PARTICIPATION RATE*(percent)
Female Component*
Total
Male Component*
* Labor force divided by noninstitutional working-age population. Male and female components are persons that are 16 years and older.
www.yardeni.com
#38
The labor force participation rate is hovering around 67%. Since the 1950s, the decline in the male component of the labor force participation rate has been more than offset by females.
- Labor Force -
Page 22 / November 11, 1997 / Deutsche Morgan Grenfell Topical Study #39

50 52 54 56 58 60 62 64 66 68 70 72 74 76 78 80 82 84 86 88 90 92 94 96 98 0030
35
40
45
50
55
60
65
70
75
30
35
40
45
50
55
60
65
70
75
Oct
Oct
FEMALE CIVILIAN LABOR FORCE PARTICIPATION RATE BY AGE*(percent)
35 & Over
16-34
* Female labor force divided by female noninstitutional working-age population.
www.yardeni.com
#39
A record 55% of all women who are 35 years or older are in the labor force. The labor force participation rate of younger women has stabilized around 70% in recent years.
50 52 54 56 58 60 62 64 66 68 70 72 74 76 78 80 82 84 86 88 90 92 94 96 98 0065
70
75
80
85
90
95
65
70
75
80
85
90
95
Oct
Oct
MALE CIVILIAN LABOR FORCE PARTICIPATION RATE BY AGE*(percent)
35 & Over
16-34
* Male labor force divided by male noninstitutional working-age population.
www.yardeni.com
#40
The percent of older males participating in the labor force is hovering around 70%, while the younger ones’ participation rate is heading toward 80%.
- Labor Force -
Deutsche Morgan Grenfell Topical Study #39 / November 11, 1997 / Page 23

48 50 52 54 56 58 60 62 64 66 68 70 72 74 76 78 80 82 84 86 88 90 92 94 96 98 002
4
6
8
10
12
2
4
6
8
10
12
Q3
CIVILIAN UNEMPLOYMENT RATE(percent)
www.yardeni.com
#41
The unemployment rate shifted upward during the 1970s and early 1980s relative to inflation because there was a hugh influx of young workers who tend to have higher unemployment rates than older ones. Since the early 1980s, the unemployment rate has been shifting back down. Currently, it is at a 24-year low.
1
2
3
4
5
6
1
2
3
4
5
6
Q3
48 50 52 54 56 58 60 62 64 66 68 70 72 74 76 78 80 82 84 86 88 90 92 94 96 98 000
1
2
3
4
5
0
1
2
3
4
5
Q3
Q3
TOTAL UNEMPLOYED BY AGE(as a percent of total labor force)
55 & Over
25-54
16-24
www.yardeni.com
#42#42
- Unemployment -
Page 24 / November 11, 1997 / Deutsche Morgan Grenfell Topical Study #39

48 50 52 54 56 58 60 62 64 66 68 70 72 74 76 78 80 82 84 86 88 90 92 94 96 98 0035
45
55
65
75
35
45
55
65
75
Oct
LABOR FORCE: MEN 55 YEARS & OVER(as a percent of male civilian noninstitutional population 55 years & older)
www.yardeni.com
#43
There was a dramatic long-term downward trend in the labor force participation rate of older men since the late 1940s until flattening out in the 1990s.
48 50 52 54 56 58 60 62 64 66 68 70 72 74 76 78 80 82 84 86 88 90 92 94 96 98 002
4
6
8
10
12
2
4
6
8
10
12
Oct
UNEMPLOYMENT RATES BY SEX( percent)
Males
Femaleswww.yardeni.com
#44
During the 1950s, 1960s, and 1970s, the female unemployment rate usually exceeded the male rate. Since the 1980s, the two rates have been nearly identical. Both are down to about 4.5%.
- Unemployment -
Deutsche Morgan Grenfell Topical Study #39 / November 11, 1997 / Page 25
68 69 70 71 72 73 74 75 76 77 78 79 80 81 82 83 84 85 86 87 88 89 90 91 92 93 94 95 96 97 98 99 000
100
200
300
400
500
600
700
800
900
1000
0
100
200
300
400
500
600
700
800
900
1000Sep
97
97
MEDICAL CARE SPENDING(billion dollars)
Total Medical CareConsumption
Medicare PlusMedicaid
Medicare www.yardeni.com
#45
Spending on health care will continue to rise rapidly as Baby Boomers age.
68 69 70 71 72 73 74 75 76 77 78 79 80 81 82 83 84 85 86 87 88 89 90 91 92 93 94 95 96 97 98 99 000
1000
2000
3000
4000
5000
6000
7000
8000
0
1000
2000
3000
4000
5000
6000
7000
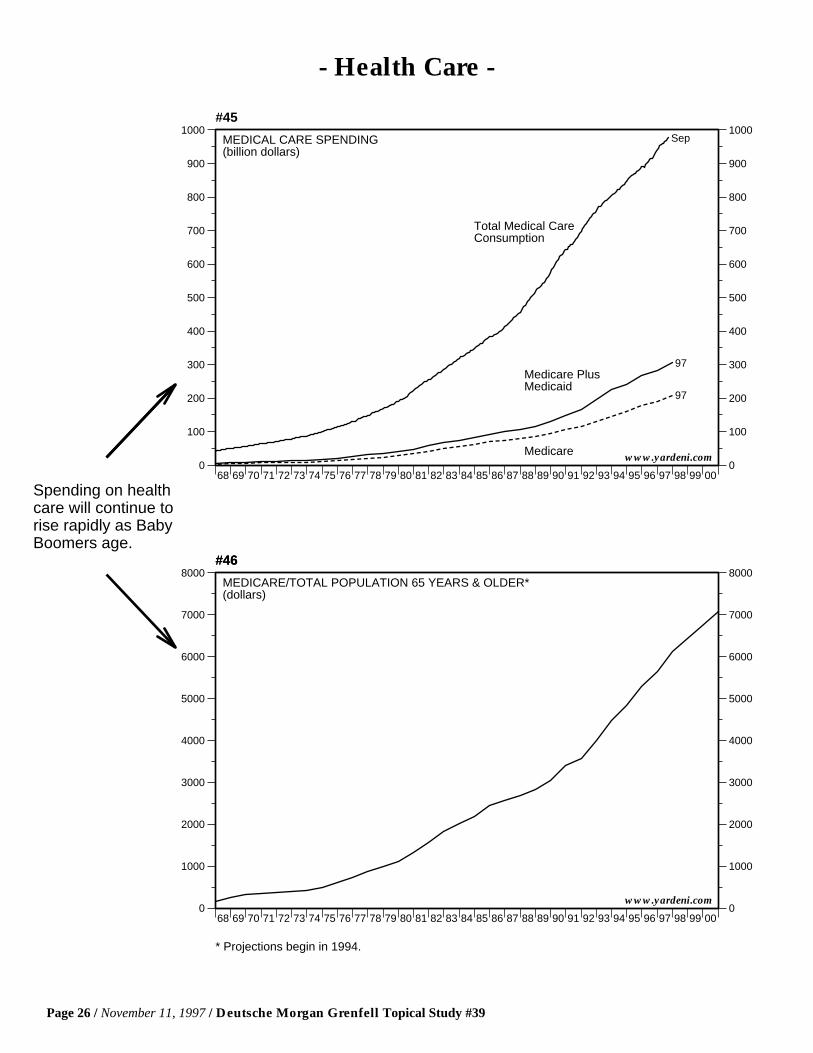
8000MEDICARE/TOTAL POPULATION 65 YEARS & OLDER*(dollars)
* Projections begin in 1994.
www.yardeni.com
#46#46
- Health Care -
Page 26 / November 11, 1997 / Deutsche Morgan Grenfell Topical Study #39

64 66 68 70 72 74 76 78 80 82 84 86 88 90 92 94 96 98 00 02 04 06-20
-10
0
10
20
30
40
50
60
70
80
90
100
110
120
130
-20
-10
0
10
20
30
40
50
60
70
80
90
100
110
120
130
2002SOCIAL SECURITY SURPLUS(billion dollars)
Dashed line is Congressional Budget Office’s baseline projection.
www.yardeni.com
#47
Social security will remain in surplus for the next 15 years. Big deficits will start when the Baby Boomers start to retire after 2010.
64 66 68 70 72 74 76 78 80 82 84 86 88 90 92 94 96 98 00 02 04 060
100
200
300
400
500
0
100
200
300
400
500
F
2002
2002
FEDERAL OUTLAYS(billion dollars)
Social Security
Medicare+Medicaid
F = Forecast line. Source: Congressional Budget Office.
www.yardeni.com
#48
Social security and health care outlays will rise rapidly as the Baby Boomers age.
- Social Security -
Deutsche Morgan Grenfell Topical Study #39 / November 11, 1997 / Page 27

TOPICAL STUDIES
Topical Studies #19 and higher are available on http://www.yardeni.com/yardeni/topical.html
#38 Dr. Edward Yardeni, Fed’s Stock Market Model Finds Overvaluation, August 25, 1997
#37 Dr. Edward Yardeni, New Era Recession? Deflation, Irrational Exuberance, & Y2K, July 14, 1997
#36 Dr. Edward Yardeni, Conference Call With Alan Blinder, June 2, 1997
#35 Dr. Edward Yardeni, The Economic Consequences Of The Peace, May 7, 1997
#34 Dr. Edward Yardeni, Populist Capitalism And Other Wildly Bullish Themes, February 25, 1997
#33 Dr. Edward Yardeni, Productivity Must Be Booming, January 20, 1997
#32 Dr. Edward Yardeni, The Undefeated Forces Of Deflation, October 28, 1996
#31 Dr. Edward Yardeni, Economic Consequences Of The Internet, October 22, 1996
#30 Dr. Edward Yardeni, Backlash: Workers Vs. Bonds, May 8, 1996
#29 Dr. Edward Yardeni with Amalia Quintana, The Baby Boom Chart Book 1996, March 28, 1996
#28 Dr. Edward Yardeni, Liquidity Story Is Wildly Bullish, February 12, 1996
#27 Dr. Edward Yardeni, 10,000 In 2000, November 6, 1995
#26 Dr. Edward Yardeni, The US Economy’s Mega-Trends, July 10, 1995
#25 Dr. Edward Yardeni, The High-Tech Revolution In The US of @, March 20, 1995
#24 Dr. Edward Yardeni, Hard Or Soft Landing?, February 6, 1995
#23 Dr. Edward Yardeni, The End Of The Cold War Is Bullish, September 10, 1993
#22 Dr. Edward Yardeni, Apocalypse Now! (NOT!), May 8, 1992
#21 Dr. Edward Yardeni with Amalia Quintana, The Baby Boom Chart Book 1991, October 9, 1991
#20 Dr. Edward Yardeni, The Collapse Of Communism Is Bullish, September 4, 1991
#19 Dr. Edward Yardeni and David Moss, The Triumph Of Adam Smith, July 17, 1990
#18 Dr. Edward Yardeni and Deborah Johnson, Dow 5000, May 9, 1990
#17 Dr. Edward Yardeni, The Triumph Of Capitalism, August 1, 1989
#16 Dr. Edward Yardeni with Amalia Quintana, The Baby Boom Chart Book, January 25, 1989
#15 Dr. Edward Yardeni and David Moss, The New Wave Manifesto, October 5, 1988
#14 Dr. Edward Yardeni, Could Real Estate Prices Fall? And What If They Do?, August 24, 1988
#13 Dr. Edward Yardeni, The Coming Shortage Of Bonds, June 20, 1988
#12 Dr. Edward Yardeni, How The Baby Boomers Are Changing The Economy, April 6, 1988
#11 Dr. Edward Yardeni and Deborah Johnson, The Restructuring Of Corporate America Is Bullish, December 9, 1987

Copyright (C) Deutsche Morgan Grenfell Inc. 1997. All rights reserved. Theinformation contained herein has been obtained from sources believedto be reliable, but is not necessarily complete and its accuracy cannot beguaranteed. Any opinions expressed are subject to change without notice.Deutsche Morgan Grenfell Inc. and its affiliated companies and/or individualsmay, from time to time, own, have positions in, or options on the securitiesdiscussed herein and may also perform financial advisory services, and/orhave lending or other credit relationships with those companies. This materialhas been approved for distribution in the United Kingdom, to professionalinvestors who fall within the exemptions contained within the UK FinancialServices Act 1986 - Investment Advertisement Exemptions Order 1988, byDeutsche Bank AG London, 6 Bishopsgate, London EC2P 2AT. Member ofthe LSE and regulated by SFA, Tel: (171) 545-4900, Fax: (171) 545-4988.Orders placed by UK persons directly with Deutsche Morgan Grenfell Inc. willnot be governed by all investor protection provisions of the UK FinancialServices Act 1986. Additional Information Available on Request.