The Arab Region's Unemployment Problem Revisited · 1 The Arab Region's Unemployment Problem...
67
Correspondence Dr. Riadh Ben Jelili, , The Arab Planning Institute, P.O. Box: 5834 Safat. 13059 Kuwait, Tel: (965) 24843130, Fax: (965) 24842935, E-mail: [email protected]. The Arab Region's Unemployment Problem Revisited Riadh Ben Jelili API/WPS 1015
Transcript of The Arab Region's Unemployment Problem Revisited · 1 The Arab Region's Unemployment Problem...

Correspondence
Dr. Riadh Ben Jelili, , The Arab Planning Institute, P.O. Box: 5834 Safat. 13059 Kuwait, Tel:
(965) 24843130, Fax: (965) 24842935, E-mail: [email protected].
The Arab Region's Unemployment
Problem Revisited
Riadh Ben Jelili
API/WPS 1015

1
The Arab Region's Unemployment Problem Revisited
Riadh BEN JELILI
Abstract
The Arab world is confronted with an increasing pressure coming from the supply side of the
labor market, generated principally by the unemployed persons looking for a job, the new
entrants on the labor market and the expected increase of the women labor force participation
rate. This pressure is compounded by structural considerations relating to the slow labor
productivity growth, low demand for skills, slow and erratic domestic investment growth, low
attractiveness of foreign direct investment and high dependency on the dynamics of the
international oil market as well as labor migration. This working paper examines the main trends
in the Arab labor market affecting both supply and demand of the labor force, and presents an
overall assessment of the active labor market programs adopted in some Arab countries. It also
presents some programs and policies aiming to enhance employment opportunities of Arab youth.
إعادة اننظش يف يشكهت انبطانت يف املنطقت انعشبيت
يهخص
هعاطهني نهخزو املشتفع انفعهي نانعم كنتيجت سىق جاب انعشض يف يتزايذة يظغىطاث انعشبيتيعظى انذول تىاجه يف ةننىةيشناسكت املننش ة يعننذل يف، ونهزيننادة املتىةعنت انعنم يف سننىقهنذالهني ادننذد ، ونو باخلصنى انشننبا عن انعننم
، واخنفناض انطهنب إتاجينت انعنم مننى بنط االعتبناساث اييكهينت، ي جانب ي تفاةى هزا انعغط، ومما يزيذ .عماناالعتاد انكنب األجنيب املباشش و نالستثاس اربيتاخنفاض اداالستثاس احملهي، و منىعذو اتظاو و، وبط عه املهاساث
نينت، انذو نسننىق اننننفط انقننىي احملشكنت عهن االجتاهنناث ىسةنت نذساسننت ختصننص هننز ان .هجننشة انيننذ انعايهنت فعننال عن كم ي انيت تؤثش عهو انعشبيت انعم يف سىاق انشئيسيت تقيينا كنا تقنذو انىسةنت انقنىي انعايهنت، انعشض وانطهنب عهن تعزينز فنش انعنم إىلوايادفنت باخلصنى بعنط اننذول انعشبينت اننيت اعتنذث يف اننشنطت سنىاق انعنم ربايج سشيعا نن
.شبا نه

2
1. Introduction
Over the last four decades, most Arab countries have embarked on economic reform programs
with the aim of reducing the budget deficits and achieving macroeconomic stability. As a result,
inflation rates have fallen significantly in the period from 1995 to 1998 compared with the period
from 1985 to 1994. However, the growth rate of GDP per capita in the 1990s, increased at an
average of no more than 1% per year, and the relatively low savings rates in the region were
accompanied by an insignificant increase of the average investment rate by 1.1% in the 1990’s. It
became apparent that none of the Arab non-oil economies had succeeded in utilizing the
economic boom of the oil decade 1973-1982 significantly to increase the number of real
employment opportunities through economic diversification, particularly through industrial and
agricultural development. Thus, for most of the Arab (oil and non-oil) economies, the oil boom
created some strong ripple effects.
The combination of economic recession and at least stagnation in the number of Arab workers in
the Arab oil countries during the 80s of the last century, in parallel to the continuing rapid growth
of the workforces, led to a sharp increase in unemployment in the Arab non-oil economies. Hence
after four decades of economic adjustment, Arab countries face two-digit unemployment rates
that are higher than all other regions of the world. Although it is difficult to compute precise
estimates of the unemployment rates in this region of the world, recent calculations put this rate
at between 10-15% in Algeria, Egypt, Jordan, Lebanon, Morocco, Syria and Tunisia and at 16-20
% in Libya, Sudan and Yemen, and more than 30% in Mauritania and Somalia1.
Youth unemployment reflects the level of economic activity in general as well as the trends in the
demand on labor in the labor market. In the Arab region, where at least 20 percent of the total
population is between 15 and 24 years, each year over 500,000 enter the labor market, the vast
majority are in the age cohort of 15-24. However, youth unemployment rates in this region are
much higher than adult unemployment rates, averaging 27.3 % in 2007. It accounts for 54.2% of
total unemployment (more than 70% of unemployment in Jordan, Mauritania, Yemen as well as
Egypt) and is considered as the highest in the world (ahead the poorest region in the world, Sub-
Saharan Africa which has the second highest rate of youth unemployment 21%)2.
Moreover, most unemployed are educated. The ratio of secondary and tertiary graduated in total
unemployed is over 51% in Tunisia, 44% in Morocco and 34% in Algeria3. These figures are a
source of concern not only for economic reasons, but also because of their socio-political
implications especially in autocratic societies. Indeed, experiencing unemployment at lower ages
might have not only a negative and permanent impact in hampering young people’s productive
potentials and future employment opportunities, but can also lead to marginalization, exclusion,
frustration, low self-esteem and, sometimes, to acts that impact negatively on society and destroy
the social structure.
1 Key indicators, aggregated tables of the eighth issue of Circular of labor statistics in the Arab countries, Arab
Labor Organization:
http://www.alolabor.org/nArabLabor/index.php?option=com_content&task=category§ionid=15&id=85&
Itemid=64 2 Arab Labor Organization estimates based on official Arab statistical sources (imgration-2010.xls):
http://www.alolabor.org/nArabLabor//index.php?option=content&task=view&id=472 3 KILM Sixth Edition, April 2010, ILO.

3
In a number of Arab countries the unemployment problem is also largely a problem of female
unemployment. The participation of women in the Arab labor market has undoubtedly increased
progressively over past decades, and indicators related to the involvement of women in the
economy continue to point upwards. However, these quantitative improvements mask persistent
qualitative disparities with regard to the status of women and men at work. Indeed, in the Arab
region there is an increasing tendency towards the feminization of unemployment. Female
unemployment rate of 16.5% was 5.9% points higher than the male rate of 10.6 % in 2003 in
Arab region. Unemployed women are mainly young new labor force entrants with primary and
secondary education, and laid off workers following restructuring and privatization particularly in
Jordan, Morocco, Tunisia and Egypt.
Over the years, several explanations have been proposed for poor performance of employment
and the consequent development of the high unemployment rates above all among educated
youth in the region.
One of the most influential is the skills mismatch hypothesis. In many Arab countries, there is a
widespread belief that workers’ skills and education are not adequate for the demands of jobs in
the current economy. Journalistic reports, popular, academic and policy recurrent debates on
school quality and education reform all suggest a mismatch between the skills workers possess
and what jobs require, what economists call an imbalance between the supply of and demand for
human capital or the skills mismatch hypothesis. Many believe that the problems will become
even more serious because the pace of change is accelerating and the workplace is becoming
increasingly high tech, service-oriented, and reorganized to involve greater employee
participation in the workplace.
According to this explanation, the education system in many Arab countries produces skills that
are not valued by employers, while raising the expectations of those who acquire them. As a
result, the unemployed are not interested by the existing vacancies, whereas the employers are
not willing to fill them with the available candidates. The mismatch is considered to be
particularly severe for those who are just coming out of school, and have no work experience.
The practical remedy to the unemployment problem, if the skills mismatch hypothesis is correct,
is to reform the education system and to supplement it with vocational training geared to the
needs of the labor market. Vocational training programs of this sort are supposed to make the
unemployed more employable.
A second explanation focuses on public sector employment and pay policies. In many countries,
public sector jobs are characterized by more stability, higher benefits, lower effort and more
prestige than their private sector counterparts. In almost all Arab countries, they are also
characterized by higher pay. Labor market entrants thus face an incentive to wait for job openings
in the public sector. Some of them would rather remain inactive than take the available jobs out
of the public sector.
Based on this second explanation, a credible reform of public sector recruitment and pay policies
would be the most effective way to reduce unemployment, because it would discourage the
queuing attitude.

4
Finally, a third explanation emphasizes the lack of sufficient employment opportunities in the
Arab private sector, characterized by lack of entrepreneurship culture and high degree of aversion
to risk. Private investment, generally focused on protected domestic markets, remains
compressed at levels below potential and is losing dynamism in the Arab region. It's both
insufficient and inefficient.
One of the main reasons for investment insufficiency is that savings are not properly channeled
by the financial sector (dominated by the banking system) to productive projects. The lack of
liquid investments in the Arab region has a direct negative effect on productive investment in the
region, as it makes it difficult for entrepreneurs to raise capital to finance their potentially good
ideas. The low levels of development of capital forces potential real investors into the hands of
the banking system, which has become immensely powerful, both economically and politically.
Despite their domination of the financial sector, banks are not efficient enough to play the critical
role that they must in the process of economic growth and development. As a result, the ratio of
private investment to public investment is unusually low; for the Arab region as a whole, the ratio
is close to 2 (slightly larger for non-oil economies). It remains well below the levels of OECD
economies (ratios close to 6) or that of the East Asian economies (ratios close to 5).
Another source of lack of employment generation in the Arab world is the region's reduced
overall economic efficiency. Total factor productivity levels for a sample of Arab countries
between 1975 and 2000 are very low. With the exception of some Arab countries, productivity
growth has been negative; that is, the efficiency of the economy has markedly deteriorated. This
situation may be attributed to the weak business environment of the Arab region (limited
openness of key services to competition, heightened business uncertainty stemming from
commercial risks, and imperfections in the regulatory framework and economic governance) and
to the low quality of human capital which hampers the profitability of investment.
Based on this third explanation, strengthening the investment climate in the Arab region, making
more room for private investment in services and network industries, which have been
traditionally under the government’s umbrella, and further improving access to finance, are key
to fostering private investment as a key precondition for accelerated growth and faster job
creation in the region.
While all three explanations are appealing, the evidence to support them in many Arab countries
is mostly outdated and often weak. I suspect we really do not know what is responsible for the
growing crisis of unemployment in Arab region. Knowledge is always slow to catch up to reality
especially because of scarcity of available Arab human capital and employment/workforce data.
This working paper is organized as follows. The next section examines the main trends in the
Arab labor market affecting both supply and demand of the labor force, and presents an overall
assessment of the active labor market programs adopted in some Arab countries. Section 3
presents some programs and policies aiming to enhance employment opportunities of Arab youth.
The final section, Section 3, provides the concluding remarks.

5
2. Main trends in the Arab labor markets
2.1. Labor supply considerations
2.1.1. Demographic changes and employment pressure
As in other developing areas, rapid population growth in the Arab countries during the second
half of the twentieth century was the outcome of rising natural increase rates, which climbed
from approximately 1.8 per cent in the 1930s and 1940s to a peak of 3 per cent in the early 1980s.
Since then, the natural increase rates in virtually all of the Arab countries (with the exception of
Mauritania, Occupied Palestinian Territory and Yemen) have decreased considerably, due to a
steady decline in fertility rates. By 2000-2005, the average natural increase rate in the Arab
region was 2.2 per cent and the average total fertility rate was 3.8 per cent. However, despite the
substantial fertility reduction, the natural increase rate of the Arab countries is still the highest
worldwide (average rate 2.65), even compared to less developed regions (average rate 2.9).
<Insert TABLE 1: Population and Fertility Rate in Arab countries (thousands)>
The prolonged high natural increase rates in the Arab countries have led to the creation of a wide-
based age pyramid. By 2005, the percentage of 15 years of age within the total Arab population
was 35.5 per cent (very high compared to less developed regions and the World where this age
cohort represents 21 per cent and 19 per cent respectively). Thus, despite the fertility reduction
during the past 20 years, in terms of absolute numbers the population growth in the Arab region
during the mid-2000s was similar to that of the mid-1980s, simply as a function of the sharp
increase in the number of couples in the reproductive ages. This phenomenon, known as the
population momentum, refers to the fact that the future population growth will be influenced by
its present age structure. Thus, a large population increase will persist in all the Arab countries
for at least several more decades, reflecting the high natural increase rates during the past two
generations.
<Insert TABLE 2: Percentage aged less than 15>
The implications of the wide-based age structure for the workforce are very important. In the
short term, the direct result of the high percentage of the young population has been low crude
economic activity rates (around 30-40 per cent in average by 1980). By comparison, the crude
economic activity rates in the European countries were much higher (around 50-60 per cent by
1980), due both to higher percentages of the working-age population and much higher female
labor force participation rates.
Thus, while the bread-winners/dependants ratio is 1 for 2 in the developed countries, the same
ratio is 1 for 4 in the Arab countries, leading to what has been called the low income trap.
<Insert TABLE 3 : Adult (15+) economic activity rate >
The long-term implications for the future size of the Arab workforces are no less significant. Due
to the wide-based age pyramid, the number of work opportunities needed in the Arab countries
will continue to grow rapidly, at least in the coming three decades, until the number of those

6
entering the workforce, namely, those in the 20–24 age group, will be equal to those leaving the
workforce at the age of 60–65.
In Egypt, for example, in 2000, the 0–4 age group numbered 8.2 millions, while the 40–44 age
group amounted to only 3.74 millions. This means that the number of those entering the
workforce during the period of 2020–24 will be 2.2 times higher than the number of those retiring
in the same years. In the case of Saudi Arabia, approximately 5.5 million citizens will be entering
the labor force during the second decade of the twenty-first century, which is equal to 37 per cent
of the current Saudi national labor force (14.7 millions in 2005).
Moreover, during the past two decades, as a result of substantial growth in the female labor force
participation rates, the labor force growth rates were higher than the natural increase rates. Since
this process is expected to continue, it is reasonable to predict an even higher increase in
employment demands in the foreseeable future. With an average growth rate of more than 3
percent annually, Arab countries’ labor force is growing at a higher rate than any other region of
the world. In spite of the global fall in birth rates, the high population growth rates of the past are
continuing to push new entrants into the job market more quickly than the ability to generate
jobs.
<Insert TABLE 4: Labor Force and Population Growth rates >
The wide-based age pyramid also hampers efforts to enlarge investments in education in per
capita terms, due to the steady increase in the size of the school-age populations. This rising
demand forces the Arab governments to increase their educational budgets in line with the
increase in the number of students only to maintain the current educational level. Thus, the
challenge of keeping pace with the advance of technology is made even more difficult to
overcome.
At the same time, in many Arab countries, governments have been slow to understand and
respond to the implications of a changing demographic picture. The ratio of workers to
dependents in the region has long been the highest in the world, where 30% of the population
worked to support the rest in 1990, compared to a world average of 48%. This situation is
changing fast, since declining fertility rates mean that more people will enter the economically
active population every year than will be born. This demographic transition over the next 20
years will open a significant window of economic opportunity for Arab countries. As happened in
East Asia during the past two decades, a proportionately bigger and growing work force could
potentially add 2% a year to economic growth rates, while improving rates of savings and
investment (Williamson and Yousef 1998, Yousef 2004).
<Insert TABLE 5: Dependency Ratios >

7
However, the mechanics of the demographic gift implicitly assume well-functioning labor and
capital markets4. In the absence of dynamic labor markets and steady output growth in the 1990s,
the expanding working-age population contributed to the twin problems of unemployment and
stagnant real wages. This was especially true for first-time job seekers whose unemployment rate
was twice that of the labor force in a number of Arab countries (Al-Qudsi, Assaad and Radwan
1995).
2.1.2. Women labor force participation and unemployment
Women‟s economic participation rate, their proportion in the labor force, and their employment
pattern varies among the sub-regions of the Arab world. Interestingly enough, women‟s
economic participation and labor force share are highest in the least developed economies of the
region, such as the Djibouti, Comoros, Mauritania and Somalia, while they are the lowest in some
of the more developed Gulf economies which have the highest female educational records. The
participation record of women in the diversified economies of Morocco, Egypt, Lebanon, Syria
and Tunisia tend to exhibit a rate close to the regional average.
The proportion of women in the adult labor force has risen virtually in all Arab countries over the
past two decades. During the 1990s, female labor force participation rates in Arab region
increased by an average of 1.6 per cent per year, faster than any other region in the world.
Between 1980 and 2005, the participation of women in the labor force approximately doubled in
Algeria and Bahrain, more than doubled in Kuwait, Libya and Saudi Arabia, while it almost
tripled in the United Arab Emirates.
Increases in female labor force participation cut across all age groups but are most evident among
young women. The largest increases are in the labor force participation rates of 25-34 age cohort
particularly in Libya, Algeria, Kuwait, Bahrain and Tunisia.
<Insert TABLE 6: Proportion of Women in the Labor Force>
Despite the growing proportion of women in the labor force, their economic activity rate, namely,
the percentage of the population that is economically active is remarkably lower than that of men
in the Arab region particularly for the age cohort 35-54, except for the least developed
economies. Excluding these countries, in 1980, the economic activity rate of women ranged
between a minimum of 8.7 per cent in Saudia Arabia, and a maximum of 31.5 per cent in Sudan,
while the economic activity rate of men varied between 63.4 per cent in West bank and Gaza and
94.5 per cent in the United Arab Emirates. Furthermore, throughout the Arab region, the gender
gap in labor markets, defined as the differential between the activity rate of men and women, is
remarkably wide. In 2005, the gap is narrowest in Kuwait and widest in Saudi Arabia, at 36 and
60.7 per cent respectively.
4 Recent cross-country studies indicate that national savings/investment ratios are strongly influenced by
demographic transitions: high dependency rates depress both savings and investment, while a rise in the working age population induces the opposite (Higgins 1998; Lind and Malmberg 1999). Thus, the ability to absorb an expanding
labor force, in the presence of functioning credit markets, would support a faster rate of capital accumulation and
wage growth.

8
<Insert TABLE 7: Women Economic Activity Rate>
<Insert TABLE 8: Gender Gap in Economic Activity>
In the least developed economies, women‟s relatively high participation rates are generally
explained by their heavy involvement in agriculture and in informal economic activity. As such,
while their proportion in the labor force is well above the regional average, their employment
record in the formal sectors of the economy is substantially low. On the other hand, in countries
like Oman, Qatar, Saudi Arabia, and the United Arab Emirates, while women enjoy reasonably
good educational levels, women‟s share in the labor force is relatively low. This may be
explained by the presence of a cultural and value system which places considerable restrictions
on the work of women in certain domains, particularly in the value added sectors of industry.
As noted above, there exist substantial regional variations in female labor force participation rates
in Arab region (excepting least developed Arab countries mentioned above). Table 7 reveals this
fact and female economic activity rate in 2005 ranges from 10.3 per cent in West Bank and Gaza
Strip to 49 per cent in Kuwait. Such variations illustrate the persistent gaps in literacy rates in
general and educational attainment in particular, for women, especially in rural areas.
Furthermore, because of overall economic shrinking in many Arab countries, women’s chances
of entering the labor market are greatly reduced compared to those of men, with many educated
women staying out of the labor market due to lack of enough new job opportunities that would
absorb both genders. Still, in situations of job scarcity, men in the Arab world are advantaged
over women. On the other hand, women who succeed in entering the labor force often do not
reach higher administrative and managerial positions, remaining largely within the government
civil service in educational and social related jobs.
The large increase in female labor force participation rates during the last two decades may have
contributed to the high rates of unemployment, especially among young females. Indeed, data on
selected Arab countries indicates that unemployment rates among females are the highest in the
world, both in absolute terms and compared to unemployment rates for males. While the regional
mean for women’s unemployment rate stands at 15.5%, compared to 9.9% for men, considerable
regional variations exist. In Egypt for instance, women’s unemployment rate is roughly fourfold
that of men, standing at 23.9% and 6.3%, respectively. The highest female unemployment rates
are recorded for Syria, standing at 24.1%, compared to 8.3% male unemployment, while Kuwait
records the lowest female unemployment rate, listed at 1.7%.
A common trend in the pattern of unemployment is differentiation by gender. In Egypt, Jordan,
Qatar, Saudi Arabia, Syria and Tunisia, women's unemployment rates not only are considerably
higher than men's but they are disproportionately high given women's far smaller share in the
labor force.
The international empirical evidence on the link between increasing female labor force
participation rates and gender differences in unemployment is very limited. Other countries and
regions, at various times, have experienced sizable and sustained gender differences in
unemployment rates. Azmat et al. (2004) find that, for a panel of OECD countries, gender gaps in
unemployment rates are mostly concentrated among Mediterranean countries, but reasons for this
gap remain largely unexplained. The researchers suggest that gender-based discrimination may

9
explain part of this gap. Seguino (2002) finds that aggregate economic conditions and job
segregation explain part of the gender differences in unemployment rates in Caribbean countries.
High unemployment rates might encourage females to look for work in order to help support their
families (the added worker effect), resulting in higher female unemployment rates. However,
most of the differences again remain unexplained, leading Seguino to suggest possible
discrimination.
<Insert TABLE 9: Unemployment rate>
In the Arab countries, it is tempting to attribute part of the large gender differences in
unemployment rates to increases in relative female labor force participation. To the extent that
males and females tend to work in different occupations, higher rates of female entry into the
labor force may lead to higher female unemployment rates that can persist over long periods of
time, but which are also transitory in nature. Once female labor force participation rates reach a
new steady state, male and female unemployment rates will converge (Myatt and Murrell, 1990).
In this case, no policy intervention is required. A preliminary analysis, using a cross-section of
MENA countries, finds a positive correlation of 0.32 between changes in labor force participation
rates between 1990 and 2000 and gender differences in unemployment rates around the year
2000. Female unemployment in these countries appears to be part of an overall problem of labor
force insertion.
Social norms might also be an important factor in explaining gender differences in
unemployment rates. Social norms may limit the mobility of women (by requiring them to obtain
work close to their homes or limiting their ability to drive). Social norms may limit international
mobility, by discouraging females in labor-abundant countries from seeking employment
elsewhere, while encouraging males. This would relieve domestic labor supply pressures in male-
dominated occupations, but not in female-dominated occupations. Social norms may limit
females‟ ability to search for appropriate jobs, by dictating what constitutes acceptable work for
females and males.
2.1.3. Urbanization and internal migration
Populations in the Arab region tend to be unequally distributed on the land, both among Arab
countries and within each country. While all six GCC countries together have a population of
about 32 million (with Saudi Arabia alone having about 22 million inhabitants), Egypt alone has
a population of about 69 million. The density per square kilometre varies sharply from three
persons in Libya to as many as 1,000 in Bahrain. One reason for this is that a very large
percentage of Arab region is austere desert. Thus, in Egypt the non-desert areas of the Nile
Valley and the Delta have a density of over 1,200 inhabitants per square kilometre, while the
desert areas (over 95% of total territory) have a density of one.
This characteristic of the region explains why, despite the vastness of territory, many villages and
cities appear to be overcrowded. This pattern also implies mounting pressures on the limited non-
desert areas in the region. About 70% of the poor in the Arab region live in rural areas, even
though rural areas support less than 43% of the total population. Together with several political
and socio-economic factors, this situation has triggered a stream of rural-urban migration in all

10
Arab countries, leading to rapid urbanization and, in turn, to the transformation of urban spaces
into increasingly significant clusters of communities originating from the countryside.
In 1960, only 30 per cent of the Arab population lived in cities. By 2005, urban areas were
estimated to contain over 80 per cent of the populations in 8 Arab counties and more than 50 per
cent of the population in all Arab countries, expect for Egypt (42.3 percent), Somalia (35.9 per
cent) and Yemen (26.3 per cent), which remain predominantly rural.
<Insert TABLE 10: Urbanization rate>
The inflow of rural migrants in Arab region has been much more rapid than the pace at which
they are absorbed into the market. As a result, many cities in the region are populated with
unemployed and underemployed people.
One of the major consequences of the rapid urbanization process has been indeed the rapidly
increasing supply of job seekers in both the modern-formal and traditional-informal sectors of the
urban economy. In most Arab countries, the supply of workers far exceeds the demand, the result
being extremely high rates of unemployment and underemployment in urban areas. Accordingly,
migration can no longer be casually viewed by economists as a beneficent process necessary to
solve problems of growing urban labor demand. On the contrary, migration today remains a
major factor contributing to the phenomenon of urban surplus labor; a force that continues to
exacerbate already serious urban unemployment problems caused by the growing economic and
structural imbalances between urban and rural areas. Accordingly, the new orthodoxy, due
mainly to Todaro (1969) and Harris-Todaro (1970), considers rural-urban migration as a
symptom of and a countributing factor to underdevelopment. Indeed, assuming potential migrants
respond to the urban employment probability and treating rural-urban migration primarily as an
economic phenomenon, the authors then demonstrates that, in certain parametric ranges, an
increase in urban employment may actually result in higher levels of urban unemployment and
even reduced national product (the so-called Todaro Paradox).
The paradox is due to the assumptions that in choosing between labor markets, risk-neutral agents
consider expected wages, that the probability of obtaining urban employment is approximated by
the ratio of urban jobs to the urban labor force, and that the urban wage rate is considerably and
consistently higher than the rural wage rate. Under these assumptions, inter-labor market (rural-
urban) equilibrium mandates urban unemployment. This unemployment ensures that the expected
urban wage is equal to the rural wage (which is assumed constant throughout). The repercussion
of this simple set of assumptions is that contrary to received wisdom, once the migration response
is factored in, several policies aimed at reducing urban unemployment will raise urban
unemployment rather than reduce it.
Rural-urban migration is linked to changes in the sectoral distribution of employment. Since the
1970s, the share of employment in agriculture declined rapidly until the mid 1980s and more
slowly since then. However, manufacturing and other industries have not increased
proportionally to the decline of the agricultural sector. The development of urban areas is still
closely tied to the rural economy through the exchange of labor, goods, services, information and
technology. Remittances from urban areas to rural areas are an important source of income for

11
rural populations in the Arab region as elsewhere. In Morocco, for example, urban remittances
are as high as 30% of the income of the poor (World Bank, 2000).
Statistics and empirical studies on internal migration in Arab Countries are quite rare. Below, we
provide brief review of previous empirical studies devoted to the topic of internal migration in
some Arab countries:
Syria: In Syria, in contrast to other Middle Eastern and North African countries which
were also witness to a large rural–urban migration, the major proportion of the migration
movement has occurred within the borders of the provinces themselves, rather than from
the rural regions to the capital.
One of the most comprehensive analytic study of internal migration in Syria is the
completed Strategic National Plan for internal Migration in the Syrian Arab Republic
(Zakaria and El Sibai, 1991), sponsored by the State Planning Commission in cooperation
with UNFPA and ILO. It reports the results of a large internal migration household survey
carried out in 1987. The survey is based on a sample of 5,000 households in three cities
(Damascus, Aleppo and Homs) and a sample of about 3,000 households selected
randomly from the rural sector of the country as a whole. One of the main conclusions of
the study is that unemployment in the countryside is an important determinant of citywide
migration and migrants in the city are involved mainly in service jobs, marginal work, and
the public sector, and hence migration is a means of transplanting surplus laborers of the
cities. Furthermore, villagers have a desire to migrate for a better income jobs in urban
areas, owing to the disparities in wage levels and job opportunities between the city and
the countryside. This is reinforced by the higher educational attainment of the rural youth
population.
In 2000, the Syria Internal Migration Survey project (SIMS in short) has been conducted
jointly between the University of Damascus, the Syrian central Bureau of Statistics and
Fafo institute for Applied International Studies. Interviews with more than 20,000
families were successfully completed. The sample is based on a multi-stage stratified
design, using a sampling frame constructed from the 1994 census of population and
household listings updated of all the selected clusters. Several conclusions can be drawn
from this project. First, a disproportionally large number of migrants are of rural origin.
Second, the dominant form of migration in Syria, with respect to direction, seems to be
from rural to urban areas. Third, rural-urban migration is often attributed to an urban bias
in development planning. However, the evidence is mixed and there is some evidence
pointing to more migration as a result of enterprise development in the countryside. Forth,
for male migrants work related motives dominate while for female migrants marriage
related reasons are more important.
Egypt: In Egypt, the acceleration of the urbanization process began in the late 1930s and
early 1940s. Internal migration is responsible for the redistribution of nearly 25 percent of
Egypt's population, and for the rapid growth of Egyptian cities, especially Cairo and
Alexandria.

12
Table 11 gives an overview of internal migration for urban and rural areas by rural/urban
origin or destination in Egypt for the last three censuses (1976, 1986, and 1996). Some
key points can be drawn out of this Table. The first feature is the remarkable constancy of
the total migration recorded in each of the three censuses. On the other hand, the
disaggregation of migration types shows that these disaggregated flows are indeed
changing. Hence total migration remains curiously constant, whilst the individual
components of that mobility are markedly shifting. Two noteworthy trends can be
highlighted: the sharp fall of rural to urban migration between 1976 (25 percent) and 1986
(13 percent), and the equally sharp rise of urban to rural migration between 1986 (10
percent) and 1996 (23 percent).
<Insert TABLE 11: Urban/rural migration by type of movement, Egypt, 1976–1996>
These trends, however, do not represent the full extent of rural-urban migration in Egypt.
First, long-distance rural–urban migration to Cairo from Upper Egypt is a long-standing
phenomenon in Egypt, traceable to the first census around a hundred years ago. Second,
much of the increase in urban–rural migration between 1986 and 1996 is probably
explained by return migration of retired rural–urban migrant workers back to their home
villages, these rural-origin migrants having migrated to the cities in earlier decades. Third,
we can strongly suspect that the bulk of rural laborers to Cairo are not officially registered
by the census as rural–urban migrants because of their continuing de jure residence in
rural areas. Yet another factor is the fact that a significant percent of migrants from rural
to urban areas (especially to Cairo) tend to hide their rural origin and to claim that they are
not migrants from rural areas. And finally some rural–urban migrants may escape census
counts because of their “hidden” residence as squatters with no fixed abode.
The reasons of rural–urban migration in Egypt are almost the same as in Syria and most
other developing countries. Push factors have constituted the dominant reasons, while pull
factors function only as secondary reasons. Push factors include scarcity of cultivated
land, low level and instability of income in the rural areas, concentration of the rural
economy almost exclusively on agriculture, and the gap in health care and educational
services between the urban centers and the rural areas. The pull factors are mainly the
desire for acquisition of higher education, industrial development in urban centers, and the
generally more attractive urban work and social facilities. One of the strongest factors in
Egyptian internal migration is the search for better work opportunities than those existing
at points of origin.
Morocco: The degree of urbanization of Morocco in the twentieth century is
unexceptional by Third World and North African standards. Both Algeria and Tunisia, for
example, have a somewhat higher rate of urbanization. Urbanization and partial de-
agrarization are general processes which also occur within rural Morocco, in which so-
called rural populations increasingly earn additional income outside the traditional
agricultural sector. Previously, such livelihood diversification was achieved primarily
through long-distance internal migration. However, the development of numerous
centrally located villages into small or medium-sized urban centers is increasingly
offering non-agricultural employment within the “rural” provinces themselves (Berriane
1996; De Haas 2003).

13
This process of micro- and meso-urbanization, which has presumably been encouraged by
decentralization policies and significant improvements in road and electricity
infrastructure, over the interior of Morocco, has affected patterns of internal migration. An
increasing number of internal migrants do not settle in the big cities, but in rapidly
growing smaller and medium-sized towns near to or within the rural provinces
themselves.
The second major source of Morocco's urban growth, after the high natural population
increase, is rural migration which generally accounts for one third of the overall increase
of urban population. For several decades, migration to the cities absorbed around two-
thirds of the annual natural increase in rural areas. Rural poverty has always tended to be
the main driving force behind rural–urban migration in Morocco. In the early 1960s, about
25 percent of the families in rural areas were landless, 50 percent had less than 3 hectares,
and only 25 percent of rural families had more than 3 hectares. If rural poverty has been
the main push factor, urban amenities such as education, health, and cultural services have
been the main pull factors in the Moroccan case.
More recent trends in rural–urban migration in Morocco can be investigated based on the
1991 Survey on Internal Migration reported in the 1995 African Population Newsletter.
Morocco has experienced a recent rise in urban population from 29.3 percent of the total
population in the early 1960s to 48.4 percent three decades later. Rural–urban migration
averages 3.6 percent annually and has played a key role over the past 30 years in
population redistribution. In the survey of 1991, 33 percent of migrants reported the main
reason for migration as the search for better jobs or better wages, 31 percent indicated
migration was in order to join a family member or spouse, and 11 percent migrated for
educational reasons. Some 87.7 percent of migrants were under 30 years old at time of
departure; 39.5 percent were under 15 years, 25 percent were 15–19 years, and 23.2
percent were 20–29 years old.
The 1991 survey revealed that men tended to migrate for economic reasons, whereas
women migrated primarily for family reasons. Most men were unmarried at the time of
migration, while most women were already married. Four-fifths of migrating women did
not have a formal education. About half of the men and the same share of the women
were classed as unskilled. Only 7 percent sent remittances to relatives in rural areas,
although 70 percent visited at least once a year.
One important outcome of rural-urban migration has been the growth of the so-called informal
sector in urban areas. Although associated with hidden unemployment, urban under-employment
and poverty, informal activities have become a means for many countries to cope with population
growth, rural-urban migration, economic crises and unemployment. In some countries of the
Arab region, the informal sector is estimated to contribute anywhere between one-quarter and
two-thirds of non-agricultural employment, with Algeria (1985) at 25.4 percent, Tunisia (1989) at
39.3 percent, Morocco (1982) at 56.9 percent, Egypt (1986) at 65.3 percent, and Mauritania
(1988) at 75.3 percent.
14
2.1.4. International migration
The South Mediterranean and Middle East constitute probably the most remarkable geographical
region of the world with respect to labor migration movements. Of the top ten countries recorded
in the 2004 Human Development Report, the first four are Middle Eastern, with another two
ranked as sixth and ninth. Table 12 shows UN data for 2000: the highest ratio of migrants to total
population not in the Arab region is in Singapore, with 34% (UNDP, 2004). In fact, the UN data
seem to be underestimates, as most national data indicate even higher levels of migrant presence.
<Insert TABLE 12: Estimated migrant stocks circa 2000 in the Arab region>
The particularities of the region are not confined, however, to these simple stocks of temporary
labor migrants in the Gulf countries. To this we should add the recent emigration histories of the
Maghreb and Mashrek countries, along with their demographic pressures for continued
emigration, the role of the latter as transit countries for illegal migrants from other regions, and
the role of GCC states as a massive source of both recorded and unrecorded remittances to Asia
and elsewhere.
It is possible to discern several migration systems operating in the region, although these are in
flux and increasingly overlapping and becoming more complex. There are three broad systems,
comprised of the GCC, Maghreb and Mashrek states.
The GCC countries
The main population flows within the Arab region have been associated with labor migration
from non-oil producing Mashreq countries, especially Egypt and Yemen, but also Jordan and
Palestine and to a lesser degree Syria and Iraq, to the oil-producing countries within the GCC:
Saudi Arabia, Kuwait, Bahrain, Oman, Qatar and the United Arab Emirates. Although official
data on these flows is either unavailable or not sufficiently accurate and reliable, most analysts
agree that this type of regional migration peaked in the mid-80s. Employment estimates of Arab
labor migrants to the Gulf during this period range between a low of 1.54 million to a high of
3.45 million.
<Insert TABLE 13: Estimated Percentage of nationals and expatriates in the population of GCC
countries, 1995-2000>
Long before the Gulf crisis in 1990 and the subsequent war in 1991, GCC states started to recruit
workers from Asia. The economic argument posited for this change in employment patterns was
that Asian workers worked for less money and were more productive. Yet, in order to understand
the recruitment policy drives of the GCC states in this period, non-economic considerations also
need to be given weight. Moreover, the sheer presence and dependence on foreign labor was felt
to pose a threat and measures were taken to make this migration phenomenon temporary rather
than permanent. As Arab migrants had often tried to bring over their families, Asian workers
appeared to be the safer choice in terms of both their politics and their status as temporary
migrants.
The preference for non-Arab foreign nationals became even more pertinent in the aftermath of
the invasion of Kuwait and Yemen, Jordan and Palestine‟s support for Iraq. About 1.5 million

15
people were displaced in the wake of the Gulf crisis in 1990/1991: about 800,000 Yemenis were
expelled from Saudi Arabia, alongside 200,000 Jordanians and 350,000 Palestinians who were
mainly expelled from Kuwait. No in-depth research has been carried out to study the impact of
this situation on the economies and poverty levels of the sending countries. But obviously the
lack of remittances, as well as pressures on local labor markets have been a huge burden,
especially in Yemen, Egypt and Jordan where unemployment and recession rose significantly.
In the mid 1990s, Asian labor migrants from India, Pakistan, Sri Lanka, Indonesia, Philippines,
Thailand, Korea and Bangladesh outnumbered Arab migrants by about one million (Girgis,
2002). However, a more in-depth study of Kuwait from 1989-2000 reveals that despite a decrease
in numbers, Arab migrant workers have dominated the upper echelons of skill categories
(technical, managerial and clerical), while Asian workers have dominated services, agriculture
and production-related jobs. Jobs in sales have also been dominated by Arab workers. It is
interesting to note that the overall foreign Arab population outnumbered the Asian population as
many Arab workers tend to migrate with their families while Asian workers (both men and
women) migrate on their own. This is partly related to the conditions (salaries, housing etc)
related to high and low skilled jobs as well as the particular migration culture of Arab and Asian
workers.
Since the 1990s, there has been a new trend influencing recruitment strategies and, potentially,
future populations flows. As a result of persistently weak oil prices, financial contributions,
depleted foreign assets and loss due to two Gulf wars (1980-1988, 1991), the GCC countries have
started to experience recessions, and for the first time have recorded unemployment figures for
nationals. In Saudi-Arabia, for example, the Manpower Council estimated the unemployment rate
among Saudi nationals at 14% in 2000 and at 15 % in 2001. In addition to an economic crisis,
GCC countries face a large pool of young first time job seekers, who benefited from the
expanded and improved education system. About half a million GCC nationals are unemployed
in a region that employs 7.5 million expatriate workers. All GCC states have introduced policies
to reduce rising unemployment among their nationals, and to maintain or increase birth rates in
order to curtail their dependence on foreign labor.
Whatever obstacles exist in the present time to speed up the process of the nationalization of the
labor force, there is no doubt that, in the long run, national workers will replace a large number of
expatriate workers. As GCC nationals will seek well paid skilled jobs, this trend will affect Arab
migrants much more than Asian migrants who are predominately found in low skilled jobs.
Girgis (2002) predicts slow Arab out-migration over the next decades. According to his
estimates, the current out-migration in Arab countries will amount to a loss of remittances worth
$1.55 billion over the period of 2003-2007 alone. In addition, there will be an increase in return
migration which, in turn, will lead to greater pressures on local labor markets and may lead to
greater unemployment rates.
The Maghreb
Since 1968, Morocco has had a consistent policy of maximizing emigration in order to manage
unemployment levels, acquire hard currency through remittances, and raise skill levels through
returning migrants. Tunisia and Algeria, initially followed a similar policy to that of Morocco;
however, both encouraged their emigrants to return in the 1970s. Regardless of these differences

16
in policy, the outcome by 1999 was some 700 thousands each of Moroccans and Algerians
residing in France, plus over 200 thousands Tunisians (Fargues, 2004). Their total presence in
other European countries is of the same order, although the total of Moroccans abroad is
estimated at 2,5 million or nearly 10% of the current population. IOM gives the expatriate
Tunisian population at 690 thousands, of which 590 thousands are in Europe and 90 thousands in
other Maghreb or Arab states (IOM, 2004). Remittances are also the most significant for
Morocco, which is the fourth largest recipient in the world with US$3,3 billion in 2001, at 9,7%
of GDP (Gallina, 2004).
Over the last two decades, the emigration of highly skilled professionals from Morocco and
Algeria has become of great concern. There are no available statistics on the large numbers who
have left for the USA, Canada, Germany and France: however, in just one scientific institution in
France there are over 1 600 researchers from the Maghreb, of which nearly half are Moroccan
(Mghari, 2004). The reasons for the exodus of professionals are not only pay-related, but also
reflect general labor market and social conditions, such as lack of career opportunity and job
satisfaction. However, the result of the brain drain is that enterprises are starved of skilled and
motivated staff, and foreign experts are needed to fill the gaps: the costs of such international
expertise are as much as 60-90% of development aid or investment costs (Mghari, 2004).
The Mashrek
The Mashrek countries of Egypt, Jordan, Palestine, Lebanon, Syria and Yemen have a migratory
history between them dating back to the end of World War I and the collapse of the Ottoman
Empire (al Khouri, 2004). However, the important period of emigration to the oil-rich GCC states
began in the 1970s. Indeed, it was not until 1971 that Egypt openly permitted emigration of its
nationals, and then rapidly embarked on a policy of linking emigration policy with the country‟s
economic development. Although with different national histories and specificities, all of the
Mashrek has had extensive involvement with emigration over the last three decades. Most of this
has been temporary labor migration to other Mashrek countries, and primarily to GCC countries.
The common characteristics can be summarized as the following:
Mass temporary and permanent emigration since the 1970s.
Economic development strategies have been linked with diaspora and remittances.
Forcible return of migrants, from the GCC states during the first Gulf crisis, has created
serious economic problems.
Demographic structure now requires even more job creation for young people.
Brain drain is significant for all Mashrek countries.
Brain drain is defined in the literature as emigration of more than 10% of the tertiary-educated
population of a particular country (Richard, 2003).The traditional view sees international
mobility of skilled workers as a zero-sum game between the nations. Since education is
considered as a major determinant of long-term economic growth, (the large-scale) departure of
well-educated workers from developing countries is detrimental to source countries and loss to
the state in terms of its investment in education. Furthermore, as skilled labor is instrumental in

17
attracting FDI and foster R&D expenditures, the mobility of human capital is contributing to the
concentration of economic activities in specific locations at the expense of origin regions.
The loss of skilled people imposes different kinds of cost the most obvious one is the cost of
education itself which in most cases has been subsidized by the state. Losses of skilled
professionals may in some cases be a net developmental loss when dire economic
mismanagement and poor working conditions and low level of reward conspire with
opportunities abroad lead to endanger sectors of an economy. According to this view, therefore,
the negative development impact of such poor countries must be mitigated by support for
education and training in the countries particularly in fields where needed skills are in short
supply.
Recently however, this traditional view is challenged by new counter arguments which ask
whether the detrimental effects stressed in the early literature may be offset by potentially
beneficial effects emphasised in more recent contributions (remittances, return migration,
creation of trade and business networks, and possible incentive effects of migration prospects on
human capital formation at home). It is stressed that these beneficial effects or “positive
externalities” on source countries should be taken into account in economic calculations; and in
spite of the problems posed, a realistic response requires abandoning the brain drain approach of
trying to keep the highly skilled at home.
In the brain drain debate, one of the key figures used is the ratio of the educated migrants within
the migrant population. One striking fact is that the tertiary educated migrants are a small portion
of the overall migrant population, especially in large migrant sending countries such as Algeria,
Morocco and Tunisia. For example, between 10-15% of migrants have tertiary education in
Tunisia, Morocco and Algeria as of year 2000. On the other hand, more than 50% of migrants to
OECD countries from other countries, including Egypt, Iraq, Lebanon and Jordan have tertiary
education.
The data available reveal that the migrants from almost every developing country are more
educated than the native population. There are many reasons for this selection effect – the
migration policies of the receiving countries are biased towards educated migrants, they face
fewer constraints in terms of financial and social costs when they migrate, the returns to
migration are higher etc. The selection effect is stronger for some countries compared to others.
For example, among the countries in the region, Turkish migrants are the most similar to native
population in terms of education profile – around 10% of natives and migrants have tertiary
education. Similarly, the bias is relatively small for North African countries such as Morocco and
Tunisia. On the other hand, the bias is largest for the GCC countries and Egypt – over 60% of
migrants have tertiary education as opposed to 15% of the native population.
The most important question in the brain drain debate is what per cent of the educated population
migrate. It is possible that educated migrants form a large portion of the migrant population.
However, if the underlying native population is also highly educated, then the economic impact
of migration is not likely to be negative on the sending country. For example, this is the case in
India and China. Even though majority of Indian migrants, especially to the US, have college
degrees, they still present a small portion of the educated labor force in India.

18
2.1.5. Educational systems and labor supply: The skills mismatch
Education has been recognized by all countries in the region as the cornerstone of sustainable
social and economic development. However, there has been little progress in reforming and
restructuring education to produce an educated, creative, flexible workforce, characterized by
technological competencies and marketable skills, able to adapt to fast-changing technologies,
economies, and innovations.
Since the 1960s, the countries of the region have made considerable investments in education. In
1997 their spending on education was estimated, on average, at 5.4% of their GNP. This
commitment has paid off, for school life expectancy in the region grew between 1960 and 1985
by 2.5 years on average, and many of the region‟s countries are now close to the objective of
universal primary education. However, in the absence of a comprehensive educational policy, this
increased spending has not resulted in improvements in quality or efficiency in the educational
system5.
In an age of knowledge intensity, poor knowledge acquisition, let alone its production, is a
serious shortfall. A telling indicator of the poor level of educational attainment in the Arab
countries is the persistence of illiteracy rates that are higher, and educational enrollment rates that
are lower, than those of dynamic less developed countries in East Asia and Latin America.
Indeed, while education has made headway among the younger generations, illiteracy has proved
difficult to eradicate and the overall educational achievement among adults in Arab countries
remains low on average. Arab countries have nevertheless made tangible progress in improving
literacy: the estimated rate of illiteracy among adults dropped from approximately 60 per cent in
1980 to around 43 per cent in the mid-1990s. However, illiteracy rates in the Arab world are still
higher than the international average and are even higher than the average in developing
countries. Moreover, the number of illiterate people is still increasing, to the extent that Arab
countries embark upon the twenty-first century burdened by over 60 million illiterate adults, the
majority of whom are women with the largest concentration being in rural areas.
The mid-1990s witnessed higher total enrollment rates for the secondary and tertiary levels in the
Arab countries (54 per cent and 13 per cent, respectively) compared to developing countries (49
per cent and 9 per cent, respectively). However, these percentages are lower by far than those
prevailing in the industrialized countries for that period (106 percent6 and 60 percent,
respectively). Accordingly, Arab countries are not expected to catch up with the industrialized
countries‟ mid-1990s enrollment levels for all three levels of education before 2030.
Educational output and student achievement have remained below acceptable standards.
Textbooks and teaching methods are, for the most part, outdated and do not take into
consideration the technology-dependent world students will face upon graduation. This indicates
5 It is important to note here that not all countries in the region suffer the same ills in education. While there are
general deficiencies in different areas to greater or larger extents, there are also models of excellence and success stories in some countries, and pockets of weakness and strength within the same country. Both at the general and
higher education levels there are a number of distinguished and reputable schools and institutions that can be used as
models. What is lacking is a system that governs education and sets measurable standards of performance. 6
A gross enrollment rate may exceed 100 per cent, if there are students enrolled in a level who are younger or older
than the age span for that level

19
a lack of planning and the absence of clear long-term goals. Additionally, in most countries,
education spending has been ad hoc and inconsistent varying greatly from one year to the next
and from one area to another. The expenditures made have not been used wisely and the
investment has failed to pay off.
Moreover, there are indications that rising expenditure on education in the Arab world began to
taper off after 1985. Education spending increased, in current prices, from $18 billion in 1980 to
$28 billion in 1995. However, the rate of increase since 1985 has been much slower than that
during the period 1980-1985, unlike the situation in both developed and developing countries. On
the basis of the rather defective indicator often used in international comparisons (education
expenditure as a percentage of Gross National Product) Arab countries do better than developing
and developed countries alike and the percentage was on the rise between 1980 and 1985.
However, the percentage was lower in 1995 than in 1985.
A better indicator is per capita expenditure on education. At current prices, this indicator rose
over the years from 1980 to 1985. However, this rise was followed by deterioration during the
latter half of the 1980s. While Arab countries continued to spend more on education per capita
than developing countries as a group, their relative edge has been eroding since the mid-1980s. In
addition, per capita expenditure on education in Arab countries dropped from 20 per cent of that
in industrialized countries in 1980 to 10 per cent in the mid-1990s.
The absence of proper educational planning and goal setting is also evident in the lack of
compatibility between educational goals and individual and social development needs, on the one
hand, and the demands of the labor market, on the other. In most publicly funded schools in the
region, educational curricula are outdated and heavily dependent on rote learning and theoretical
information. Subject matters tend to have little relevance to the real world. This is true of the
general, vocational and higher education systems to varying degrees.
At the vocational level, training programs are supply-driven rather than demand-driven and do
not correspond to the needs and realities of the labor market. In most countries of the region the
vocational training system lacks comprehensive national strategies compatible with the labor
market and the needs of the new, technology-driven global market, which often means that
vocational training institutions will produce workers with no jobs to fill. Vocational training, also
suffers from not being accorded the prestige that is given to higher education. Therefore, students
who opt out of the academic system to join vocational training programs are faced with under-
funded programs, technologically irrelevant and out-dated courses, outmoded facilities,
insufficiently trained instructors and no reliable methods of assessing and evaluating the
standards, quality and relevance of programs and courses. In most cases students have not
received proper guidance or career counseling and have no idea about the future employment
prospects in any given vocation.
With the exception of Egypt, Libya, Bahrain, and Syria the proportion of upper secondary students
enrolled in vocational or technical subjects is less than 30% of the total secondary enrollment. In most
countries of the region (for example, Morocco, Tunisia, Kuwait, Saudi Arabia, Qatar, United Arab Emirates, Sudan, and Yemen) the proportion of secondary enrollees in technical or vocational
education falls below 20%. The global average for 2005 is approximately 17% of upper secondary
enrollments, although Developed world approaches 52%.

20
<Insert TABLE 14: Unemployment by level of education>
<Insert TABLE 15: Enrollment in vocational education >
Accordingly, while great numbers of unemployed youth in the Arab region actively seek work,
critical shortages of qualified workers continue to exist. As local industries explore new and
innovative lines of business, they demand workers with a strong work ethic, entrepreneurial
mindsets, and cutting-edge professional and technical training. Educational systems, however,
have proven inadequate in meeting this need, and first rate professional and technical schools are
virtually nonexistent. As a result, the cycle toward human development comes to a standstill:
young people sit idle without quality jobs or a promising future, and employers are unable to
expand their operations to spark the economic growth necessary for the creation of a viable
middle class.
<Insert TABLE 16: Youth unemployment>
The awareness in the region of the importance of education and its central role in achieving
sustainable human and social development and a competitive edge on the global market has not
been matched by the provision of the tools necessary to set effective policies and put in place
implementable goals and strategies to achieve it. Indeed, some of the most significant reasons for
many of the ills that plague the educational system at all levels in the Arab region are the lack of
information and education management information systems, on which to build coherent policies
and decision-making strategies, the lack of proper systems of accreditation, and the mismatch
between educational output and the labor market.
Low labor productivity
Consequently, growth in Arab countries has been seriously hampered by low and declining labor
productivity. According to World Bank data (1998/99 World Development Report), GNP per
worker in all Arab countries combined was less than half that of two comparator developing
countries: Argentina and the Republic of Korea.
Dividing Arab countries into three groups (each of which accounts for about one third of the
Arab workforce) according to the share of oil in GNP sharpens this picture:
In the first group of nine Arab countries that are richest in oil resources, productivity
barely exceeds half the level in the two comparator countries;
for the middle group with respect to oil‟s share in GDP (Egypt, Syria, and Tunisia),
productivity is less than one sixth of the comparators‟;
in the oil-poor Arab countries (Djibouti, Jordan, Lebanon, Mauritania, Morocco, Somalia,
Sudan, and Yemen) it is less than one tenth.

21
This result suggests that excluding the effect of oil revenues might reduce productivity estimates
for Arab economies to a greater extent than the simple overall comparison given above.
More important than measures of the level of productivity, however, are measures of changes in
it over time. World Bank estimates of total factor productivity in the MENA region showed a
steady decline (-0.2 per cent a year) from 1960 to 1990, compared to rapid acceleration in other
parts of the world. Data from the 1998/1999 World Development Report permit comparisons of
GDP per worker in nine Arab countries with that in faster-growing developing countries during
the periods 1980-1990 and 1990-1997. On this basis, annual productivity is estimated to have
risen by 15 per cent in China, 8 per cent in the Republic of Korea, and 6 per cent in India but only
4 percent in the Arab countries.
Low levels of growth and productivity can be partly explained by the fact that Arab countries lag
behind faster-growing developing countries in a key human-capabilities variable: years of
education. A comparison with the three Asian Tigers is revealing. In 1960, per capita output in
Arab countries was higher than that of the three Tigers. The latter were, however, more advanced
in terms of years of education, with a difference in educational attainment of around three years.
Over the period 1960-1992, the difference in educational attainment actually doubled, to six
years. Not surprisingly, GNP per worker in Arab countries dropped to less than half of that in the
Republic of Korea.
<Insert TABLE 17 and 17’: GDP per person employed (1980=100)>
At the sectoral level, the United Nations Industrial Development Organization (UNIDO) provides
comparative data for the industrial sector. Industrial labor productivity in the region (proxied by
the organization's North Africa and West Asia region) was estimated in the early 1990s to be
roughly the same as in 1970 (when it had been close to European and Japanese levels). In the face
of rising productivity elsewhere, this has meant a significant relative decline. According to
UNIDO, Arab industrial labor productivity per worker fell as a percentage of the North American
level in constant 1985 dollars from 32 per cent in 1970 to 25 per cent in 1980 and 19 per cent in
1990. It is noteworthy that the decline took place after the oil boom, which started in 1974, after
an investment of $2,000 billion in gross fixed-capital formation by 1992, and after a massive
expansion in educational systems at all levels.
Low returns to education
Rates of return to education give synthetically a measure of the net benefits associated with
investment in further education. Costs and benefits from that investment depend on the increased
earnings obtained in the labour market when the individual attains a higher level of education.
Expected wages represent the returns to education and they establish a link between labor market
prospects and schooling decisions. However, in situations of high unemployment, like the Arab
region case, education becomes an investment decision subject to uncertainty and expected wages

22
should be weighted by employment expectations. Both the costs and the benefits of education are
unsure and the final decision may be completely different from that taken under certainty7.
Casual evidence but also survey results seem to show that employment expectations play a
nontrivial role in the educational investment decision. Indeed, holding wages constant, higher
unemployment in the present makes schooling more attractive because it is less likely that a wage
is lost. Higher unemployment reduces the opportunity cost of education. Similarly, higher future
unemployment reduces the benefits of education and therefore it discourages enrolment.
In this context, some contributions should be mentioned, though. Nickell (1979) adjusts rates of
return by introducing unemployment because “we shall be underestimating the private rate of
return to the extent that the individual will only be in receipt of those earnings for some
proportion of the time where the proportion is directly related to schooling”. Groot and
Oosterbeeck (1992) estimate the effect of unemployment on the level of rates of return to
education, while Asplund et al. (1996) reformulate the earnings equation to allow for the
introduction of unemployment. In all these cases, when unemployment differentials are taken into
account, returns to education increase, in general, at all levels.
The latest compilation of the rate of return to education for a large number of countries in the
world is provided by Psacharopoulos (1994). The compilation is based on results using one of the
three standard methods for estimating the rate of return to education: the “full method” of
calculating the rate of return, the “basic Mincer” earnings function, and the “extended” earnings
function. In this compilation, the results pertaining to the Arab world are both limited in coverage
and outdated. Of seventy-eight results based on the full method, only five were for Arab
countries. The Arab countries involved were Morocco (with results for 1970); Somalia (1983);
Sudan (1974); Tunisia (1980); and Yemen (1985). Of sixty-two results based on estimating a
Mincer earnings function, only three were for Arab countries; Kuwait (with results for 1983);
Morocco (1970); and Tunisia (1980).
7 Rees and Mocan (1997) has attempted to study the effects of unemployment on different types of schooling
decisions. The authors use panel data analysis to investigate the role of unemployment in explaining high school
dropouts. The study find a positive effect of unemployment on education participation, reducing dropouts.
Micklewright et. al. (1990) find a positive effect of unemployment on early school leaving while the time series
analysis of Withfield and Wilson (1991) yields the opposite answer to the same question. Frederiksson (1997)
obtains a very small effect of unemployment clearly inferior to the role played by wages in explaining the demand for Higher Education. Other papers concerned with youth living arrangements have also found differing effects
depending on specifications. Fernandez and Shioji (2000) have proposed a plausible explanation for this diversity of
findings. According to the authors, unemployment could have two different effects on enrolment decisions. The one,
called investment effect, works solely through changing the costs and benefits of education. A high current rate of
unemployment for non-graduates encourages enrolment by lowering the opportunity cost of education. In the same
way, the expectation of a high rate of unemployment of graduates upon finishing the degree discourages enrolment
by reducing the benefits of education. Furthermore, given the intertemporal nature of schooling decisions, serial
correlation in unemployment rates boosts both effects. So long as high rates of unemployment are expected to occur
in the future following today‟s observed ones, then the investment effect will be at work. Most previous studies
consider implicitly or explicitly the investment effect. However, given the inconsistency of results, this effect alone
does not seem to give a sufficient explanation to the empirical relationship between unemployment and enrolment.
This is why the authors introduce the other type of effect, called wealth effect. Higher unemployment rates will make households poorer in general. In the presence of financial market imperfections, investments in education will be
negatively affected by the lack of income. Thus, unemployment could unambiguously reduce enrolment if the wealth
effect predominates.

23
<Insert TABLE 18: The Coefficient on Years of Schooling. Mincerian Rate of Return>
As Birdsall and O‟Connell (1999) have noted, “returns to education differ by level more in
MENA than in any other region,” with demand for primary grades much lower, due to education
quality and labor demand, than for secondary and tertiary levels, where graduates have relied on
rent wages in the public sector for four decades.
Ali (2003) have provided estimates of the returns to education, at different levels, in a sample of
six Arab countries: Jordan, Kuwait, Mauritania, Morocco, Oman and Yemen. The results at each
education level are lower than those reported for a typical developing countries; the average rate
of return for the six considered countries was found to be 7.3 percent below that of the world
average of about 10 percent. Furthermore, the rate of return to education do not seem to conform
to the general world pattern; the returns to education tend to increase by level confirming the
distortions characterizing the education systems in the region that predominantly show a
systematic bias toward higher at the expense of basic education.
Sectoral demands within the higher grades also contribute to the mismatch of returns to education
in the Arab economies. Traditionally, Arab societies value professions like medicine and law
above technical and vocational sectors, often looked upon with disdain. Hence, little demand
exists for funding vocational and technical education.
2.2. Labor demand considerations
2.2.1. Structure of Arab Economies
Input of labor in production process depends upon technology used, and technology used varies
across the industries. Traditional agriculture is more labor intensive than the modern
manufacturing industries. With the modernization of economy, share of agriculture in workforce
reduces due to two factors: food demand grows at a much slower pace at high levels of income,
which moderates the demand for food-grains, and the technology used in agriculture, at higher
yield levels is much less labor absorbing than traditional agriculture.
At all Arab countries level agriculture absorbed 34 to 29 per cent of workforce between the years
1995 and 2005. Thus, the proportion of workers getting work in agriculture came down by 5
percentage points between 1995 and 2005. The shifts in ability of agriculture to absorb labor are
more substantial than the average in five countries which represent 56 per cent of workers in the
Arab region: Yemen, Sudan, Oman, Morocco and Egypt with respectively 10, 8.8, 8.6, 8 and 6.8
percentage points less in 2005 than in 1995.
<Insert TABLE 19: Agricultural labor among workers>
Though, the share of agriculture in the total employment has been declining over the years, the
path of this decline has been faster than the decline in the share of agriculture in the GDP (2 per
cent in average between 1995 and 2005). As a result a clear divergence has emerged between the
shares of primary, secondary and tertiary sectors in employment and output, suggesting thereby
relatively large intersectoral differences in the per worker productivity.

24
< Insert TABLE 20: Agriculture, value added (% of GDP)>
The secular decline in the importance of agriculture sector in the overall economic structure is a
part of economic development. Work Opportunities that are lost in traditional agriculture have to
be replaced by work opportunities in some other sector. In the normal course it is the secondary
sectors (manufacturing) that grow much faster than agriculture during transition of an economy.
However, in the post reform period the growth of manufacturing industries has been constrained
by competition from imports. Thus, in the medium term, the ability of manufacturing sector to
replace the work opportunities lost in traditional agriculture is rather limited over the next 5 to 10
years.
In most Arab countries, the shift from a rural agrarian society to an urban industrial society
involved widespread social and economic disruption, unevenly distributed employment and
sometimes higher unemployment.
The industrial sector in the Arab Region has been significantly influenced during the last two
decades by two major factors:
Petroleum and gas industries are the main source of national revenues in 13 countries and
capital for investments in the other sectors of their economies; these vital revenues depend
on the international oil price fluctuation.
The inherent weakness and slow growth rates of the non-petroleum manufacturing
industries (Unified Arab Economic Reports, 1993, 1999).
The percentage of labor in extractive and in manufacturing industries has not increased
significantly over the decade. It could even be claimed that it has declined due to the increasing
share of the service sector. Furthermore, as the population has been increasing dramatically,
industry did not contribute significantly to the creation of new job opportunities.
2.2.2. Employment generation and productivity growth
Assume a national production function that is Cobb-Douglas with a constant return to scale:
1LAKY
The equilibrium condition in the labor market is the marginal product of laborp
w
L
KA
L
Y
the real wage, and A an index of total factor productivity (TFP). The rate of growth of
employment is then:
pwKAL /(
where
L is the rate of growth of employment,
A is the rate of growth of TFP,
K is the rate of
growth of the capital stock, which depend largely on the national investment rate, and
pw / is the

25
rate of growth of the real wage. The rate of job creation is then increased by additional
investment with which labor is complementary and decreased by any growth in the real wage
firms pay. Also, greater growth in TFP increases job creation as it increases the marginal product
of labor.
Therefore, there is a close connection between job growth, capital accumulation, and productivity
growth. Insofar as an absence of interaction with the world economy reduces total factor
productivity growth, it slows not only the rate of growth of aggregated supply but also the growth
of employment. Similarly, high levels of technological absorptive capacity, facilitated by specific
types of higher education, are also critical to increasing the growth rate of TFP.
The assumption is that aggregated demand increases sufficiently rapidly to absorb the new
output. On the other hand, the growth of real wages, for a given worker productivity, limits the
additional profitable jobs that the firm can offer. This imply that the substitution of labor for
capital, which would require lower real wages relative to the cost of capital, is precluded though
in principal this substitution would be possible. Such substitution would also reduce the
investment requirement.
Given the push to increase the female labor force participation rate, and the need to reduce the
very high current rates of unemployment and/or underemployment, the number of jobs created
likely will have to increase by more than 3 percent per year for most Arab countries8. Table 21
shows some combinations of variables that allows the realization of the desired employment
growth rates of 3.5 and 4 percent as a benchmark, and a 2 percent growth rate of real wages. In
this exercise it is assumed that the initial capital output ratio is 3, reflecting the experiences of
some Arab countries during 1995-2000, and the depreciation rate of the fixed capital stock is 5
percent per year given that capital stock evolves as follows:
1)1( ttt KIK ,
where I is investment and is the fixed capital stock depreciation rate.
As has been documented in Collins and Bosworth (1996), the share of capital in developing
countries, the Arab region members being among them, is much higher than the frequently used
share of 0.3-0.4. The estimated share for the MENA regions was found to be in the range of 0.5-
0.7 (Senhadji, 2000 and Limam et al, 2007).
< TABLE 21: Alternative Scenarios for Labor Force Absorption>
The calculations show that with a TFP growth equal to 0.1 percent per year, capital share of 0.5,
and for employment to grow at 3.5 percent per year, the required investment rate is 34.5 percent,
dropping to 25.5 percent when TFP growth is 2% and rising to 40.5 percent when TFP growth is
-0.5 percent. For employment to grow at 4 percent, consistent with the IMF‟s higher labor force
growth projection in the region, an important increase in the investment rate would be necessary
(between 27 and 42 percent).
8 A World Bank study argues this increase is 3.5 percent, and another by the IMF concludes that it is 4 percent;
World Bank (2004) and Dhonte , Bhattacharya and Yousef, (2000)

26
According to Limam et al (2007), countries such as Algeria, Jordan, Kuwait, Libya and Sudan
had negative TFP growth9. In these countries, the investment requirements to absorb the rapidly
growing labor force will be exceptionally high. Even in the case of the oil exporters of the GCC,
simple job creation may not be enough; they have to be jobs that nationals are prepared to take.
Thus there is a need for greater domestic saving to finance investment and/or greater productivity
growth, neither of which will be easy to achieve given the deep political uncertainty
characterizing many of the region‟s regimes and uncertainties about the future price of oil. If such
saving and investment were to materialize, and both capital stock and employment grew more
quickly, the aggregated output would also increase more rapidly. The last column of table 21
showed the implied rate of growth of aggregate supply under the various assumptions (5.5 or 6
percent per year).
2.2.3. Barriers to investment
McCall (2004) reviewed private sector investment in some Arab countries (as a principal sub-
group of MENA region) and identified four significant barriers to private investment in the
region:
1. Lack of ownership diversity
In most Arab countries, there is a large degree of state ownership of assets. This structure has
several negative implications on an economy. Direct consequences include a slow innovative
process of government-owned enterprises, the inability for industry to adapt to new trends, slow
expansion and low technological expertise. Furthermore, state-owned companies are subject to
government funding, direction and discretion that can hamper growth and transparency. Indeed,
studies indicated that while investment is necessary for growth, the quality and efficiency of such
investment is the critical factor. The Arab region has comparable levels of investment and high
savings growth rates versus other regions, including East Asia, however the quality of investment
and returns to productivity has lagged.
The ratio of private investment to public investment is only at 2 in most Arab Countries, versus 6
in OECD countries, and 5 for most of SE Asia. The high percentage of family and public
ownership is one prohibiting factor. Additionally, the close relationship between banks and the
government is often cited as a constraint on credit availability and lacks sufficient transparency.
Moreover, the heavy public sector in the Arab region often provide inefficient and costly
services, raising the cost of exports and limiting the returns, and thus diminishes its attractiveness
to international and domestic private investment. Privatization in these sectors will also help to
facilitate trade and investment in related sectors, such as tourism and technology sectors.
9 With reference to the Arab countries, Sala-i-Martin and Artadi (2003) point out that low TFP growth shows
ineffectiveness of investments due to three fundamental causes: social and political instability; excess of regulations
and the presence of heavy public intervention discouraging private investments; poor quality of the human capital.
As expected, these factors affect in the negative both domestic and (more even so) foreign investments.

27
2. Insufficient diversification of the economy
The small size of many of the financial markets is partly due to the lack of both small and large
diversified and regional companies. Only 8% of Arab trade is conducted within the MENA
region, highlighting the region‟s dependence on Europe, Asia and North America for many of its
goods. Moreover, as highlighted in the previous sections there is an urgent need to create
employment, most of which cannot be provided from the oil sector and must come from other
industries, such as tourism, manufacturing and services. The size of the combined MENA market
region is 370 million, but the inter trade is quite low, mainly due to a lack of products, as well as
lack of conducive regional trade agreements.
In the GCC states, over two thirds of the population are under 25 years, and 21 percent are
between 11 and 15 years old. Jobs are urgently needed for the young nationals as the oil sector
provides relatively few jobs. Growth is historically not sufficient to create new jobs to absorb the
rapid expansion of the labor force. IMF studies indicate that in economies that derive a
significant share of their income from oil, the large size of the government sector has been the
overriding problem, stifling private sector growth and making it hard to diversify production.
Increasing the diversification of the economies as well inter-regional and international trade is a
must not only due to employment issues but also for the Arab region to keep pace with an
increasingly competitive world market.
3. Inadequate transparency and regulation
Governance and transparency in the region is varied and it is difficult to generalize specific
reforms and policies. However, there are several common qualities that most countries share
including; a general lack of freedoms, low transparency in business and government polices
transactions, and a lack of full accountability. This includes proper recourse for transactions by
both domestic and international parties in a court of law, as well as the formation of parliaments
and representative governments.
4. Underdeveloped capital markets
In most Arab markets, banks are still overwhelmingly local and lack a pan-Arab presence. There
tends to be little competition locally, and many banks are still state-owned. Despite the existence
of private banks, competition is not actively encouraged. Product innovation is low, although this
is changing in some countries.
The corporate bond market is in its infancy in most Arab countries, further hampering the
financing of corporate expansion. This also forces would be creditors into the hands of the
banking system, which further enhances the power of the banking system and the control of
credit by strong state or private banks. Furthermore, the capitalization of the equity markets is
low, consisting of a limited number of companies, and offer very poor liquidity. High liquidity is
needed to attract both large domestic and international investors. Efforts to increase the size,
liquidity and product offering of the local markets are in progress but are often hampered by
cumbersome regulations and requirements.

28
2.2.4. Low capacity to attract FDI
Over the last ten years, FDI have significantly increased both in absolute and relative terms.
Between 1980 and 2004, FDI flows in the world went from 55 to 648 billion dollars. The highest
growth rate took place in the second half of the 90s; after which, the flows started decreasing.
Rates recorded at the end of the period under consideration appear, however, to be distinctly
above any previous ones. Arab countries‟ performance, however, appears to remain distinctly
below that of many other developing economies or emerging countries. In particular, the growth
of FDI flows proves to be notably inferior to that recorded in the EU new members or in the big
rapid growth Asian economies, such as China and India.
Between 1995 and 2004, the MENA received, on average, FDI for little more than 8 billion US
dollars, as against 17 billion dollars of the new EU member countries. The MENA received 1,2%
of the world‟s total flow of FDI, China and India as a whole got 8%, while 25 EU countries got
around 43%. Moreover, most of the limited FDI flows go only to a handful of countries and
specific sectors. More than 80 percent of FDI stock is concentrated in five countries – Saudi
Arabia (34 percent), Egypt (22), Tunisia (14), Bahrain (7) and Morocco (7). The same five
countries also have the highest average annual FDI flows. In terms of sector distribution, the bulk
of the region‟s FDI is directed predominantly to petroleum-related and other natural resource
activities. Some other countries such as Bahrain, Egypt, Morocco, Tunisia and Lebanon have
witnessed FDI inflows into various sectors such as tourism, banking, telecommunications,
manufacturing, and construction. Some of these non-hydrocarbon sector FDI flows were ushered
by cross-border mergers and acquisitions, particularly of privatized firms.
At the country level, the flows and stock of FDI remain a small part of the respective economies,
both in terms of the gross fixed capital formation (5 percent on average – Bahrain 74, Kuwait 1.4
of FDI stock)) and the gross domestic product (14 on average – 3.9 UAE, Bahrain and Tunisia
above 20).
Although intra-Arab investment is likely to be understated in international FDI statistics, it
comprises a significant proportion of FDI inflows (more than half of the total FDI inflows). In
some cases intra-Arab investment is considered domestic investment. Private capital flows from
the GCC to other MENA countries are a potentially significant source of future private
investment. High net worth citizens of the GCC states have invested roughly $1.2 trillion (about
85 percent of their wealth) abroad, mostly in the United States. Also notable is the considerable
amount of outward FDI flows and stock in the Arab world. Kuwait has a much higher outward
FDI stock ($1.98bn) than inward FDI stock ($527 mn) as of 2000. Despite their familiarity with
economic conditions in MENA and willingness to take a fresh look at investment opportunities at
home, these elites have diverted only a trickle of their wealth back into the Arab world because
they cannot find ways to invest it productively at home.
Research shows that there are at least three main reasons at the basis of this relatively low
capacity of the MENA in general and Arab countries in particular to attract investments:

29
1. The small size of local markets and the lack of real economic integration inside the
MENA. As we shall shortly see, the economic dimension of the MENA is relatively
small, while trade integration among the southern countries (the Agadir agreements
between Morocco, Tunisia, Egypt and Jordan) is not yet strong enough to enlarge the
dimension of the potential market.
2. The second reason may be traced back to the changes in the scenario of international
competition. Eastward EU expansion along with the rapid growth of some big economies
in Latin America, China and India, have provided new opportunities for international
investors.
3. Thirdly, economic and trading reforms in the MENA have been slow and mostly
insufficient, while restraint of investments along with the inadequacy of its institutional
and legal framework only add to the low attractive capacity of the region.
3. Employment Programs and Employment Policies10
3.1. Active Labor Market Policies
The steady rise in unemployment rates in the 1970s and 1980s in Europe has been variously
attributed to mismatches between labor skills demanded and supplied, excessive wages vis-à-vis
productivity levels, over-generous out-of-work benefits, and rigid institutions. Among the
possible solutions was the introduction of government policies to better mold labor force
characteristics to changes in demand, to lower firms‟ labor costs directly and to increase job-
search efficiency. These policies have been grouped under the label of Active Labor Market
Policies (ALMP).
The ALMP reflect the increasing consensus among policy makers that actively assisting the
unemployed in job search is preferable to simply providing them with passive income support.
The danger is, so the argument goes, that reliance on passive income support may reduce work
incentives and job-search activities and therefore increase the risk of long-term unemployment.
ALMP are seen by many as the key to minimize these risks.
Calmfors (1995) distinguishes four basic functions of ALMP: raise output and welfare by putting
unemployed to work or have them invest in human capital, maintain the size of the effective labor
force by keeping up competition for available jobs, help to reallocate labor between different sub-
markets, and alleviate the moral-hazard problem of unemployment insurance.
ALMP may eliminate mismatch in the labor market, promote more active search behavior on the
part of the job seekers and have a screening function because they substitute for regular work
experience in reducing employer uncertainty about the employability of job applicants.
Placements in labor market programs may provide an alternative work test to the eligibility of
unemployment benefits, since some of those who are not genuinely interested in work will prefer
to lose registration rather than to participate in a program. An adverse side effect of ALMP is that
10
I highly recommend the chapter prepared for the Handbook of Labor Economics, Volume III, by Heckman,
LaLonde and Smith (1999), titled "The Economics and Econometrics of Active Labor Market Programs" and
available on the internet at http://athena.sas.upenn.edu/~petra/class721/hls.pdf

30
workers are locked-in training and job-creation programs: because of their participation they
reduce their search intensity.
Calmfors (1994) distinguishes a number of indirect effects which are also important when
assessing the effectiveness of ALMP. First there are displacement effects since jobs created by
one program are at the expense of other jobs. Then there are deadweight effects because labor
market programs subsidize hiring that would have occurred anyway in the absence of the
program. There are also substitution effects because jobs created for a certain category of workers
replace jobs for other categories because relative wage costs have changed. Finally, there are the
effects of taxation required to finance the programs on the behavior of everyone in society.
In line with the distinction between micro and macro effects there are two main types of
evaluation studies of ALMP (Martin and Grubb, 2001). The first type uses micro data to measure
the impact of program participation on individuals‟ employment and earnings. The second type
uses aggregate data to measure the net effects of programs on aggregate employment and
unemployment. Micro studies have the advantage of a very large number of observations.
Drawbacks are the selection bias and the fact that they provide only estimates of partial-
equilibrium effects. Macro studies are few. Drawbacks of macro studies are that they are based
on few observations, they often lump together various types of training and job creation schemes
and they have to deal with a simultaneity bias.
There are many evaluation studies. A lot of them are done in Sweden, a country that has used
ALMP extensively. Heckman et al. (1999) give a detailed overview of several micro-econometric
evaluation studies. They conclude that labor market programs have at best a modest impact on
participants‟ labor market prospects. Furthermore, there is considerable heterogeneity in the
impact of these programs, so for some groups of workers the programs are more effective than
for other groups of workers. Finally, when programs are implemented on a large scale
displacement and general equilibrium effects may be sizeable. This means that without
incorporating them in a macro framework micro treatment effect evaluations will provide poor
guides to public policy.
Calmfors, Forslund and Hemstrom (2001) conclude that the evidence on the effectiveness of
Swedish ALMP is rather disappointing. Labor market retraining for example has no or negative
employment effects. Martin and Grubb (2001) draw similar conclusions in their overview on
what works and what does not work among ALMP in OECD countries. They conclude for
example that subsidies to employment and direct job creation have been of little success in
helping unemployed get permanent jobs. Kluve and Schmidt (2002) also present an overview of
evaluation studies concluding that job search assistance can be useful, private sector subsidies are
better than public sector programs and training programs can help to improve the labor market
prospects of unemployed workers.

31
3.2. Programs and Policies Aiming to Enhance Employment Opportunities of Arab Youth11
Employment programs can be divided into three main categories:
(1) Interventions which impact the supply side of the labor market, e.g., education and
training programs catering for young unemployed and displaced workers.
(2) Interventions seeking to impact the demand side, e.g. creating employment opportunities
through supporting employers; increasing opportunities for self-employment and small
businesses, and using job nationalization, wage subsidies, business incentives, micro-
credit, public works and services programs.
(3) Interventions intending to improve the functioning and monitoring of the labor market,
e.g., increasing job market information and employment database, providing job search
assistance, supporting professional guidance, employment offices, and enhancing the
coordination between the various employment promotion schemes.
The abovementioned programs have been adopted to varying degrees by the different Arab
countries. Some of these programs are comprehensive and incorporate multiple training and
employment activities, such as the Social Development Fund in Egypt; the Social Development
Fund in Yemen; and the Employment Fund in Jordan. Other countries represent landmarks in
certain components of employment policies such as the programs aiming at developing business
and entrepreneurship initiatives in Jordan, Kuwait, and the United Arab Emirates; and policies
aimed at improving labor market information and strengthening the role of placement offices
such as in Tunisia.
3.2.1. Programs aiming mainly to develop the supply side:
Improving technical education and vocational training (TEVT):
New programs have been introduced, such as “dual-system” (programs which combine training
and apprenticeships); joint public-private programs; and school-to-work programs (e.g., school
enterprises and internships). However, in many Arab countries most of the vocational education
is carried out at secondary school levels. Arab governments are the main providers of the TVET
services, expect for Lebanon where the responsibility lies with the private sector. The private
sector is increasingly contributing to this domain although its contribution has been modest in
may countries (e.g., Egypt). TEVT has received, however, heavy cooperation and coordination
from the business organizations in some countries (e.g., in Bahrain).
Outstanding attempts to upgrade the quality of TEVT programs in the region have been cited in
many specialized reports, among which is a new technique, DACUM (Design A Curriculum). It
is used by the Public Authority for Applied Education and Training (PAAET), the main provider
of vocational education and training in Kuwait, to bridge the gap between the demand and supply
sides of the labor market in skills and know-how.
11
This section draws heavily from several reports among which are ILO (2004), Brandsma and Hart (2001) and
ESCWA (2002).

32
Also significant developments are taking place in the TEVT system of Yemen. The Ministry of
Technical Education and Vocational Training (MTEVT), through technical collaboration with the
ILO, overhauled the Yemeni TEVT system.
The Skill Development Fund (SDF) and several joint publich-private collaborations were
established and the government is gradually expanding the capacities of the various training
institutions.
Among the most important employment initiatives in the region is the Mubarak-Kohl Initiative
(MKI), an apprenticeship scheme, launched in 1991 in order to initiate a structural change in the
Egyptian vocational education and training system (VET). MKI is based on joint financial and
technical collaborations of public and private organizations in order to provide intensive technical
training programs to a limited number of trainees.
Similar projects are also taking in Saudi Arabia. The Saudi Vocational Training Administration
launched the National System for Joint Training (NSJT) in cooperation with the private sector. It
provides mostly enterprise-based training.
The Tunisian government, being the body responsible for the TVET system, has created since the
early 1990s many institutions to lift the role of TVET in employment.
The Tunisian government has also taken several measures to improve TVET in the country
including legislating training levy to support vocational training, performing apprenticeship
training through training contracts, building up vocational formation map, and vocational
formation of women in rural areas.
Developing entrepreneurial attitudes and skills:
One of the most significant initiatives in this domain is INJAZ; a youth initiative funded by
USAID that is now operating in several Arab countries, e.g. Jordan, Kuwait, Egypt, Bahrain,
Lebanon, Oman, Palestine and Qatar. It aims at creating entrepreneurial culture and fostering
business attitudes, creative and critical thinking, problem-solving and interpersonal
communication skills within the youth. It also seeks to prepare an innovative and qualified
generation of workers, in order to fulfill the private sector’s growing needs for better labor
quality.
Tax exemptions and Training Subsidies:
Some Arab governments have established business tax relief systems in order to encourage the
participation of the private sector in enterprise-based training programs and employment
promotion schemes. For example, Bahrain uses “Training Participation Levy schemes” to
finance training, while compensatory incentives are proposed to encourage enterprise-based
training in Egypt.
Informal training:
The Somali Education Incentives for Girls and Young Men (SEIGYM), supported by the Africa
Educational Trust (AET), uses a “voucher system” which encourages disadvantaged youth to

33
gain essential reading and work skills. It uses a variety of informal education and training to give
school dropouts a second chance to have a craft.
3.2.2. Programs targeting the demand side of the labor market
These include programs of self-employment, and enterprise development, micro-credit schemes,
job subsides and job reservation schemes.
Micro-enterprise development and Programs of Self-Employment:
The Social Fund for Development (SFD) in Egypt, established in 1991, encourages the initiation
of small businesses, especially among youth, through the provision of soft loans, as well as
training, technical support, guidance and supervision. Another Egyptian program, The Desert
Development Program, aims at reducing unemployment through enabling Egyptians to build a
livelihood in lands transformed from desert into agricultural land.
In the United Arab Emirates, Mohammed Bin Rashid Established for Young Business Leaders
encourages and facilitates the development of local businesses and entrepreneurial activity in
Dubai through assisting, training and supporting SMEs run by UAE nationals. The Social
Development Fund in Yemen has also outstanding achievement in the job creation domain, skill
development, poverty alleviation and improving the quality of life particularly in rural areas.
Jordan has numerous schemes which support private business and investments. Examples of the
Jordanian programs aiming at facilitating the establishment of new businesses and providing
support to start-up enterprises are the information and Communication Technology Incubator
which was launched by the Higher Council for Science and Technology, and “Empretec” which
is UNCTAD’s integrated capacity-building program promoting the creation of sustainable SME
support structures to help promising entrepreneurs build internationally competitive SMEs.
In Oman, SANAD, a self-employment government program, focuses on enhancing business
opportunities for Omani nationals, particularly skilled youth. It is also actively contributing to
the Omanisation of the private sector.
In Tunisia, the FNE 21-21 and BTS established in 1993 and 1997, respectively, to facilitate the
creation of small business especially for the jobless. In addition, the central bank of Tunisia
manages the National Fund for the promotion of small craft businesses (FONAPRAM).
Access to credit:
In the United Arab Emirates, Al Tomooh, a small business financial scheme established by
Emirates Bank, provides easy access to funding for small national enterprises owned by
nationals. A variety of other schemes are available in Jordan (AMIR and the Jordan Loan
Guarantee Corporation), Tunisia (the Tunisian Bank for Solidarity, BTS, and the National Fund
for Employment, FNE 21-21). Kuwait (the Industrial Bank of Kuwait’s subsidized loans for
establishing small specialized businesses); and some other Arab countries among which are
micro-finance programs, loan guarantee programs, venture capital funds and long-term assets
procurement schemes.

34
Public works programs (PWP):
These programs are an important tool for transferring income to the poor segments of society,
and for providing gainful jobs. They however do not improve the employment prospects of
program participants in the long run. In Egypt, PWP established in 1991, is part of the Social
Fund for Development (SFD) program. Its aim is to provide jobs through labor-intensive
infrastructure projects in rural areas. Similarly, the SDF in Yemen since its creation in 1997 and
until 2004, has generated 10.3 million temporary and 14.5 thousand permanent jobs.
It is estimated that PWP employs 0.4 percent of the labor force in Egypt, 0.1 percent in Yemen,
0.6 percent in Morocco, 2.3 percent in Algeria and 2.4 percent in Tunisia (World Bank, 2004).
Youth are the primary beneficiaries of these programs.
Employment and wage subsidies
In Tunisia employment/wage subsidies represent more than 50 percent of the ALMP cost. Wage-
supplements are also heavily used in many GCC countries to encourage the employment of
natives in the private sector.
Job-Nationalization and Job-Reservation Schemes:
In many Arab countries, notably the GCC countries, labor nationalization programs which aim at
replacing foreign workers with nationals through market-based and mandatory rules, are used.
3.2.3. Scheme intending to improving the functioning and monitoring of the labor market
Higher councils, committees and taskforces:
Recently, Bahrain established the Vocational Education and Training-Skills for Work Task
Force. In Jordan, the Vocational Training Corporation (VTC) is a main player in the Jordanian
training sector. Also, the Ministry of Education, the VTC, Ministry of Labor and other local and
international organizations are actively developing the TEVT sector. Similar bodies are
established in Saudi Arabia: the Work Force Council, and in Egypt: the Higher Council for
Human Resources Development. Tunisia has organized a job insertion of young graduates in the
labor market.
Setting occupational standards:
Linking jobs to specific skills will not only break the vicious cycle between overstated job
specification and over-education, but will also improve the employment prospects of young
graduates.
The Saudi Vocational Training Administration in collaboration with the private sector launched a
scheme to establish approved national standards for occupational skill requirements. This
initiative seeks to help educational and training programs in matching their programs’ output with
labor market demands. Egypt’s Higher Council for Human Resources Development also is
establishing a system of approving national standards and issuing licenses for various
occupational skill levels.

35
Job-search assistance/employment services
One of the landmarks in the Arab countries in the field of employment services is the Tunisian
National Employment Agency and Independent Work (ANETI), established in 1993 and changes
name in 2003. Its main role through its 90 employment offices is to convey job information
between employers and job candidates. In a given year, more than 300,000 job applicants
register at least once in the ANETI offices, and more than 7 million use its internet services for
consultation. In Egypt, the Ministry of Manpower and Emigration is actively working to
improve job-placement offices.
Networking:
An empowering technique, especially for young entrepreneurs, is gaining access to business and
other relevant networks which provide information and support. Examples of these networks
include the Young Arab Leaders (YAL) Network, a Pan-Arab initiative launched in 2004 to grow
a base of five hundred Arab leaders in the field of business, government, civil society, journalism,
arts and academia. Another equally important initiative is the Young Entrepreneurs Organization
(YEO), an international NGO established in 1987 and runs in several Arab countries.
Other national entrepreneurial network include Riyada in Dubai that is a monthly networking
event which aims at promoting and encouraging entrepreneurship and increasing knowledge
dissemination for local entrepreneurs.
< TABLE 22: Expenditures on Active and Passive Labor Market Programs in Selected MENA
Countries, 2003>
4. Conclusion
The Arab world is confronted with an increasing pressure coming from the supply side of the
labor market, generated principally by the unemployed persons looking for a job, the new
entrants on the labor market and the expected increase of the women labor force participation
rate. This pressure is compounded by structural considerations relating to the slow labor
productivity growth, low demand for skills, slow and erratic domestic investment growth, low
attractiveness of foreign direct investment and high dependency on the dynamics of the
international oil market as well as labor migration.
The high youth unemployment is certainly the most striking manifestation of the development
crisis plaguing almost all Arab countries. It represents the major challenge. There are variations
on the causes and the dimensions of the problem, and each country of this part of the world has
its specificity that should be taken into account when addressing the unemployment question.
As such, in GCC countries, youth unemployment is fundamentally a supply problem as the
products of the educational and training systems do not respond to the needs of the labor market.
In the more diversified economies, without neglecting the supply side considerations linked
among other to the mismatch between the quality of labor and the requirements of the emerging
and fragile private sector, the basic problem seems to be a shortage of demand due to a slowdown
of the growth process or/and a non-employment-friendly pattern of growth. Consequently, for the
first group, the main issue is ensuring that entering cohorts of young nationals are able to find

36
appropriate jobs that match their skills and pay acceptable wages. For the second group, the main
issue is creating enough jobs to accommodate entering cohorts.
Several specialists of development issues in Arab countries underline the non-existence among
the economic policy leaders of a forward-looking strategic type of thinking, which aims at
managing the future labor market conditions on the basis of a strategic intelligence matrix
continually augmented by a systematic investigation and compilation of information relating to
all the segments of the labor markets. Consequently, we cannot expect the development of a
complete strategic plan aimed at identifying the features of an economic arrangement that can
ensure a steady pace of development to create more than 100 million jobs in less than one decade.
The lack of prediction and forecast management in general severely hampers the rational
planning which sets precise perceptions for the methods and terms of the development in these
Arab economies.
In contrast with the relative attention paid to macro aspects, there is insufficient empirical
detailed evidence on the topic of labor market micro analysis, market selection process and firm
productivity within this area of the world, the major constraint being the availability, accessibility
and dissemination of labor force surveys and firm-level data. Confidentiality is most often used
against accessibility of microdata and few Arab countries have a clear microdata dissemination
policy. Shortage in data and its coverage necessitates the need for more effort to be done on data
collection and dissemination which enables researchers to draw concrete inferences on the status
and dynamic of youth unemployment in the Arab countries.

37
References
Ali, A. A (2003), Returns to Education in Arab Countries: Comparative Case Studies (editor; in
Arabic).
Al Khouri, R., 2004, „Arab Migration Patterns: The Mashreq‟, in IOM (2004), pp. 21 -33
Al-Qudsi, S., R. Assaad, and R. Shaban, 1995, “Labor Markets in the Arab Countries,”
International Labor Review 134 (1), pp. 65-81.
Asplund. R., E. Barth, C. le Grand, A. Mastekaasa and N. Westergaard–Nielsen (1996), „Wage
Distribution Across Individuals‟, in Wadensjö, E. (ed.) The Nordic Labour Markets in the 1990‟s.
Part Two. Amsterdam: North-Holland.
Azmat, Ghazala, Maia Güell and Alan Manning, 2004. “Gender Gaps in Unemployment Rates in
OECD Countries,” Working Paper, Centre for Economic Performance, London School of
Economics and Political Science, London.
Berriane, Mohamed (1996) Migration Internationale et Extension du Cadre Bâti: Le Cas des
Villes du Maroc Nord. Séminaire sur “La Migration Internationale”, 6-7 juin 1996. Rabat:
CERED, 365-401
Bilsborrow, Richard E., 1992, Rural poverty, migration, and the environment in developing
countries : three case studies”, World Bank Policy Research Paper, WPS1017, Washington DC,
World Bank.
Birdsall, N. and L. O‟Connell. 1999. “Putting Education to Work in Egypt.” Working Paper.
Washington: Carnegie Endowment for International Peace.
Brandsma, J. and L. Hart (2001), "Making Microfinance Work Better in the Middle East and
North Africa", The World Bank.
Calmfors, Lars (1994) Active labor market policy and unemployment - a framework for the
analysis of crucial design features, OECD Economic Studies no 22(1), 7-47.
Calmfors, L., Forslund, A., Hemstrom, M. (2001) Does Active Labor Market Policy Work?
Lessons from the Swedish Experiences, mimeo, IFAU.
Collins S. M. and Bosworth B. P. (1996), “Economic Growth in East Asia: Accumulation versus
Assimilation,” Brookings Papers on Economic Activity, 2, 135-191.
Creane S., Goyal R. , Mobarak A., M. and Sab R., (2004), “ Financial Sector Development in
Middle East and North Africa. IMF Working Paper WP/04/201.
Dhonte P., Bhattacharya R. and T. Yousef, (2000), “Demographic Transition in the Middle East:
Implications for Growth, Employment, and Housing,” IMF Working Paper 00/41 (Washington).

38
De Haas, H., (2003), Migration and Development in Southern Morocco. The Disparate Socio-
Economic Impacts of Out-Migration on the Todgha Oasis Valley. PhD Thesis, Radboud
University, Nijmegen
ESCWA, (2003), “Responding to Globalization: Stock Market Networking for Regional
Integration in the ESCWA region”. October.
ESCWA, (2002), " Youth Employment in the ESCWA Region", paper presented in Youth
Employment Summit, Alexandria.
Estevão, M., (2003), "Do Active Labor Market Policies Increase Employment?", IMF Working
Paper WP/03/234.
Fargues, P., (2004), „Arab Migration to Europe: trends and policies‟, in IOM (2004), pp. 135-153
Fernandez, R.M., and E. Sjioji (2000) ”Human Capital Investment in the Presence of
Unemployment: Application to University Enrolment in Spain”, Working Paper Oxford
University.
Frederiksson, P. (1997); ”Economic Incentives and the Demand for Higher Education”,
Scandinavian Journal of Economics 99(1).
Gallina, A., 2004, „Migration, financial flows and development in the Euro-Mediterranean area‟,
Federico Caffè Centre Research Report no. 5/2004, Roskilde, Denmark
Girgis, M. 2002, Would Nationals And Asians Replace Arab Workers in the GCC‟, Report
submitted to Fourth Mediterranean Development Forum, Amman, Jordan, October 2002.
Groot, W. and H. Osterbeek (1992), „Optimal Investment in Human Capital Under Uncertainty,‟
Economics of Education Review 11(1), 41–49.
Heckman, J. J., LaLonde, R. J., and Smith, J. A. (1999), The Economics and Econometrics of
Active Labor Market Programs, in: Ashenfelter, Orley, and Card, David (eds.) Handbook of
Labor Economics, volume III, North-Holland.
Higgins, M., 1998, “Demography, National Savings and International Capital Flows,”
International Economic Review 39, pp. 343-369.
IOM, 2004, Arab Migration in a Globalized World, Geneva: International Organization for
Migration
ILO (2004), "Tripartite Meeting of Experts on Youth Empowerment in the Arab States", Amman,
6-8 April.
Keller J. and Nabli M. K., (2002), “The Macroeconomics of Labor Market Outcomes in MENA
over the 1990s: How Growth Has Failed To Keep Pace with a Burgeoning Labor Market”, ECES
Working Paper No. 71, August.

39
Kluve, Jochen, and Schmidt, Christoph M. (2002) Can training and employment subsidies
combat European unemployment? Economic Policy, 35, 411-448.
Limam I, Makdisi S. and Fattah Z., (2007): “The Determinants of Growth in The Middle East”,
in Explaining Growth in the Middle East, Edited By Nugent J. and Pesaran H.
Lindh, T. and B. Malmberg, 1999b, “Age Distribution and the Current Account – A Changing
Relation?” Working paper No. 12, Department of Economics, Uppsala University.
Martin, J. P., and Grubb, D. (2001) What Works and for Whom: a Review of OECD Countries’
Experience with Active Labor Market Policies, Working Paper, OECD, Paris.
McCall, P. J, (2004): “Overcoming Barriers to Private Investment in the Middle East and North
Africa Region”, MEC International.
www.oecd.org/dataoecd/18/23/33944640.pdf
Mghari, M., 2004, „Exodus of Skilled Labor‟, in IOM (2004), pp. 71-89
Micklewright, J. ; Pearson, M. and Smith, S. (1990); ”Unemployment and Early School
Leaving”, Economic Journal; 100(400) Supplement.
Myatt, A, and David Murrell, 1990, “The Female/Male Unemployment Rate Differential” The
Canadian Journal of Economics, 23(2): 312-322
Richard H. A., 2003, “International Migration, Remittances and the Brain Drain: A Study of 24
Labor-Exporting Countries”, World Bank Policy Research Working Paper 3069, June.
Nickell, S. (1979), „Education and Lifetime Patterns of Unemployment‟, Journal of Political
Economy 87(5), S117–S131.
Rees, D. I. and Mocan, N. H. (1997); ” Labour Market Conditions and the High School Dropout
Rate: Evidence from New York State”, Economics of Education Review 16(2).
Sala-i-Martin X. E. Artadi (2002), “Economic Growth and Investment in the Arab World”,
Columbia University, Discussion Papers Series, 0203-08.
Seguino, Stephanie, 2002, “Why are Women in the Caribbean So Much More Likely than Men to
Be Unemployed? ” Economics Department Working Paper, Univ. of Vermont.
Senhadji, A. (2000), “Sources of Economic Growth: An Extensive Accounting Exercise,” IMF
Staff Papers, 47(1), 129-157.
UNDP (2004): Human Development Report 2004, NY: United Nations Development Program.
Williamson, J. and T. Yousef, 1998, “Demographic Transitions and Economic Performance in
the Middle East and North Africa,” in I. Sirageldin, ed., Population Challenges in the Middle
East and North Africa.

40
Withfield K. and Wilson, R. A. (1991); ”Staying on in Full Time Education: The Educational
Participation of 16-year-olds”, Economica 58.
World Bank (2000) Comprehensive Development Review, Yemen.
http://lnweb18.worldbank.org/mna/mena.nsf/Attachments/Urban-1/$File/BB-16(part1).pdf
World Bank (2004). Unlocking the Employment Potential in the Middle East and North Africa:
Toward A News Social Contract. MENA Development Report. Washington, DC: World Bank.
Yousef, T., 2004, “ Development Growth and Policy Reform in the Middle East and North Africa
since 1950”, Journal of Perspective Economic, vol 18 n°3, summer, pp 91-116
Zakaria, K, and El Sibai, B, 1991, “Determinants of internal migration in the Syrian Arab
Republic, ” in State Planning Commission: The Proposed National Plan for Internal Migration in
the Syrian Arab Republic, Damascu (in Arabic).

41
Tables

42
TABLE 1: Population and Fertility Rate in Arab countries (thousands)
Growth (per cent) Fertility Rate
1950 1970 1980 1990 2000 2005
1950-
1980
1980-
2005 1950-1955 2000-2005
Arab countries
Algeria 8753 13746 18811 25291 30463 32854 114,9 74,7 7,28 2,53 Bahrain 116 220 347 493 672 727 199,1 109,5 6,97 2,47
Comoros 173 275 387 527 699 798 123,7 106,2 6,33 4,89
Djibouti 62 162 340 558 715 793 448,4 133,2 7,8 5,09
Egypt 21834 35285 43860 55673 67285 74033 100,9 68,8 6,56 3,29
Iraq 5340 10112 14093 18515 25075 28807 163,9 104,4 7,3 4,83
Jordan 472 1623 2225 3254 4972 5703 371,4 156,3 7,38 3,53
Kuwait 152 744 1375 2143 2230 2687 804,6 95,4 7,21 2,38
Lebanon 1443 2390 2698 2741 3398 3577 87,0 32,6 5,74 2,32
Libyan Arab Jamahiriya 1029 1986 3043 4334 5306 5853 195,7 92,3 6,87 3,03
Mauritania 825 1262 1609 2030 2645 3069 95,0 90,7 6,3 5,79
Morocco 8953 15310 19527 24696 29231 31478 118,1 61,2 7,18 2,76
Oman 456 747 1187 1843 2442 2567 160,3 116,3 7,2 3,78
Occupied Palestinian Territory 1005 1096 1476 2154 3150 3702 46,9 150,8 7,38 5,57
Qatar 25 111 229 467 606 813 816,0 255,0 6,97 3,03
Saudi Arabia 3201 5745 9604 16379 21484 24573 200,0 155,9 7,18 4,09
Somalia 2264 3601 6487 6674 7012 8228 186,5 26,8 7,25 6,43
Sudan 9190 14699 19970 26066 32902 36233 117,3 81,4 6,67 4,45 Syrian Arab Republic 3495 6378 8978 12843 16813 19043 156,9 112,1 7,2 3,47
Tunisia 3530 5127 6454 8219 9563 10102 82,8 56,5 6,93 2
United Arab Emirates 70 225 1015 1868 3247 4496 1350,0 343,0 6,97 2,53
Yemen 4316 6327 8197 12086 17937 20975 89,9 155,9 8,2 6,2
Arab Countries 76704 127171 171912 228854 287847 321111 124,1 86,8 7,0 3,8
Less developed regions 1706698 2688915 3359755 4130947 4892218 5253484 96,9 56,4 6,17 2,9
World 2519470 3696588 4442295 5279519 6085572 6464750 76,3 45,5 5,02 2,65
Source: Population Division of the Department of Economic and Social Affairs of the United Nations
Secretariat, World Population Prospects: The 2004 Revision and World Urbanization Prospects: The
2003 Revision, http://esa.un.org/unpp, 16 October 2006; 7:01:38 AM.

43
TABLE 2: Percentage aged less than 15 (per cent)
1950 1970 1980 1990 2000 2005
Arab countries
Algeria 40,1 48,4 45,9 43,1 34,1 29,6
Bahrain 42,3 46 34,6 31,5 28,2 27,1
Comoros 43,5 46,9 48 46,9 43 42
Djibouti 46,8 45,8 45,3 44 42,8 41,5
Egypt 39,7 41,4 41,4 41 35,9 33,6
Iraq 40,5 47,4 47,1 44,6 42,6 41
Jordan 45,7 45,9 49,4 46,8 39,3 37,1
Kuwait 36,2 43,4 40,3 36,6 26 24,4
Lebanon 34,3 42,4 38,1 35,4 30,6 28,6
Libyan Arab Jamahiriya 42 44,9 46,6 43,7 32,8 30,1
Mauritania 43,8 43,2 43,9 43,9 43,3 43
Morocco 44,4 47,6 43 39,7 33,4 31,1
Oman 42,3 47,8 45,6 44,1 36,4 34,5
Occupied Palestinian Territory 45,7 45 47,6 46,7 46,5 45,5
Qatar 42,3 36,7 32,4 27,7 26,2 21,7
Saudi Arabia 42 44,5 44,3 41,6 39,6 37,3
Somalia 41,3 45,5 46,8 45,4 44 44,1
Sudan 43,8 44,3 44,9 43,3 40,5 39,2
Syrian Arab Republic 41,5 47,8 49,1 48,1 40,3 36,9
Tunisia 38,9 46,3 42 38 30,3 26
United Arab Emirates 42,3 34,7 28,6 30 24,6 22
Yemen 42,3 48,6 50 51,7 48,2 46,4
Arab Countries 41,3 45,1 44,3 42,7 37,8 35,5
Less developed regions 30 32,6 27,4 26,6 22,4 21
World 26,8 28,2 24,4 23,8 20,2 19

44
TABLE 3 : Adult (15+) economic activity rate
Country Year Total Men Women Source
Algeria 1977 36.7 71.8 3.8 Population census
1985 38.1 69.4 8.5 Labor force survey
1996 44.9 77.5 11.8 Labor force survey
Bahrain 1985 45.5 73.5 17.2 Official estimates
1987 45.9 73.6 17.8 Official estimates
2001 65.7 86 35.5 Population census
Comoros 1980 53.5 81.7 27.1 Population census
Egypt 1976 43.9 80.7 6.4 Population census
1986 44.4 77.8 9.8 Population census
1995 47.9 73.4 21.6 Labor force survey
2002 43.2 68.7 18.4 Labor force survey
Iraq 1977 48.6 80.2 15.8 Population census
1987 43.9 75.3 10.5 Population census
Jordan 1976 39.9 71.7 8.3 Labor force survey
1991 41.3 69 11.5 Labor force survey
1993 43.7 72.5 12.7 Labor force survey
Kuwait 1970 57.4 87.4 10 Population census
1980 60.5 85.8 20.2 Population census
1985 62.5 83.2 31.1 Population census
1995 68 83.6 43.5 Population census
Lebanon 1975 44.6 73.8 15.4 Official estimates
1997 46.8 Official estimates
Libya 1973 45.7 78 6.5 Population census
Mauritania 1975 48.5 94.6 Population census
Morocco 1971 45.6 80 12.6 Population census
1982 47.2 78.3 16.9 Population census
1990 49.6 74.9 25.1 Labor force survey
1995 52 75.4 30.5 Labor force survey
2003 51.9 77.4 27.3 Labor force survey
Oman 2003 55.3 76.9 24.6 Population census
Qatar 1986 75.5 93 27.5 Population census
1997 72.9 89.2 33.4 Population census
2004 77.1 91.7 40.6 Population census
Saudi Arabia 1992 53.6 80 14.5 Population census
Somalia 1975 64.6 92.7 37.5 Official estimates
Sudan 1973 54.9 89.1 21.6 Population census
1983 57.3 85.2 31 Population census
1996 51.3 74.7 29.1 Official estimates
Syria 1981 43.8 79.1 7.1 Population census
1999 50.9 80.7 20 Labor force survey
2003 47.5 75.3 18.7 Labor force survey
Tunisia 1975 51.7 83.6 19.5 Population census
1984 50.8 79 21.9 Population census
1997 48.6 73.4 23.7 Labor force survey
2005 46.3 68.6 24.4 Labor force survey
United Arab Emirates 1975 73.3 93.3 10.2 Population census
1995 75.2 92.2 31.3 Population census

45
(TABLE 3 continued)
Country Year Total Men Women Source
Canada 1980 61.2 74.5 48.4 Labor force survey
1990 67 75.9 58.4 Labor force survey
2002 66.9 73.3 60.7 Labor force survey
France 1980 55.8 69.1 43.5 Labor force survey
1990 55.9 65.9 46.7 Labor force survey
2002 55.7 62.9 49.1 Labor force survey
Portugal 1980 61.6 79.6 46.2 Labor force survey
1990 58.9 71.7 47.5 Labor force survey
2002 61.8 70.2 54 Labor force survey
United Kingdom 1980 61.1 74.4 48.7 Labor force survey
1990 63 74.4 52.4 Labor force survey
2002 62.6 70.5 54.9 Labor force survey
United States 1980 60.8 73 49.6 Labor force survey
1990 64.4 73.5 56 Labor force survey
2001 63.2 69.6 57.2 Labor force survey
TABLE 4 : Labor Force and Population Growth rates
Labor Force Average
Annual Growth Rate
Women
Economic
Activity Rate
Average natural increase rate 1980-
2005 Per cent Period Per cent Year
Algeria 3,2 1982-2004 11.8 1996 2,3
Bahrain 3,8 1981-2005 35.5 2001 3,0
Comoros 2,2 1980-1991 27.1 1980 2,9
Egypt 2,6 1980-2003 18.4 2002 2,1
Kuwait 2,8 1980-1995 43.5 1995 2,7
Morocco 3,4 1982-2003 27.3 2003 1,9
Qatar 3,1 1986-1997 40.6 2004 5,2
Syrian Arab Republic 4,2 1983-2003 18.7 2003 3,1
Tunisia 2,6 1980-2005 24.4 2005 1,8
United Arab Emirates 6,0 1980-1995 31.3 1995 6,1

46
TABLE 5: Dependency Ratios
1950 1970 1980 1990 2000 2005
Arab countries
Algeria 80 110 99 87 62 52
Bahrain 82 94 58 51 45 43
Comoros 89 98 102 98 84 81
Djibouti 95 92 90 87 83 80
Egypt 74 84 83 82 68 62
Iraq 78 102 100 91 84 78
Jordan 102 96 111 100 73 68
Kuwait 64 82 71 61 38 35
Lebanon 71 90 77 70 60 56
Libyan Arab Jamahiriya 87 91 96 86 57 52
Mauritania 85 85 88 89 87 87
Morocco 90 107 89 77 61 56
Oman 102 94 104 100 100 94
Occupied Palestinian Territory 83 103 92 85 63 59
Qatar 84 62 50 40 38 30
Saudi Arabia 83 91 89 78 73 67
Somalia 78 94 99 93 87 88
Sudan 89 89 91 87 78 75
Syrian Arab Republic 85 104 108 103 76 67
Tunisia 80 100 84 74 56 47
United Arab Emirates 84 61 43 45 35 30
Yemen 86 104 109 116 103 95

47
TABLE 6: Proportion of Women in the Labor Force per age cohort (per cent)
1980 2005
15+ 15-24 15-64 25-34 25-54 35-54 55-64 65+ 15+ 15-24 15-64 25-34 25-54 35-54 55-64 65+
Algeria 25,5 31,5 25,2 22,8 22,3 21,9 24,9 39,5 44,2 42,7 44,5 49,7 46,1 43,0 34,0 28,0
Bahrain 11,9 22,5 12,1 11,8 9,5 6,5 2,1 0,6 23,0 37,7 23,4 31,2 22,8 18,3 2,7 1,4
Comoros 76,0 81,3 76,7 70,6 74,4 77,6 75,5 60,2 66,9 71,3 68,1 68,6 66,8 65,0 66,0 37,4
Djibouti 72,2 73,3 72,4 70,1 72,1 73,7 71,8 62,0 64,7 66,0 65,4 65,5 65,8 66,1 60,4 43,3
Egypt 23,7 15,9 23,3 21,6 27,0 30,3 17,7 33,7 27,8 42,5 28,0 31,6 26,3 22,5 12,2 16,6
Iraq 19,8 24,5 20,2 23,3 19,1 15,3 12,4 5,7 25,3 30,1 25,9 30,4 25,2 20,2 13,4 4,5
Jordan 21,8 34,2 22,2 22,2 18,0 14,8 14,3 8,3 32,4 40,6 32,7 35,2 31,1 27,1 20,7 14,2
Kuwait 14,6 23,0 14,6 17,6 13,4 9,3 5,3 6,0 34,0 58,3 34,2 41,6 32,5 25,2 11,7 2,7
Lebanon 39,6 35,3 40,3 52,0 45,4 40,5 20,6 18,8 43,6 31,3 45,3 54,6 52,8 51,4 20,4 12,4
Libyan Arab Jamahiriya 18,4 28,7 18,5 18,6 16,0 13,9 10,9 12,2 37,3 32,2 38,2 49,9 43,6 38,0 13,3 9,0
Mauritania 68,3 71,2 69,4 69,8 69,9 69,9 59,5 41,6 67,7 68,5 68,8 67,6 69,3 71,0 64,9 44,0
Morocco 27,3 35,0 27,8 26,3 26,0 25,8 14,0 13,1 34,1 34,1 34,7 37,1 36,2 35,5 21,9 16,1
Oman 17,2 22,4 17,2 15,6 15,7 15,8 16,4 19,8 19,6 28,7 19,7 23,1 18,2 13,9 10,2 11,2
Qatar 9,5 5,2 9,6 10,4 10,9 11,4 3,3 2,3 15,9 6,7 16,0 19,6 17,8 16,5 3,9 3,9
Saudi Arabia 8,6 6,9 8,8 10,7 9,7 8,5 3,5 2,6 17,9 15,5 18,1 25,0 19,6 15,2 4,3 2,8
Somalia 67,8 80,0 69,2 63,3 64,8 66,2 51,8 40,0 64,6 75,4 65,9 62,2 62,6 63,0 49,0 32,9
Sudan 36,8 41,6 36,7 32,2 34,1 35,7 38,6 38,1 33,0 39,3 33,1 32,5 31,4 30,4 30,8 30,5
Syrian Arab Republic 30,4 38,1 30,4 27,3 27,4 27,4 23,3 28,1 44,2 50,2 44,4 43,0 42,3 41,6 32,6 35,4
Tunisia 23,3 33,0 23,7 24,2 19,7 16,3 13,9 10,2 38,1 60,3 39,2 43,3 35,5 29,7 17,5 9,7
United Arab Emirates 5,3 6,2 5,3 5,7 5,2 4,3 2,8 3,3 15,5 23,2 15,5 18,6 14,6 11,1 4,5 3,1
West Bank and Gaza Strip 14,3 9,8 14,3 14,1 16,3 18,2 14,8 17,3 15,1 12,6 15,1 16,2 16,0 15,8 13,6 17,9
Yemen 39,5 33,9 39,6 48,2 44,6 41,0 28,2 35,8 38,7 34,5 38,8 47,5 42,8 39,1 24,0 28,0
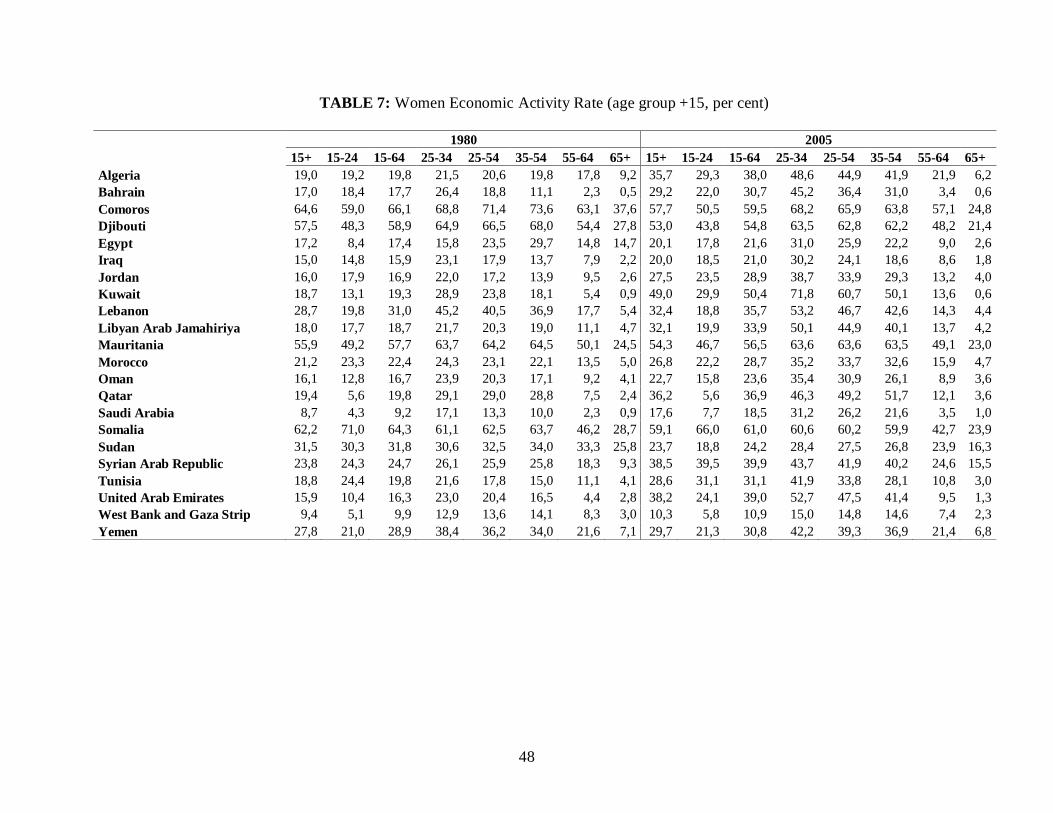
48
TABLE 7: Women Economic Activity Rate (age group +15, per cent)
1980 2005
15+ 15-24 15-64 25-34 25-54 35-54 55-64 65+ 15+ 15-24 15-64 25-34 25-54 35-54 55-64 65+
Algeria 19,0 19,2 19,8 21,5 20,6 19,8 17,8 9,2 35,7 29,3 38,0 48,6 44,9 41,9 21,9 6,2
Bahrain 17,0 18,4 17,7 26,4 18,8 11,1 2,3 0,5 29,2 22,0 30,7 45,2 36,4 31,0 3,4 0,6
Comoros 64,6 59,0 66,1 68,8 71,4 73,6 63,1 37,6 57,7 50,5 59,5 68,2 65,9 63,8 57,1 24,8
Djibouti 57,5 48,3 58,9 64,9 66,5 68,0 54,4 27,8 53,0 43,8 54,8 63,5 62,8 62,2 48,2 21,4
Egypt 17,2 8,4 17,4 15,8 23,5 29,7 14,8 14,7 20,1 17,8 21,6 31,0 25,9 22,2 9,0 2,6
Iraq 15,0 14,8 15,9 23,1 17,9 13,7 7,9 2,2 20,0 18,5 21,0 30,2 24,1 18,6 8,6 1,8
Jordan 16,0 17,9 16,9 22,0 17,2 13,9 9,5 2,6 27,5 23,5 28,9 38,7 33,9 29,3 13,2 4,0
Kuwait 18,7 13,1 19,3 28,9 23,8 18,1 5,4 0,9 49,0 29,9 50,4 71,8 60,7 50,1 13,6 0,6
Lebanon 28,7 19,8 31,0 45,2 40,5 36,9 17,7 5,4 32,4 18,8 35,7 53,2 46,7 42,6 14,3 4,4
Libyan Arab Jamahiriya 18,0 17,7 18,7 21,7 20,3 19,0 11,1 4,7 32,1 19,9 33,9 50,1 44,9 40,1 13,7 4,2
Mauritania 55,9 49,2 57,7 63,7 64,2 64,5 50,1 24,5 54,3 46,7 56,5 63,6 63,6 63,5 49,1 23,0
Morocco 21,2 23,3 22,4 24,3 23,1 22,1 13,5 5,0 26,8 22,2 28,7 35,2 33,7 32,6 15,9 4,7
Oman 16,1 12,8 16,7 23,9 20,3 17,1 9,2 4,1 22,7 15,8 23,6 35,4 30,9 26,1 8,9 3,6
Qatar 19,4 5,6 19,8 29,1 29,0 28,8 7,5 2,4 36,2 5,6 36,9 46,3 49,2 51,7 12,1 3,6
Saudi Arabia 8,7 4,3 9,2 17,1 13,3 10,0 2,3 0,9 17,6 7,7 18,5 31,2 26,2 21,6 3,5 1,0
Somalia 62,2 71,0 64,3 61,1 62,5 63,7 46,2 28,7 59,1 66,0 61,0 60,6 60,2 59,9 42,7 23,9
Sudan 31,5 30,3 31,8 30,6 32,5 34,0 33,3 25,8 23,7 18,8 24,2 28,4 27,5 26,8 23,9 16,3
Syrian Arab Republic 23,8 24,3 24,7 26,1 25,9 25,8 18,3 9,3 38,5 39,5 39,9 43,7 41,9 40,2 24,6 15,5
Tunisia 18,8 24,4 19,8 21,6 17,8 15,0 11,1 4,1 28,6 31,1 31,1 41,9 33,8 28,1 10,8 3,0
United Arab Emirates 15,9 10,4 16,3 23,0 20,4 16,5 4,4 2,8 38,2 24,1 39,0 52,7 47,5 41,4 9,5 1,3
West Bank and Gaza Strip 9,4 5,1 9,9 12,9 13,6 14,1 8,3 3,0 10,3 5,8 10,9 15,0 14,8 14,6 7,4 2,3
Yemen 27,8 21,0 28,9 38,4 36,2 34,0 21,6 7,1 29,7 21,3 30,8 42,2 39,3 36,9 21,4 6,8

49
TABLE 8: Gender Gap in Economic Activity (per cent)
1980 2005
15+ 15-24 15-64 25-34 25-54 35-54 55-64 65+ 15+ 15-24 15-64 25-34 25-54 35-54 55-64 65+
Algeria 56,8 39,4 59,7 74,3 75,0 75,7 58,5 17,5 44,5 36,7 45,5 46,5 50,3 53,4 49,0 20,8
Bahrain 69,0 46,1 69,4 72,3 79,6 86,8 76,7 46,2 58,3 32,9 58,6 53,8 62,3 67,5 76,2 37,6
Comoros 22,4 12,3 21,2 28,5 26,3 24,5 32,1 43,7 29,4 19,2 27,8 30,5 32,5 34,4 38,0 58,9
Djibouti 24,4 17,5 23,8 27,8 27,1 26,4 32,0 31,2 29,9 21,6 29,1 32,2 32,8 33,3 38,3 40,5
Egypt 56,3 43,1 57,4 61,5 64,0 65,4 76,1 38,0 53,1 23,2 55,3 66,2 72,5 77,1 68,4 16,9
Iraq 60,5 43,5 61,2 72,8 74,6 76,0 60,4 43,8 57,8 40,6 58,2 66,0 68,9 71,6 58,7 44,9
Jordan 53,3 29,0 54,7 72,4 75,6 77,7 54,5 29,1 49,7 31,7 50,8 58,4 61,0 63,4 48,2 23,9
Kuwait 61,4 31,6 62,1 70,0 73,6 77,9 58,5 13,2 36,0 15,1 36,0 27,3 36,3 45,2 54,0 15,8
Lebanon 48,2 38,1 49,8 47,1 54,6 60,4 70,9 28,4 47,2 39,6 48,2 43,4 50,2 54,5 67,1 36,5
Libyan Arab Jamahiriya 63,5 40,1 64,5 74,0 76,3 78,3 73,2 34,2 48,3 39,6 48,9 47,0 52,1 56,8 65,9 38,2
Mauritania 29,3 20,9 28,6 32,3 32,1 32,1 38,6 41,2 29,6 21,3 28,6 32,0 32,2 32,5 38,3 40,5
Morocco 58,8 44,8 61,2 68,5 71,5 74,1 72,2 31,3 54,3 41,1 55,1 58,7 61,3 63,3 68,4 34,1
Oman 62,9 39,3 64,2 73,2 76,7 79,8 65,0 21,8 58,2 36,3 59,1 62,9 66,4 70,3 58,7 26,6
Qatar 70,8 61,1 70,8 70,4 70,3 70,3 79,4 58,9 52,8 47,0 52,7 49,6 47,6 45,8 76,1 48,1
Saudi Arabia 67,7 45,1 68,8 81,1 82,8 83,9 60,6 37,0 60,7 39,0 61,9 65,7 69,7 73,5 66,3 31,6
Somalia 33,2 19,2 31,5 38,2 37,0 36,0 50,6 59,3 35,7 21,8 34,1 38,8 39,3 39,7 53,5 63,4
Sudan 55,4 41,2 55,4 64,5 64,0 63,6 60,9 54,8 48,2 27,5 48,3 57,4 59,9 62,1 59,1 46,4
Syrian Arab Republic 55,8 38,6 57,1 70,2 70,5 70,6 65,5 29,3 49,1 36,5 49,3 56,2 57,4 58,5 56,2 38,0
Tunisia 61,4 46,2 64,1 74,7 78,8 81,8 60,2 28,4 46,4 18,3 47,3 52,1 61,0 67,4 54,7 32,6
United Arab Emirates 78,6 71,4 78,6 76,2 78,6 82,1 80,5 61,4 53,2 39,0 53,0 46,2 51,6 57,8 83,1 30,9
West Bank and Gaza Strip 54,0 40,6 56,5 73,3 72,2 71,4 47,3 15,1 56,2 37,9 57,9 71,9 72,2 72,4 50,5 15,8
Yemen 45,8 38,1 46,7 42,9 52,5 63,2 71,8 18,7 45,7 37,5 46,7 42,1 51,7 60,4 71,2 20,2

50
TABLE 9: Unemployment Rate (per cent)
Men Women Year Source
Algeria 17.5 18.1 2004 Labor force survey
Bahrain 9.4 6.7 2001 Population census
Egypt 6.3 23.9 2002 Labor force survey
Jordan 12.3 21.1 2000
Kuwait 1 1.7 2002 Administrative reports
Lebanon 8.6 7.2 1997
Morocco 11.5 13 2003 Labor force survey
Oman 14.2 37 1996
Qatar 2.3 12.6 2001 Labor force survey
Saudi Arabia 4.2 11.5 2002 Labor force survey
Syrian Arab Republic 8.3 24.1 2002 Labor force survey
Tunisia 13.2 17.1 2004 Labor force survey
United Arab Emirates 2.2 2.6 2000
West Bank and Gaza Strip 28 20 2004 Labor force survey
TABLE 10: Urbanization Rate (per cent)
1960 2005
Algeria 30,4 60
Bahrain 82,3 90,2
Comoros 10 36,3
Djibouti 46,6 84,6
Egypt 37,9 42,3
Iraq 42,9 66,8
Jordan 50,9 79,3
Kuwait 72,3 96,4
Lebanon 39,6 88
Libyan Arab Jamahiriya 22,7 86,9
Mauritania 5,8 64,3
Morocco 29,2 58,8
Occupied Palestinian Territory 44 71,9
Oman 3,5 78,6
Qatar 80 92,3
Saudi Arabia 30,2 88,5
Somalia 17,3 35,9
Sudan 10,3 40,8
Syrian Arab Republic 36,8 50,3
Tunisia 36 64,4
United Arab Emirates 72,1 85,5
Yemen 9,1 26,3
Arab Countries 30,2 57,1

51
TABLE 11: Urban/rural migration by type of movement, Egypt, 1976–1996
Census Year
1976 1986 1996
Urban–Urban 2 577 959 3 003 054 2 535 864
64,3% 72,9% 60,4%
Rural–Urban 984 469 540 933 562 471
24,6% 13,1% 13,4%
Urban–Rural 260 295 422 955 949 489
6,5% 10,3% 22,6%
Rural–Rural 186 724 152 296 147 611
4,7% 3,7% 3,5%
Total 4 009 447 4 119 238 4 195 435
Source: Calculated for the 1976, 1986, and 1996 census data
(CAPMAS, 1979, 1989 and 1999)
TABLE 12: Estimated migrant stocks circa 2000 in the Arab region
Country Thousands Proportion of total
population (%)
Qatar 409 70.4
United Arab Emirates 1,922 68.2
Kuwait 1,108 49.3
Jordan 1,945 38.6
Bahrain 254 37.6
Oman 682 26.1
Saudi Arabia 5,255 23.7
Lebanon 634 18.2
Libyan Arab Jamahiriya 570 10.9
Syrian Arab Republic 903 5.5
Yemen 284 1.4
Algeria 250 0.8
Tunisia 38 0.4
Egypt 169 0.2
Morocco 26 0.1
Source: United Nations 2004, , World Population Policies,
2003, New York: United Nations

52
TABLE 13: Percentage of nationals and expatriates in the population of GCC countries,
1995-2000
Country 1975 1980 1985 1995 2000 2001-2002
BAHRAIN
Nationals 77.1 69.3 63.5 61.8 60.0 60.0
Expatriates 22.9 30.7 36.5 38.2 40.0 40.0
Total ('OOOs) 261.6 336.7 434.7 586.1 651.8 690.0
KUWAIT
Nationals 30.9 28.5 27.7 36.1 37.4c 37.0
Expatriates 69.1 71.5 72.3 63.9 62.6 63.0
Total (`OOOs) 994.9 971.3 1,697.3 1,958.8 2,363.3 2,36
OMAN
Nationals 86.9 81.8 81.6 72.7 73.3 74.0
Expatriates 13.1 18.2 18.4 27.3 22.7 26.0
Total ('OOOs) 766.0 984.0 1,193.0 2,149.0 2,441.8 2,42
QATAR
Nationals 43.1 40.9 47.7 29.6 26.3 28.0
Expatriates 56.9 59.1 52.3 70.4 73.7 72.0
Total ('OOOs) 147.7 206.6 241.0 547.0 580.3 585
SAUDI ARABIA
Nationals 86.7 75.4 69.3 67.9 74.6 70.0
Expatriates 13.3 24.6 30.7 32.1 25.4 30.0
Total ('000s) 7,026.3 9,688.0 12,642.2 19,534.0 20,278.8 23
UAE
Nationals 37.0 28.7 36.2 25.1 24.3 20.0
Expatriates 63.0 71.3 63.8 74.9 75.7 80.0
Total ('OOOs) 525.1 977.4 1,116.8 2,378.0 2,889.6 23
All GCC countries
Nationals 77.4 67.1 63.5 61.4 65.1 61.5
Expatriates 22.6 32.9 36.5 38.6 34.9 38.5
Total ('OOOs) 9,721.6 13,550.7 17,325.0 27,152.9 29,321.7 1 32.5 I
Sources: Girgis, 2002; ESCWA, 2001 (Data for 2000); PACI, 2002
d) Sources: for Bahrain, Oman, Qatar, Saudi Arabia and the UAE: The 2001 annual report by the GCC secretariat,
released July 27, 2002 as well as The Economist Country Reports from mid-2002; for Saudi Arabia reports by
different Saudi ministries were used as well; for Kuwait: Ministry of Planning data.

53
TABLE 14: Unemployment by level of education (per cent)
Country Year Sex Primary Secondary Tertiary Type of source
Algeria 1991 MF 54,6 25,6 5,8 Household or labor force survey
1995 MF 55,6 20,7 15,7
Bahrain 1997 MF 42,5 43,2 13,1 Employment official records
1997 M 52,1 36,9 10,0
1997 F 23,3 55,9 19,6
2004 MF 32,5 41,1 19,9
2004 M 45,0 38,1 9,8
2004 F 20,6 44,0 29,5
Djibouti 1991 MF 8,4 25,0 0,3 Household or labor force survey
1991 M 11,3 23,7 0,3
1991 F 3,2 27,1 0,5
Kuwait 1995 MF 49,1 29,4 6,3 Population census
1995 M 53,3 26,3 3,9
1995 F 29,7 44,9 17,7
2002 MF 27,5 39,9 6,1 Administrative reports
2002 M 36,6 28,8 2,9
2002 F 12,2 58,8 11,4
Morocco 1990 MF 53,6 21,1 9,6 Household or labor force survey
1990 M 58,2 19,1 9,2
1990 F 44,4 25,2 10,5
2003 MF 50,9 20,6 19,3
2003 M 57,6 19,4 14,3
2003 F 34,5 23,4 31,4
Oman 1996 MF 43,7 35,3 4,4 Household or labor force survey
1996 M 53,1 21,6 4,0
1996 F 19,8 70,0 5,4
Qatar 1997 MF 24,3 28,8 21,5 Population census
1997 M 28,1 26,1 13,0
1997 F 16,0 34,6 39,8
Saudi Arabia 1999 MF 43,9 31,5 15,8 Household or labor force survey
1999 M 55,7 27,1 6,9
1999 F 13,2 42,9 39,1
2002 MF 38,3 34,7 20,1
2002 M 52,1 31,6 6,5
2002 F 8,2 41,6 49,6
Syrian Arab Republic 2002 MF 75,2 10,3 9,8 Household or labor force survey
Tunisia 1989 MF 51,2 25,8 1,3 Population census
1989 M 53,4 26,0 1,3
1989 F 45,7 25,4 1,5
1994 MF 47,7 26,1 1,7
1994 M 50,5 26,0 1,4
1994 F 39,8 26,6 2,4
2003 MF 43,4 37,4 10,0 Household or labor force survey
United Arab Emirates 1995 MF 40,0 23,0 20,3 Population census
1995 M 45,0 20,8 15,2 Household or labor force survey
1995 F 12,6 35,5 49,0
1996 MF 28,4 14,6 14,9
1996 M 30,2 14,1 10,0
1996 F 14,3 18,1 53,0
2003 MF 57,5 14,5 17,6
2003 M 63,0 15,0 10,7 Household or labor force survey
2003 F 15,0 10,4 71,5
Source: KILM 4th Edition, ILO, 200

54
Table 15: Technical/vocational enrolment in ISCED 3
as % of total enrolment in ISCED 3
Country\Year 2003 2004 2005
Algeria 16.1 19.8 21.3
Bahrain 49.0 48.5 48.2
Djibouti 20.4 19.3 18.7
Egypt 63.9 63.3 57.1
Jordan 19.6 20.5 17.5
Kuwait 10.6 11.6 9.0
Lebanon 26.7 27.0 26.3
Libyan Arab Jamahiriya 49.0
Morocco 12.7 11.7 12.0
Palestinian Autonomous Territories 4.6 4.5 4.8
Qatar 2.4 2.0 2.0
Saudi Arabia 3.5 3.5 3.5
Sudan 5.3 4.4 2.9
Syrian Arab Republic 31.4 31.5 28.2
Tunisia 3.0 5.7 6.4
United Arab Emirates 1.7 1.6 1.3
Yemen 1.7 1.6 1.7
Comoros 0.5 1.2 1.2
Australia 64.2 62.5 61.8
Japan 24.7 24.6 24.7
Belgium 70.2 55.7 55.5
Denmark 53.3 55.0 54.4
Finland 58.8 52.4 53.2
France 56.4 56.2 56.1
Germany 62.2 61.2 60.3
Greece 36.0 34.0 36.1
Iceland 34.0 38.7 38.7
Italy 26.0 62.8 61.5
Netherlands 69.1 69.2 68.5
Norway 59.2 60.5 60.8
Portugal 28.1 30.2 32.9
Spain 37.2 38.7 42.6
Sweden 49.0 57.5 57.7
Switzerland 65.0 64.8 64.7
United Kingdom 33.2 38.4 39.2
Source: UNESCO, http://stats.uis.unesco.org/, consulted 12 June 2007

55
TABLE 16: Youth unemployment (per cent)
Country Year Sex
Youth
unemployment
rate (%)
Ratio of youth
unemployment rate
to adult unemployment rate
Share of youth
unemployed to
total unemployed (%)
Share of youth
unemployed in
youth population (%)
Type of source
Algeria 2004 MF 43,4 3,1 45,6 Household or labor force survey
2004 M 42,8 3,2 46,3 Household or labor force survey
2004 F 46,3 3,0 42,4 Household or labor force survey
Egypt 2002 MF 27,1 4,8 57,0 8,1 Household or labor force survey
2002 M 21,4 7,6 64,2 8,3 Household or labor force survey
2002 F 40,0 2,4 50,3 7,8 Household or labor force survey
Jordan 2003 MF 30,3 3,7 58,6 8,4 Household or labor force survey
2003 M 28,0 3,6 57,9 12,5 Household or labor force survey
2003 F 43,2 3,7 59,2 3,8 Household or labor force survey
Morocco 2003 MF 17,0 1,7 35,9 7,3 Household or labor force survey
2003 M 17,4 1,8 37,6 10,8 Household or labor force survey
2003 F 15,9 1,3 31,7 3,8 Household or labor force survey
Qatar 1997 MF 14,6 12,0 52,6 4,9 Population census
1997 M 10,6 10,8 52,2 5,5 Population census
1997 F 74,7 27,9 53,6 4,0 Population census
Saudi Arabia 2002 MF 58,7 Household or labor force survey
2002 M 60,5 Household or labor force survey
2002 F 54,7 Household or labor force survey
Syrian Arab Republic 2002 MF 26,3 6,7 78,2 13,7 Household or labor force survey
2002 M 21,4 9,7 82,1 15,6 Household or labor force survey
2002 F 38,9 3,3 73,3 11,7 Household or labor force survey
United Arab Emirates 2000 MF 47,0 Official estimates
2000 M 45,8 Official estimates
2000 F 53,5 Official estimates
West Bank and Gaza Strip 2004 MF 39,8 1,7 33,7 10,2 Household or labor force survey
2004 M 38,9 1,6 32,2 16,6 Household or labor force survey
2004 F 44,8 3,2 44,1 3,4 Household or labor force survey
Yemen 1999 MF 48,4 Household or labor force survey
1999 M 46,9 Household or labor force survey
1999 F 55,8 Household or labor force survey
Source: KILM 4th Edition, ILO, 2005

56
TABLE 17: GDP per person employed (1980=100)
Algeria Egypt Iraq Jordan Morocco Saudi Arabia Sudan
Syrian Arab
Republic
United Arab
Emirates Yemen
1980 100 100 100 100 100 100 100 100 100 100
1981 98,5 101,4 79,7 100,2 94,8 101,4 98,8 106,1 100,3 102,0
1982 100,8 109,4 77,0 102,8 101,4 96,7 107,8 104,6 87,3 99,9
1983 101,8 114,9 68,4 100,3 98,3 81,1 106,6 102,6 78,7 102,0
1984 103,2 118,8 66,8 104,3 99,9 76,1 98,1 95,1 77,8 102,3
1985 104,3 123,5 64,0 103,6 103,5 66,9 89,1 97,5 70,1 98,2
1986 99,6 123,7 61,6 108,3 108,9 59,3 90,3 90,6 53,9 97,1
1987 95,4 123,8 61,6 106,7 103,9 58,6 90,2 89,9 52,9 97,7
1988 90,2 126,0 47,3 101,4 111,8 57,2 89,3 98,7 50,1 98,4
1989 90,2 126,8 42,0 87,1 111,7 56,2 94,3 87,0 52,6 98,1
1990 85,9 127,0 40,4 83,4 113,3 60,9 85,0 90,8 55,8 94,3
1991 81,1 125,9 14,4 73,1 118,0 65,4 91,2 97,6 54,1 85,4
1992 78,8 117,1 17,9 77,7 110,4 66,2 85,3 104,9 52,9 86,8
1993 73,9 117,2 17,3 75,0 106,6 65,1 88,2 102,6 51,2 89,6
1994 70,3 118,9 15,8 73,2 114,9 64,8 87,3 105,3 52,3 89,5
1995 70,2 121,0 13,9 72,8 104,9 64,5 87,1 108,0 51,4 97,5
1996 70,0 123,3 15,2 71,1 114,9 63,3 89,9 113,6 52,8 102,2
1997 68,1 126,8 14,1 70,3 109,7 62,9 95,5 114,5 53,7 106,2
1998 69,0 132,4 15,8 69,4 115,4 62,6 98,3 117,4 50,9 109,1
1999 68,7 136,5 16,7 68,5 112,7 60,2 102,0 108,9 49,6 110,3
2000 67,8 139,8 18,1 68,3 111,2 61,1 106,6 105,3 52,0 112,4
2001 67,0 140,2 19,1 68,9 115,3 59,3 110,1 105,1 50,1 114,0
2002 67,2 140,2 19,9 69,6 116,2 57,3 113,6 105,4 47,4 114,9
2003 69,1 140,2 15,1 69,4 119,4 59,2 117,0 104,2 47,2 114,9
Source: KILM 4th Edition, ILO, 2005

57
TABLE 17’: GDP per person employed (1980=100)
Canada France Indonesia Israel Italy Japan
Republic
of Korea Malaysia Turkey
United
Kingdom
United
States
1980 100 100 100 100 100 100 100 100 100 100 100
1981 100,2 101,5 93,2 102,5 100,6 102,3 103,6 102,3 103,4 101,4 101,4
1982 100,2 103,8 91,8 101,9 100,8 104,4 108,7 104,5 107,5 105,0 100,3
1983 102,3 105,1 95,5 103,0 101,7 105,1 120,2 107,2 110,3 109,5 103,2
1984 105,5 107,5 98,2 102,1 104,3 108,5 131,3 112,7 114,9 109,9 106,3
1985 108,1 109,4 96,8 103,2 106,3 112,5 134,8 110,3 118,7 112,4 108,2
1986 107,7 111,4 93,7 105,9 108,5 114,9 145,2 110,1 124,7 116,6 109,5
1987 108,9 113,8 95,4 111,2 111,6 118,5 153,6 110,6 132,5 119,7 110,4
1988 110,9 117,7 97,9 111,0 114,7 123,7 165,6 116,6 135,6 121,6 112,6
1989 111,1 120,7 105,4 109,5 117,2 127,2 169,3 123,3 133,7 121,1 114,1
1990 110,6 122,5 111,1 112,6 117,9 131,1 180,0 129,1 143,5 121,0 114,7
1991 110,0 123,5 120,1 112,6 117,3 132,9 190,7 137,2 139,2 122,6 115,4
1992 112,0 126,0 125,4 115,3 118,8 132,8 197,2 145,0 146,2 125,8 118,3
1993 114,1 126,6 133,3 115,5 120,8 132,9 205,6 152,9 166,2 129,9 119,5
1994 117,1 129,0 138,4 121,1 125,3 134,3 215,7 162,5 145,3 132,9 121,4
1995 118,3 129,9 153,4 124,5 129,1 136,8 228,4 177,5 151,3 136,7 122,5
1996 119,1 130,8 154,6 126,5 129,7 140,8 239,3 177,7 157,3 139,2 125,2
1997 121,4 132,5 162,4 126,7 131,8 141,9 246,1 186,9 169,1 141,2 127,8
1998 123,3 134,4 137,4 127,3 132,8 141,2 243,9 172,5 169,7 144,0 131,0
1999 126,9 136,0 136,7 126,2 133,5 142,4 262,4 178,2 159,7 146,2 134,6
2000 130,3 137,3 141,8 131,6 135,0 146,8 273,1 184,4 175,2 150,0 137,5
2001 130,9 137,7 145,2 126,6 134,7 148,3 278,1 183,3 162,5 152,2 138,4
2002 132,2 138,6 149,1 122,5 132,8 149,7 289,4 187,1 176,8 153,7 141,4
2003 131,8 139,5 156,7 121,0 131,7 151,9 298,8 190,3 188,8 155,6 145,0
Source: KILM 4th Edition, ILO, 2005

58
Table 18. The Coefficient on Years of Schooling. Mincerian Rate of Return, Latest Year
Country Year Mean years
of schooling
Coefficient
(percent) Source
Argentina 1989 9.1 10.
3
Psacharopoulos (1994)
Australia 1989 .. 8.0 Cohn and Addison (1998)
Austria 1993 .. 7.2 Fersterer and Winter-Ebmer (1999)
Bolivia 1993 .. 10.
7
Patrinos (1995)
Botswana 1979 3.3 19.
1
Psacharopoulos (1994)
Brazil 1989 5.3 14.7
Psacharopoulos (1994)
Burkina Faso 1980 .. 9.6 Psacharopoulos (1994)
Canada 1989 .. 8.9 Cohn (1997)
Chile 1989 8.5 12.
0
Psacharopoulos (1994)
China 1993 .. 12.
2
Hossain (1997)
Colombia 1989 8.2 14.
0
Psacharopoulos (1994)
Costa Rica 1991 .. 8.5 Funkhouser (1996)
Cote d'Ivoire 1986 6.9 20.
1
Psacharopoulos (1994)
Cyprus 1994 .. 5.2 Menon (1995)
Denmark 1990 .. 4.5 Christensen and Westergard-Nielsen (1999)
Dominican Rep. 1989 8.8 9.4 Psacharopoulos (1994)
Ecuador 1987 9.6 11.8
Psacharopoulos (1994)
Egypt 1997 .. 5.2 Lambropoulos and Karadjia (1999)
El Salvador 1992 .. 7.6 Funkhouser (1996)
Estonia 1994 10.9 5.4 Kroncke (1999)
Ethiopia 1972 6.0 8.0 Psacharopoulos (1994)
Finland 1993 .. 8.2 Asplund (1999)
France 1977 6.2 10.
0
Psacharopoulos (1994)
Germany 1988 .. 7.7 Cohn and Addison (1998)
Ghana 1995 9.7 7.1 Jones (2001)
Greece 1993 .. 7.6 Magoula and Psacharopoulos (1999)
Guatemala 1989 4.3 14.
9
Psacharopoulos (1994)
Honduras 1991 .. 9.3 Funkhouser (1996)
Hong Kong 1981 9.1 6.1 Psacharopoulos (1994)
Hungary 1987 11.3 4.3 Psacharopoulos (1994)
India 1995 .. 10.
6
Kingdon (1998)
Indonesia 1995 8.0 7.0 Duflo (2000)
Iran 1975 .. 11.
6
Psacharopoulos (1994)
Israel 1979 11.2 6.4 Psacharopoulos (1994)
Italy 1987 .. 2.7 Brunello, Comi and Lucifora (1999)
Jamaica 1989 7.2 28. Psacharopoulos (1994)
59
Country Year Mean years
of schooling
Coefficient
(percent) Source
8
Japan 1988 .. 13.
2
Cohn and Addison (1998)
Kenya 1986 8.0 16.
0
Dabalen (1998)
Korea 1986 8.0 13.
5
Ryoo, Nam and Carnoy (1993)
Kuwait 1983 8.9 4.5 Psacharopoulos (1994)
Malaysia 1979 15.8 9.4 Psacharopoulos (1994)
Mexico 1992 .. 7.6 Psacharopoulos et al. (1996)
Morocco 1970 2.9 15.
8
Psacharopoulos (1994)
Nepal 1999 3.9 9.7 Parajuli (1999)
Netherlands 1994 .. 6.4 Hartog, Odink and Smits (1999)
Nicaragua 1996 .. 12.
1
Belli and Ayadi (1998)
Norway 1995 .. 5.5 Barth and Roed (1999)
Pakistan 1991 .. 15.
4
Katsis, Mattson and Psacharopoulos (1998)
Panama 1990 9.2 13.
7
Psacharopoulos (1994)
Paraguay 1990 9.1 11.
5
Psacharopoulos (1994)
Peru 1990 10.1 8.1 Psacharopoulos (1994)
Philippines 1998 8.8 12.
6
Schady (2000)
Poland 1995-96 .. 7.0 Nesterova and Sabirianova (1998)
Portugal 1991 .. 8.6 Cohn and Addison (1998)
Puerto Rico 1989 .. 15.
1
Griffin and Cox Edwards (1993)
Russian Federation 1996 11.7 7.2 Nesterova and Sabirianova (1998)
Singapore 1998 9.5 13.
1
Sakellariou (2001)
South Africa 1994 7.1 4.1 Dabalen (1998)
Spain 1991 .. 7.2 Mora (1999)
Sri Lanka 1981 4.5 7.0 Psacharopoulos (1994)
Sudan 1989 10.2 9.3 Cohen and House (1994)
Sweden 1991 .. 5.0 Cohn and Addison (1998)
Switzerland 1991 .. 7.5 Weber and Wolter (1999)
Taiwan 1972 9.0 6.0 Psacharopoulos (1994)
Tanzania 1980 .. 11.
9
Psacharopoulos (1994)
Thailand 1989 .. 11.
5
Patrinos (1995)
Tunisia 1980 4.8 8.0 Psacharopoulos (1994)
United Kingdom 1987 11.8 6.8 Psacharopoulos (1994)
United States 1991-95 .. 10.
0
Rouse (1999)
Uruguay 1989 9.0 9.7 Psacharopoulos (1994)
Venezuela 1992 .. 9.4 Psacharopoulos and Mattson (1998)
Vietnam 1992 7.9 4.8 Moock, Patrinos and Venkataraman (1998)

60
Country Year Mean years
of schooling
Coefficient
(percent) Source
Yugoslavia 1986 .. 4.8 Bevc (1993)

61
TABLE 19: Agricultural labor among workers (%) 1995 2000 2001 2002 2003 2004 2005
Algeria 25,4 24,4 24,1 23,8 23,6 23,3 23,0
Bahrain 1,5 0,9 0,9 0,9 0,9 0,9 0,8
Djibouti 80,4 78,5 78,1 77,9 77,4 77,0 76,5
Egypt 37,0 33,6 32,9 32,2 31,5 30,8 30,2
Iraq 12,8 10,1 9,6 9,2 8,7 8,3 7,9
Jordan 13,0 11,4 11,1 10,7 10,4 10,1 9,8
Kuwait 1,8 1,6 1,6 1,6 1,6 1,8 1,9
Lebanon 5,2 3,7 3,5 3,2 3,1 2,9 2,7
Libya 8,1 6,0 5,6 5,3 4,9 4,6 4,3
Mauritania 54,1 52,9 52,7 52,4 52,1 51,9 51,7
Morocco 40,2 36,1 35,3 34,6 33,8 33,1 32,4
Oman 41,2 36,9 36,1 35,2 34,3 33,5 32,6
Qatar 1,7 1,2 1,2 1,2 1,2 1,2 1,2
Saudi Arabia 13,9 6,1 6,0 4,7 7,9 9,5 11,2
Sudan 65,4 61,1 60,2 59,3 58,3 57,4 56,6
Syria 30,5 28,0 27,5 27,1 26,6 26,2 25,7
Tunisia 26,5 24,6 24,2 23,9 23,5 23,1 22,8
United Arab Emirates 6,2 4,9 4,7 4,4 4,2 4,0 3,8
Yemen 55,3 50,4 49,4 48,4 47,4 46,4 45,4
Arab Countries 33,6 31,6 31,0 30,4 29,5 29,0 28,6
Source: Unified Arab Economic Report, 2006
TABLE 20: Agriculture, value added (% of GDP) 1995 2000 2001 2002 2003 2004 2005
Algeria 10,5 8,9 10,4 10,0 10,5 10,2 8,5
Comoros 40,9 48,6 50,0 50,2 50,5 50,9 51,0
Djibouti 3,2 3,5 3,5 3,6 3,6 3,6 3,7
Egypt 16,8 16,7 16,6 16,5 16,7 15,2 14,9
Iraq .. 5,4 8,1 9,0 8,6 .. ..
Jordan 4,3 2,3 2,3 2,5 2,8 2,8 2,8
Kuwait 0,4 0,4 0,4 0,5 0,5 .. ..
Lebanon 7,3 7,3 6,8 6,8 6,6 6,5 6,5
Mauritania 37,4 27,6 27,0 25,8 27,5 25,6 23,7
Morocco 14,6 13,8 15,6 16,1 16,7 15,9 14,1
Oman 2,8 2,0 2,1 2,1 2,0 1,9 ..
Saudi Arabia 5,9 4,9 5,2 5,1 4,5 4,0 ..
Sudan 32,4 41,8 42,9 41,6 39,3 35,4 33,7
Syria 31,6 23,8 27,0 26,8 26,7 24,8 23,3
Tunisia 11,4 12,3 11,6 10,3 12,1 12,7 11,6
United Arab Emirates 2,9 3,5 3,5 3,4 2,9 2,6 2,3
Yemen 20,0 10,3 11,5 11,1 14,3 13,8 13,3
Source: WDI, 2006

62
TABLE 21: Alternative Scenarios for Labor Force Absorption
Scenario
Growth rate of Investment/GDP Implied Growth
of GDP L K A a=0.5 a=0.6 a=0.7 a=0.5 a=0.6 a=0.7
1 3,50% 8,5% 7,7% 7,1% -0,50% 40,5% 38,0% 36,2% 5,5%
2 3,50% 7,5% 6,8% 6,4% 0,00% 37,5% 35,5% 34,1% 5,5%
3 3,50% 6,5% 6,0% 5,6% 0,50% 34,5% 33,0% 31,9% 5,5%
4 3,50% 3,5% 3,5% 3,5% 2,00% 25,5% 25,5% 25,5% 5,5%
5 4,00% 9,0% 8,2% 7,6% -0,50% 42,0% 39,5% 37,7% 6,0%
6 4,00% 8,0% 7,3% 6,9% 0,00% 39,0% 37,0% 35,6% 6,0%
7 4,00% 7,0% 6,5% 6,1% 0,50% 36,0% 34,5% 33,4% 6,0%
8 4,0% 4,0% 4,0% 2,00% 27,0% 27,0% 27,0% 4,0% 6,0%
TABLE 22: Expenditures on Active and Passive Labor Market Programs in Selected MENA
Countries, 2003
Source: Razmara (2005), "Labor Markets Worldwide: Key Trends and Policy Issues", available on internet at http://info.worldbank.org/etools/docs/library/206981/presentation%20employment%20programs%20setareh.pdf

63
Previous Publications
No Author Title
API/WPS 9701 انفرص وانزحذبد: انفط وانزخ انسزذخ ف األلطبر انؼرثخ خم طبهر
API/WPS 9702 Riad Dahel Project Financing and Risk Analysis
API/WPS 9801 Imed Limam A SOCIO-ECONOMIC TAXONOMY OF ARAB COUNTRIES
API/WPS 9802 يحذ ػذب ودغ
ثهمبسى انؼجبسانؼهىيبد ألسىاق انؼم نخهدخيظىيبد
API/WPS 9803 Adil Abdalla The Impact of Euro-Mediterranean Partnerships on Trade Interests of the
OIC Countries
API/WPS 9804 ربض دهبل
حس انحبج حىل طرق انخصخصخ
API/WPS 9805
Ujjayant Chakravorty
Fereidun Fesharaki
Shuoying Zhou
DOMESTIC DEMAMD FOR PETROLEUM PRODUCTS IN OPEC
API/WPS 9806 Imed Limam
Adil Abdalla Inter-Arab Trade and the Potential Success of AFTA
API/WPS 9901 Karima Aly Korayem Priorities of Social Policy Measures and the Interset of Low-Income
People; the Egyptian Case
API/WPS 9902 Sami Bibi A Welfare Analysis of the Price System Reforms’ Effects on Poverty in
Tunisia
API/WPS 9903 Samy Ben Naceur
Mohamed Goaied The Value Creation Process in The Tunisia Stock Exchange
API/WPS 9904 ث انظرخ ولبثهخ انزطجك ف انذول انؼرثخ: ركبنف انزذهىر انجئ وشحخ انىارد انطجؼخ دبح انش
API/WPS 9905 Riad Dahel Volatility in Arab Stock Markets
API/WPS 9906 Yousef Al-Ebraheem
Bassim Shebeb
IMPORTED INTERMEDIATE INPUTS: IMPACT ON ECONOMIC
GROWTH
API/WPS 9907 Magda Kandil Determinants and Implications of Asymmetric Fluctuations: Empirical
Evidence and Policy Implications Across MENA Countries
API/WPS 9908 M. Nagy Eltony Oil Price Fluctuations and their Impact on the Macroeconomic Variables
of Kuwait: A Case Study Using a VAR Model
API/WPS 9909 إػبدح رؤوس األيىال انؼرثخ إنى انىط انؼرث ث األيب وانىالغ ػه ػجذ انمبدر
API/WPS 0001 انزخ انجشرخ ، رخ انىارد انجشرخ واإلحالل ف انذول انخهدخ يحذ ػذب ودغ
API/WPS 0002 ثؼط انزدبرة انؼرثخ: ثرايح األفسذ يحذ بخ انزى
API/WPS 0003 Riad Dahel On the Predictability of Currency Crises: The Use of Indicators in the Case
of Arab Countries
API/WPS 0004 سر ثركبد
ػـــبدل انؼهـــــ يفهىو انزبفسخ وانزدبرة انبخحخ ف انفبر إنى األسىاق انذونخ

64
No Author Title
API/WPS 0101 Imed Limam Measuring Technical Efficiency Of Kuwaiti Banks
API/WPS 0102 Ali Abdel Gadir Ali Internal Sustainability And Economic Growth In The Arab States
API/WPS 0103 Belkacem Laabas Poverty Dynamics In Algeria
API/WPS 0104 حبنخ انكىذ–ظروراد االصالذ : نؼم انزؼهى وسىق ا يحذ ػذب ودغ
API/WPS 0105 دور وآفبق انمطبع انسبح ف الزصبداد األلطبر انؼرثخ يحذ بخ انزى
API/WPS 0106 آفبق ويسزدذاد: انطبلخ وانجئخ وانزخ انسزذخ دبح انش
API/WPS 0107 Riad Dahel Telecommunications Privatization in Arab Countries: An Overview
API/WPS 0108 أسس انؼاللخ ث انزؼهى وسىق انؼم ولبس ػىائذ االسزثبر انجشري ػه ػجذ انمبدر
API/WPS 2221
يبهح رمذر انذاخم انخزهطخ ف األلطبر انؼرثخ أحذ انكىاز
API/WPS 2222 نزكبفم االخزبػ ف االلزصبد انؼرثانكفبءح انزىزؼخ نشجكبد ا سهب شؼجب انمذس
API/WPS 2223 Belkacem Laabas and
Imed Limam Are GCC Countries Ready for Currency Union?
API/WPS 2224 رحهم نهزدرثخ انكىزخ: سبسبد انؼم وانزخ انجشرخ ف األلطبر انؼرثخ يحذ بخ انزى
API/WPS 2225 Mustafa Babiker Taxation and Labor Supply Decisions: The Implications of Human Capital
Accumulation
API/WPS 2226 Ibrahim A. Elbadawi Reviving Growth in the Arab World
API/WPS 2227 M. Nagy Eltony The Determinants of Tax Effort in Arab Countries
API/WPS 2228 كىازأحذ ان انسبسبد االلزصبدخ ورأس انبل انجشري
API/WPS 2229 Mustafa Babiker The Impact of Environmental Regulations on Exports: A Case Study of
Kuwait Chemical and Petrochemical Industry
API/WPS 2301
Samir Makdisi,
Zeki Fattah
and Imed Limam
Determinants Of Growth In The Mena Countries
API/WPS 2302 حبنخ يصر"دور انحكىيخ انذاػى نهزبفسخ طبرق ىر"
API/WPS 2303 M. Nagy Eltony Quantitative Measures of Financial Sector Reform in the Arab Countries
API/WPS 2304 Ali Abdel Gadir Ali
Can the Sudan Reduce Poverty by Half by the Year 2015?
API/WPS 2305 Ali Abdel Gadir Ali Conflict Resolution and Wealth Sharing in Sudan: Towards an Allocation Formula
API/WPS 2306 Mustafa Babiker Environment and Development in Arab Countries: Economic Impacts of
Climate Change Policies in the GCC Region
API/WPS 2307 Ali Abdel Gadir Ali Globalization and Inequality in the Arab Region
API/WPS 2308 رمى سبسبد وإسزراردبد اإللالل ي انفمر ف ػخ ي انذول انؼرثخ ػه ػجذ انمبدر ػه
65
No Author Title
API/WPS 0401
Belkacem Laabas
and
Imed Limam
Impact of Public Policies on Poverty, Income Distribution and Growth
API/WPS 0402 Ali Abdel Gadir Ali Poverty in the Arab Region: A Selective Review
API/WPS 0403 Mustafa Babiker Impacts of Public Policy on Poverty in Arab Countries: Review of the CGE
Literature
API/WPS 0404 Ali Abdel Gadir Ali On Financing Post-Conflict Development in Sudan
API/WPS 2521 Ali Abdel Gadir Ali On the Challenges of Economic Development in Post-Conflict Sudan
API/WPS 2621 Ali Abdel Gadir Ali Growth, Poverty and Institutions: Is there a Missing Link?
API/WPS 2622 Ali Abdel Gadir Ali On Human Capital in Post-Conflict Sudan: Some Exploratory Results
API/WPS 2623 Ahmad Telfah Optimal Asset Allocation in Stochastic Environment: Evidence on the
Horizon and Hedging Effects
API/WPS 2624 Ahmad Telfah Do Financial Planners Take Financial Crashes In Their Advice: Dynamic
Asset Allocation under Thick Tails and Fast volatility Updating
API/WPS 2721 Ali Abdel Gadir Ali Child Poverty: Concept and Measurement
API/WPS 2722 انزعخى ف دول يدهس انزؼبو انخهد ودور صبدك انفط ف االسزمرار االلزصبدي حبرى يهرا
API/WPS 2821 Weshah Razzak In the Middle of the Heat The GCC Countries Between Rising Oil Prices
and the Sliding Greenback
API/WPS 2822 Rabie Nasser
Could New Growth Cross-Country Empirics Explain the Single Country
Growth of Syria During 1965-2004?
API/WPS 2823 Sufian Eltayeb Mohamed Finance-Growth Nexus in Sudan: Empirical Assessment Based on an
Application of the Autoregressive Distributed Lag (ARDL) Model
API/WPS 2824 Weshah Razzak Self Selection versus Learning-by-Exporting Four Arab Economies
API/WPS 2825 حى ثئخ أػبل أفعم: ارفبلخ أغبدر رشب يصطفى
API/WPS 2826
Mohamed Osman
Suliman
& Mahmoud Sami Nabi
Unemployment and Labor Market Institutions: Theory and Evidence from
the GCC
API/WPS 2921 Weshah Razzak
&
Rabie Nasser
A Nonparametric Approach to Evaluating Inflation-Targeting Regimes
API/WPS 2922 Ali Abdel Gadir Ali A Note on Economic Insecurity in the Arab Countries
API/WPS 2923 األزيخ انبنخ انحبنخ وشبذ رزاق
API/WPS 2924 Ali Abdel Gadir Ali The Political Economy of Inequality in the Arab Region and Relevant
Development Policies
API/WPS 2925 Belkacem Laabas
Walid Abdmoulah Determinants of Arab Intraregional Foreign Direct Investments

66
No Author Title
API/WPS 2926 Ibrahim Onour North Africa Stock Markets: Analysis of Unit Root and Long Memory
Process
API/WPS 2927 Walid Abdmoulah Testing the Evolving Efficiency of 11 Arab Stock Markets
API/WPS 2928 Ibrahim Onour Financial Integration of North Africa Stock Markets
API/WPS 2929 Weshah Razzak An Empirical Glimpse on MSEs Four MENA Countries
API/WPS 2912 Weshah Razzak On the GCC Currency Union
API/WPS 2911 Ibrahim Onour Extreme Risk and Fat-tails Distribution Model: Empirical Analysis
API/WPS 2912 Elmostafa Bentour
Weshah Razzak Real Interest Rates, Bubbles and Monetary Policy in the GCC countries
API/WPS 1221 Ibrahim Onour Is the high crude oil prices cause the soaring global food prices?
API/WPS 1222 Ibrahim Onour Exploring Stability of Systematic Risk: Sectoral Portfolio Analysis
API/WPS 1223 يالحظبد حىل رحذبد األي االلزصبدي ف انذول انؼرثخ ػه ػجذانمبدر ػه
API/WPS 1224 ثؼط يفبهى انزذرت يغ إشبرح نهؼبندخ انظرخ االلزصبدخ أحذ انكىاز
API/WPS 1225 ثهمبسى انؼجبس
وشبذ رزاق
Taxes, Natural Resource Endowment, and the Supply of Labor:
New Evidence.
API/WPS 1226 ربض ث خهه
ػبدل ػجذانؼظى
Tourism in Arab South Mediterranean Countries: The Competitiveness
Challenge
API/WPS 1227 RRiiaaddhh BBeenn JJeelliillii Conventional and Corrected Measures of Gender-related Development
Index (GDI):What Happens to the Arab Countries Ranking?
API/WPS 1228 انكىاز أحذ هكم ورحذبد انزدبرح انخبرخخ ف دونخ اإليبراد انؼرثخ انزحذح
API/WPS 1229 Ibrahim Onour
The Global Financial Crisis and Equity Markets in Middle East Oil
Exporting Countries
API/WPS 1212 Walid Abdmoulah Belkacem Laabas
Assessment of Arab Export Competitiveness in International Markets using
Trade Indicators
API/WPS 1211 Hadeel Abu Loghod Do Islamic Banks Perform Better than Conventional Banks? Evidence from
Gulf Cooperation Council countries
API/WPS 1012 Ibrahim Onour
Abdelgadir Abdalla Efficiency of Islamic Banks in Sudan: A Non-Parametric Approach
API/WPS 1013 Riadh Ben Jelili Firm Heterogeneity and Productivity: The Contribution of Microdata
API/WPS 1014 رحذبد األي االلزصبدي ف دونخ انكىذ يالحظبد حىل ربض ث خهه