The Android app Geohazard - Experiences with shared information on natural hazards, State of the art...
51
– The Android app Geohazard – Experiences with shared information on natural hazards State of the art and forward thinking Martin Hammitzsch and Matthias Schroeder Helmholtz Centre Potsdam, GFZ German Research Centre for Geosciences Workshop Linking Geospatial Data 5-6 March 2014, Campus London, Shoreditch
-
Upload
martin-hammitzsch -
Category
Technology
-
view
589 -
download
2
Transcript of The Android app Geohazard - Experiences with shared information on natural hazards, State of the art...
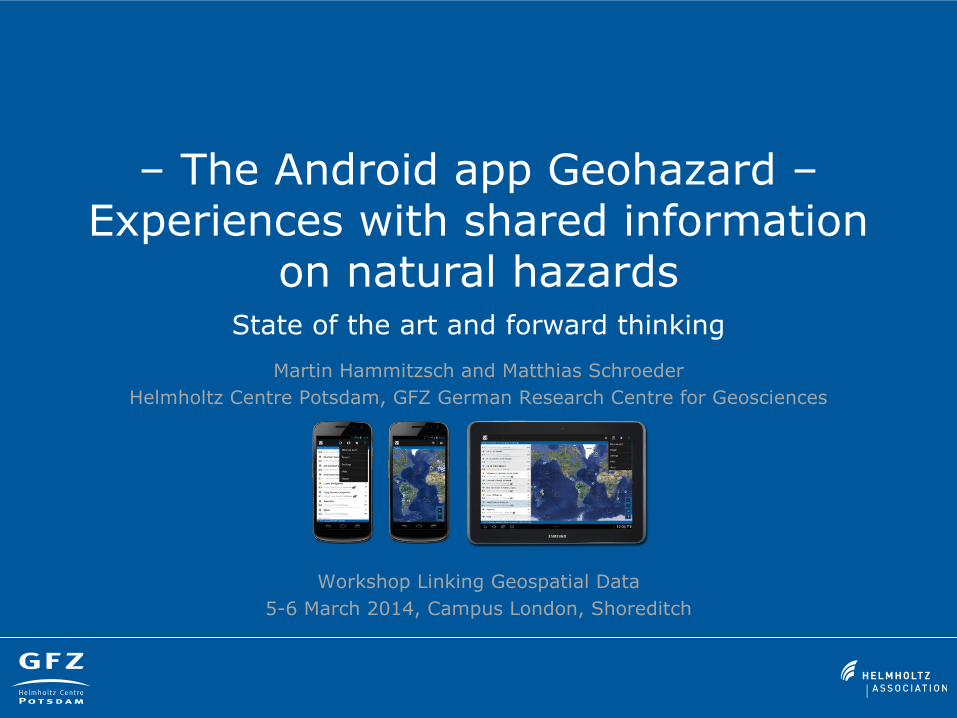
– The Android app Geohazard –Experiences with shared information
on natural hazardsState of the art and forward thinking
Martin Hammitzsch and Matthias SchroederHelmholtz Centre Potsdam, GFZ German Research Centre for Geosciences
Workshop Linking Geospatial Data5-6 March 2014, Campus London, Shoreditch

Reasons to be here
• Having issues with what is state-of-the-art– Find others having similar problems– Create nucleus to raise objections
• Getting advice and finding ways how to continue– Get inspiration– Move to new breeding grounds– Find helping hands and contributors
… from Geohazard app to
# State of the art* Forward thinking
*
#
• Addressing involved partiesand stakeholders– Spawn joint activities towards collective goals– Seek standardisation initiative … quite ambitious

State of the art
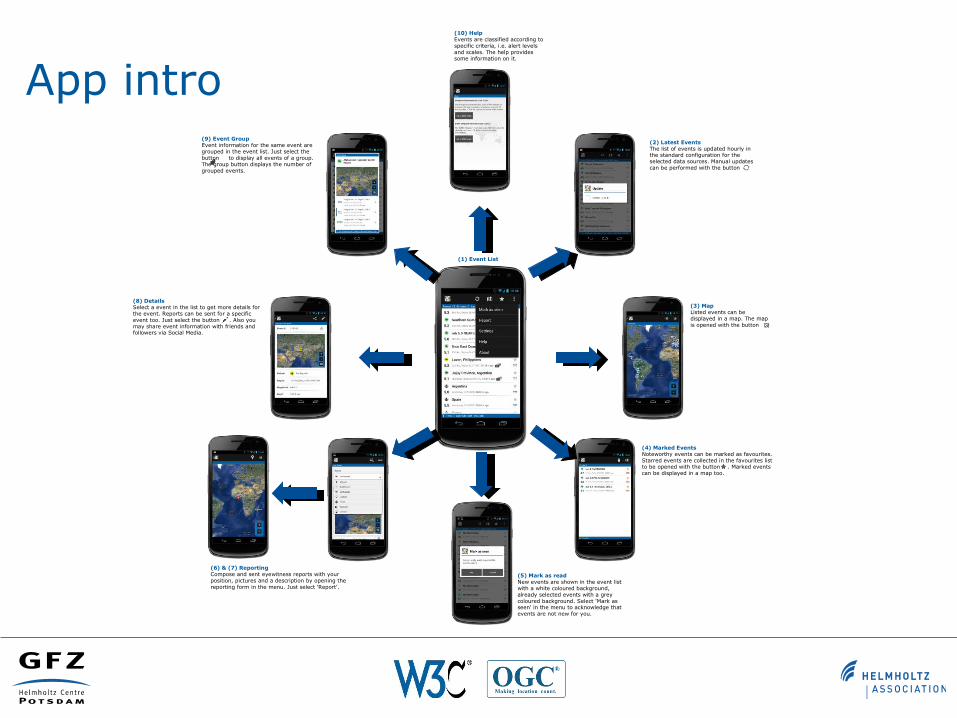
App intro
(3) MapListed events can be displayed in a map. The map is opened with the button
(4) Marked EventsNoteworthy events can be marked as favourites. Starred events are collected in the favourites list to be opened with the button . Marked events can be displayed in a map too.
(1) Event List
(5) Mark as readNew events are shown in the event list with a white coloured background, already selected events with a grey coloured background. Select 'Mark as seen' in the menu to acknowledge that events are not new for you.
(8) DetailsSelect a event in the list to get more details for the event. Reports can be sent for a specific event too. Just select the button . Also you may share event information with friends and followers via Social Media.
(9) Event GroupEvent information for the same event are grouped in the event list. Just select the button to display all events of a group. The group button displays the number of grouped events.
(10) HelpEvents are classified according to specific criteria, i.e. alert levels and scales. The help provides some information on it.
(6) & (7) ReportingCompose and sent eyewitness reports with your position, pictures and a description by opening the reporting form in the menu. Just select 'Report'.
(2) Latest EventsThe list of events is updated hourly in the standard configuration for the selected data sources. Manual updates can be performed with the button

App intro cont’d(12) Data SourcesChoose from different data sources for earthquake, flood, tsunami, volcano, and cyclone events.
(13) Update & NotificationsDefine the time interval for periodic updates and specify the type of notification.
(15) & (16) Bounding BoxSelect the region of interest for events with a bounding box either interactively via map or manually via coordinates.
(11) Settings
(14) FilterCustomize criteria according to your needs and filter events by age and other thresholds, e.g. the minimum earthquake magnitude.
(17) GroupingGroup events individually by specific parameters so that information for the same event coming from different data sources is combined.
(18) DisplayCustomize the event list by different sorting, units, or colours.
(19) MapDefine the default map type and specify if your location has to be displayed on the map.
(21) & (22) ReportingDefine if reports are sent to the pre-defined Ushahidi instance or to another Ushahidi instance.
(20) My LocationDefine how your location is retrieved: GPS, wifi, or cell id.
Background
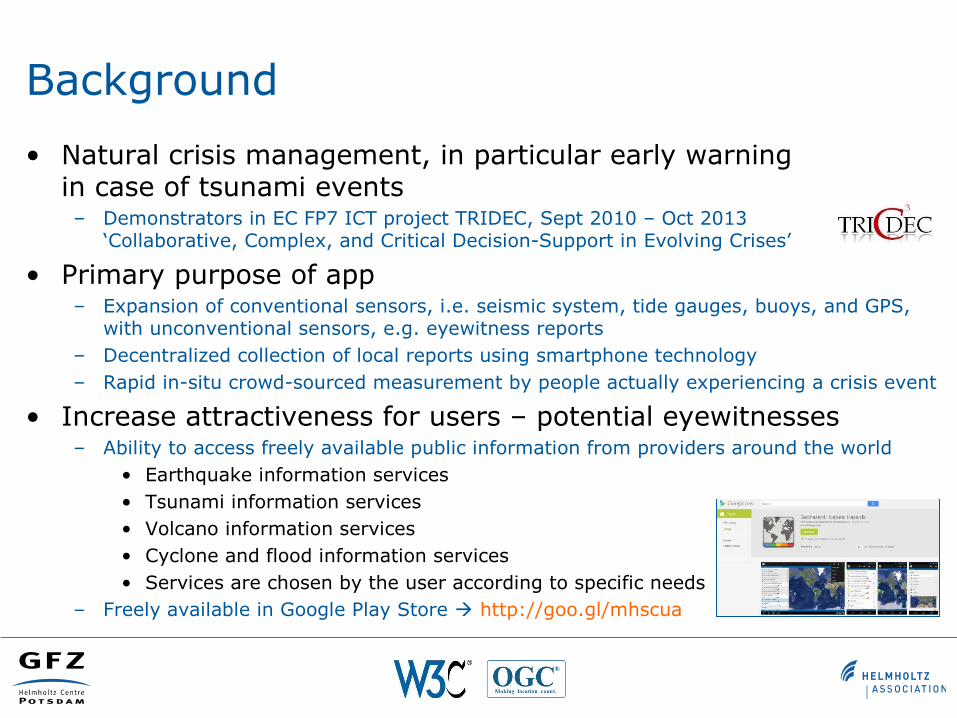
• Natural crisis management, in particular early warningin case of tsunami events– Demonstrators in EC FP7 ICT project TRIDEC, Sept 2010 – Oct 2013
‘Collaborative, Complex, and Critical Decision-Support in Evolving Crises’
• Primary purpose of app– Expansion of conventional sensors, i.e. seismic system, tide gauges, buoys, and GPS,
with unconventional sensors, e.g. eyewitness reports– Decentralized collection of local reports using smartphone technology– Rapid in-situ crowd-sourced measurement by people actually experiencing a crisis event
• Increase attractiveness for users – potential eyewitnesses– Ability to access freely available public information from providers around the world
• Earthquake information services• Tsunami information services• Volcano information services• Cyclone and flood information services• Services are chosen by the user according to specific needs
– Freely available in Google Play Store http://goo.gl/mhscua

Data Sources
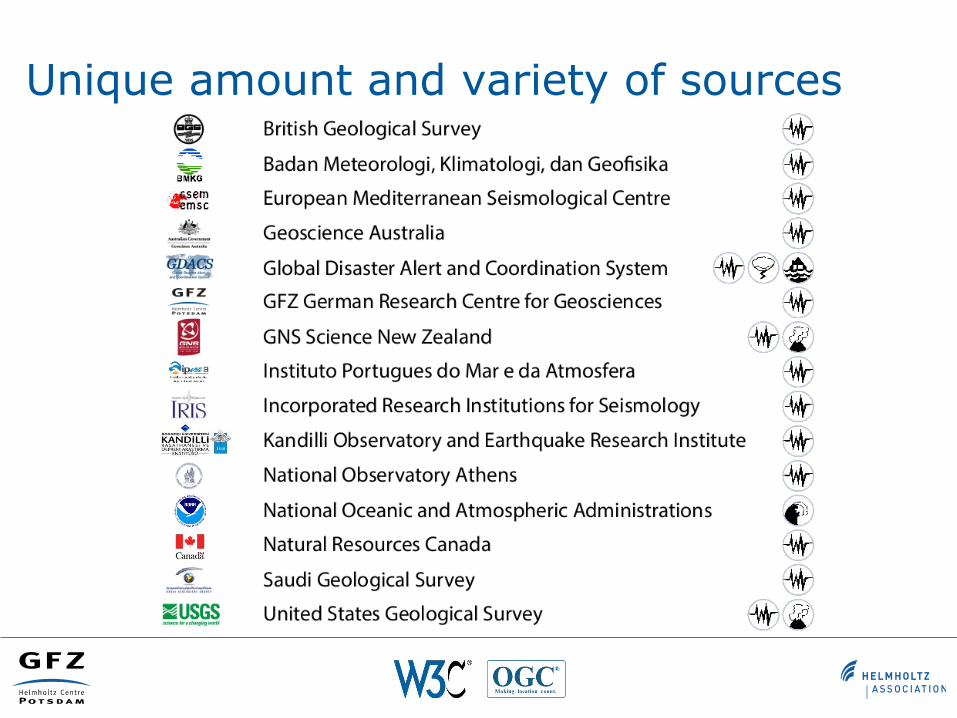
Unique amount and variety of sources
Data access
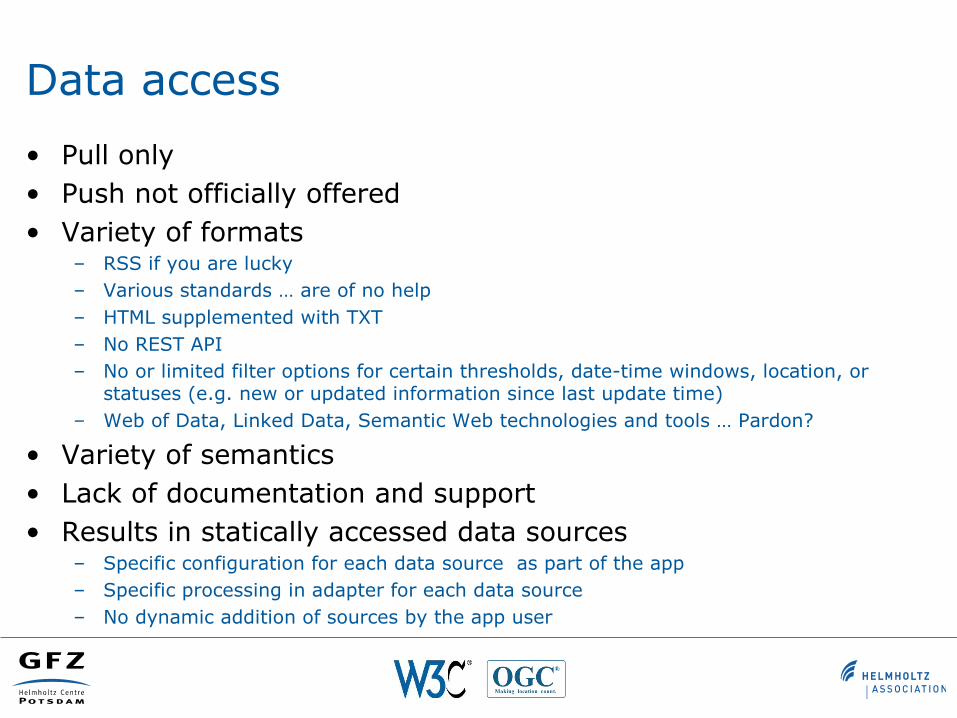
• Pull only• Push not officially offered• Variety of formats
– RSS if you are lucky– Various standards … are of no help– HTML supplemented with TXT– No REST API– No or limited filter options for certain thresholds, date-time windows, location, or
statuses (e.g. new or updated information since last update time)– Web of Data, Linked Data, Semantic Web technologies and tools … Pardon?
• Variety of semantics• Lack of documentation and support• Results in statically accessed data sources
– Specific configuration for each data source as part of the app– Specific processing in adapter for each data source– No dynamic addition of sources by the app user
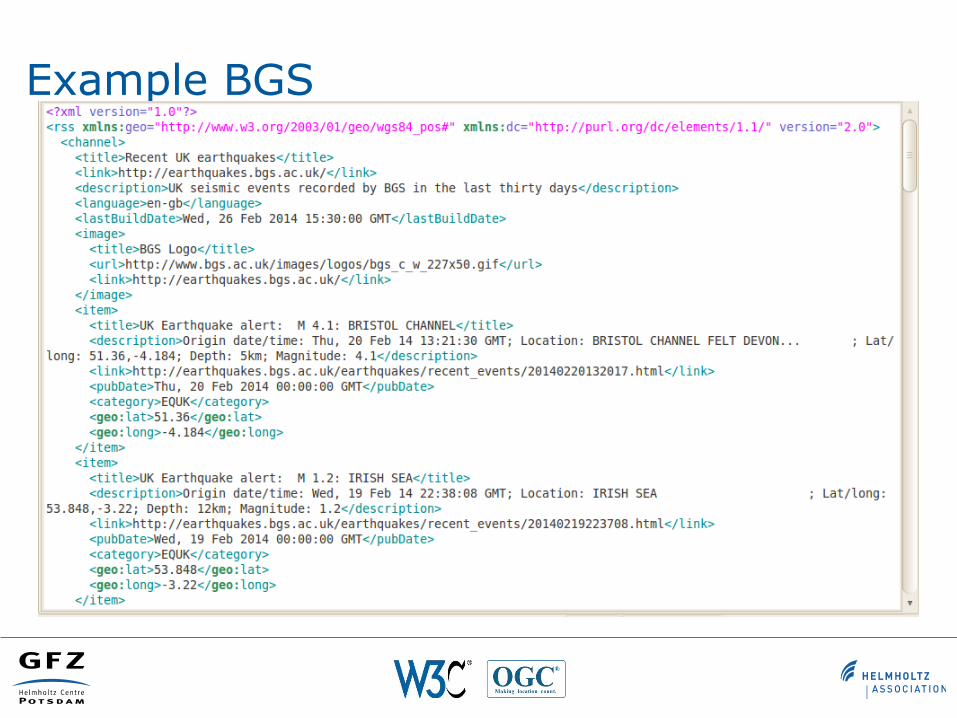
Example BGS

Example BMKG
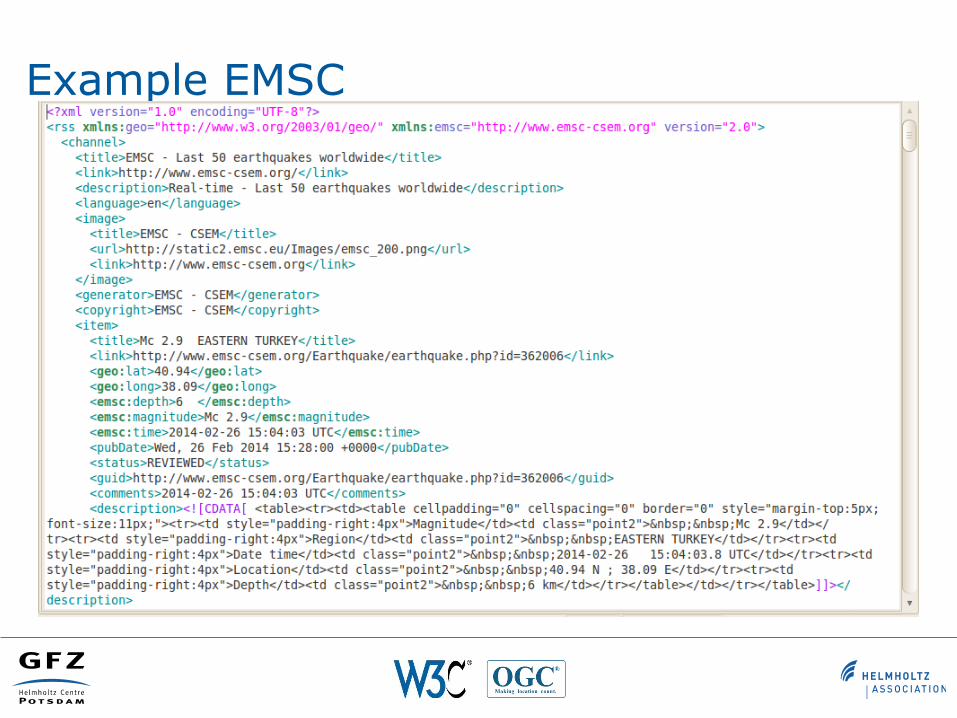
Example EMSC
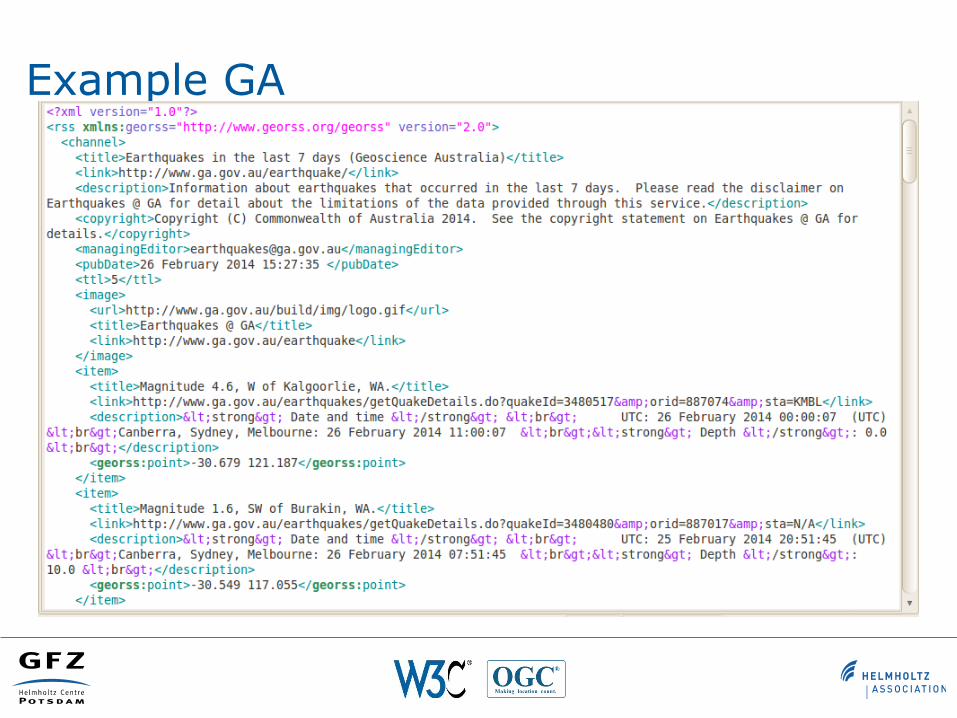
Example GA

Example GDACS
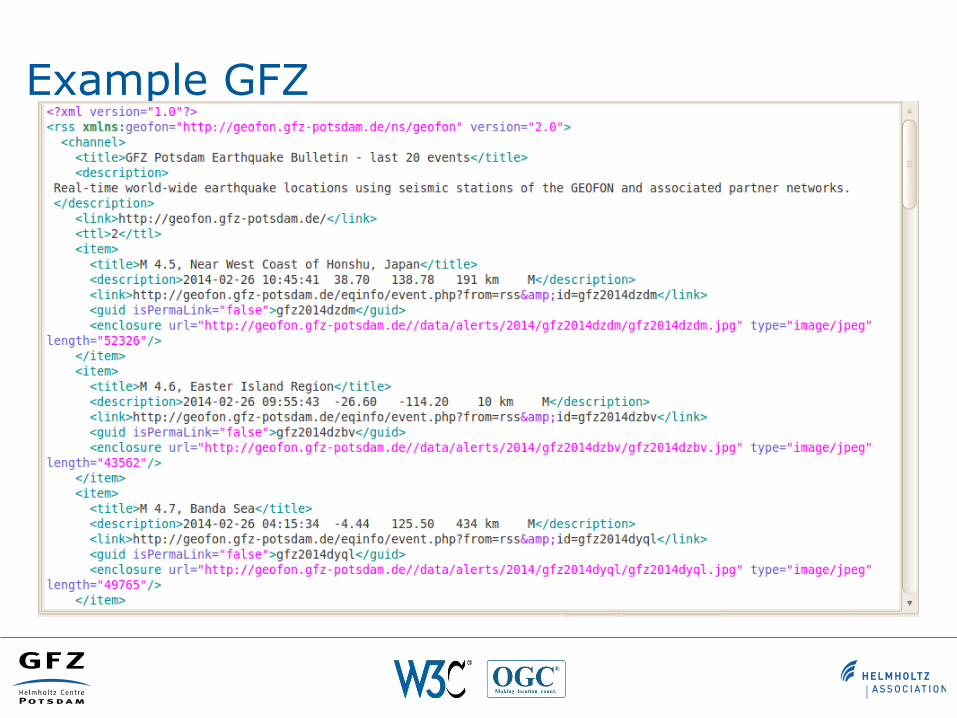
Example GFZ
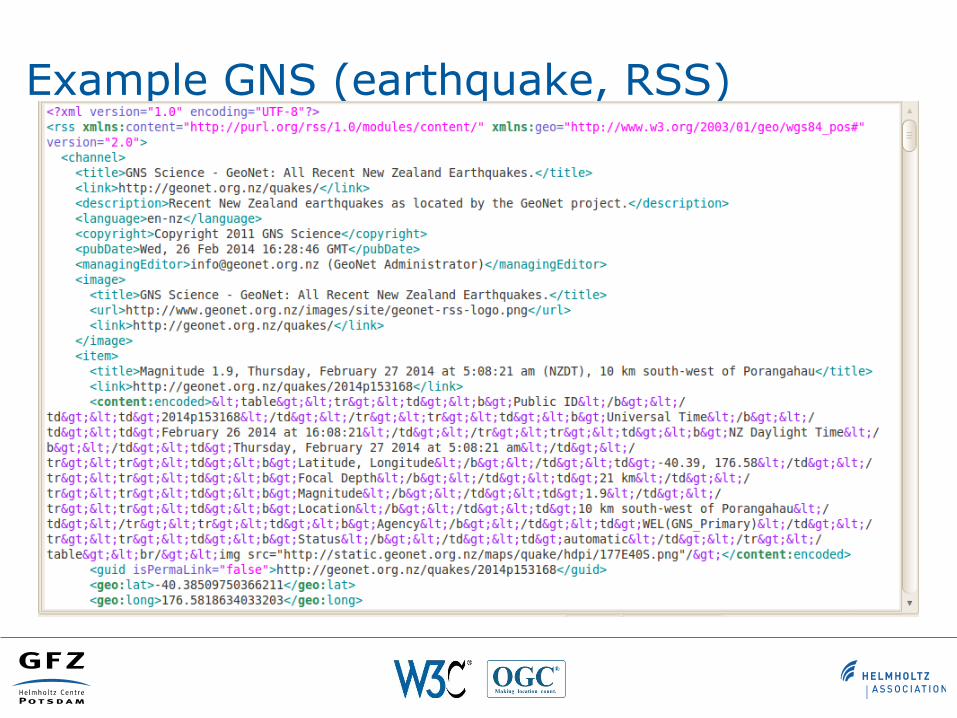
Example GNS (earthquake, RSS)

Example GNS (earthquake, KML)

Example IPMA
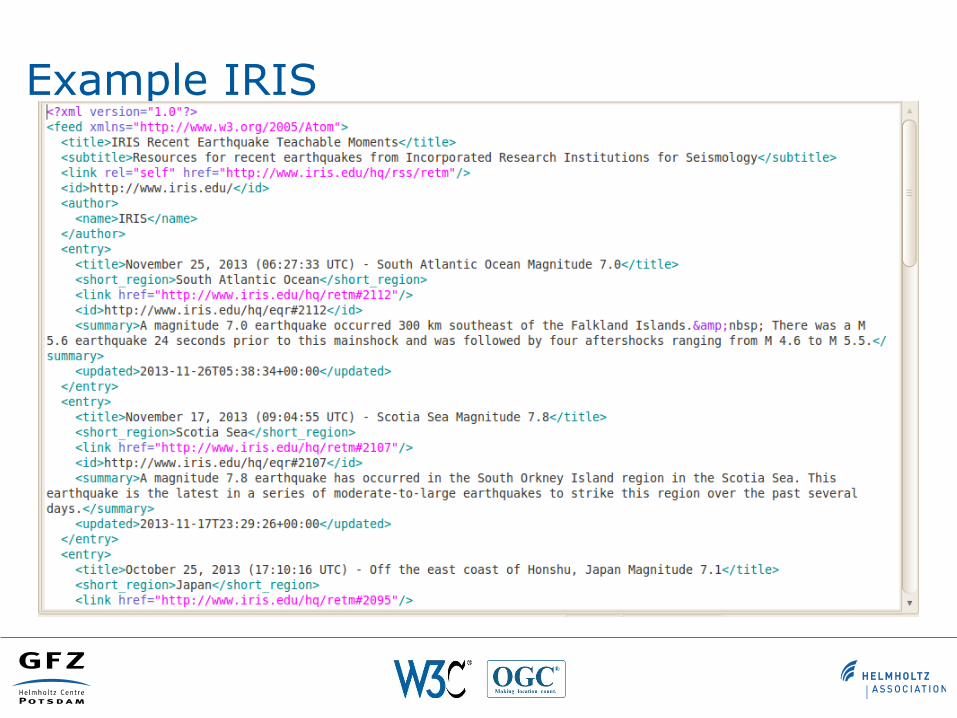
Example IRIS

Example KOERI
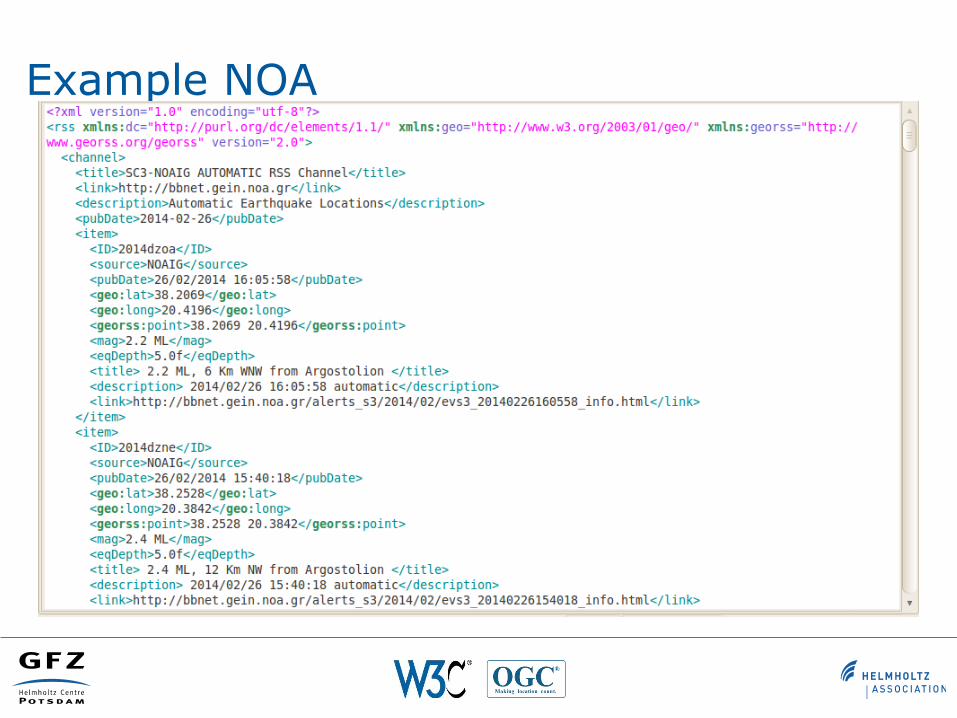
Example NOA

Example NRCAN

Example USGS (earthquake)

Example USGS (volcano)

Example GNS (volcanic alert)

Example GNS (aviation alert)

Example NOAA PTWC
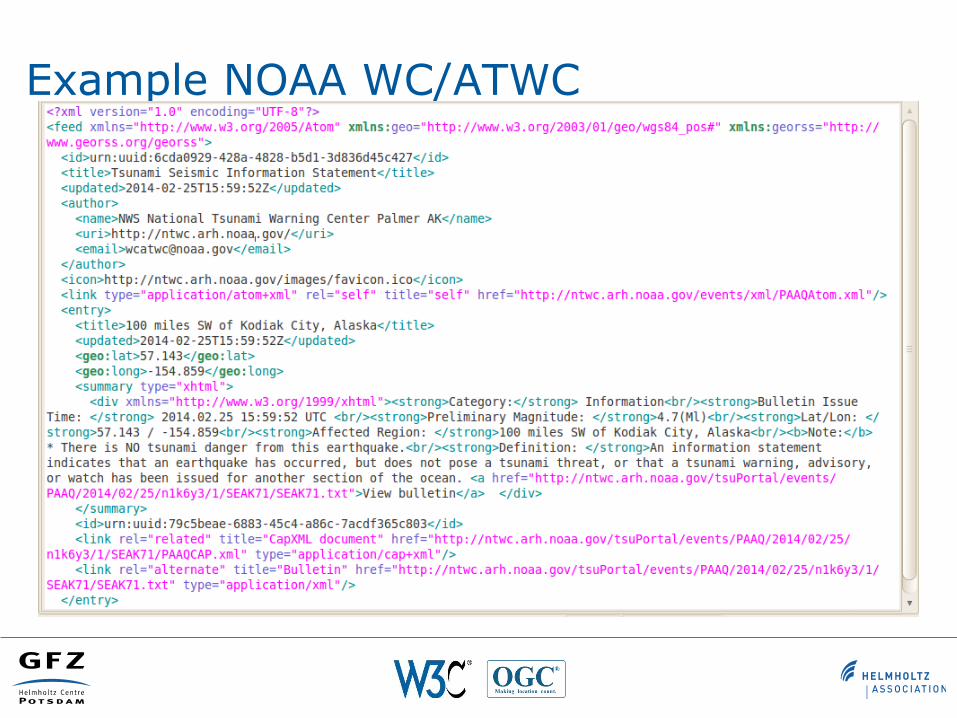
Example NOAA WC/ATWC

Reporting

Haiti 2010, Ushahidi, crisis-mapping, crowdsourcing …
• In 2010 United States Institute of Peace (USIP) examined role of crisis-mapping in the disaster relief effort following the 2010 earthquake in Haiti
• An open-source crisis-mapping platform, provided a way to capture, organize, and share critical information coming directly from Haitians
• Successive application and validation– 2010 Chile earthquake– 2010 BP’s Deepwater Horizon oil spill
in the Gulf of Mexico– 2011 Christchurch earthquake and tsunami
in New Zealand– 2011 Japan earthquake, tsunami, and nuclear
emergency– and many more …

Test case: international tsunami exercise
• NEAMWave12, Nov 27-28, 2012– Use of App to immediately sent eyewitness
reports,– Adoption of a crisis-mapping platform to
collect and organize eyewitness reports– Integration of eyewitness reports in GUI for
operators on duty in early warning and crisis management centres

Ushahidi data in
• Huge amount of interfaces– Web form, twitter/social media, RSS,
SMS, e-mail, REST API, …
• REST API– Public API does not require any authentication to
access and/or use, restricted to (public domain) information retrieval and report submission (regarding reports, comments, categories, locations, and countries)
– Admin API handles most of the administrative tasks (regarding reports, comments, and categories) by administrators of an Ushahidi deployment, requires an HTTP authentication
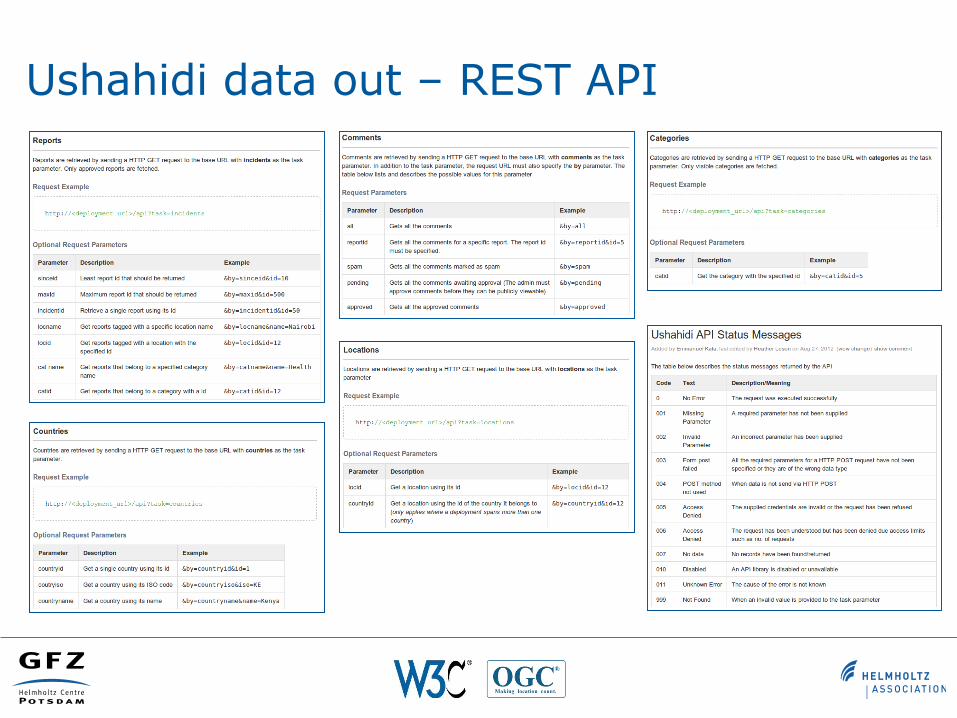
Ushahidi data out – REST API
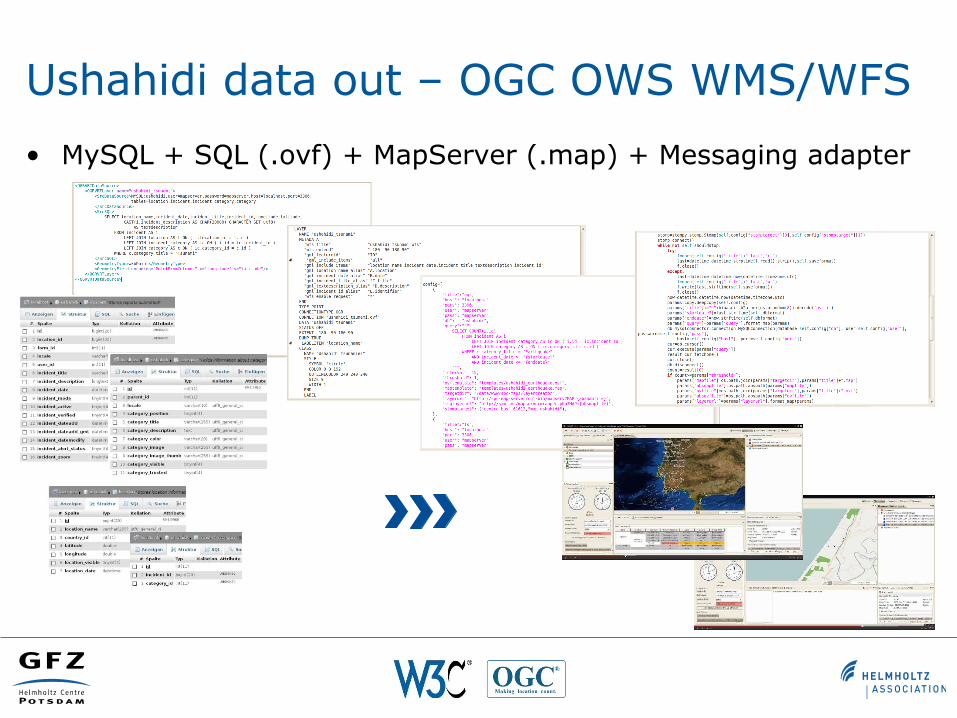
Ushahidi data out – OGC OWS WMS/WFS
• MySQL + SQL (.ovf) + MapServer (.map) + Messaging adapter
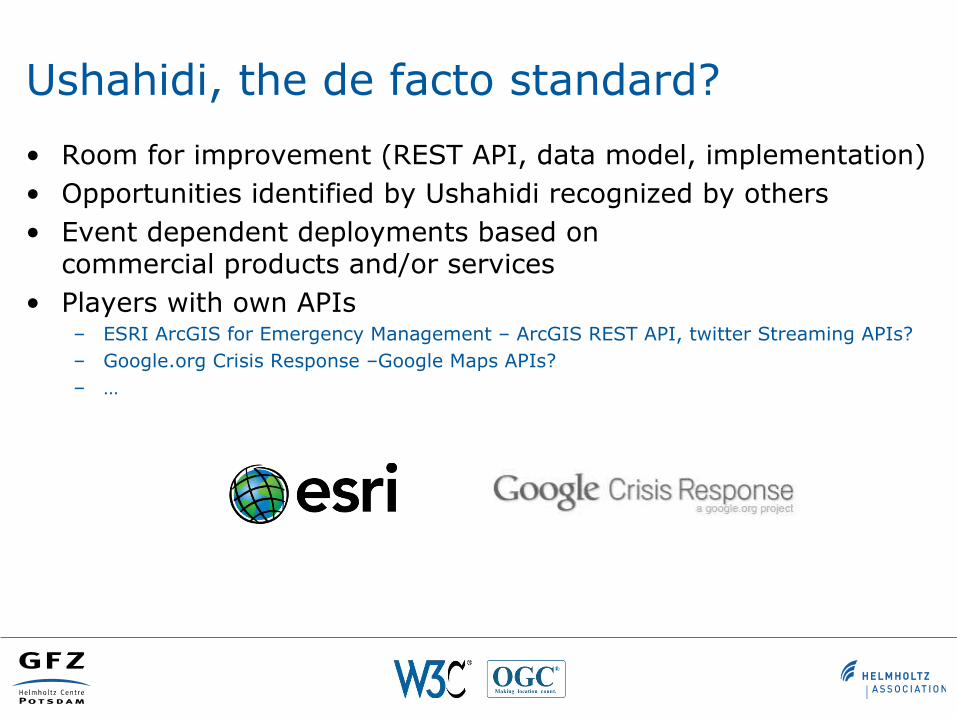
Ushahidi, the de facto standard?
• Room for improvement (REST API, data model, implementation)• Opportunities identified by Ushahidi recognized by others• Event dependent deployments based on
commercial products and/or services• Players with own APIs
– ESRI ArcGIS for Emergency Management – ArcGIS REST API, twitter Streaming APIs?– Google.org Crisis Response –Google Maps APIs?– …
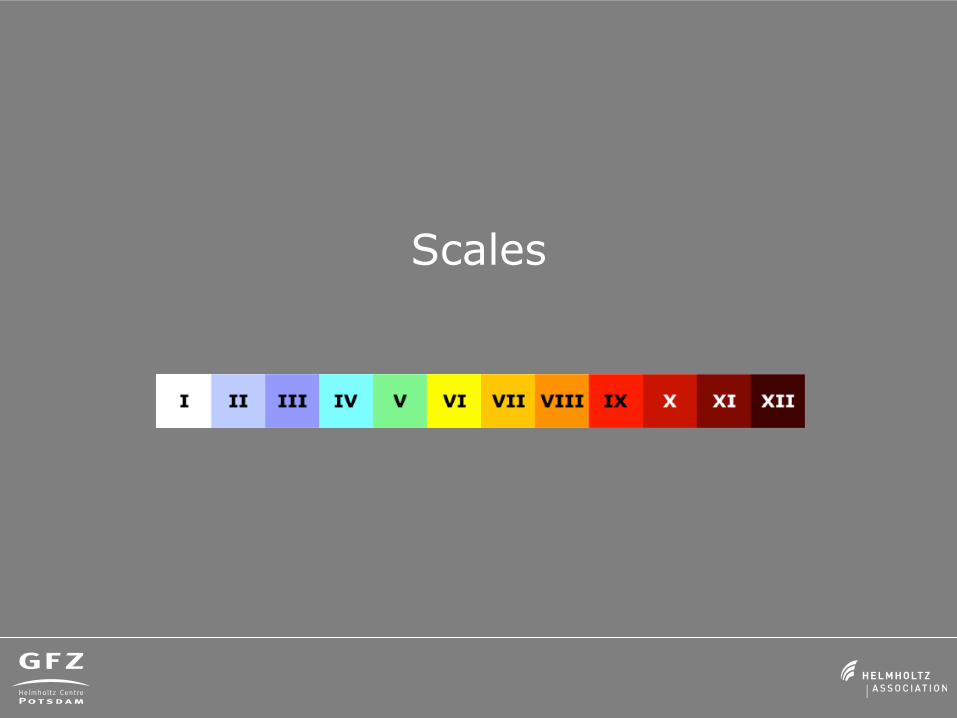
Scales

Used scales
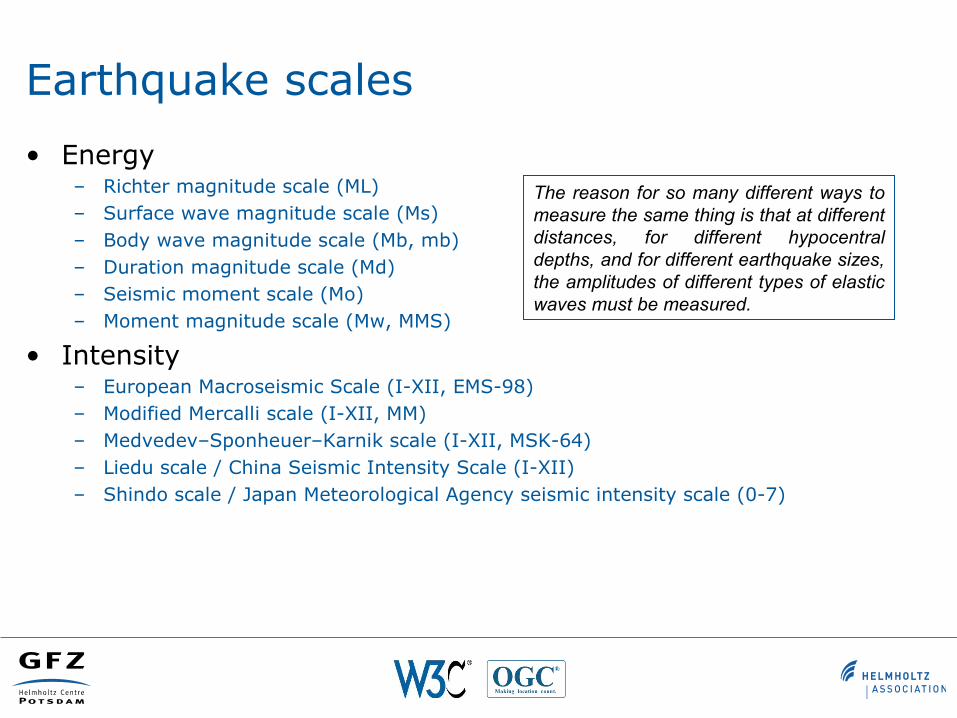
Earthquake scales
• Energy– Richter magnitude scale (ML)– Surface wave magnitude scale (Ms)– Body wave magnitude scale (Mb, mb)– Duration magnitude scale (Md)– Seismic moment scale (Mo)– Moment magnitude scale (Mw, MMS)
• Intensity– European Macroseismic Scale (I-XII, EMS-98)– Modified Mercalli scale (I-XII, MM)– Medvedev–Sponheuer–Karnik scale (I-XII, MSK-64)– Liedu scale / China Seismic Intensity Scale (I-XII)– Shindo scale / Japan Meteorological Agency seismic intensity scale (0-7)
The reason for so many different ways to measure the same thing is that at different distances, for different hypocentral depths, and for different earthquake sizes, the amplitudes of different types of elastic waves must be measured.

Earthquake scales cont’d
Cyclone related scales
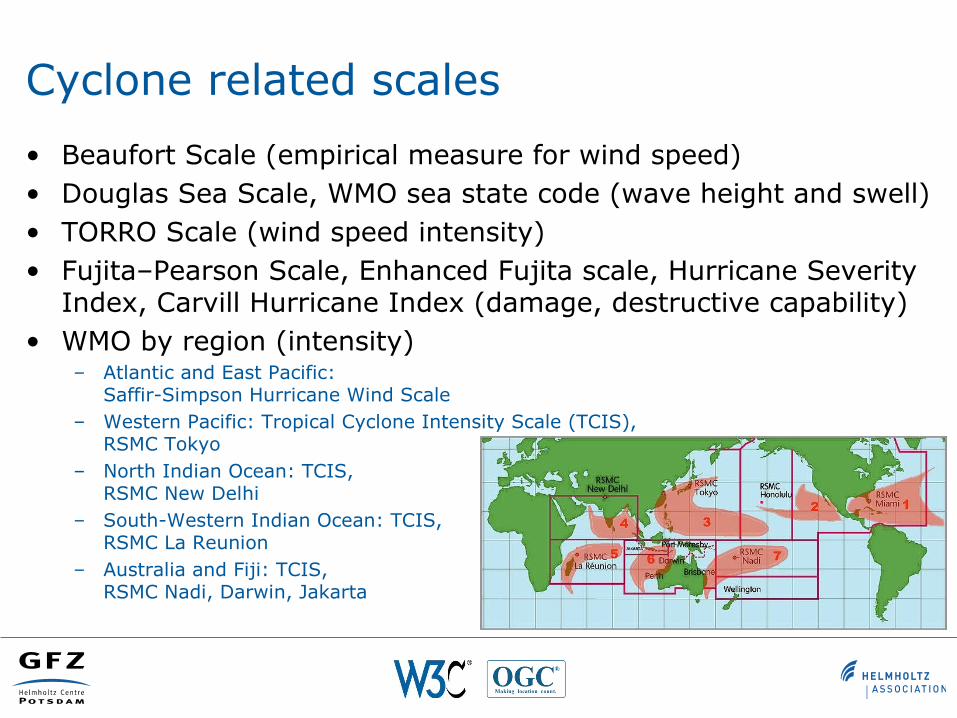
• Beaufort Scale (empirical measure for wind speed)• Douglas Sea Scale, WMO sea state code (wave height and swell)• TORRO Scale (wind speed intensity)• Fujita–Pearson Scale, Enhanced Fujita scale, Hurricane Severity
Index, Carvill Hurricane Index (damage, destructive capability)• WMO by region (intensity)
– Atlantic and East Pacific:Saffir-Simpson Hurricane Wind Scale
– Western Pacific: Tropical Cyclone Intensity Scale (TCIS),RSMC Tokyo
– North Indian Ocean: TCIS,RSMC New Delhi
– South-Western Indian Ocean: TCIS,RSMC La Reunion
– Australia and Fiji: TCIS,RSMC Nadi, Darwin, Jakarta
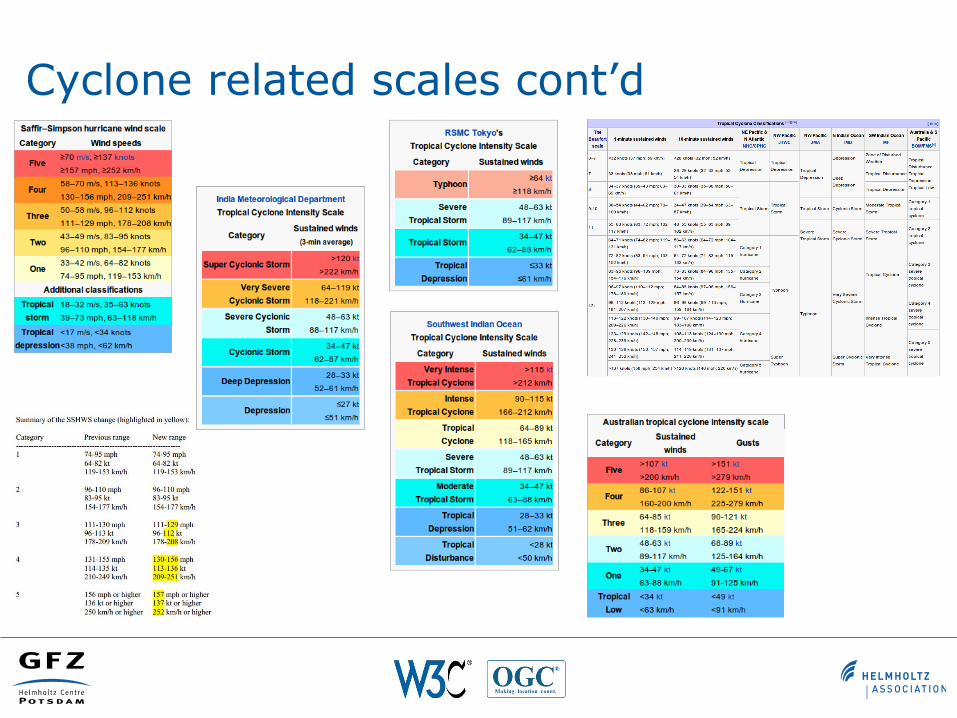
Cyclone related scales cont’d
Flood scales
?
Tsunami scales
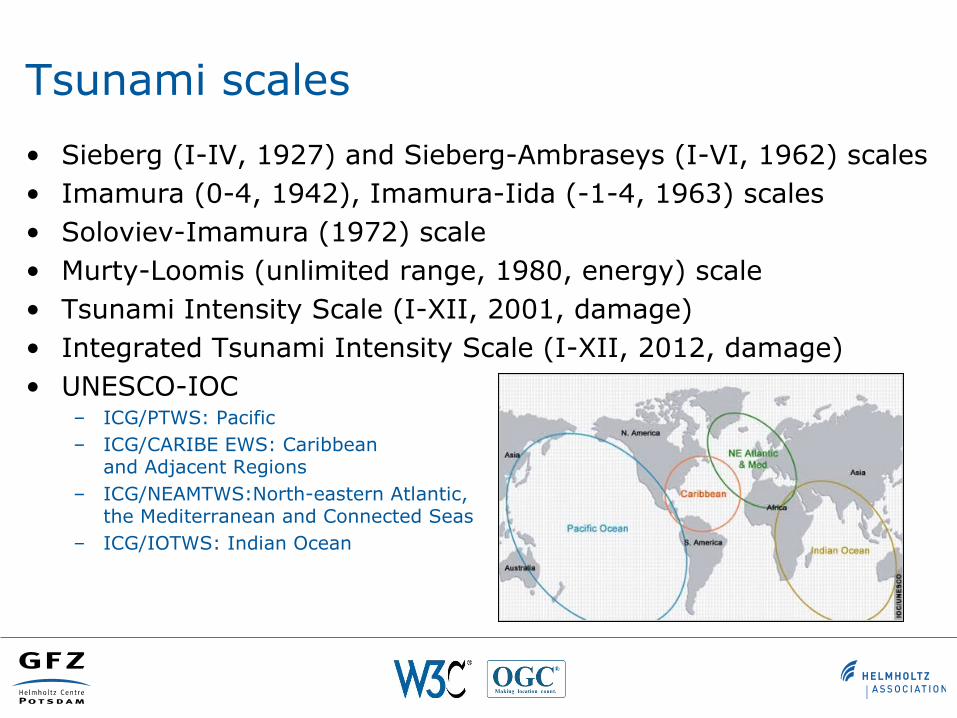
• Sieberg (I-IV, 1927) and Sieberg-Ambraseys (I-VI, 1962) scales• Imamura (0-4, 1942), Imamura-Iida (-1-4, 1963) scales• Soloviev-Imamura (1972) scale• Murty-Loomis (unlimited range, 1980, energy) scale• Tsunami Intensity Scale (I-XII, 2001, damage)• Integrated Tsunami Intensity Scale (I-XII, 2012, damage)• UNESCO-IOC
– ICG/PTWS: Pacific– ICG/CARIBE EWS: Caribbean
and Adjacent Regions– ICG/NEAMTWS:North-eastern Atlantic,
the Mediterranean and Connected Seas – ICG/IOTWS: Indian Ocean
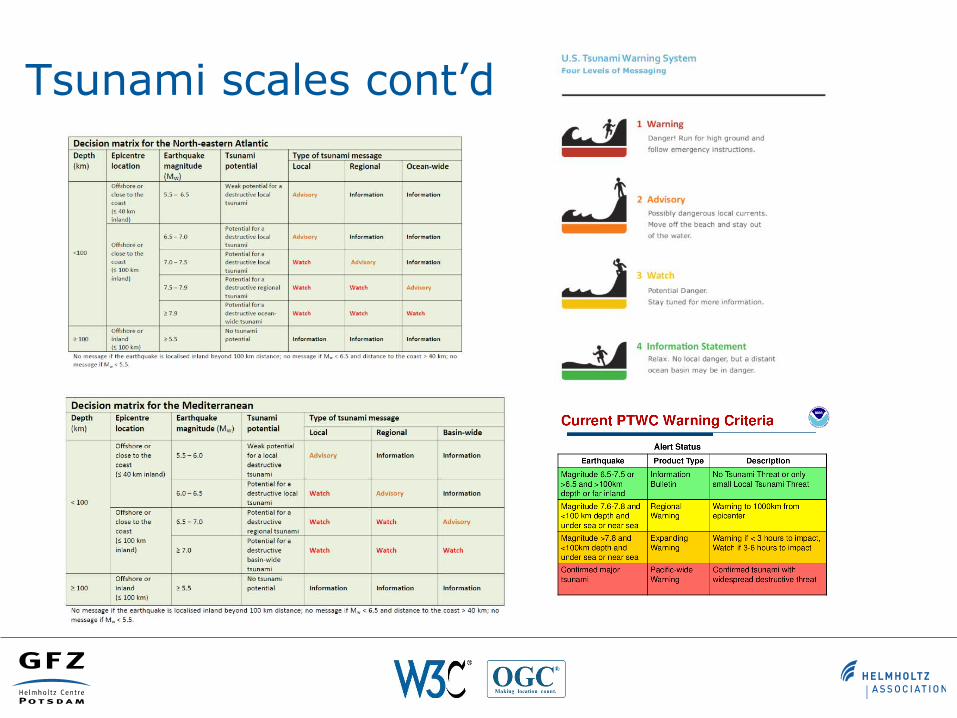
Tsunami scales cont’d

Tsunami scales cont‘d
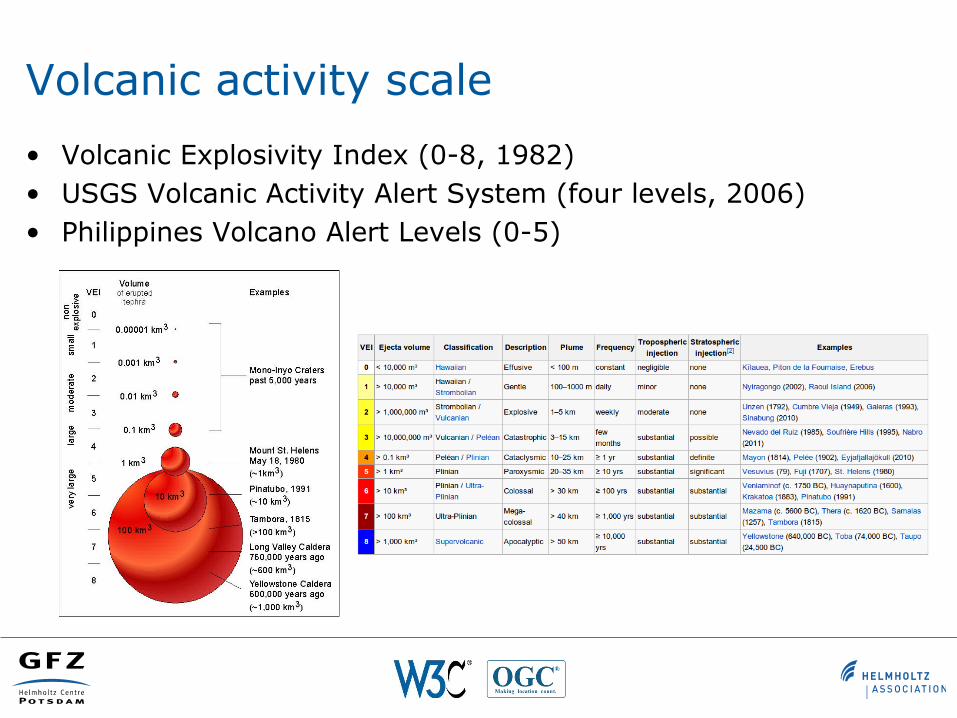
Volcanic activity scale
• Volcanic Explosivity Index (0-8, 1982)• USGS Volcanic Activity Alert System (four levels, 2006)• Philippines Volcano Alert Levels (0-5)

Volcanic activity scale cont’d

Forward thinking – Challenges
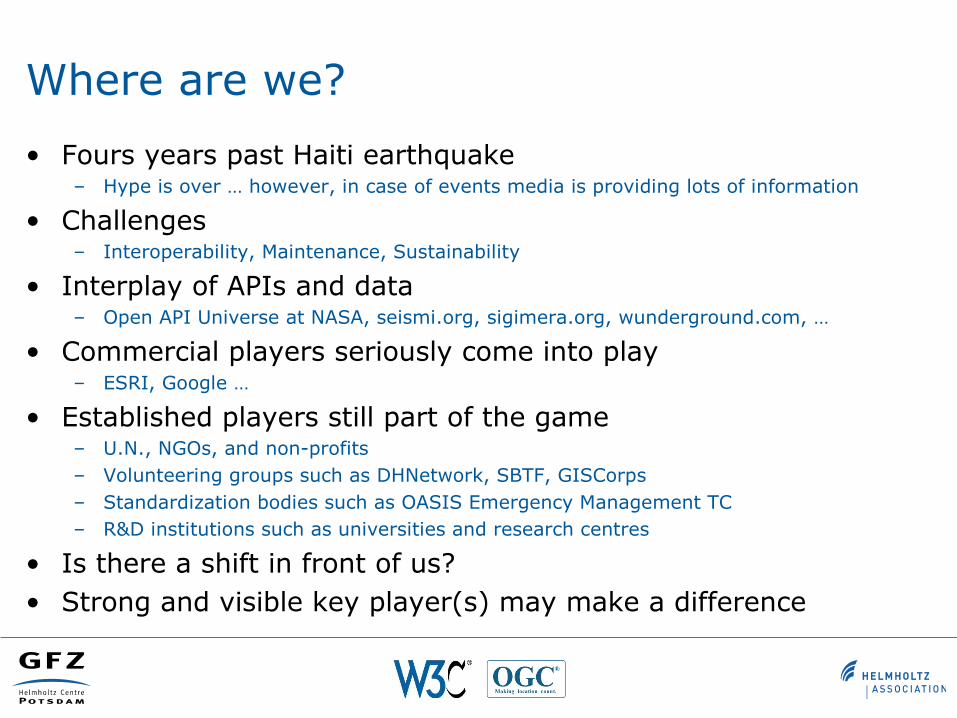
Where are we?
• Fours years past Haiti earthquake– Hype is over … however, in case of events media is providing lots of information
• Challenges– Interoperability, Maintenance, Sustainability
• Interplay of APIs and data– Open API Universe at NASA, seismi.org, sigimera.org, wunderground.com, …
• Commercial players seriously come into play– ESRI, Google …
• Established players still part of the game– U.N., NGOs, and non-profits– Volunteering groups such as DHNetwork, SBTF, GISCorps– Standardization bodies such as OASIS Emergency Management TC– R&D institutions such as universities and research centres
• Is there a shift in front of us?• Strong and visible key player(s) may make a difference
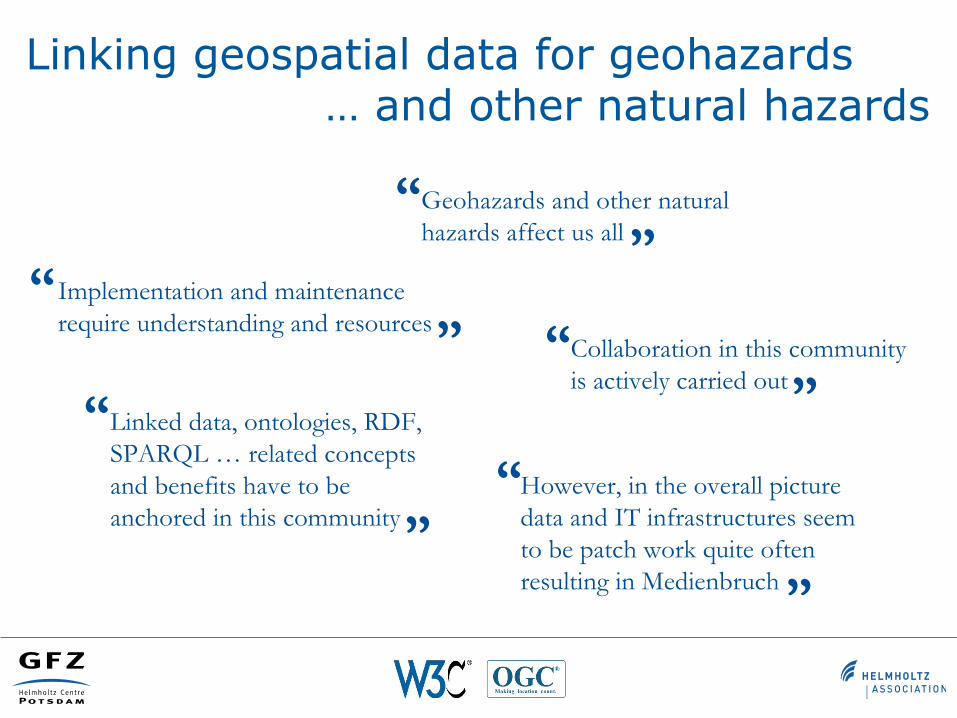
Linking geospatial data for geohazards … and other natural hazards
Geohazards and other natural hazards affect us all
Collaboration in this community is actively carried out
However, in the overall picture data and IT infrastructures seem to be patch work quite often resulting in Medienbruch
Linked data, ontologies, RDF, SPARQL … related concepts and benefits have to be anchored in this community
Implementation and maintenance require understanding and resources
“
““
““ ”
””
”
”
Conclusions
Photo Credit : Melissa NewGirlonPost

![Tacloban geohazard assessment report [11.28.13]](https://static.fdocuments.in/doc/165x107/5551c3d8b4c905ca7f8b5449/tacloban-geohazard-assessment-report-112813.jpg)