THALES RESEARCH AND TECHNOLOGY (UK) · Thales is a leading international electronics and systems...
34
www.thalesresearch.com Thales Research & Technology (UK) Ltd, 2011 THALES RESEARCH AND TECHNOLOGY (UK) Copy No. …………… Technical Report Project: P7784 LTE Interference Study 862 - 863 MHz Breathing Apparatus Telemetry System Interference Study P7784-10-003 Issue 2 15 December 2010
Transcript of THALES RESEARCH AND TECHNOLOGY (UK) · Thales is a leading international electronics and systems...
www.thalesresearch.com Thales Research & Technology (UK) Ltd, 2011
THALES RESEARCH AND TECHNOLOGY (UK)
Copy No. ……………
Technical Report
Project: P7784 LTE Interference Study
862 - 863 MHz Breathing Apparatus Telemetry System Interference Study
P7784-10-003 Issue 2 15 December 2010
P7784 LTE Interference Study Thales Research & Technology (UK) Ltd. 862 - 863 MHz Breathing Apparatus Telemetry System Interference Study
P7784-10-003 Issue 2 Page 2 of 34
Document Info Author: N. Hoult & C. Ward N. Hoult Project Manager D. Shepherd D. Shepherd, 10th
Lab Head: August 2010
B. Hillam Brian Hillam, 10th
Technical Director: August 2010
T. O’Sullivan B Hillam pp T J O’Sullivan, 10th
Aug 2010
Release Date: 12 August 2010 Reference: P7784-10-003 Issue: Issue 1A
Modification History Issue Date Description Draft A 7 Jul 2010 First issue for comments Issue 1 10 August 2010 Addressed customer and TRT review comments on Draft A Issue 1A 12 August 2010 Fix calculation error in equation in Section 5 Issue 2 15 December 2010 Ofcom final
About Us Thales
Thales is a leading international electronics and systems group, addressing Aerospace and Space, Defence and Security markets worldwide. The Group’s civil and military businesses develop in parallel and share a common base of technologies to serve a single objective: the security of people, property and nations. Thales’s leading-edge technology is supported by 22,500 R&D engineers who offer a capability unmatched in Europe to develop and deploy field-proven mission-critical information systems. The Group builds its growth on its unique multidomestic strategy based on trusted partnerships with national customers and market players, while leveraging its global expertise to support local technology and industrial development. Thales employs 68,000 people in 50 countries with 2009 revenues of €12.9 billion.
Thales Research and Technology (UK) Limited Thales UK's Reading-based research & technology facility is the UK arm of the Thales corporate research centre. Its activities focus on providing solutions: Security and Communication Systems, Galileo and Position-Based Systems, and Enhanced Digital Environments. These are based on the key technologies of IP Networks and Network Security, Wireless Communications, Sensors and Signal Processing, and Navigation and Positioning. The facility offers a wide range of consultancy and development services to European Government Agencies and to industry throughout the world.
© Thales Research & Technology (UK) Ltd. The information contained herein is the property of Thales. It is not to be reproduced or released in whole or in part without the prior written permission of the company. Please address all requests to: Thales Research & Technology (UK) Limited, Worton Drive, Worton Grange Business Park, Reading RG2 0SB, England, for the attention of the Commercial Manager.
Thales Research & Technology (UK) Ltd. P7784 LTE Interference Study 862 - 863 MHz Breathing Apparatus Telemetry System Interference Study
P7784-10-003 Issue 2 Page 3 of 34
Executive Summary
This study has investigated the risk of interference from 4th
• To the BA Telemetry Entry Control Board from UEs used by on-lookers.
generation cellular radio (LTE, or Long Term Evolution) user equipments (UEs) – handsets, PC dongles etc. – transmitting in the 832 to 862 MHz band and a telemetry system operating at 862.9625 MHz and used by the fire service to provide two-way communication with fire fighters carrying breathing apparatus. It is recognised that the fire service has other allocations in this same band that could be used for different applications, however the study was limited to the breathing apparatus system.
Inspection of the results of type-approval testing of the Breathing Apparatus Telemetry (BA Telemetry)BA Telemetry equipment revealed that the RF performance of that equipment was good, and hence that the dominant interference mechanism was from noise sidebands of the LTE signal falling on the BA Telemetry system frequency.
Various scenarios were analysed, and it was determined that there was a potential for interference in three cases:
• To the BA Telemetry Portable Unit and Entry Control Board from UEs in buildings overlooking the incident.
• To the BA Telemetry Portable Unit, from a UE (possibly unattended) within the area being searched by the fire service.
Based on measurements of an LTE signal and the measured performance of the BA Telemetry equipment, the likelihood of such interference in practice was assessed.
Interference from on-lookers is most likely in an urban environment, and in this case keeping the public back from the BA Telemetry equipment by at least 10 m should be sufficient to avoid interference; such a separation is probably required for public safety in any case. In electrically-quiet rural areas a greater separation, up to 60 m, could be required if the BA Telemetry system is operating close to its range limit. The same considerations apply to the use of LTE by the emergency services; a separation distance of the same value is required between the two systems.
Interference from users overlooking the incident, in practice, is also likely to be worst in urban areas, where an interference range of as much as 340 m could be possible if the UE was using a large number of frequency slots in the adjacent 10 MHz band and there was a clear line-of-sight.
Interference from UEs within the area of the incident will in most cases be very localised, and so may be considered acceptable. The exception is the use of LTE by a fire fighter; this should therefore not be allowed in these circumstances.
Because the interference does not arise from deficiencies in the BA Telemetry equipment, possibilities for mitigation are limited. The simplest measure is to move the BA Telemetry equipment to 869.5 MHz provided, of course, that there is no worse interference on this frequency from other sources, which increases the minimum frequency separation from the LTE band to 7.5 MHz, greatly reducing interference from the closest 10 MHz LTE channel. Apart from the rare case of UEs with a clear view down over the incident in a rural area, this would in practice render most other interference extremely unlikely.
A further mitigation approach that could be considered would be a modification of the BA Telemetry system to add FEC. This would enable limited interference to be tolerated even when much stronger than the wanted signal, as well as improving the robustness of the system in general. However, such a change would not be straightforward to implement, because it would be very difficult, if indeed possible, to achieve backwards compatibility with existing equipment.
P7784 LTE Interference Study Thales Research & Technology (UK) Ltd. 862 - 863 MHz Breathing Apparatus Telemetry System Interference Study
P7784-10-003 Issue 2 Page 4 of 34
Contents
1 Introduction .................................................................................. 9
2 LTE Signals ................................................................................. 10
2.1 Overview of LTE Signal Characteristics ...................................... 10 2.2 LTE Signal Specifications ............................................................. 11 2.3 Measurements ................................................................................ 11 2.4 Summary ......................................................................................... 13
3 BA Telemetry System Communications Performance ........... 14
3.1 Overview ......................................................................................... 14 3.2 Theoretical Analysis ...................................................................... 14 3.3 Receiver Intermodulation and Spurious Responses .................. 15 3.4 LTE Interference Measurements ................................................... 16
4 LTE Take-up and Usage ............................................................ 18
4.1 UE Ownership ................................................................................. 18 4.2 Technology Distribution ................................................................ 18 4.3 Usage of LTE .................................................................................. 21 4.4 UE Transmission Profile ................................................................ 21
5 Interference Impact .................................................................... 23
6 Interference Scenarios .............................................................. 26
6.1 Interference to Entry Control Board ............................................. 28 6.2 Interference to Portable Unit ......................................................... 30 6.3 Interference Risk and Mitigation ................................................... 30 6.3.1 On-Lookers .............................................................................................................. 30 6.3.2 Other External LTE Users ........................................................................................ 31 6.3.3 Internal LTE Users ................................................................................................... 31 6.3.4 General Mitigation Approaches ............................................................................... 32
7 Conclusions ................................................................................ 33
Thales Research & Technology (UK) Ltd. P7784 LTE Interference Study 862 - 863 MHz Breathing Apparatus Telemetry System Interference Study
P7784-10-003 Issue 2 Page 5 of 34
Figures Figure 1: Likely UK Frequency Allocation ....................................................................................................10 Figure 2: Time Slot Structure .......................................................................................................................10 Figure 3: UE Spectrum .................................................................................................................................12 Figure 4: Message Success Rate ................................................................................................................15 Figure 5: BA Telemetry Equipment Test Configuration ...............................................................................16 Figure 6: Mobile Subscriptions by Network Operator ..................................................................................18 Figure 7: 3G Subscriptions by Network Operator ........................................................................................19 Figure 8: Digital Technology Adoption, Q1 2008 and Q1 2009 ...................................................................19 Figure 9: Predicted Take-up of 3G and LTE ................................................................................................20 Figure 10: Distribution of Mobile Connections between Technologies ........................................................20 Figure 11: Interference Scenarios ................................................................................................................27 Figure 12: Path Loss vs. Range ...................................................................................................................28
Tables Table 1: UE Spurious Output Limits .............................................................................................................11 Table 2: UE Spurious Output Spectral Density Limits .................................................................................11 Table 3: Measured Interference Levels (Worst Case) .................................................................................12 Table 4: Measured Interference Levels (Single Frequency Slot) .................................................................13 Table 5: Summary of Interference, Current BA Telemetry Frequency ........................................................13 Table 6: Summary of Interference, 869.5 MHz ............................................................................................13 Table 7: Failure Probabilities and Interference Power .................................................................................17 Table 8: Allowable Interference ...................................................................................................................23 Table 9: Differential Path Loss, Strong Signal, Single Interferer .................................................................24 Table 10: Isolation for 3 dB Increase in Noise Floor ....................................................................................24 Table 11: Differential Path Loss, Strong Signal, Single Interferer, 869.5 MHz ............................................24 Table 12: Isolation for 3 dB Increase in Noise Floor, 869.5 MHz ................................................................25 Table 13: “Keep Out” Range for On-lookers, Based on Spectral Mask .......................................................29 Table 14: “Keep Out” Range for On-lookers, Based on Worst Case Measurements ..................................29 Table 15: “Keep Out” Range for On-lookers, Based on Single Frequency Slot Measurements .................29 Table 16: “Keep Out” Range for Users Overlooking Incident, Based on Spectral Mask .............................29 Table 17: “Keep Out” Range for Users Overlooking Incident, Based on Worst Case Measurements ........29 Table 18: “Keep Out” Range for Users Overlooking Incident, Based on Single Frequency Slot
Measurements ......................................................................................................................................30
P7784 LTE Interference Study Thales Research & Technology (UK) Ltd. 862 - 863 MHz Breathing Apparatus Telemetry System Interference Study
P7784-10-003 Issue 2 Page 6 of 34
Glossary 2G Second Generation Cellular Radio (i.e. GSM)
3G Third Generation Cellular Radio
BCH Bose-Chaudhuri-Hocquenghem
CRC Cyclic Redundancy Check
FDD Frequency Division Duplex
FEC Forward Error Correction
FSK Frequency Shift Keying
GMSK Gaussian Minimum Shift Keying
GSM Global System for Mobile communication
LTE Long Term Evolution (i.e. 4th generation cellular radio)
MMS Multimedia Messaging Service
PA Power Amplifier
RB Resource Block
RF Radio Frequency
RMS Root Mean Square
TRT (UK) Thales Research and Technology (UK) Ltd.
UE User Equipment – a mobile phone or other device providing a network connection, e.g. a PC dongle
UK United Kingdom
Thales Research & Technology (UK) Ltd. P7784 LTE Interference Study 862 - 863 MHz Breathing Apparatus Telemetry System Interference Study
P7784-10-003 Issue 2 Page 7 of 34
References
[1] MG41A, At-Incident Telemetry, Common Air Interface Standard, Issue 1.4, (Home Office, 3rd
[2] 10-1465-01, Investigation of GTFM and GMSK Modulation Methods, (Racal Research Ltd., 19
August 1999)
th
[3] P7784-10-001, Investigation into the effects of LTE out of band emissions in the band 862-863 MHz, Issue 1, (TRT(UK), 24th February 2010)
December 1985)
[4] Recommendation P.1411-5, Propagation data and prediction methods for the planning of short-range outdoor radiocommunication systems and radio local area networks in the frequency range 300 MHz to 100 GHz, (ITU-R, 10/2009)
[5] The Communications Market 2009, (Ofcom, 2009)
[6] 3GPP TS 36.521-1, 3rd Generation Partnership Project; Technical Specification Group Radio Access Network; Evolved Universal Terrestrial Radio Access (E-UTRA); User Equipment (UE) conformance specification Radio transmission and reception, Part 1: Conformance Testing, V8.4.0, (ETSI, 12/2009)
[7] 3GPP TS 36.211, 3rd Generation Partnership Project; Technical Specification Group Radio Access Network; Evolved Universal Terrestrial Radio Access (E-UTRA); Physical Channels and Modulation, V9.0.0, (ETSI, 12/2009)
[8] EN 300 220-1, Electromagnetic compatibility and Radio spectrum Matters (ERM); Short Range Devices (SRD); Radio equipment to be used in the 25 MHz to 1 000 MHz frequency range with power levels ranging up to 500 mW; Part 1: Technical characteristics and test methods, V2.3.1, (ETSI, 02/2010)
[9] WD/EN 300220_2 Class 1/WD-002, Test Report Form for Tx/Rx (Class 1 Receiver) 300 220-2 V2.1.1 (2006-04) Part 2: Harmonised EN covering Essential Requirements under Article 3.2 of the R&TTE Directive, (Wood & Douglas, 20th
[10] Reference Data for Engineers – Radio, Electronics, Computer and Communication, 8
November 2008) th
[11] MC/CC0251/REP012/2, Man-Made Noise Measurement Programme (AY4119), Final Report, Issue 2, (Mass Consultants Ltd., September 2003)
Edition (SAMS, 1993)
P7784 LTE Interference Study Thales Research & Technology (UK) Ltd. 862 - 863 MHz Breathing Apparatus Telemetry System Interference Study
P7784-10-003 Issue 2 Page 8 of 34
This Page is Intentionally Blank
Thales Research & Technology (UK) Ltd. P7784 LTE Interference Study 862 - 863 MHz Breathing Apparatus Telemetry System Interference Study
P7784-10-003 Issue 2 Page 9 of 34
1 Introduction This report presents the results of an investigation into the risk of interference from 4th
Section
generation cellular (Long Term Evolution or LTE) user equipments (UEs) to the BA Telemetry used by the UK Fire Service.
The report is structured as follows:
2 gives a brief overview of the LTE signals and their specifications, and also presents some measurements of the level of interference that they may generate.
Section 3 assesses the communication performance of the BA Telemetry system, both from a theoretical point of view and by practical measurements.
Section 4 attempts to predict the take-up of LTE and its usage.
Section 5 considers different interference mechanisms to determine which is dominant, and computes the isolation between the UE and the BA Telemetry equipment necessary to avoid interference.
Section 6 combines the information from the preceding sections to determine the risk of interference. Approaches to mitigate that risk are also considered.
Finally, Section 7 summarises the results of the study.
P7784 LTE Interference Study Thales Research & Technology (UK) Ltd. 862 - 863 MHz Breathing Apparatus Telemetry System Interference Study
P7784-10-003 Issue 2 Page 10 of 34
2 LTE Signals This section deals with the specification of the LTE signals in so far as it affects the present study, and measurements of the spectral spreading due to intermodulation that may occur in practical UEs.
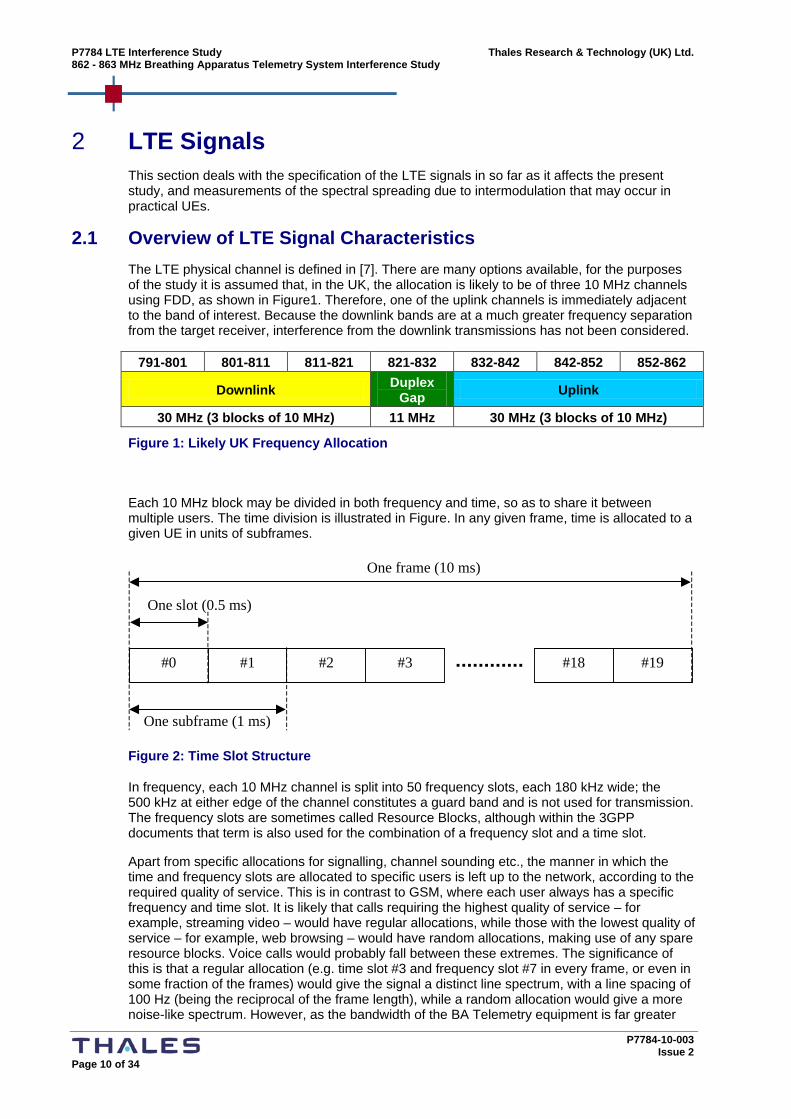
2.1 Overview of LTE Signal Characteristics The LTE physical channel is defined in [7]. There are many options available, for the purposes of the study it is assumed that, in the UK, the allocation is likely to be of three 10 MHz channels using FDD, as shown in Figure1. Therefore, one of the uplink channels is immediately adjacent to the band of interest. Because the downlink bands are at a much greater frequency separation from the target receiver, interference from the downlink transmissions has not been considered.
791-801 801-811 811-821 821-832 832-842 842-852 852-862
Downlink Duplex Gap Uplink
30 MHz (3 blocks of 10 MHz) 11 MHz 30 MHz (3 blocks of 10 MHz)
Figure 1: Likely UK Frequency Allocation
Each 10 MHz block may be divided in both frequency and time, so as to share it between multiple users. The time division is illustrated in Figure. In any given frame, time is allocated to a given UE in units of subframes.
#0 #3 #2 #1 #18 #19
One subframe (1 ms)
One frame (10 ms)
One slot (0.5 ms)
Figure 2: Time Slot Structure
In frequency, each 10 MHz channel is split into 50 frequency slots, each 180 kHz wide; the 500 kHz at either edge of the channel constitutes a guard band and is not used for transmission. The frequency slots are sometimes called Resource Blocks, although within the 3GPP documents that term is also used for the combination of a frequency slot and a time slot.
Apart from specific allocations for signalling, channel sounding etc., the manner in which the time and frequency slots are allocated to specific users is left up to the network, according to the required quality of service. This is in contrast to GSM, where each user always has a specific frequency and time slot. It is likely that calls requiring the highest quality of service – for example, streaming video – would have regular allocations, while those with the lowest quality of service – for example, web browsing – would have random allocations, making use of any spare resource blocks. Voice calls would probably fall between these extremes. The significance of this is that a regular allocation (e.g. time slot #3 and frequency slot #7 in every frame, or even in some fraction of the frames) would give the signal a distinct line spectrum, with a line spacing of 100 Hz (being the reciprocal of the frame length), while a random allocation would give a more noise-like spectrum. However, as the bandwidth of the BA Telemetry equipment is far greater
Thales Research & Technology (UK) Ltd. P7784 LTE Interference Study 862 - 863 MHz Breathing Apparatus Telemetry System Interference Study
P7784-10-003 Issue 2 Page 11 of 34
than 100 Hz, the difference between the two cases does not have any appreciable effect on the extent of interference in this case.
2.2 LTE Signal Specifications Although many classes of UE are allowed in the definition of LTE, only one has been specified to date, and this has an ERP of 23 dBm (irrespective of how many frequency slots are being transmitted). The out-of-band requirements on the UE are specified in [6] and are summarised for the 10 MHz channel case in Table 1.
Frequency Offset Level Measurement Bandwidth 0 to 1 MHz −18 dBm 30 kHz 1 to 5 MHz −10 dBm 1 MHz 5 to 10 MHz −13 dBm 1 MHz 10 to 15 MHz −25 dBm 1 MHz Over 15 MHz −36 dBm 100 kHz
Table 1: UE Spurious Output Limits
Since, from the point of view of interference to the BA Telemetry system, the interference created by LTE signals may be treated as noise (see Section 3.4), these may readily be converted to spectral density, as shown in Table 2.
Frequency Offset Spectral Density 0 to 1 MHz −63 dBm/Hz 1 to 5 MHz −70 dBm/Hz 5 to 10 MHz −73 dBm/Hz 10 to 15 MHz −85 dBm/Hz Over 15 MHz −86 dBm/Hz
Table 2: UE Spurious Output Spectral Density Limits
2.3 Measurements In order to estimate the spectral spreading that might occur in practice, and its dependence on the signal parameters (number of RBs etc), some measurements were made using a Rohde and Schwarz SMBV100A signal generator feeding a transistor power amplifier of similar characteristics to that expected in a practical UE. Initially, a signal using all frequency slots was generated, and the level into the amplifier adjusted so as to just reach the spectral mask specification at one point. (The power level was not 23 dBm, but this is irrelevant; in practice, the amplifier would have been designed to achieve the desired performance at this power level.) The spectrum was measured in a 30 kHz bandwidth and video-averaged. Note that it was necessary to simulate four UEs in order to occupy all the frequency slots and two UEs to occupy half of them.
When a UE occupies fewer frequency slots, it nevertheless maintains the same transmitted power; of course, the spectral spreading is different, and the margin against the limit may be greater. A UE could handle this in two ways: the simplest is just to keep everything the same, and accept the improved margin against specification, while the alternative is to adjust the PA bias etc. so as to maintain the same margin against specification; this may give benefits in terms of power consumption. For the testing here, no change was made to the conditions as the bandwidth was varied; however, the impact of making such a change is considered later. The results are shown in Figure 3.
P7784 LTE Interference Study Thales Research & Technology (UK) Ltd. 862 - 863 MHz Breathing Apparatus Telemetry System Interference Study
P7784-10-003 Issue 2 Page 12 of 34
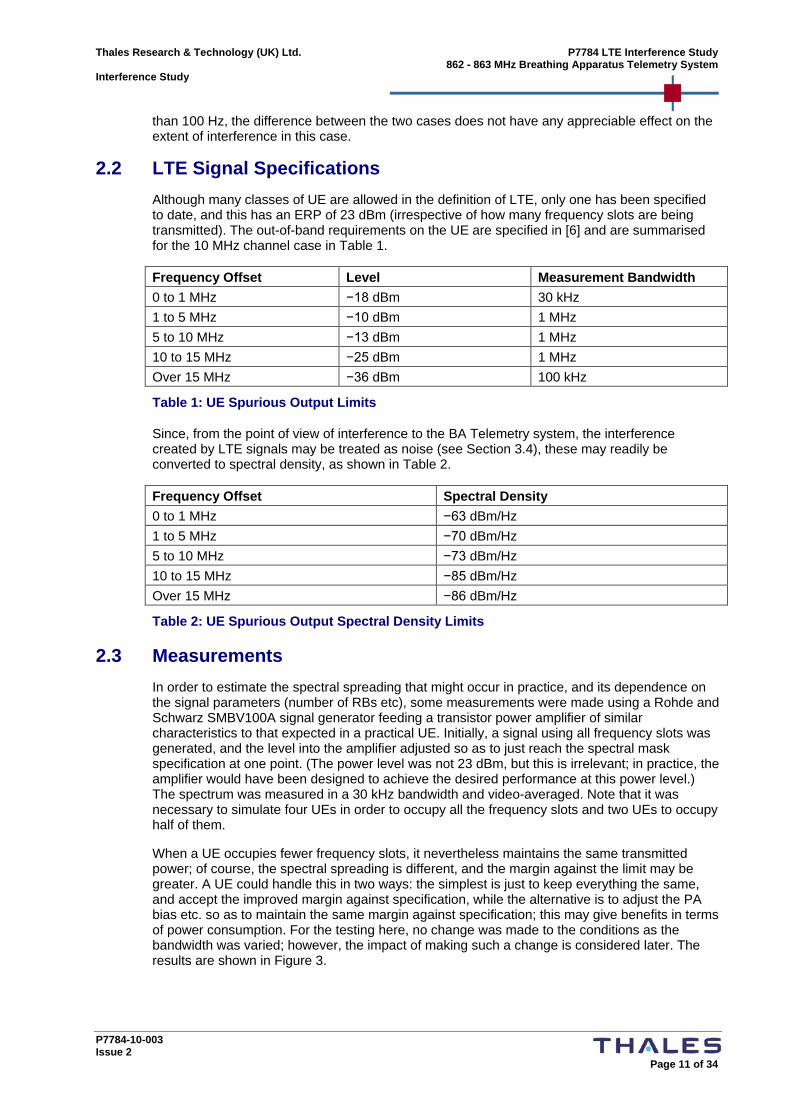
Figure 3: UE Spectrum
It may be seen that the limiting point on the spectral mask is not, as expected, 0 MHz offset but rather the start of the 1 to 5 MHz offset region, and that the worst case is when all frequency slots are allocated. The impact of this is that the actual noise from a UE in the closest 10 MHz channel at the current BA Telemetry frequency of 862.9625 MHz (i.e. just under 1 MHz offset) is approximately 7 dB better than predicted from the spectral mask; for UEs in the other 10 MHz channels, the level is at least 25 dB lower still, compared with 15 to 16 dB as predicted from the spectral mask. Moving the BA Telemetry equipment to 869.5 MHz would reduce the level from a UE in the neighbouring channel by about 19 dB in the worst case, and far more in general.
If the UE were to adjust its PA operating point so as to just achieve the spectral mask whatever the number of frequency slots, the effect would be to shift the purple (13 slot) and cyan (1 slot) curves in the above plot upwards. However, it is clear that worst case at both the current and alternative BA Telemetry frequencies remains the “all frequency slots” case – indeed, it is hard to conceive of a spectrum that has an appreciably higher level at the BA Telemetry frequency than the specification at 1 MHz offset.
Taking the worst case over the examples above, Table 3 shows the measured spectral density (normalised to +23 dBm transmitted power) at the BA Telemetry current frequency of 862.9625 MHz and at a possible alternative frequency of 869.5 MHz.
Current BA Telemetry Frequency
869.5 MHz
Nearest 10 MHz channel −70 dBm/Hz −89 dBm/Hz Middle 10 MHz channel <−95 dBm/Hz <−95 dBm/Hz Furthest 10 MHz channel <−95 dBm/Hz <−95 dBm/Hz
Table 3: Measured Interference Levels (Worst Case)
Because a UE maintains constant power independent of its bandwidth (and so data rate), it follows that the best performance will be obtained if the network selects the smallest number of frequency slots that will support the required data rate. As this will often be just one slot, especially for voice calls, the results for that case are given in Table 4; the values are affected by measurement system noise, and may in fact be even better than stated. Note that these
-90
-80
-70
-60
-50
-40
-30
-20
-10
0
852 854 856 858 860 862 864 866 868 870 872Frequency (MHz)
Pow
er/3
0kH
z (d
Bm
)
50 freq. slots25 freq. slots13 freq. slots1 freq. slotLimit
Thales Research & Technology (UK) Ltd. P7784 LTE Interference Study 862 - 863 MHz Breathing Apparatus Telemetry System Interference Study
P7784-10-003 Issue 2 Page 13 of 34
would be degraded, perhaps significantly, if the UE adjusted its PA operating point as described above. However, it was found to be virtually impossible to distort the signal sufficiently to reach the specification limit in this case, and hence it is perhaps reasonable to use the data assuming no adjustment.
Current BA Telemetry Frequency
869.5 MHz
Nearest 10 MHz channel <−105 dBm/Hz <−110 dBm/Hz Middle 10 MHz channel <−110 dBm/Hz <−110 dBm/Hz Furthest 10 MHz channel <−110 dBm/Hz <−110 dBm/Hz
Table 4: Measured Interference Levels (Single Frequency Slot)
Closer investigation of the signals revealed some unexpected phenomena; while these do not affect the conclusions above, they are reported here since they have a bearing on the way in which measurements must be made.
When observed “out of band” and without a PA, it was noted that the LTE signal had very narrow spikes every ~72 μs. These are assumed to be caused by discontinuities in the transmitted waveform after every symbol and its cyclic prefix: the symbol period is 66.67 μs and the cyclic prefix 4.69 μs, making a total of 71.36 μs. When the signal is passed through a PA, the intermodulation distortion swamps these impulses except when the signal only occupies one or two frequency slots. The presence of these impulses can cause problems with measuring the interference power; if measured using video averaging, the power is underestimated by several dB. Using true RMS averaging, however, gives an accurate result.
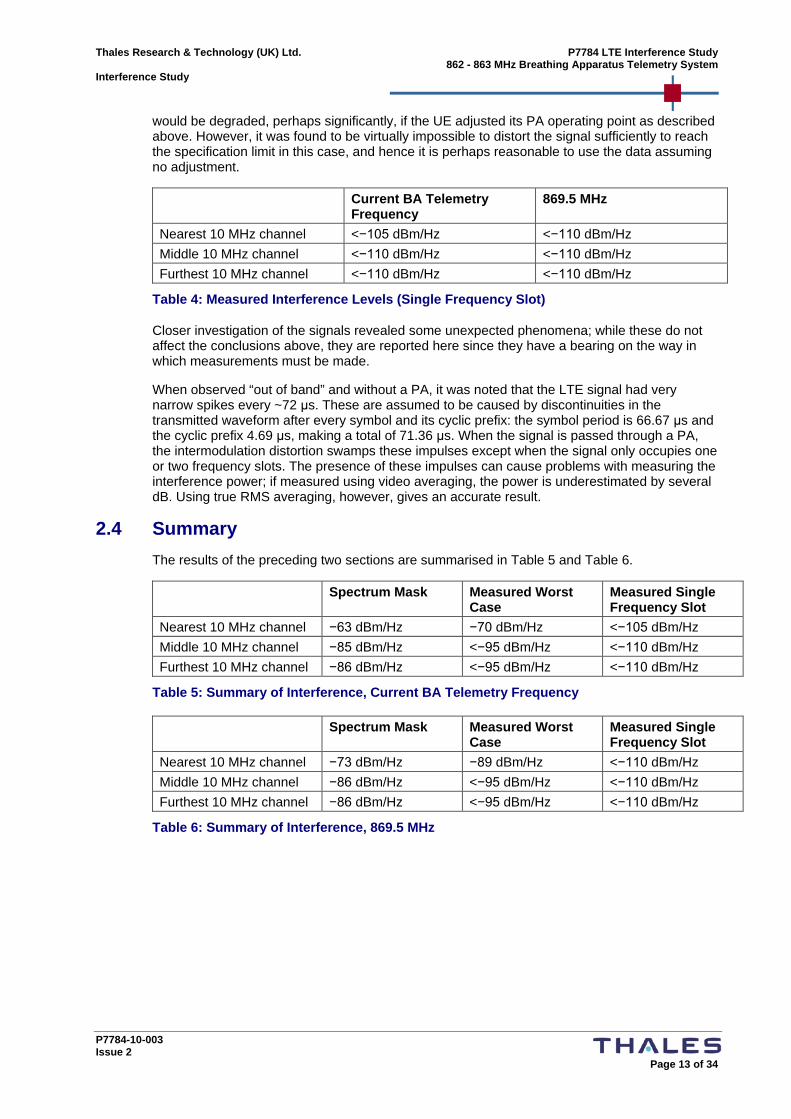
2.4 Summary The results of the preceding two sections are summarised in Table 5 and Table 6.
Spectrum Mask Measured Worst Case
Measured Single Frequency Slot
Nearest 10 MHz channel −63 dBm/Hz −70 dBm/Hz <−105 dBm/Hz Middle 10 MHz channel −85 dBm/Hz <−95 dBm/Hz <−110 dBm/Hz Furthest 10 MHz channel −86 dBm/Hz <−95 dBm/Hz <−110 dBm/Hz
Table 5: Summary of Interference, Current BA Telemetry Frequency
Spectrum Mask Measured Worst Case
Measured Single Frequency Slot
Nearest 10 MHz channel −73 dBm/Hz −89 dBm/Hz <−110 dBm/Hz Middle 10 MHz channel −86 dBm/Hz <−95 dBm/Hz <−110 dBm/Hz Furthest 10 MHz channel −86 dBm/Hz <−95 dBm/Hz <−110 dBm/Hz
Table 6: Summary of Interference, 869.5 MHz
P7784 LTE Interference Study Thales Research & Technology (UK) Ltd. 862 - 863 MHz Breathing Apparatus Telemetry System Interference Study
P7784-10-003 Issue 2 Page 14 of 34
3 BA Telemetry System Communications Performance This section calculates the theoretical performance expected from the BA Telemetry equipment; the results of practical measurements to confirm this are then presented.
3.1 Overview The BA Telemetry system is a two-way telemetry system operating at 862.9625 MHz, comprising an Entry Control Board and one or more Portable Units, which are attached to the breathing apparatus carried by fire fighters. It provides the following key capabilities:
• Monitoring of the air remaining within the fire fighter’s breathing apparatus
• Monitoring whether or not the fire fighter is moving
• Panic button
• Evacuation command (to a specific individual or to everyone)
Both the Entry Control Board and Portable Unit use a common design of radio module, and internal access to this was not possible. This, together with the nature of the protocol (in particular, the low message rate), made measurements of RF characteristics very difficult. Accordingly, the performance of the system was assessed in terms of theoretical analysis based on knowledge of the communication system [1], “black box” measurements of sensitivity with and without noise and interference, and other characteristics extracted from the results of type approval testing [9].
3.2 Theoretical Analysis The protocol used by the BA Telemetry equipment is defined in [1]. Messages consist of 18 bytes, including a 2 byte CRC, and are preceded by bit and frame sync sequences, the latter consisting of 2 bytes.
The CRC detects any errors in the message (with a very low probability of missed detection); there is no FEC, and so in order for a message to be accepted, every bit must be received correctly. Frame sync must also be determined correctly; whether errors in the frame sync sequence are allowed or not, is not specified. Bit sync must also be detected, once again the technique is not specified. However, good design practice would ensure that this was not the limiting factor.
Thales Research & Technology (UK) Ltd. P7784 LTE Interference Study 862 - 863 MHz Breathing Apparatus Telemetry System Interference Study
P7784-10-003 Issue 2 Page 15 of 34
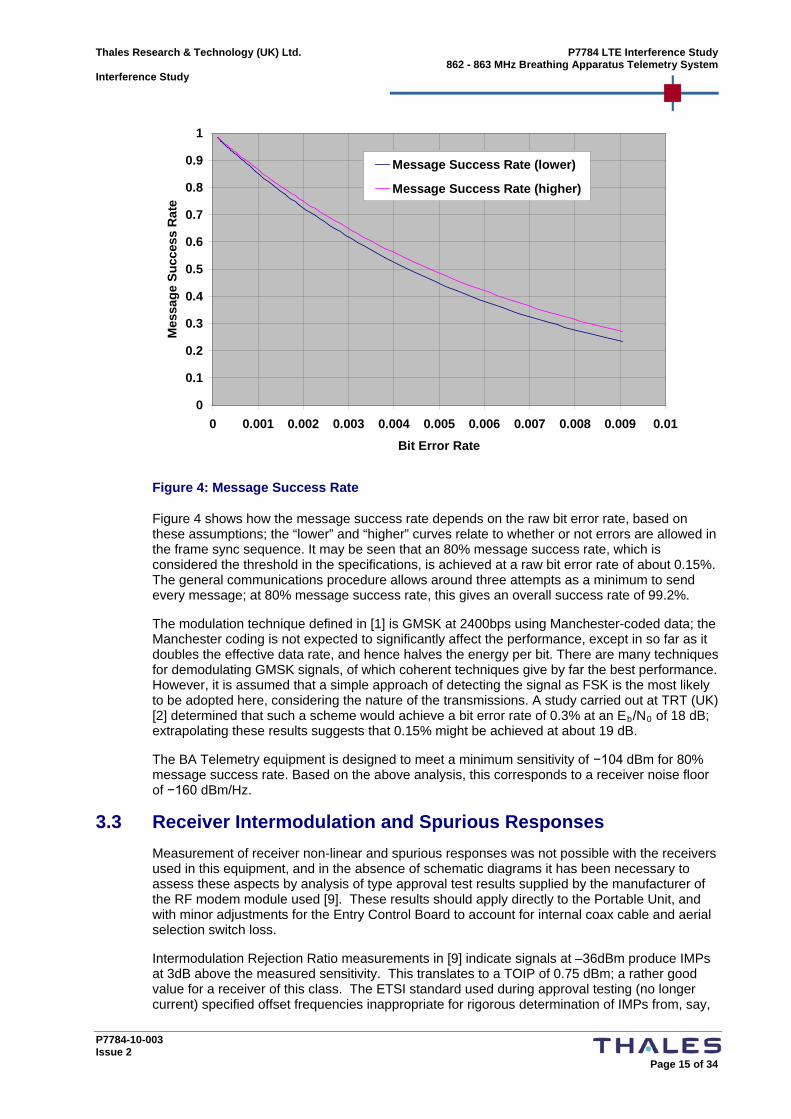
Figure 4: Message Success Rate
Figure 4 shows how the message success rate depends on the raw bit error rate, based on these assumptions; the “lower” and “higher” curves relate to whether or not errors are allowed in the frame sync sequence. It may be seen that an 80% message success rate, which is considered the threshold in the specifications, is achieved at a raw bit error rate of about 0.15%. The general communications procedure allows around three attempts as a minimum to send every message; at 80% message success rate, this gives an overall success rate of 99.2%.
The modulation technique defined in [1] is GMSK at 2400bps using Manchester-coded data; the Manchester coding is not expected to significantly affect the performance, except in so far as it doubles the effective data rate, and hence halves the energy per bit. There are many techniques for demodulating GMSK signals, of which coherent techniques give by far the best performance. However, it is assumed that a simple approach of detecting the signal as FSK is the most likely to be adopted here, considering the nature of the transmissions. A study carried out at TRT (UK) [2] determined that such a scheme would achieve a bit error rate of 0.3% at an Eb/N0
3.3 Receiver Intermodulation and Spurious Responses
of 18 dB; extrapolating these results suggests that 0.15% might be achieved at about 19 dB.
The BA Telemetry equipment is designed to meet a minimum sensitivity of −104 dBm for 80% message success rate. Based on the above analysis, this corresponds to a receiver noise floor of −160 dBm/Hz.
Measurement of receiver non-linear and spurious responses was not possible with the receivers used in this equipment, and in the absence of schematic diagrams it has been necessary to assess these aspects by analysis of type approval test results supplied by the manufacturer of the RF modem module used [9]. These results should apply directly to the Portable Unit, and with minor adjustments for the Entry Control Board to account for internal coax cable and aerial selection switch loss.
Intermodulation Rejection Ratio measurements in [9] indicate signals at –36dBm produce IMPs at 3dB above the measured sensitivity. This translates to a TOIP of 0.75 dBm; a rather good value for a receiver of this class. The ETSI standard used during approval testing (no longer current) specified offset frequencies inappropriate for rigorous determination of IMPs from, say,
0
0.1
0.2
0.3
0.4
0.5
0.6
0.7
0.8
0.9
1
0 0.001 0.002 0.003 0.004 0.005 0.006 0.007 0.008 0.009 0.01Bit Error Rate
Mes
sage
Suc
cess
Rat
eMessage Success Rate (lower)
Message Success Rate (higher)
P7784 LTE Interference Study Thales Research & Technology (UK) Ltd. 862 - 863 MHz Breathing Apparatus Telemetry System Interference Study
P7784-10-003 Issue 2 Page 16 of 34
two LTE frequency slots suitably spaced to fall on channel. However, it is safe to assume that front-end selectivity will provide little attenuation over the few megahertz involved between 862.9625 MHz and the closest frequency slots, so extrapolation should be valid. Using the Friis line of sight propagation expression, for a 0.75 dBm TOIP receiver, to generate the same intermodulation levels allowed by the spectral mask for a 23 dBm handset PA, two 0dBi aerials would need to be spaced at ~2.5m. At larger spacing, PA distortion will predominate. In practise the calculation behind these predictions is optimistic: current aerial practise in handsets favours gains below 0 dBi; sequential intermodulation is not additive (when the peaks of an envelope have been clipped by a PA, they are no longer available to contribute to further distortion in a receiver).
Modem spurious responses due to the second 455kHz IF exist within the LTE spectral spread and will contribute to the interference process. However, their magnitude is miniscule compared with the on-channel response, within a region of relatively flat LTE spectral coverage.
Receiver non-linear and spurious responses are of no concern when assessing susceptibility to LTE emissions.
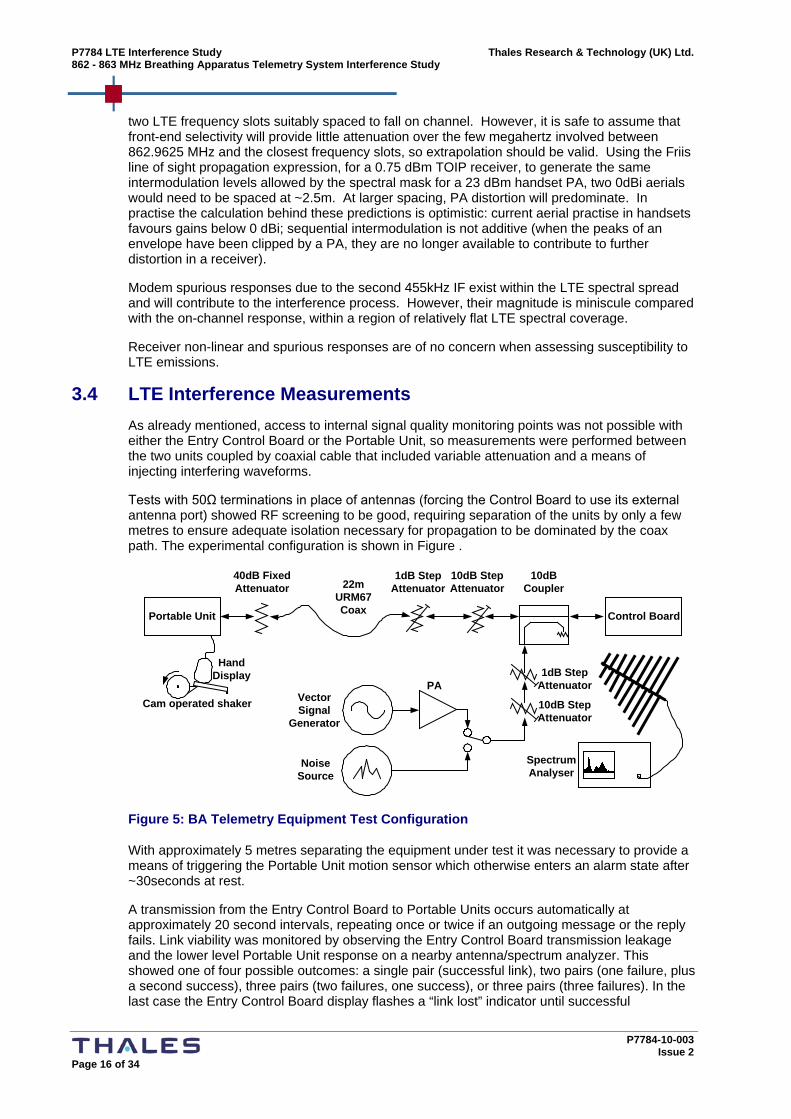
3.4 LTE Interference Measurements As already mentioned, access to internal signal quality monitoring points was not possible with either the Entry Control Board or the Portable Unit, so measurements were performed between the two units coupled by coaxial cable that included variable attenuation and a means of injecting interfering waveforms.
Tests with 50Ω terminations in place of antennas (forcing the Control Board to use its external antenna port) showed RF screening to be good, requiring separation of the units by only a few metres to ensure adequate isolation necessary for propagation to be dominated by the coax path. The experimental configuration is shown in Figure .
22m URM67CoaxPortable Unit
40dB FixedAttenuator
Hand Display
Cam operated shaker
1dB StepAttenuator
10dB StepAttenuator
10dB Coupler
Control Board
Noise Source
Vector Signal
Generator
PA1dB Step
Attenuator
10dB StepAttenuator
Spectrum Analyser
Figure 5: BA Telemetry Equipment Test Configuration
With approximately 5 metres separating the equipment under test it was necessary to provide a means of triggering the Portable Unit motion sensor which otherwise enters an alarm state after ~30seconds at rest.
A transmission from the Entry Control Board to Portable Units occurs automatically at approximately 20 second intervals, repeating once or twice if an outgoing message or the reply fails. Link viability was monitored by observing the Entry Control Board transmission leakage and the lower level Portable Unit response on a nearby antenna/spectrum analyzer. This showed one of four possible outcomes: a single pair (successful link), two pairs (one failure, plus a second success), three pairs (two failures, one success), or three pairs (three failures). In the last case the Entry Control Board display flashes a “link lost” indicator until successful
Thales Research & Technology (UK) Ltd. P7784 LTE Interference Study 862 - 863 MHz Breathing Apparatus Telemetry System Interference Study
P7784-10-003 Issue 2 Page 17 of 34
communication is re-established. Results were logged over sufficient intervals to accumulate an adequate number of samples for a reasonable estimate of failure probability, typically 30-40 events.
With all components characterized for the frequency of use, and the directional coupler reversed as necessary, the power transmitted by each unit was measured: 24.86 dBm from the Portable Unit; 21.5 dBm from the Entry Control Board, somewhat lower than anticipated. The attenuator setting giving closest to an average of 50% link success was determined iteratively: 87 dB attenuation gave 33% failures, while 88 dB gave 79% failures. On the assumption that the lower power from the Entry Control Board dominates link failure, and adding the various calibration terms, the Portable Unit would appear to have a sensitivity of around –111.7 dBm. This is in good agreement with the value of −112.5 dBm measured under normal test conditions during type approval, and considerably exceeds the −104 dBm specification.
The above procedure was repeated while injecting wideband noise to the Control Board receiver corresponding to 37.5 dB excess noise ratio at the antenna port. In this case, signal levels and the attenuator granularity conspired to give 46% failure probability at 57 dB attenuation, from which it may be calculated that the signal power is −81.2 dBm and the noise power −136.5 dBm, giving an Eb/N0
The results of
of 18.5 dB. This is in good agreement with the value of 19 dB from the theoretical analysis. Comparing the measurements with and without added noise implies a receiver noise floor of −167 dBm/Hz, i.e. a noise figure of 7 dB.
Repeating the last measurement with the link attenuation reduced by 20 dB required 20 dB more noise for an almost identical failure probability, indicating the absence of non-linear mechanisms.
Two cases of LTE signal distortion were considered: where drive conditions were adjusted for each condition to just scrape within the specification spectral mask, and drive conditions for constant average output power as the bandwidth varied. The difference between constant power settings and “just scraping specs” proved to be rather small, although the latter could not be achieved with one frequency slot, irrespective of PA input level. Constant power conditions were therefore adopted for subsequent measurements.
Four test signals were chosen: four user equipments (UEs) covering the full band allocation, two UEs occupying the upper frequencies, one UE at the top or the band, and a single 180 kHz frequency slot at the upper band edge. For comparison, wideband noise measurements were also included.
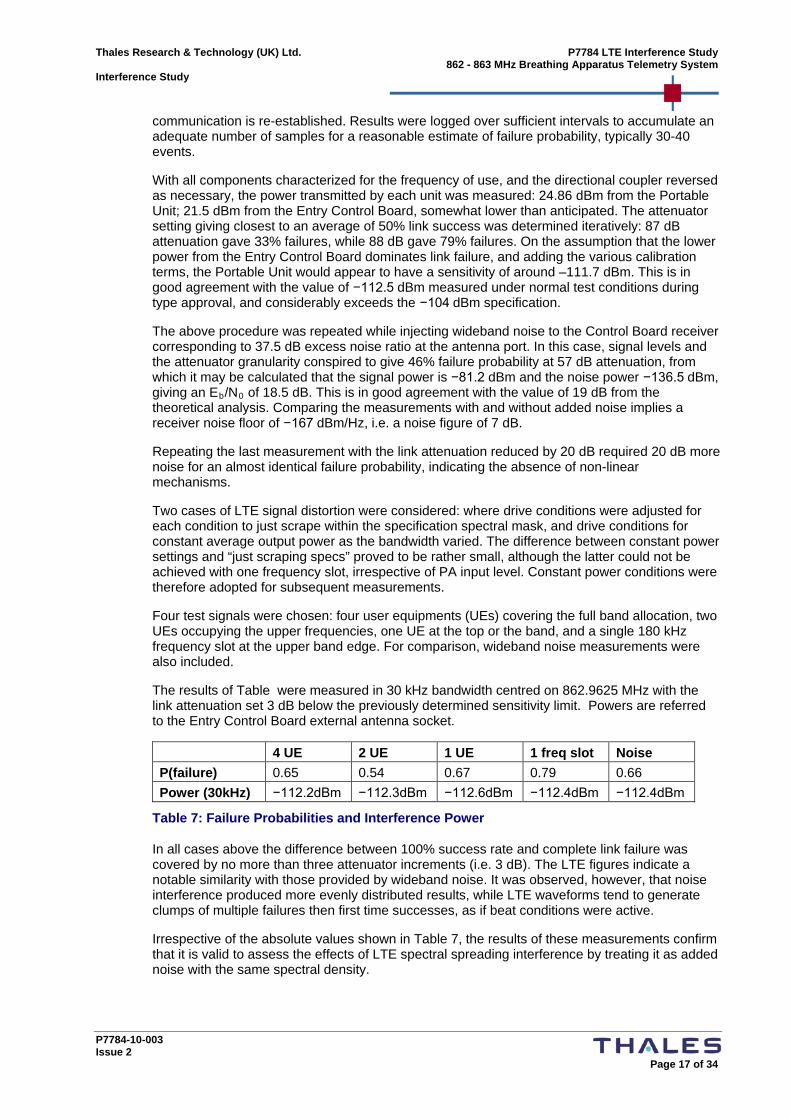
Table were measured in 30 kHz bandwidth centred on 862.9625 MHz with the link attenuation set 3 dB below the previously determined sensitivity limit. Powers are referred to the Entry Control Board external antenna socket.
4 UE 2 UE 1 UE 1 freq slot Noise P(failure) 0.65 0.54 0.67 0.79 0.66 Power (30kHz) −112.2dBm −112.3dBm −112.6dBm −112.4dBm −112.4dBm
Table 7: Failure Probabilities and Interference Power
In all cases above the difference between 100% success rate and complete link failure was covered by no more than three attenuator increments (i.e. 3 dB). The LTE figures indicate a notable similarity with those provided by wideband noise. It was observed, however, that noise interference produced more evenly distributed results, while LTE waveforms tend to generate clumps of multiple failures then first time successes, as if beat conditions were active.
Irrespective of the absolute values shown in Table 7, the results of these measurements confirm that it is valid to assess the effects of LTE spectral spreading interference by treating it as added noise with the same spectral density.
P7784 LTE Interference Study Thales Research & Technology (UK) Ltd. 862 - 863 MHz Breathing Apparatus Telemetry System Interference Study
P7784-10-003 Issue 2 Page 18 of 34
4 LTE Take-up and Usage This section deals with estimating the number and usage of LTE equipment in order to estimate the interference risk; as such, it is by nature more speculative than the rest of the report. It is structured as follows: Section 4.1 briefly summarises the number of mobile subscriptions and its growth rate, Section 4.2 attempts to predict the distribution of subscriptions across the available technologies and its changes with time, while Section 4.3 considers how LTE might be used in the early years of its introduction. Finally, Section 4.4 gives some information on the likely transmission profile of UEs engaged in different types of call.
4.1 UE Ownership As LTE has not yet been introduced in the UK, the best source of information for predicting its usage comes from market data on the current usage of GSM and 3G mobile networks. Most such market data is commercially sensitive and so not generally available; however, each year Ofcom produces a report on the communications market in the UK, and the most recent of these at the time of the study [5], published in 2009 and covering the market up to the end of 2008, is used as the source of the information here. Figure 6 to Figure 8 in this sub-section are © Ofcom copyright 2009.
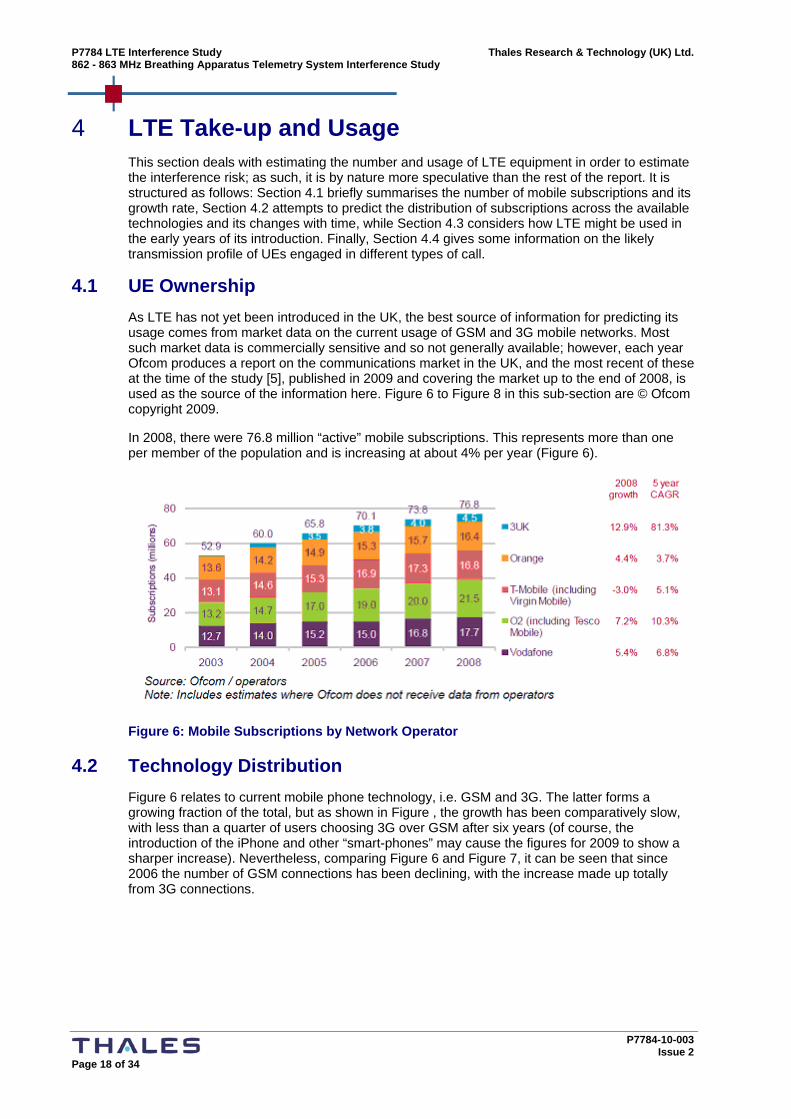
In 2008, there were 76.8 million “active” mobile subscriptions. This represents more than one per member of the population and is increasing at about 4% per year (Figure 6).
Figure 6: Mobile Subscriptions by Network Operator
4.2 Technology Distribution Figure 6 relates to current mobile phone technology, i.e. GSM and 3G. The latter forms a growing fraction of the total, but as shown in Figure , the growth has been comparatively slow, with less than a quarter of users choosing 3G over GSM after six years (of course, the introduction of the iPhone and other “smart-phones” may cause the figures for 2009 to show a sharper increase). Nevertheless, comparing Figure 6 and Figure 7, it can be seen that since 2006 the number of GSM connections has been declining, with the increase made up totally from 3G connections.
Thales Research & Technology (UK) Ltd. P7784 LTE Interference Study 862 - 863 MHz Breathing Apparatus Telemetry System Interference Study
P7784-10-003 Issue 2 Page 19 of 34
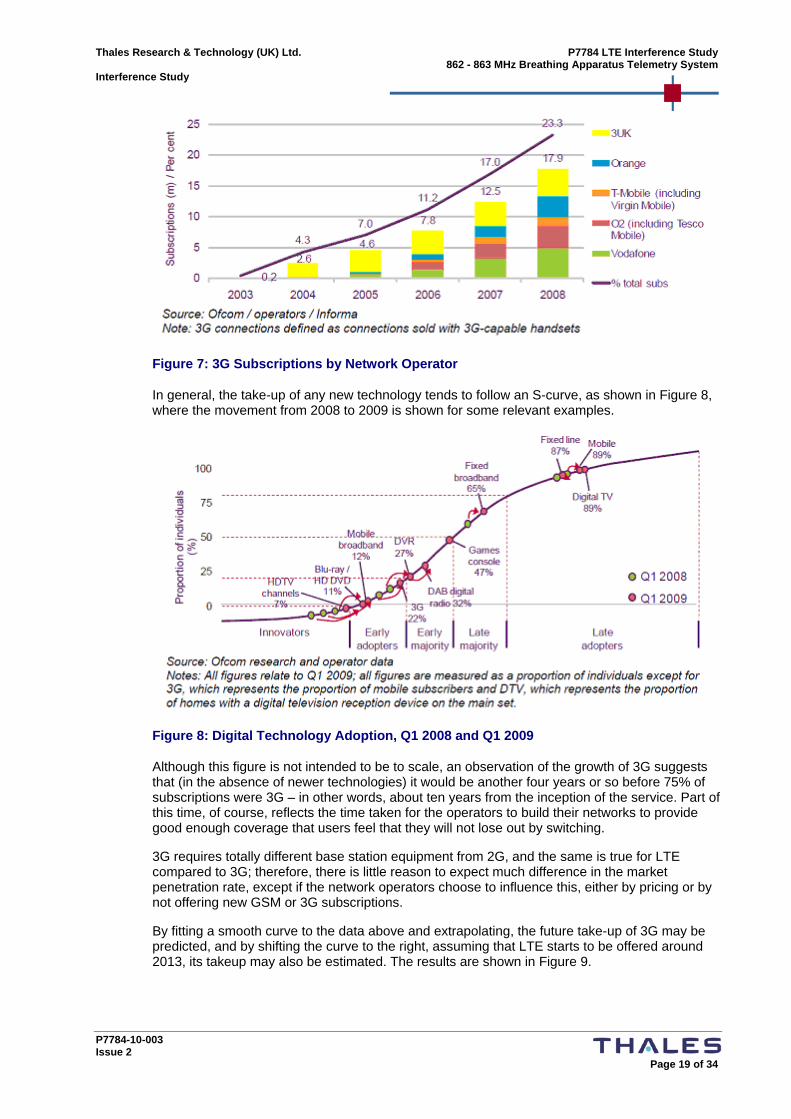
Figure 7: 3G Subscriptions by Network Operator
In general, the take-up of any new technology tends to follow an S-curve, as shown in Figure 8, where the movement from 2008 to 2009 is shown for some relevant examples.
Figure 8: Digital Technology Adoption, Q1 2008 and Q1 2009
Although this figure is not intended to be to scale, an observation of the growth of 3G suggests that (in the absence of newer technologies) it would be another four years or so before 75% of subscriptions were 3G – in other words, about ten years from the inception of the service. Part of this time, of course, reflects the time taken for the operators to build their networks to provide good enough coverage that users feel that they will not lose out by switching.
3G requires totally different base station equipment from 2G, and the same is true for LTE compared to 3G; therefore, there is little reason to expect much difference in the market penetration rate, except if the network operators choose to influence this, either by pricing or by not offering new GSM or 3G subscriptions.
By fitting a smooth curve to the data above and extrapolating, the future take-up of 3G may be predicted, and by shifting the curve to the right, assuming that LTE starts to be offered around 2013, its takeup may also be estimated. The results are shown in Figure 9.
P7784 LTE Interference Study Thales Research & Technology (UK) Ltd. 862 - 863 MHz Breathing Apparatus Telemetry System Interference Study
P7784-10-003 Issue 2 Page 20 of 34
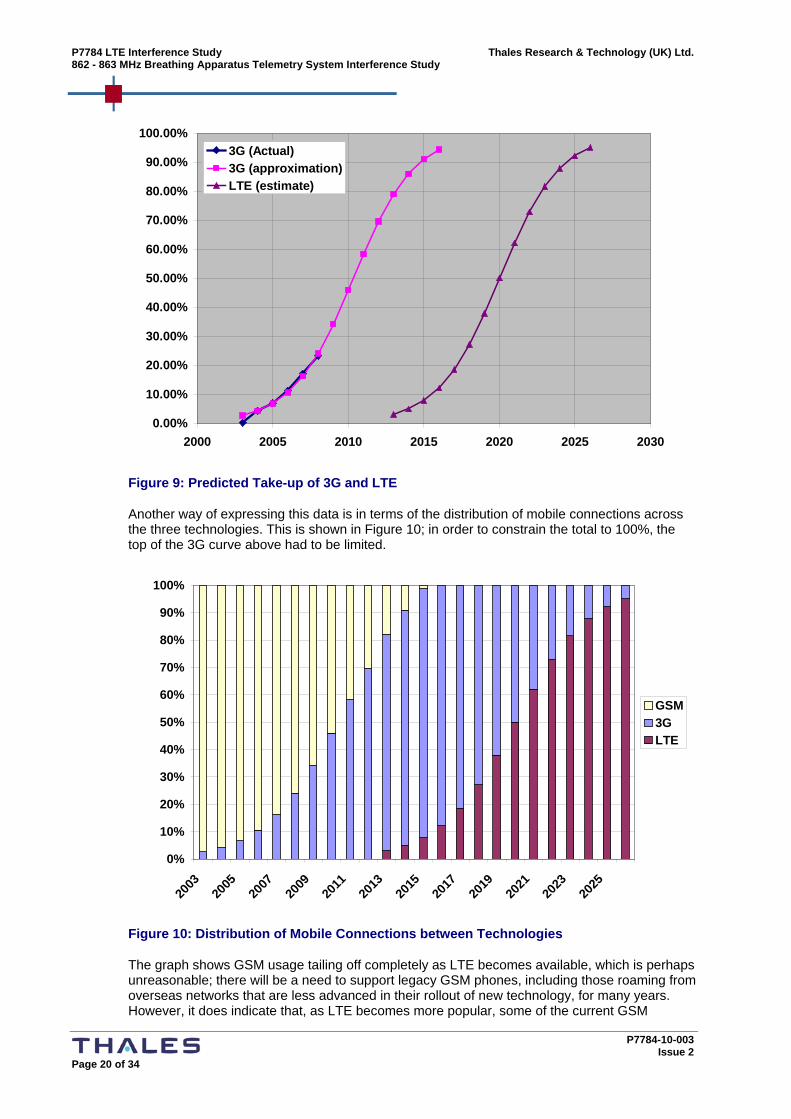
Figure 9: Predicted Take-up of 3G and LTE
Another way of expressing this data is in terms of the distribution of mobile connections across the three technologies. This is shown in Figure 10; in order to constrain the total to 100%, the top of the 3G curve above had to be limited.
Figure 10: Distribution of Mobile Connections between Technologies
The graph shows GSM usage tailing off completely as LTE becomes available, which is perhaps unreasonable; there will be a need to support legacy GSM phones, including those roaming from overseas networks that are less advanced in their rollout of new technology, for many years. However, it does indicate that, as LTE becomes more popular, some of the current GSM
0.00%
10.00%
20.00%
30.00%
40.00%
50.00%
60.00%
70.00%
80.00%
90.00%
100.00%
2000 2005 2010 2015 2020 2025 2030
3G (Actual)3G (approximation)LTE (estimate)
0%
10%
20%
30%
40%
50%
60%
70%
80%
90%
100%
2003
2005
2007
2009
2011
2013
2015
2017
2019
2021
2023
2025
GSM3GLTE
Thales Research & Technology (UK) Ltd. P7784 LTE Interference Study 862 - 863 MHz Breathing Apparatus Telemetry System Interference Study
P7784-10-003 Issue 2 Page 21 of 34
frequencies might be reallocated; this would reduce the LTE loading in the band under study here.
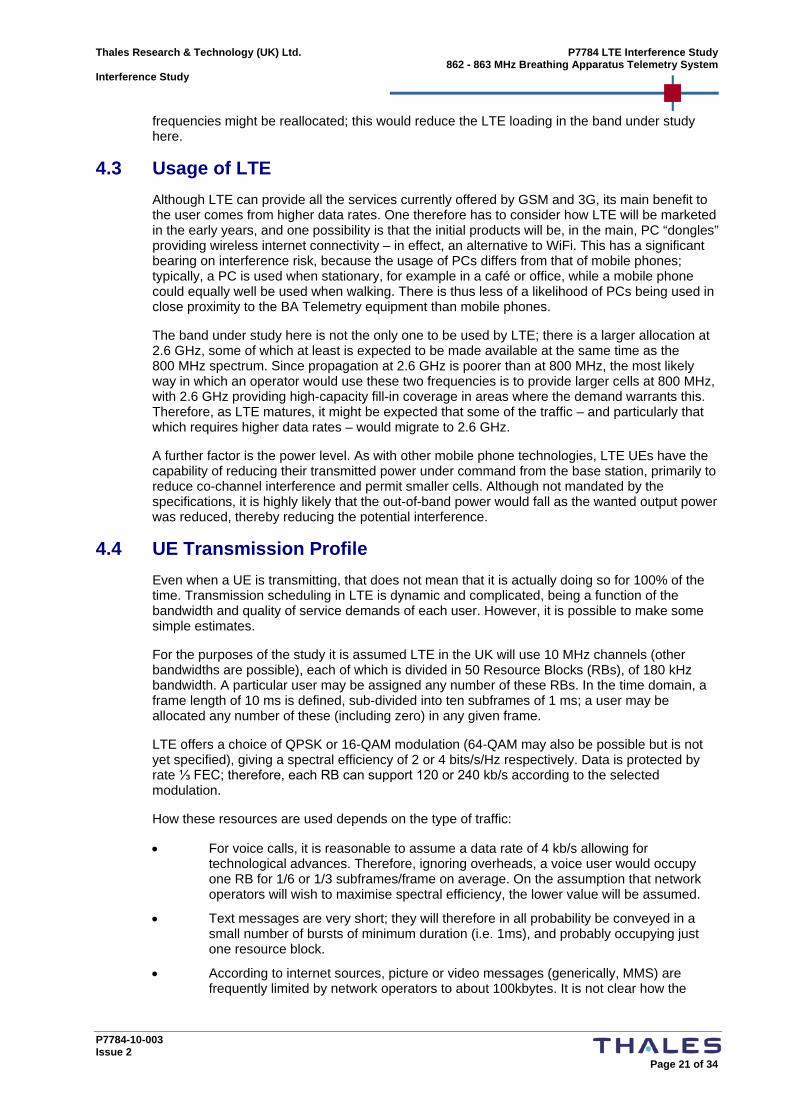
4.3 Usage of LTE Although LTE can provide all the services currently offered by GSM and 3G, its main benefit to the user comes from higher data rates. One therefore has to consider how LTE will be marketed in the early years, and one possibility is that the initial products will be, in the main, PC “dongles” providing wireless internet connectivity – in effect, an alternative to WiFi. This has a significant bearing on interference risk, because the usage of PCs differs from that of mobile phones; typically, a PC is used when stationary, for example in a café or office, while a mobile phone could equally well be used when walking. There is thus less of a likelihood of PCs being used in close proximity to the BA Telemetry equipment than mobile phones.
The band under study here is not the only one to be used by LTE; there is a larger allocation at 2.6 GHz, some of which at least is expected to be made available at the same time as the 800 MHz spectrum. Since propagation at 2.6 GHz is poorer than at 800 MHz, the most likely way in which an operator would use these two frequencies is to provide larger cells at 800 MHz, with 2.6 GHz providing high-capacity fill-in coverage in areas where the demand warrants this. Therefore, as LTE matures, it might be expected that some of the traffic – and particularly that which requires higher data rates – would migrate to 2.6 GHz.
A further factor is the power level. As with other mobile phone technologies, LTE UEs have the capability of reducing their transmitted power under command from the base station, primarily to reduce co-channel interference and permit smaller cells. Although not mandated by the specifications, it is highly likely that the out-of-band power would fall as the wanted output power was reduced, thereby reducing the potential interference.
4.4 UE Transmission Profile Even when a UE is transmitting, that does not mean that it is actually doing so for 100% of the time. Transmission scheduling in LTE is dynamic and complicated, being a function of the bandwidth and quality of service demands of each user. However, it is possible to make some simple estimates.
For the purposes of the study it is assumed LTE in the UK will use 10 MHz channels (other bandwidths are possible), each of which is divided in 50 Resource Blocks (RBs), of 180 kHz bandwidth. A particular user may be assigned any number of these RBs. In the time domain, a frame length of 10 ms is defined, sub-divided into ten subframes of 1 ms; a user may be allocated any number of these (including zero) in any given frame.
LTE offers a choice of QPSK or 16-QAM modulation (64-QAM may also be possible but is not yet specified), giving a spectral efficiency of 2 or 4 bits/s/Hz respectively. Data is protected by rate ⅓ FEC; therefore, each RB can support 120 or 240 kb/s according to the selected modulation.
How these resources are used depends on the type of traffic:
• For voice calls, it is reasonable to assume a data rate of 4 kb/s allowing for technological advances. Therefore, ignoring overheads, a voice user would occupy one RB for 1/6 or 1/3 subframes/frame on average. On the assumption that network operators will wish to maximise spectral efficiency, the lower value will be assumed.
• Text messages are very short; they will therefore in all probability be conveyed in a small number of bursts of minimum duration (i.e. 1ms), and probably occupying just one resource block.
• According to internet sources, picture or video messages (generically, MMS) are frequently limited by network operators to about 100kbytes. It is not clear how the

P7784 LTE Interference Study Thales Research & Technology (UK) Ltd. 862 - 863 MHz Breathing Apparatus Telemetry System Interference Study
P7784-10-003 Issue 2 Page 22 of 34
network would choose to convey these: as a short burst with a high data rate, or a longer transmission at a lower rate.
• Internet usage generates a very variable transmission profile, although it would be expected that the bulk of the traffic would be in the downlink direction.
Whatever the type of call, there is always a trade-off between allocating one RB for a given number of subframes, two RBs for half that number and so on. However, since the UE is limited to a fixed transmit power irrespective of the number of RBs, it is beneficial to the system to always allocate the minimum number, thereby maximising the signal-to-noise ratio. Therefore, it is assumed that the network will always allocate a single RB to a user if that can support the required service.
Thales Research & Technology (UK) Ltd. P7784 LTE Interference Study 862 - 863 MHz Breathing Apparatus Telemetry System Interference Study
P7784-10-003 Issue 2 Page 23 of 34
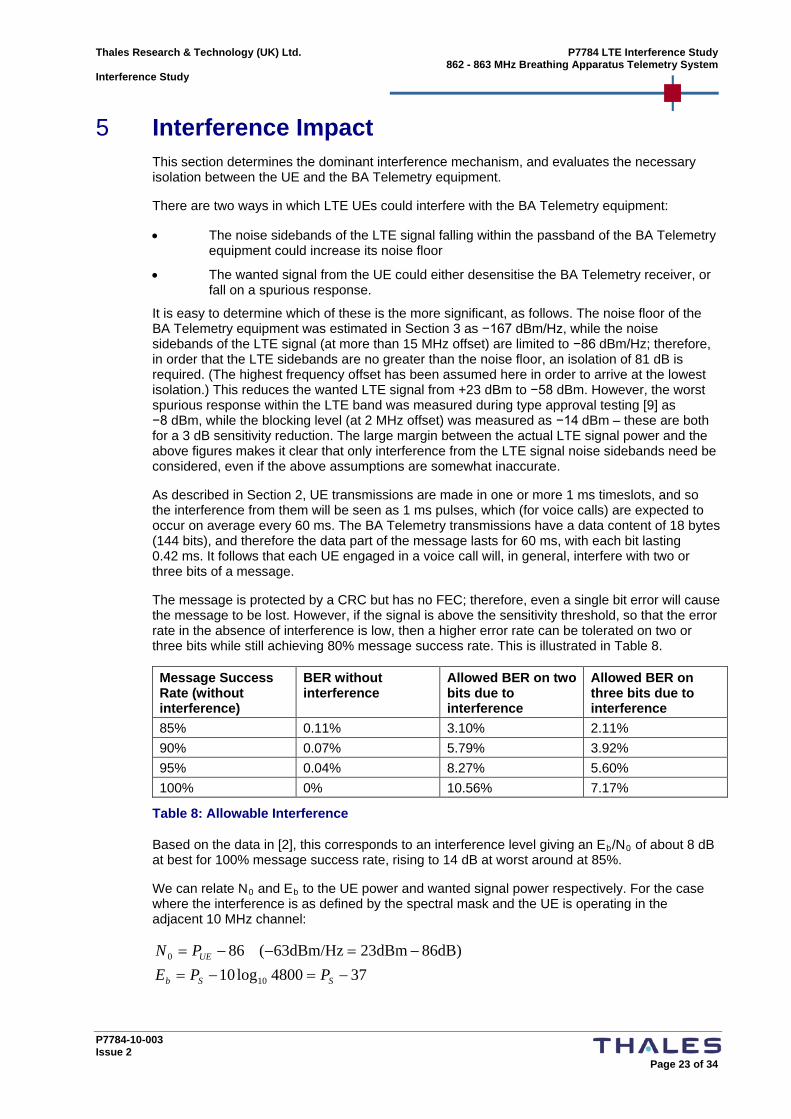
5 Interference Impact This section determines the dominant interference mechanism, and evaluates the necessary isolation between the UE and the BA Telemetry equipment.
There are two ways in which LTE UEs could interfere with the BA Telemetry equipment:
• The noise sidebands of the LTE signal falling within the passband of the BA Telemetry equipment could increase its noise floor
• The wanted signal from the UE could either desensitise the BA Telemetry receiver, or fall on a spurious response.
It is easy to determine which of these is the more significant, as follows. The noise floor of the BA Telemetry equipment was estimated in Section 3 as −167 dBm/Hz, while the noise sidebands of the LTE signal (at more than 15 MHz offset) are limited to −86 dBm/Hz; therefore, in order that the LTE sidebands are no greater than the noise floor, an isolation of 81 dB is required. (The highest frequency offset has been assumed here in order to arrive at the lowest isolation.) This reduces the wanted LTE signal from +23 dBm to −58 dBm. However, the worst spurious response within the LTE band was measured during type approval testing [9] as −8 dBm, while the blocking level (at 2 MHz offset) was measured as −14 dBm – these are both for a 3 dB sensitivity reduction. The large margin between the actual LTE signal power and the above figures makes it clear that only interference from the LTE signal noise sidebands need be considered, even if the above assumptions are somewhat inaccurate.
As described in Section 2, UE transmissions are made in one or more 1 ms timeslots, and so the interference from them will be seen as 1 ms pulses, which (for voice calls) are expected to occur on average every 60 ms. The BA Telemetry transmissions have a data content of 18 bytes (144 bits), and therefore the data part of the message lasts for 60 ms, with each bit lasting 0.42 ms. It follows that each UE engaged in a voice call will, in general, interfere with two or three bits of a message.
The message is protected by a CRC but has no FEC; therefore, even a single bit error will cause the message to be lost. However, if the signal is above the sensitivity threshold, so that the error rate in the absence of interference is low, then a higher error rate can be tolerated on two or three bits while still achieving 80% message success rate. This is illustrated in Table 8.
Message Success Rate (without interference)
BER without interference
Allowed BER on two bits due to interference
Allowed BER on three bits due to interference
85% 0.11% 3.10% 2.11% 90% 0.07% 5.79% 3.92% 95% 0.04% 8.27% 5.60% 100% 0% 10.56% 7.17%
Table 8: Allowable Interference
Based on the data in [2], this corresponds to an interference level giving an Eb/N0 of about 8 dB at best for 100% message success rate, rising to 14 dB at worst around at 85%.
We can relate N0 and Eb
374800log1086dB)23dBm63dBm/Hz(86
10
0
−=−=−=−−=
SSb
UE
PPEPN
to the UE power and wanted signal power respectively. For the case where the interference is as defined by the spectral mask and the UE is operating in the adjacent 10 MHz channel:
P7784 LTE Interference Study Thales Research & Technology (UK) Ltd. 862 - 863 MHz Breathing Apparatus Telemetry System Interference Study
P7784-10-003 Issue 2 Page 24 of 34
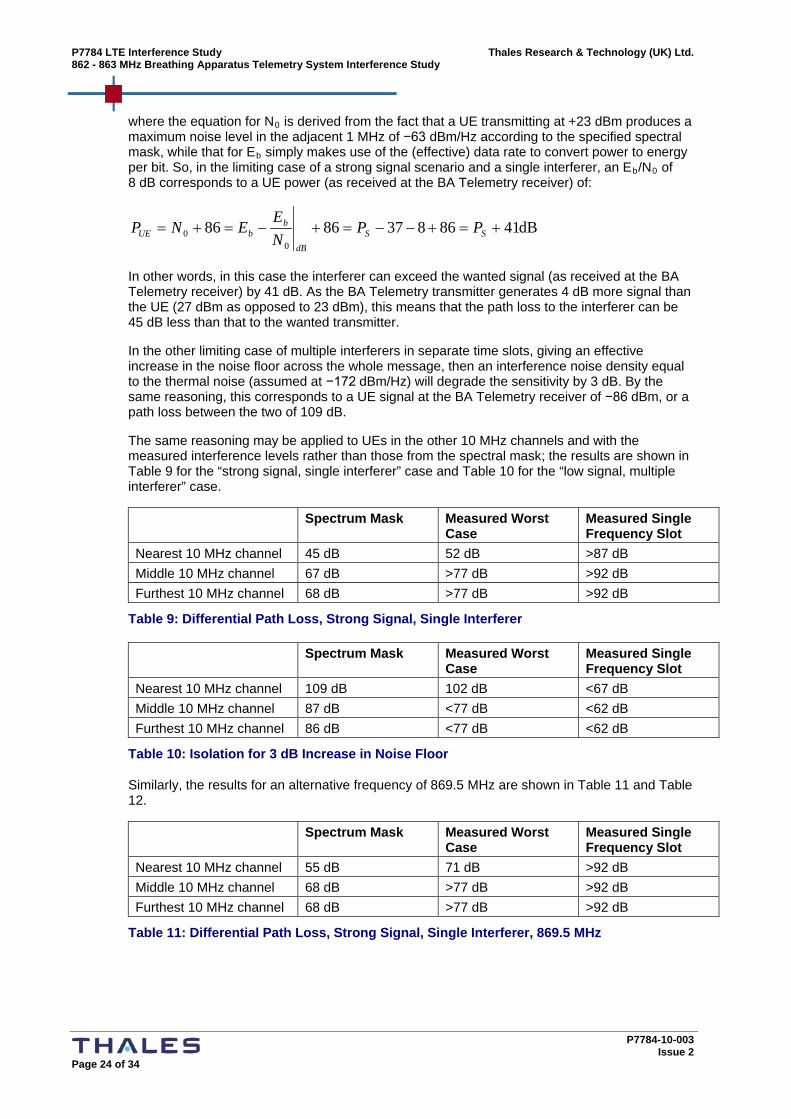
where the equation for N0 is derived from the fact that a UE transmitting at +23 dBm produces a maximum noise level in the adjacent 1 MHz of −63 dBm/Hz according to the specified spectral mask, while that for Eb simply makes use of the (effective) data rate to convert power to energy per bit. So, in the limiting case of a strong signal scenario and a single interferer, an Eb/N0
dB418683786860
0 +=+−−=+−=+= SSdB
bbUE PP
NE
ENP
of 8 dB corresponds to a UE power (as received at the BA Telemetry receiver) of:
In other words, in this case the interferer can exceed the wanted signal (as received at the BA Telemetry receiver) by 41 dB. As the BA Telemetry transmitter generates 4 dB more signal than the UE (27 dBm as opposed to 23 dBm), this means that the path loss to the interferer can be 45 dB less than that to the wanted transmitter.
In the other limiting case of multiple interferers in separate time slots, giving an effective increase in the noise floor across the whole message, then an interference noise density equal to the thermal noise (assumed at −172 dBm/Hz) will degrade the sensitivity by 3 dB. By the same reasoning, this corresponds to a UE signal at the BA Telemetry receiver of −86 dBm, or a path loss between the two of 109 dB.
The same reasoning may be applied to UEs in the other 10 MHz channels and with the measured interference levels rather than those from the spectral mask; the results are shown in Table 9 for the “strong signal, single interferer” case and Table 10 for the “low signal, multiple interferer” case.
Spectrum Mask Measured Worst Case
Measured Single Frequency Slot
Nearest 10 MHz channel 45 dB 52 dB >87 dB Middle 10 MHz channel 67 dB >77 dB >92 dB Furthest 10 MHz channel 68 dB >77 dB >92 dB
Table 9: Differential Path Loss, Strong Signal, Single Interferer
Spectrum Mask Measured Worst Case
Measured Single Frequency Slot
Nearest 10 MHz channel 109 dB 102 dB <67 dB Middle 10 MHz channel 87 dB <77 dB <62 dB Furthest 10 MHz channel 86 dB <77 dB <62 dB
Table 10: Isolation for 3 dB Increase in Noise Floor
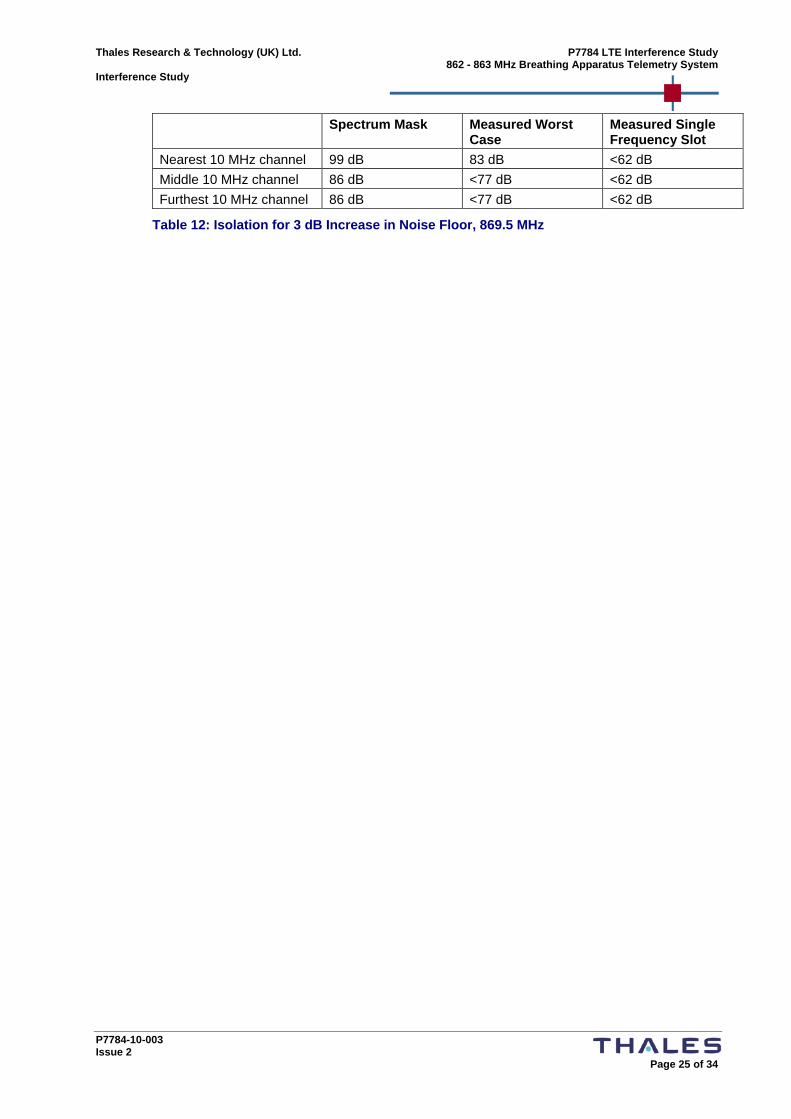
Similarly, the results for an alternative frequency of 869.5 MHz are shown in Table 11 and Table 12.
Spectrum Mask Measured Worst Case
Measured Single Frequency Slot
Nearest 10 MHz channel 55 dB 71 dB >92 dB Middle 10 MHz channel 68 dB >77 dB >92 dB Furthest 10 MHz channel 68 dB >77 dB >92 dB
Table 11: Differential Path Loss, Strong Signal, Single Interferer, 869.5 MHz
Thales Research & Technology (UK) Ltd. P7784 LTE Interference Study 862 - 863 MHz Breathing Apparatus Telemetry System Interference Study
P7784-10-003 Issue 2 Page 25 of 34
Spectrum Mask Measured Worst Case
Measured Single Frequency Slot
Nearest 10 MHz channel 99 dB 83 dB <62 dB Middle 10 MHz channel 86 dB <77 dB <62 dB Furthest 10 MHz channel 86 dB <77 dB <62 dB
Table 12: Isolation for 3 dB Increase in Noise Floor, 869.5 MHz
P7784 LTE Interference Study Thales Research & Technology (UK) Ltd. 862 - 863 MHz Breathing Apparatus Telemetry System Interference Study
P7784-10-003 Issue 2 Page 26 of 34
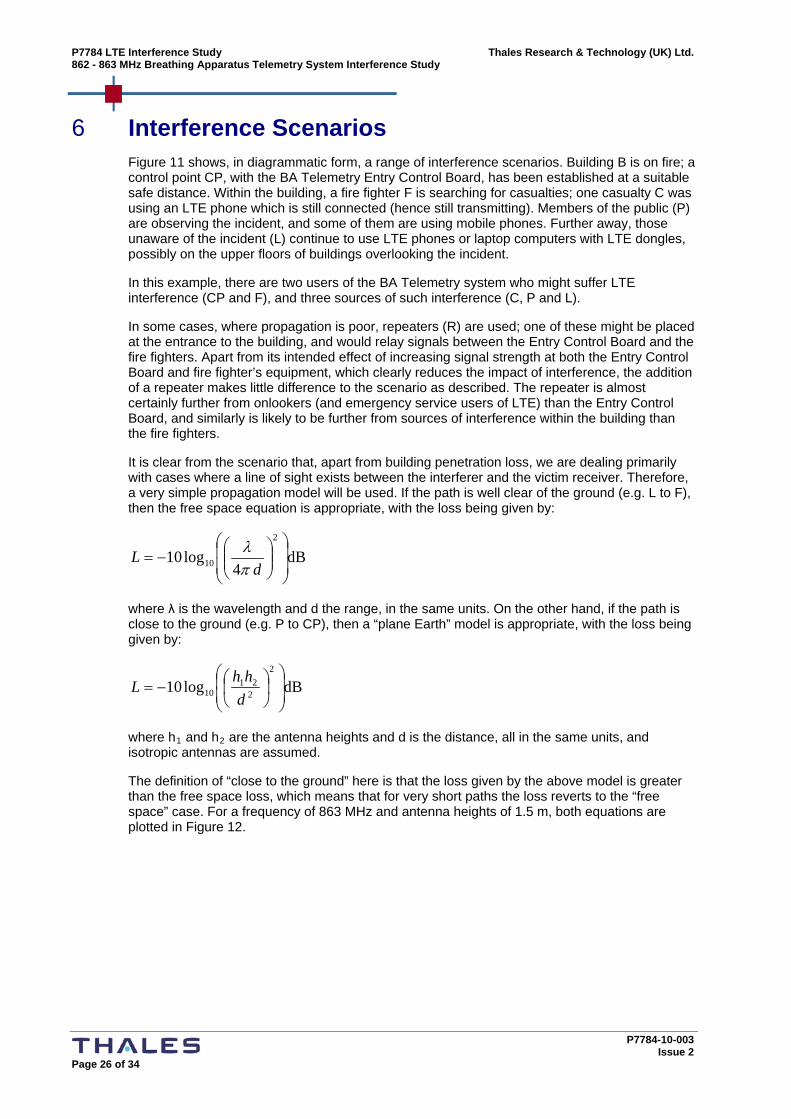
6 Interference Scenarios Figure 11 shows, in diagrammatic form, a range of interference scenarios. Building B is on fire; a control point CP, with the BA Telemetry Entry Control Board, has been established at a suitable safe distance. Within the building, a fire fighter F is searching for casualties; one casualty C was using an LTE phone which is still connected (hence still transmitting). Members of the public (P) are observing the incident, and some of them are using mobile phones. Further away, those unaware of the incident (L) continue to use LTE phones or laptop computers with LTE dongles, possibly on the upper floors of buildings overlooking the incident.
In this example, there are two users of the BA Telemetry system who might suffer LTE interference (CP and F), and three sources of such interference (C, P and L).
In some cases, where propagation is poor, repeaters (R) are used; one of these might be placed at the entrance to the building, and would relay signals between the Entry Control Board and the fire fighters. Apart from its intended effect of increasing signal strength at both the Entry Control Board and fire fighter’s equipment, which clearly reduces the impact of interference, the addition of a repeater makes little difference to the scenario as described. The repeater is almost certainly further from onlookers (and emergency service users of LTE) than the Entry Control Board, and similarly is likely to be further from sources of interference within the building than the fire fighters.
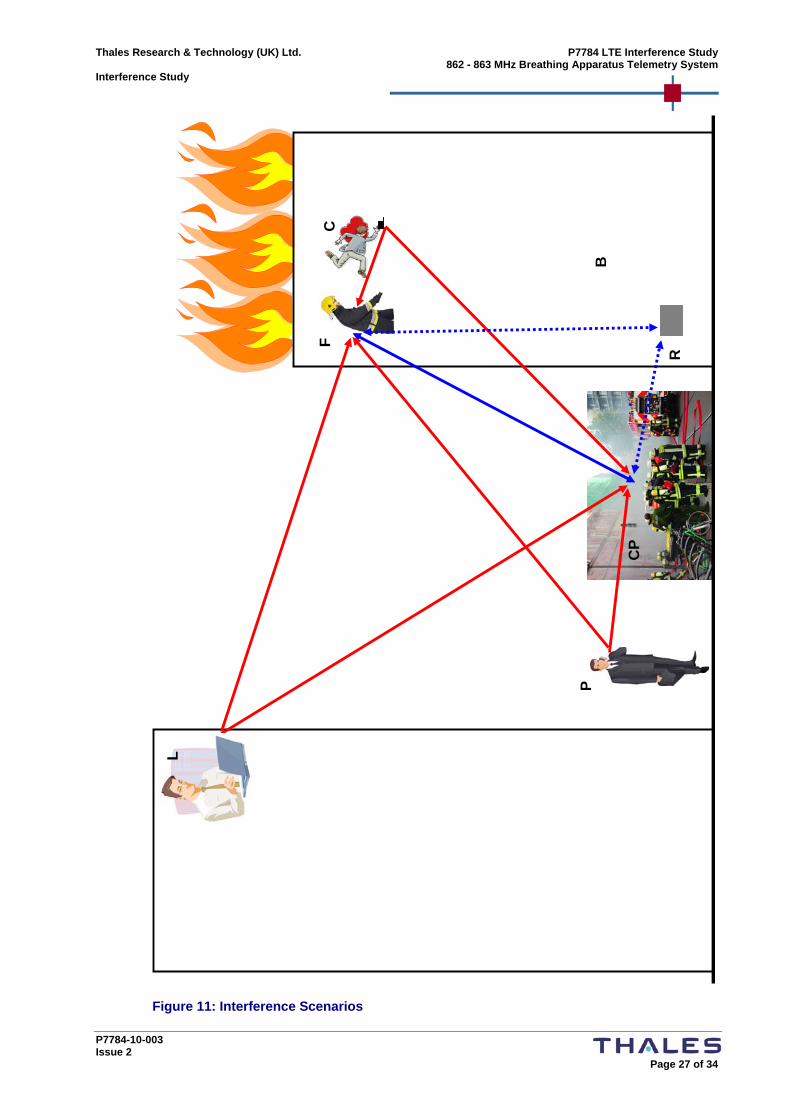
It is clear from the scenario that, apart from building penetration loss, we are dealing primarily with cases where a line of sight exists between the interferer and the victim receiver. Therefore, a very simple propagation model will be used. If the path is well clear of the ground (e.g. L to F), then the free space equation is appropriate, with the loss being given by:
dB4
log102
10
−=
dL
πλ
where λ is the wavelength and d the range, in the same units. On the other hand, if the path is close to the ground (e.g. P to CP), then a “plane Earth” model is appropriate, with the loss being given by:
dBlog102
221
10
−=
dhhL
where h1 and h2
The definition of “close to the ground” here is that the loss given by the above model is greater than the free space loss, which means that for very short paths the loss reverts to the “free space” case. For a frequency of 863 MHz and antenna heights of 1.5 m, both equations are plotted in
are the antenna heights and d is the distance, all in the same units, and isotropic antennas are assumed.
Figure 12.
Thales Research & Technology (UK) Ltd. P7784 LTE Interference Study 862 - 863 MHz Breathing Apparatus Telemetry System Interference Study
P7784-10-003 Issue 2 Page 27 of 34
B
F C
P
CP
L
R
Figure 11: Interference Scenarios
P7784 LTE Interference Study Thales Research & Technology (UK) Ltd. 862 - 863 MHz Breathing Apparatus Telemetry System Interference Study
P7784-10-003 Issue 2 Page 28 of 34
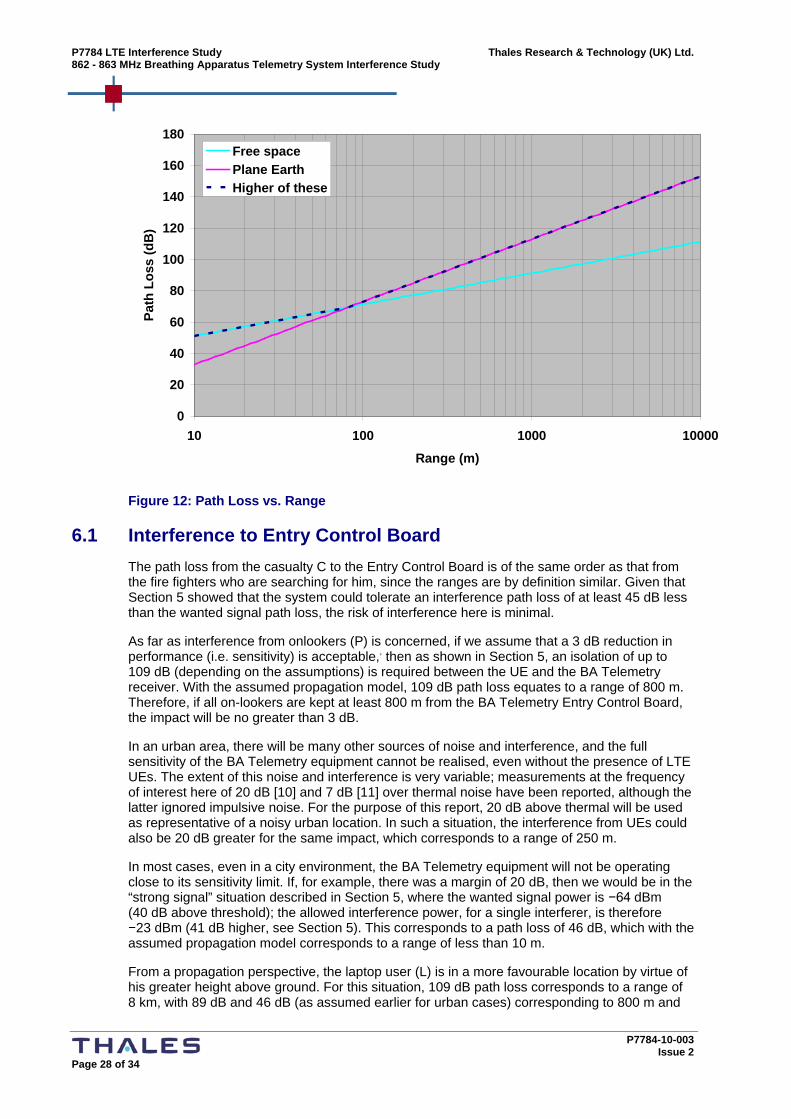
Figure 12: Path Loss vs. Range
6.1 Interference to Entry Control Board The path loss from the casualty C to the Entry Control Board is of the same order as that from the fire fighters who are searching for him, since the ranges are by definition similar. Given that Section 5 showed that the system could tolerate an interference path loss of at least 45 dB less than the wanted signal path loss, the risk of interference here is minimal.
As far as interference from onlookers (P) is concerned, if we assume that a 3 dB reduction in performance (i.e. sensitivity) is acceptable,, 5 then as shown in Section , an isolation of up to 109 dB (depending on the assumptions) is required between the UE and the BA Telemetry receiver. With the assumed propagation model, 109 dB path loss equates to a range of 800 m. Therefore, if all on-lookers are kept at least 800 m from the BA Telemetry Entry Control Board, the impact will be no greater than 3 dB.
In an urban area, there will be many other sources of noise and interference, and the full sensitivity of the BA Telemetry equipment cannot be realised, even without the presence of LTE UEs. The extent of this noise and interference is very variable; measurements at the frequency of interest here of 20 dB [10] and 7 dB [11] over thermal noise have been reported, although the latter ignored impulsive noise. For the purpose of this report, 20 dB above thermal will be used as representative of a noisy urban location. In such a situation, the interference from UEs could also be 20 dB greater for the same impact, which corresponds to a range of 250 m.
In most cases, even in a city environment, the BA Telemetry equipment will not be operating close to its sensitivity limit. If, for example, there was a margin of 20 dB, then we would be in the “strong signal” situation described in Section 5, where the wanted signal power is −64 dBm (40 dB above threshold); the allowed interference power, for a single interferer, is therefore −23 dBm (41 dB higher, see Section 5). This corresponds to a path loss of 46 dB, which with the assumed propagation model corresponds to a range of less than 10 m.
From a propagation perspective, the laptop user (L) is in a more favourable location by virtue of his greater height above ground. For this situation, 109 dB path loss corresponds to a range of 8 km, with 89 dB and 46 dB (as assumed earlier for urban cases) corresponding to 800 m and
0
20
40
60
80
100
120
140
160
180
10 100 1000 10000Range (m)
Path
Los
s (d
B)
Free spacePlane EarthHigher of these
Thales Research & Technology (UK) Ltd. P7784 LTE Interference Study 862 - 863 MHz Breathing Apparatus Telemetry System Interference Study
P7784-10-003 Issue 2 Page 29 of 34
less than 10 m respectively. Note that all of these figures ignore the building exit loss for the building in which the user is located, on the basis that very low losses can occur when the user is adjacent to a window.
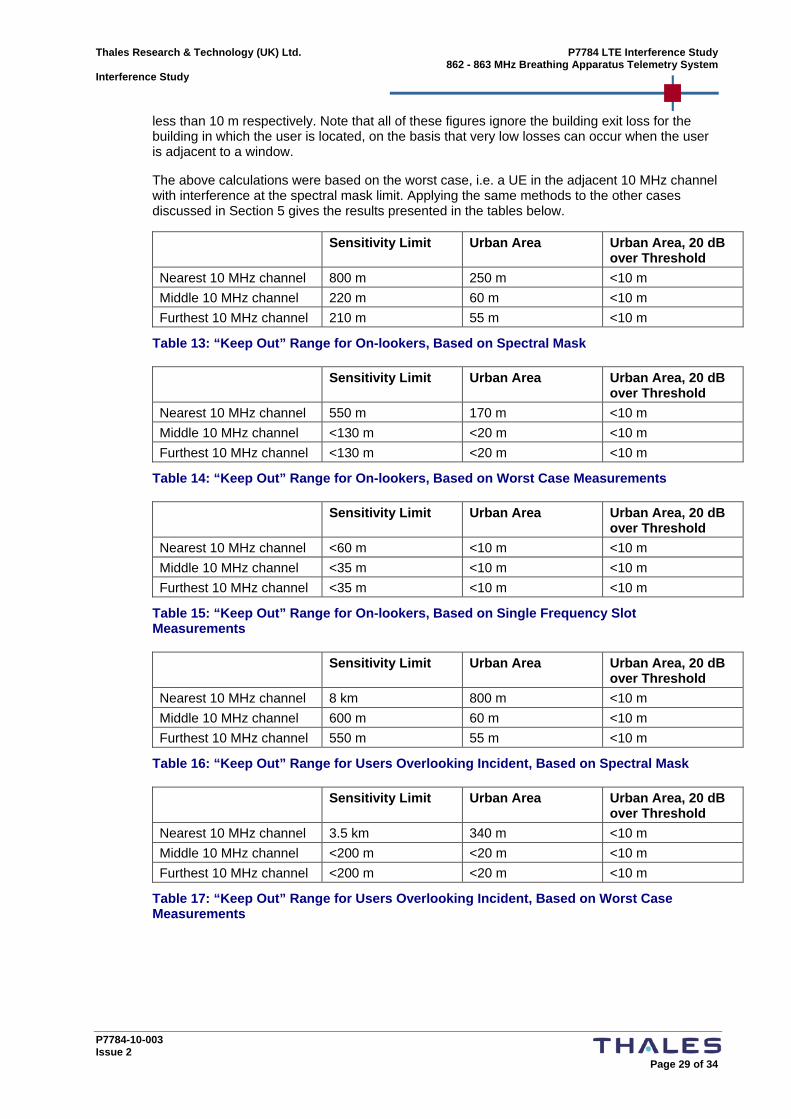
The above calculations were based on the worst case, i.e. a UE in the adjacent 10 MHz channel with interference at the spectral mask limit. Applying the same methods to the other cases discussed in Section 5 gives the results presented in the tables below.
Sensitivity Limit Urban Area Urban Area, 20 dB over Threshold
Nearest 10 MHz channel 800 m 250 m <10 m Middle 10 MHz channel 220 m 60 m <10 m Furthest 10 MHz channel 210 m 55 m <10 m
Table 13: “Keep Out” Range for On-lookers, Based on Spectral Mask
Sensitivity Limit Urban Area Urban Area, 20 dB over Threshold
Nearest 10 MHz channel 550 m 170 m <10 m Middle 10 MHz channel <130 m <20 m <10 m Furthest 10 MHz channel <130 m <20 m <10 m
Table 14: “Keep Out” Range for On-lookers, Based on Worst Case Measurements
Sensitivity Limit Urban Area Urban Area, 20 dB over Threshold
Nearest 10 MHz channel <60 m <10 m <10 m Middle 10 MHz channel <35 m <10 m <10 m Furthest 10 MHz channel <35 m <10 m <10 m
Table 15: “Keep Out” Range for On-lookers, Based on Single Frequency Slot Measurements
Sensitivity Limit Urban Area Urban Area, 20 dB over Threshold
Nearest 10 MHz channel 8 km 800 m <10 m Middle 10 MHz channel 600 m 60 m <10 m Furthest 10 MHz channel 550 m 55 m <10 m
Table 16: “Keep Out” Range for Users Overlooking Incident, Based on Spectral Mask
Sensitivity Limit Urban Area Urban Area, 20 dB over Threshold
Nearest 10 MHz channel 3.5 km 340 m <10 m Middle 10 MHz channel <200 m <20 m <10 m Furthest 10 MHz channel <200 m <20 m <10 m
Table 17: “Keep Out” Range for Users Overlooking Incident, Based on Worst Case Measurements
P7784 LTE Interference Study Thales Research & Technology (UK) Ltd. 862 - 863 MHz Breathing Apparatus Telemetry System Interference Study
P7784-10-003 Issue 2 Page 30 of 34
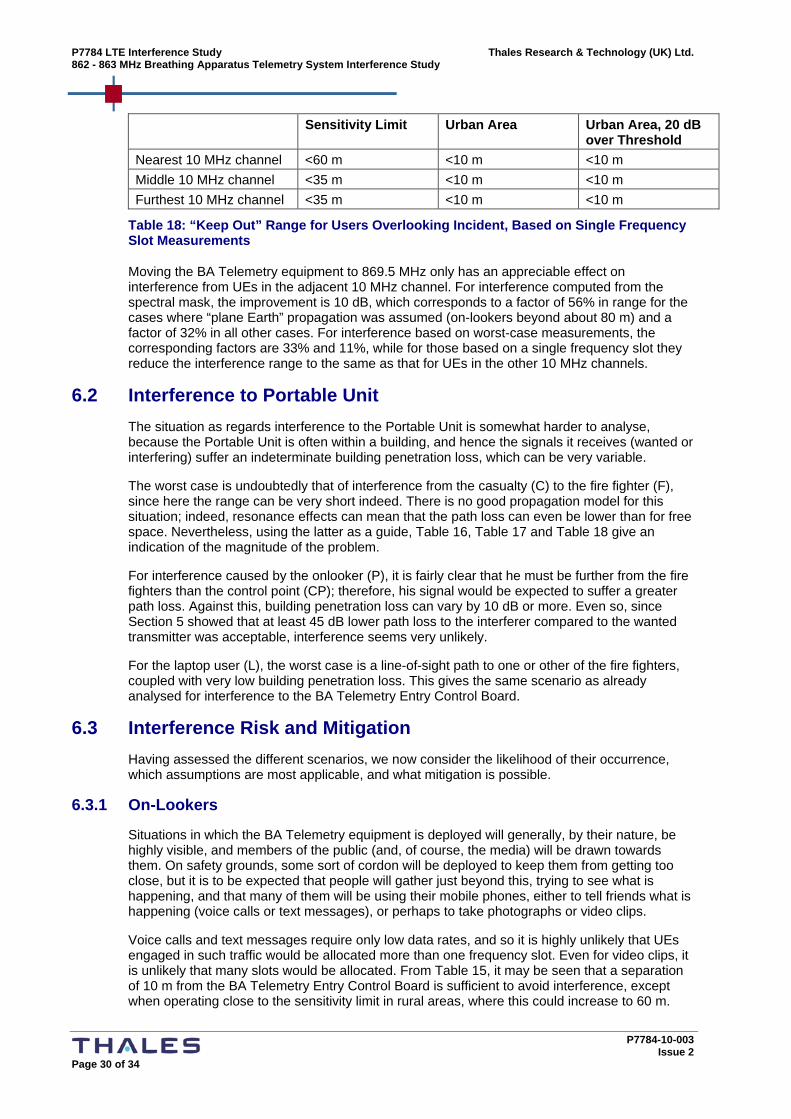
Sensitivity Limit Urban Area Urban Area, 20 dB over Threshold
Nearest 10 MHz channel <60 m <10 m <10 m Middle 10 MHz channel <35 m <10 m <10 m Furthest 10 MHz channel <35 m <10 m <10 m
Table 18: “Keep Out” Range for Users Overlooking Incident, Based on Single Frequency Slot Measurements
Moving the BA Telemetry equipment to 869.5 MHz only has an appreciable effect on interference from UEs in the adjacent 10 MHz channel. For interference computed from the spectral mask, the improvement is 10 dB, which corresponds to a factor of 56% in range for the cases where “plane Earth” propagation was assumed (on-lookers beyond about 80 m) and a factor of 32% in all other cases. For interference based on worst-case measurements, the corresponding factors are 33% and 11%, while for those based on a single frequency slot they reduce the interference range to the same as that for UEs in the other 10 MHz channels.
6.2 Interference to Portable Unit The situation as regards interference to the Portable Unit is somewhat harder to analyse, because the Portable Unit is often within a building, and hence the signals it receives (wanted or interfering) suffer an indeterminate building penetration loss, which can be very variable.
The worst case is undoubtedly that of interference from the casualty (C) to the fire fighter (F), since here the range can be very short indeed. There is no good propagation model for this situation; indeed, resonance effects can mean that the path loss can even be lower than for free space. Nevertheless, using the latter as a guide, Table 16, Table 17 and Table 18 give an indication of the magnitude of the problem.
For interference caused by the onlooker (P), it is fairly clear that he must be further from the fire fighters than the control point (CP); therefore, his signal would be expected to suffer a greater path loss. Against this, building penetration loss can vary by 10 dB or more. Even so, since Section 5 showed that at least 45 dB lower path loss to the interferer compared to the wanted transmitter was acceptable, interference seems very unlikely.
For the laptop user (L), the worst case is a line-of-sight path to one or other of the fire fighters, coupled with very low building penetration loss. This gives the same scenario as already analysed for interference to the BA Telemetry Entry Control Board.
6.3 Interference Risk and Mitigation Having assessed the different scenarios, we now consider the likelihood of their occurrence, which assumptions are most applicable, and what mitigation is possible.
6.3.1 On-Lookers
Situations in which the BA Telemetry equipment is deployed will generally, by their nature, be highly visible, and members of the public (and, of course, the media) will be drawn towards them. On safety grounds, some sort of cordon will be deployed to keep them from getting too close, but it is to be expected that people will gather just beyond this, trying to see what is happening, and that many of them will be using their mobile phones, either to tell friends what is happening (voice calls or text messages), or perhaps to take photographs or video clips.
Voice calls and text messages require only low data rates, and so it is highly unlikely that UEs engaged in such traffic would be allocated more than one frequency slot. Even for video clips, it is unlikely that many slots would be allocated. From Table 15, it may be seen that a separation of 10 m from the BA Telemetry Entry Control Board is sufficient to avoid interference, except when operating close to the sensitivity limit in rural areas, where this could increase to 60 m.
Thales Research & Technology (UK) Ltd. P7784 LTE Interference Study 862 - 863 MHz Breathing Apparatus Telemetry System Interference Study
P7784-10-003 Issue 2 Page 31 of 34
Given that crowds of on-lookers are less likely in such areas, it seems that such interference could be considered a low risk. Moving the BA Telemetry system to 869.5 MHz reduces the range to 35 m even in rural areas.
A similar scenario (from the propagation and interference perspective) arises from the use of LTE by the emergency services, and therefore the same separation distance would be required.
6.3.2 Other External LTE Users
The situation is somewhat worse for other users of LTE who happen to be overlooking the incident, because of the potentially lower path loss. In addition, such people may be using LTE for a greater range of applications, and so may be allocated several frequency slots. Even so, allocation of the full 10 MHz to one user seems extremely improbable, and so the most reasonable assumption is perhaps to use the “worst case” measurements as opposed to the spectral mask, i.e. from Table 17. This shows a significant interference risk in the rural case, and for operation in the adjacent 10 MHz channel in the urban case, when operating at the sensitivity limit of the BA Telemetry system. However, several factors will improve the situation in practice:
• Not everyone will be using LTE; Figure 10 predicts that the fraction will be only 12% in 2016
• As LTE penetration increases, the higher data rate users (which are those more likely to cause such interference) will migrate to 2.6 GHz
• The interference ranges were based on a clear line-of-sight to the BA Telemetry equipment; in practice, this will often not be the case because of intervening buildings, the exception being a single building much taller than those around it. In rural areas, such a scenario is highly unlikely.
• The calculation ignored building exit loss, which can add some tens of dB to the path loss.
• In urban areas, where this scenario is most likely to occur, cells will be smaller to support the required network capacity, and hence UE powers will be lower, which will reduce the interference.
• Not all LTE users will be using multiple frequency slots; Table 18 shows that the risk of interference when a single frequency slot is allocated is much reduced in rural areas, and virtually non-existent in urban areas.
Moving the BA Telemetry system to 869.5 MHz potentially offers a considerable improvement, although in practice the third bullet point above already may already give that same benefit. Of course, this assumes that the interference environment on that frequency from sources other than LTE is no worse than on the present frequency.
6.3.3 Internal LTE Users
This category covers LTE equipment operating within the area of the incident, i.e. C in Figure 11. There are three realistic cases for this type of interference:
• The user of the LTE equipment is conscious and actually using the UE. It is hard to conceive of this being other than for a voice call to friends and family or the emergency services, and hence the “single frequency slot” assumption would apply.
• The user of the LTE equipment has become unconscious, or left the area, leaving the call still in progress. In this case, the traffic could be of any kind, and hence any number of frequency slots could have been allocated. However, in order for the UE to still be transmitting in many frequency slots when the fire service are searching the building, one would have to believe that a very large data transfer had been initiated (otherwise the data would have been sent before that time, and the UE would be idle). While not impossible, this seems very unlikely.
• The LTE equipment is being used by one of the fire fighters.
P7784 LTE Interference Study Thales Research & Technology (UK) Ltd. 862 - 863 MHz Breathing Apparatus Telemetry System Interference Study
P7784-10-003 Issue 2 Page 32 of 34
There is no good path loss model for this case – indeed, resonance effects can cause the path loss to be lower than the “free space” case – but using the latter as a guide (i.e. Table 18), it can be seen that in most cases the interference will only be a problem within a few metres of the UE. Clearly, a consequence of this is that fire fighters should not attempt to use LTE when using the BA Telemetry equipment.
6.3.4 General Mitigation Approaches
As well as the option of moving the BA Telemetry equipment to 869.5 MHz, which was already mentioned above, one other change to the system that has the potential for significant benefits is the addition of FEC. At present, all messages must be received completely error-free; if FEC was added, then it would be possible to correct the two or three errors within a message caused by a typical UE transmission burst, and so greatly increase the tolerance to interference to a single interferer. Of course, if the number of interferers is so high as to be the same as an increase in background noise level, the improvement is much more limited.
The design of such a scheme would be a balance between the complexity, performance and overhead. At one extreme, a (212, 188) BCH code would allow the correction of up to three errors in the message with an overhead of only three bytes (17%) but could be difficult to implement; at the other extreme, 18 blocks of a (12, 8) BCH code (with interleaving) could correct up to 18 errors in all at the cost of 50% overhead, but with trivial implementation complexity.
The main drawback of introducing FEC is the need to maintain backwards compatibility with equipment already in service.
Thales Research & Technology (UK) Ltd. P7784 LTE Interference Study 862 - 863 MHz Breathing Apparatus Telemetry System Interference Study
P7784-10-003 Issue 2 Page 33 of 34
7 Conclusions Various scenarios have been analysed, and it has been shown that there is a potential for interference in four cases:
• To the BA Telemetry Entry Control Board from UEs used by on-lookers or by emergency service personnel.
• To the BA Telemetry Portable Unit and Entry Control Board from UEs in buildings overlooking the incident.
• To the BA Telemetry Portable Unit, from a UE (possibly unattended) within the area being searched by the fire service, or by the fire fighters within that area.
• To a BA Telemetry repeater, if used, from any of the above sources.
Based on measurements of an LTE signal and the measured performance of the BA Telemetry equipment, the likelihood of such interference in practice has been assessed.
Interference from on-lookers is most likely in an urban environment, and in this case the ambient noise at the 862.9625 MHz means that keeping the public back from the BA Telemetry equipment by at least 10 m should be sufficient to avoid interference; such a separation is probably required for public safety in any case. In electrically-quiet rural areas a greater separation, up to 60 m, could be required if the BA Telemetry system is operating close to its range limit. As far as use of LTE by the emergency services at the incident is concerned, the same separation distances apply.
Interference from users overlooking the incident is potentially a worse problem, especially in rural areas, but this is mitigated to a large extent by the absence of buildings with a clear view over the relevant area in such cases. In practice, the worst situation is in urban areas, where an interference range of as much as 340 m could be possible if the UE was using a large number of frequency slots in the adjacent 10 MHz band and there was a clear line-of-sight.
Interference from UEs within the area of the incident will in most cases be very localised, and so may be considered acceptable. However, it is clear that fire fighters using the BA Telemetry system should not also use LTE.
The situation for interference to repeaters is much the same as for the other cases described above; a separation distance as already described needs to be maintained between the repeater and LTE users. However, the location of the repeater makes this separation easier to achieve than for the other units.
The simplest mitigation measure is to move the BA Telemetry equipment to 869.5 MHz, which increases the minimum frequency separation from the LTE band to 7.5 MHz, greatly reducing interference from the closest 10 MHz LTE channel. Apart from the rare case of UEs with a clear view down over the incident in a rural area, this would in practice render most other interference extremely unlikely. This, of course, assumes the absence of other significant interference sources on that frequency.
A further mitigation approach that could be considered would be a modification of the BA Telemetry system to add FEC. This would enable limited interference to be tolerated even when much stronger than the wanted signal, as well as improving the robustness of the system in general. However, there are serious issues of backwards compatibility to overcome for this to be feasible.
© Thales Research and Technology (UK) Ltd., 2011
Thales Research & Technology (UK ) Ltd.
Thales Research & Technology (UK) Ltd. Worton Drive
Worton Grange Business Park Reading
RG2 0SB United Kingdom
Tel: +44 (0) 118 9868601 Fax: +44 (0) 118 9238399 www.thalesresearch.com