Thalassiosira - UC Santa Barbara
31
Transcript of Thalassiosira - UC Santa Barbara


Thalassiosira weissflogii phytoplankton were used in this study as they grow well in culture and they are found in the Gulf of Mexico (GoM).
Image of Thalassiosira weissflogii (Grunow) G.A. Fryxell & Hasle Nordic Microalgae and aquatic protazoa

Aggregates sink down and become Marine Snow. This example was found in the GoM after the Deepwater Horizon contamination.
Iopscience.iop.org

Create nutrient rich artificial seawater to “grow” a sufficient quantity of phytoplankton.
Wait.
Check every day to see if the inoculated seawater is “growing”.
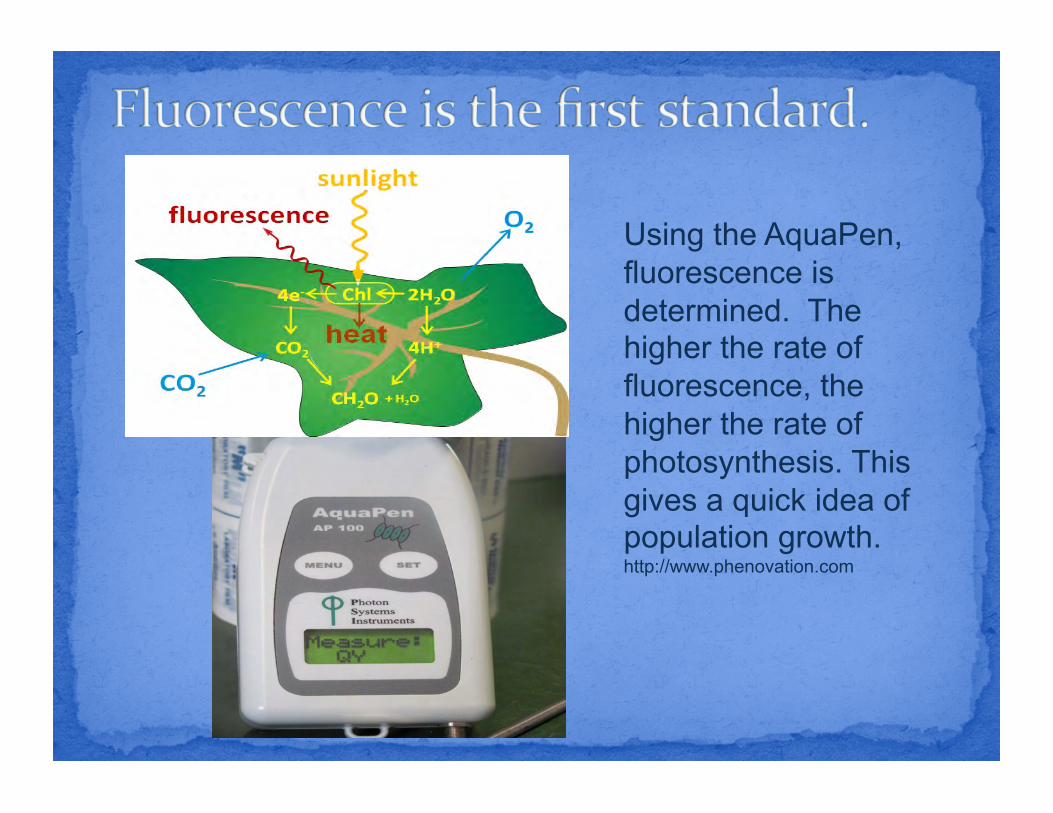
Using the AquaPen, fluorescence is determined. The higher the rate of fluorescence, the higher the rate of photosynthesis. This gives a quick idea of population growth. http://www.phenovation.com
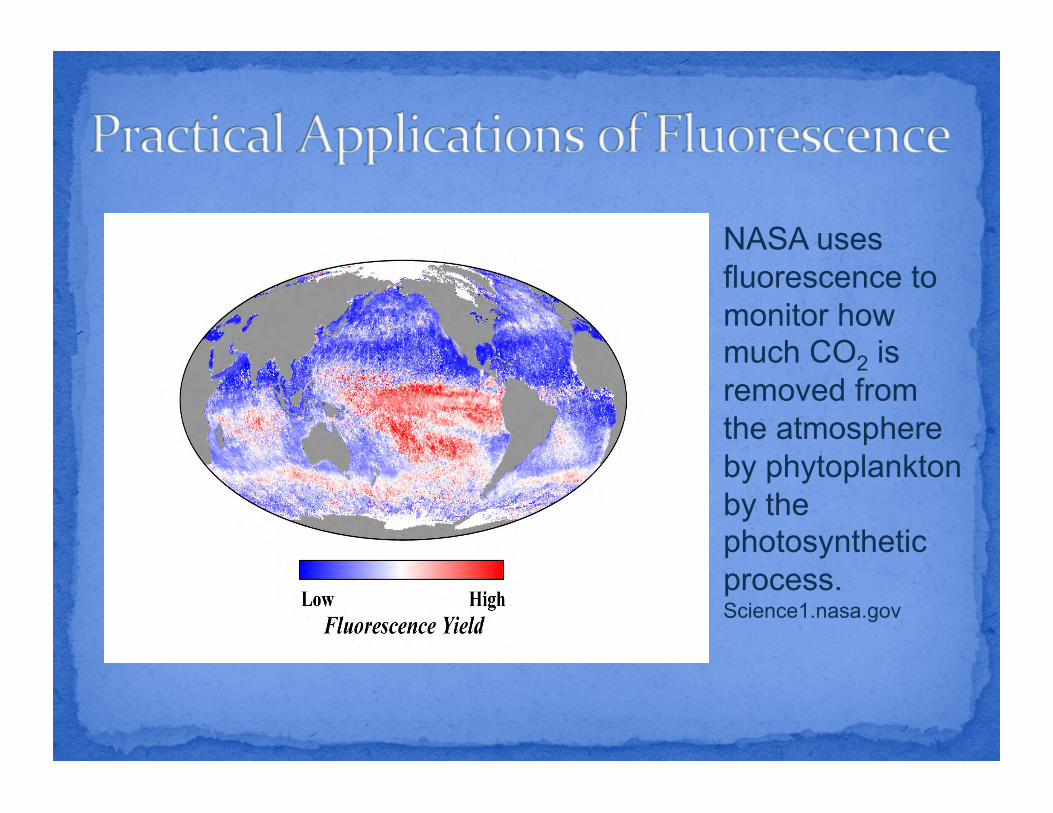
NASA uses fluorescence to monitor how much CO2 is removed from the atmosphere by phytoplankton by the photosynthetic process. Science1.nasa.gov

Magnification is at 800x the actual size of the organism. Phase contrasting was also used as this helped to visually “pop” the image of the phytoplankton (Thalassiosira weissflogii) into view.

A hemacytometer slide allows one to calculate the population of cells per Liter of fluid. A count of 200 cells gives an approximate 20% percentage of error.

12 Days have passed and the phytoplankton are not growing as expected. The clarity of the artificial seawater is one indicator that growth is not occurring.

y = 21834x -‐ 36516 R² = 0.89777
0
50000
100000
150000
200000
250000
300000
0 2 4 6 8 10 12 14 16
Total N
umbe
r of Cells (m
L)
Days
Total Cell Growth Over Time
Series1
Linear(Series1)

y = 310.97e4E-‐06x R² = 0.13844
300
350
400
450
500
550
600
650
700
85000 95000 105000 115000 125000 135000 145000 155000
Total C
ell C
ount
(mL)
Ft
Total Cell Count vs Ft Series1

To assist the growth of the phytoplankton, CO2 was bubbled through the media. A higher intensity of light was also used, but not the quantity of light. That remained at 12 hours on and 12 hours off.
Carbon Dioxide Bubbling Device


y = 443.88e3E-‐06x R² = 0.79912
0
1000
2000
3000
4000
5000
6000
7000
8000
9000
0 100000 200000 300000 400000 500000 600000 700000 800000 900000 1000000
Total C
ell C
ount
(mL)
Ft
Total Cell Number vs Ft
Total Cell Number vs Ft
Ft measures fluorescence which indicates population size. Population jumped over the July 4th weekend (4 days).

y = 19960e0.2002x R² = 0.8966
0
200000
400000
600000
800000
1000000
1200000
0 5 10 15 20 25
Total N
umbe
r of Cells (m
L)
Days
Total Number of CellsOver Days
Series1
Expon.(Series1)

As the phytoplankton grow, the culture is divided and added to new media. With CO2 and light the phytoplankton continues to grow.

The process is repeated. This creates just over 6 L of phytoplankton filled media.

Three experimental groups are created. One has Hydrocarbon Contaminated seawater forced into a suspension (WAF).

The six tanks are filled with an equal amount of phytoplankton media that had all been mixed (the 4 flasks) and topped with artificial seawater.
Great care is taken to ensure No bubbles are in the tanks. The rolling simulates movement in the deep sea where there are no surfaces.
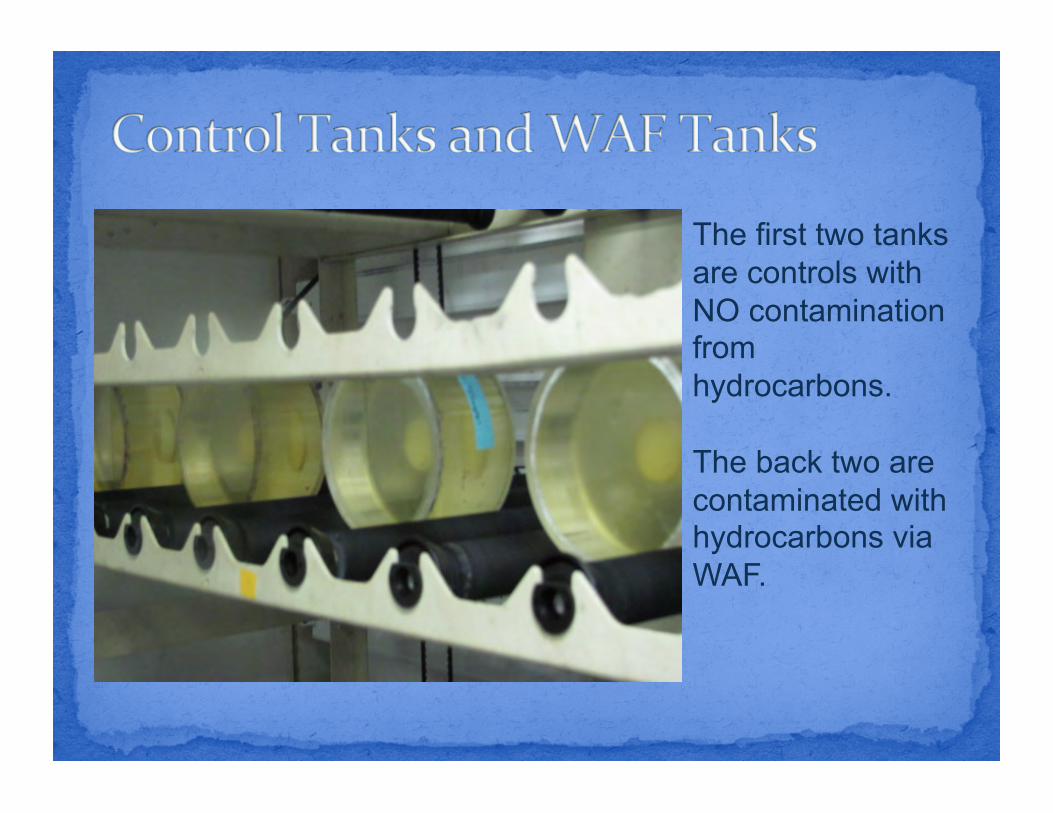
The first two tanks are controls with NO contamination from hydrocarbons.
The back two are contaminated with hydrocarbons via WAF.

1 mL of Oil from depth of the Deepwater Horizon was added to each of these two tanks.
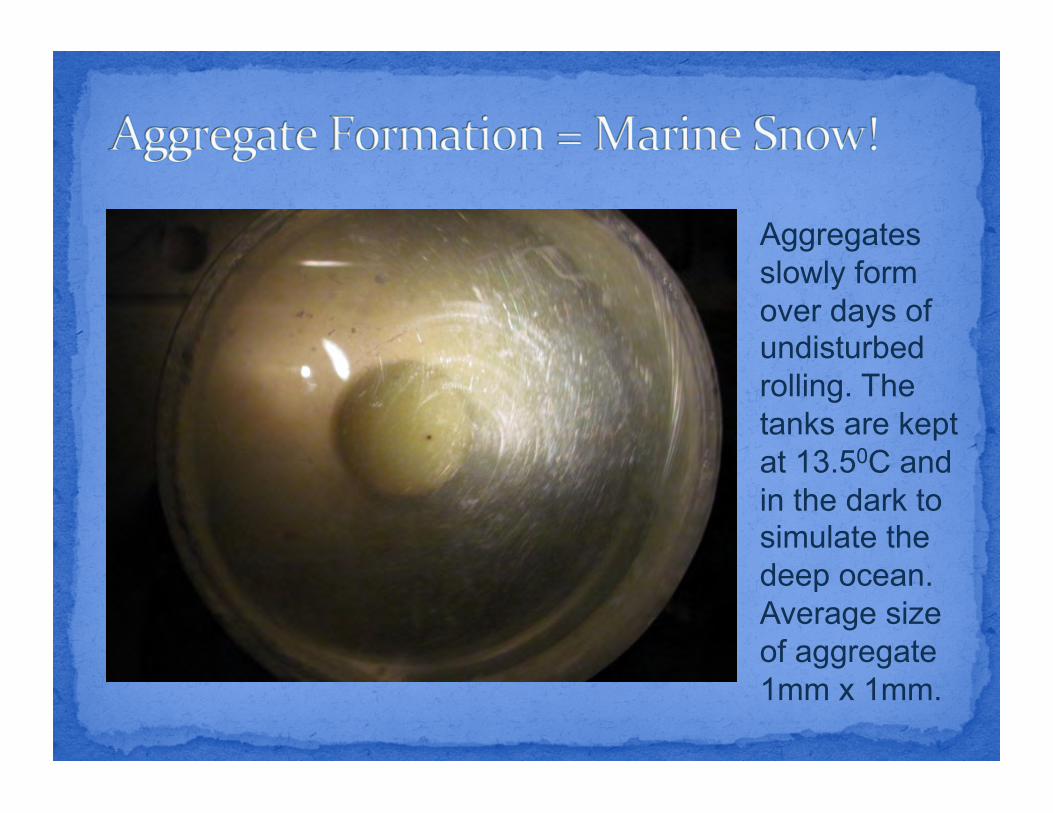
Aggregates slowly form over days of undisturbed rolling. The tanks are kept at 13.50C and in the dark to simulate the deep ocean. Average size of aggregate 1mm x 1mm.

Aggregates are carefully removed. Duplicate dry weights are calculated after filtration. Samples of phytoplankton cells were also collected.
0
10
20
30
40
50
60
70
80
0 1 2 3 4 5 6
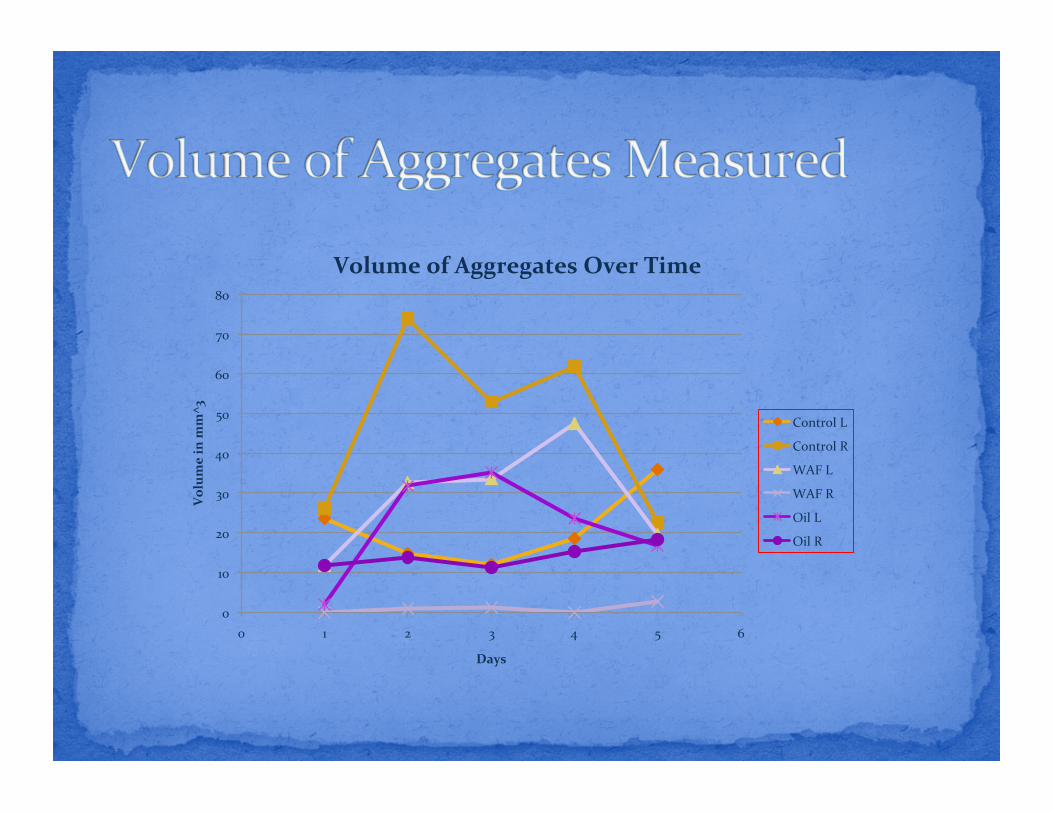
Volum
e in m
m^3
Days
Volume of Aggregates Over Time
Control L
Control R
WAF L
WAF R
Oil L
Oil R

In my Quest there are two replicates of each: control, WAF, and oil. In reality, there can be more replicates but sometimes not. Plus, the tanks are left in situ far longer than in my Quest.
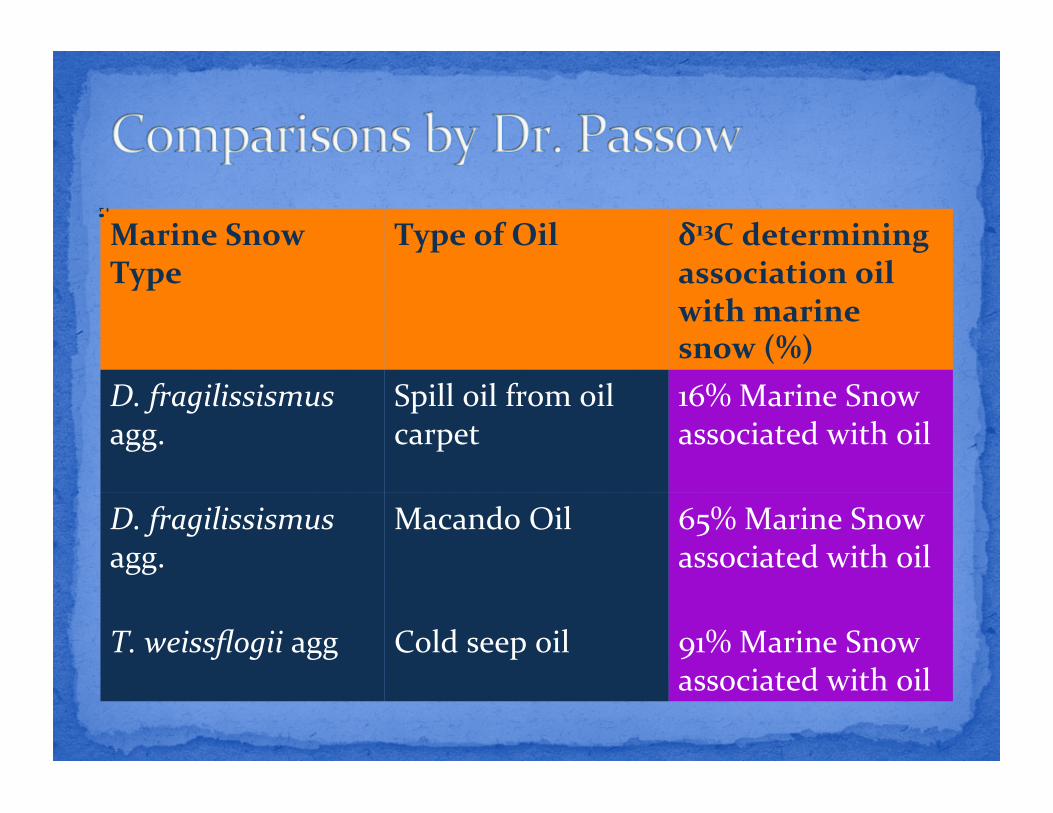
Marine Snow Type
Type of Oil δ13C determining association oil with marine snow (%)
D. fragilissismus agg.
Spill oil from oil carpet
16% Marine Snow associated with oil
D. fragilissismus agg.
Macando Oil 65% Marine Snow associated with oil
T. weissflogii agg Cold seep oil 91% Marine Snow associated with oil

How does all this scientific information apply to the classroom?
Conceptual Education: Everything Interacts with Everything http://www.skepticalscience.com/pics/Biologicalcarboncycle.jpg

Photosynthesis is a basic concept and yet my students fail to grasp it as a “fact”.
As a concept, I hope to apply the role of Carbon in the students lives and then expand upon it. http://courtneystanifer.edublogs.org/files/2010/05/photosynthesis

This lab demonstrates the release of CO2 from burning organic matter and exhalation, plus the release of O2 from plants.
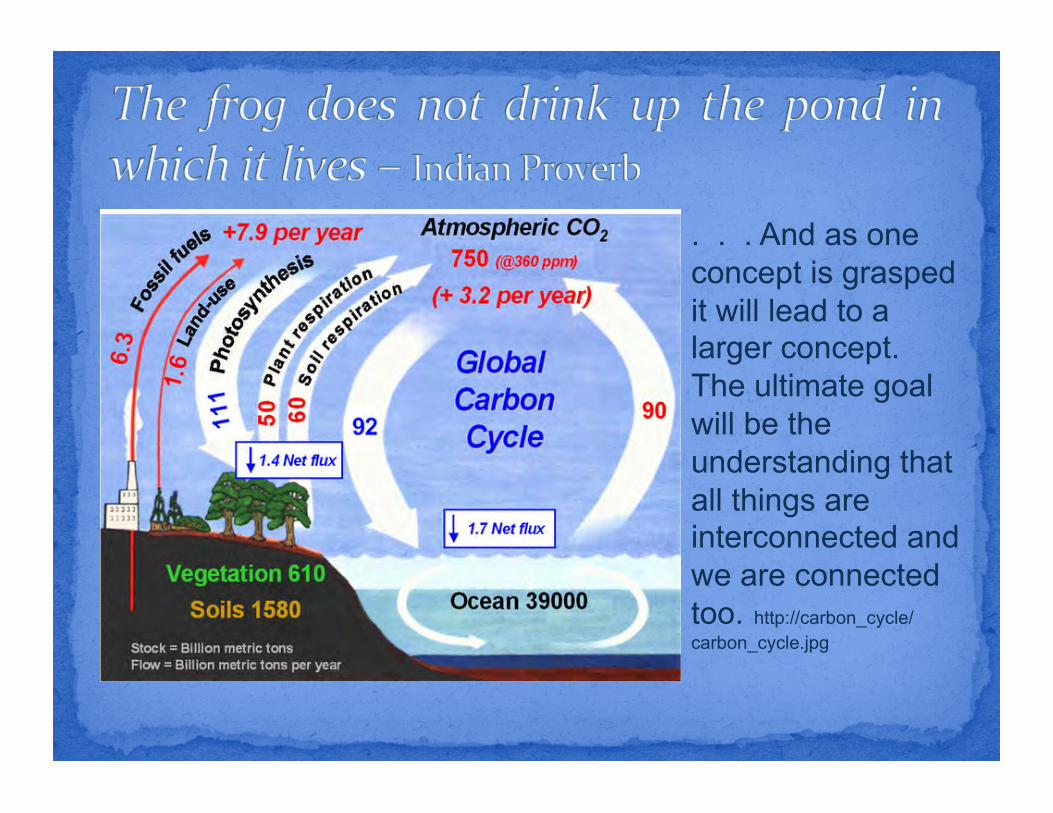
. . . And as one concept is grasped it will lead to a larger concept. The ultimate goal will be the understanding that all things are interconnected and we are connected too. http://carbon_cycle/carbon_cycle.jpg

Julia Sweet – Wealth of Knowledge
Julie Gonzalez – Master of Excel
Mentor Dr. Uta Passow
One of the Best Instructors I have ever had – thank you.
RET 2013 Thank you so much for this opportunity.
Special thanks to: Dr. Frank Kinnaman And Mary McGuan for encouraging me to participate.
And a thank you to Philip Becker who just happened to be walking by at the right time – Mr. Bubble