Quarter 1 Module 2: Determining the Effect of Textual Aids ...
Upload
ranie-livero-villaminCategory
view
1.888download
137
Textual AidsMr. Ranie Livero O. Villamin, MEd-English

Reading 4.4.2 Note effectiveness of textual aids like graphic organizers in activating background knowledge.
Goal

Viewing
Activity 1

GRAPHIC ORGANIZERS

Graphic organizers are visual displays of key content information designed to benefit learners who have difficulty organizing information (Fisher & Schumaker, 1995).
Graphic organizers are meant to help students clearly visualize how ideas are organized within a text or surrounding a concept.
Graphic organizers provide students with a structure for abstract ideas.
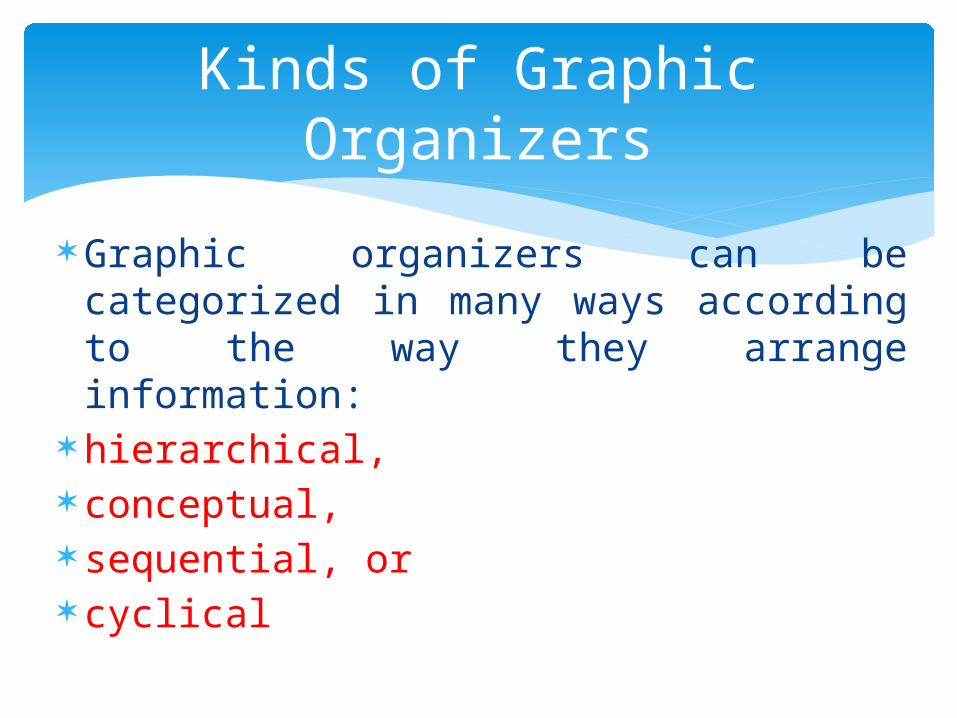
Graphic organizers can be categorized in many ways according to the way they arrange information:
hierarchical, conceptual, sequential, or cyclical
Kinds of Graphic Organizers
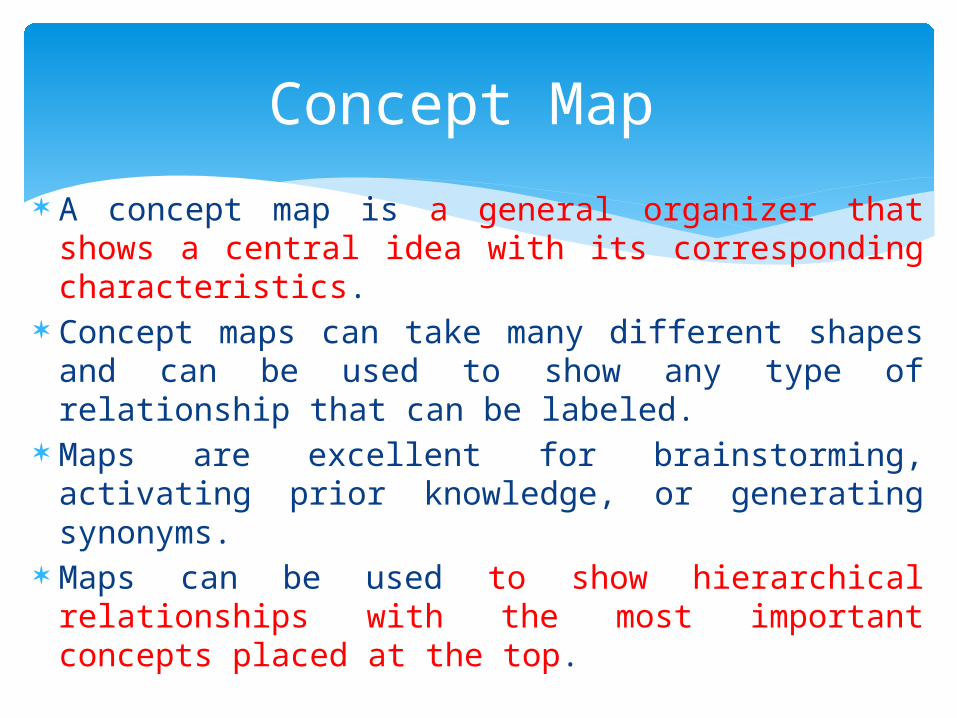
A concept map is a general organizer that shows a central idea with its corresponding characteristics.
Concept maps can take many different shapes and can be used to show any type of relationship that can be labeled.
Maps are excellent for brainstorming, activating prior knowledge, or generating synonyms.
Maps can be used to show hierarchical relationships with the most important concepts placed at the top.
Concept Map


A flow diagram or sequence chart shows a series of steps or events in the order in which they take place.
Any concept that has a distinct order can be displayed in this type of organizer.
It is an excellent tool for teaching students the steps necessary to reach a final point.
The following examples illustrate the many uses of flow diagrams or sequence charts.
In reading, sequence charts can be used to outline the key events in a story or chapter.
In science, they can serve as the procedures section in the scientific process.
In history, they can be created as a timeline.
Flow Diagram or Sequence Chart


A compare/contrast or Venn diagram is used to identify the similarities and differences between two or more concepts.
The most commonly used organizer, this instructional tool is found in textbooks, on standardized tests, and in teacher resource materials.
Compare/Contrast or Venn Diagram


A cause-and-effect diagram highlights the direct relationship between different events or concepts.
This tool is one of the most beneficial organizers because of its many applications in all subject areas.
For example, this diagram might be used to analyze characters and events in reading, to discuss major events in social studies, or to study the impact of a science experiment.
Cause-and-Effect Diagram


Activity 2
Read the following
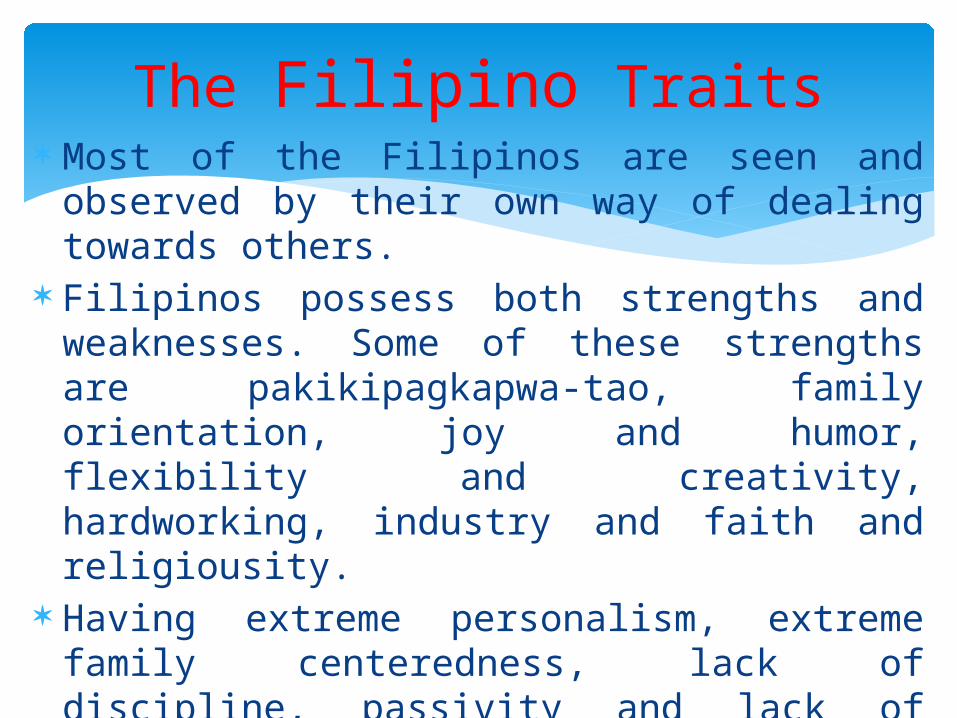
Most of the Filipinos are seen and observed by their own way of dealing towards others.
Filipinos possess both strengths and weaknesses. Some of these strengths are pakikipagkapwa-tao, family orientation, joy and humor, flexibility and creativity, hardworking, industry and faith and religiousity.
Having extreme personalism, extreme family centeredness, lack of discipline, passivity and lack of initiative, colonial mentality, kanya-kanya syndrome and lack of self-analysis and reflection are considered to be as weaknesses.
The Filipino Traits

Make a presentation on Filipino Traits using the chosen graphic organizer.
Activity 3

With your group, present a commercial showing good/positive values.
Agreement