Texas Voter Sample
19
1 Texas Voter Sample Field Dates: September 7 – 14, 2021 N= 1,148 Adults (Registered Voters) Margin of error: +/- 2.9% Margin of sampling error: +/- 3.7% (design effect) Survey of Texas Voters Do you consider yourself to be a Republican, Democrat, or neither? Code Total Latino Black White 1 Democrat 30% 33% 50% 25% 2 Republican 35 28 11 46 3 Neither 34 39 40 29 Total = 1,148 304 151 636 [If Republican or Democrat] Do you consider yourself to be a strong [Republican/ Democrat] or not strong [Republican/ Democrat]? OR [If independent, no preference, or other party] Do you think of yourself as closer to the Republican Party or to the Democratic Party? Code Total Latino Black White 1 Strong Democrat 19% 15% 36% 17% 2 Not strong Democrat 11 18 14 7 3 Lean Democratic, Independent 9 15 10 5 4 Lean to no Party, Independent 15 15 22 12 5 Lean Republican, Independent 11 9 8 12 6 Not strong Republican 11 11 4 14 7 Strong Republican 24 17 7 32 Total = 1,148 304 151 635 Using a 7-point scale where 1 is extremely liberal and 7 is extremely conservative, how would you rate your political views. Code Total Dem. Ind. Rep. 1 Extremely Liberal 7% 13% 4% 3% 2 Liberal 8 23 4 1 3 Slightly Liberal 10 16 11 2 4 Moderate, Middle of the Road 32 33 45 18 5 Slightly Conservative 7 4 8 10 6 Conservative 17 4 8 38 7 Extremely Conservative 13 4 6 27 8 Don’t Know 7 3 14 2 Total = 1,148 345 396 407
Transcript of Texas Voter Sample
1
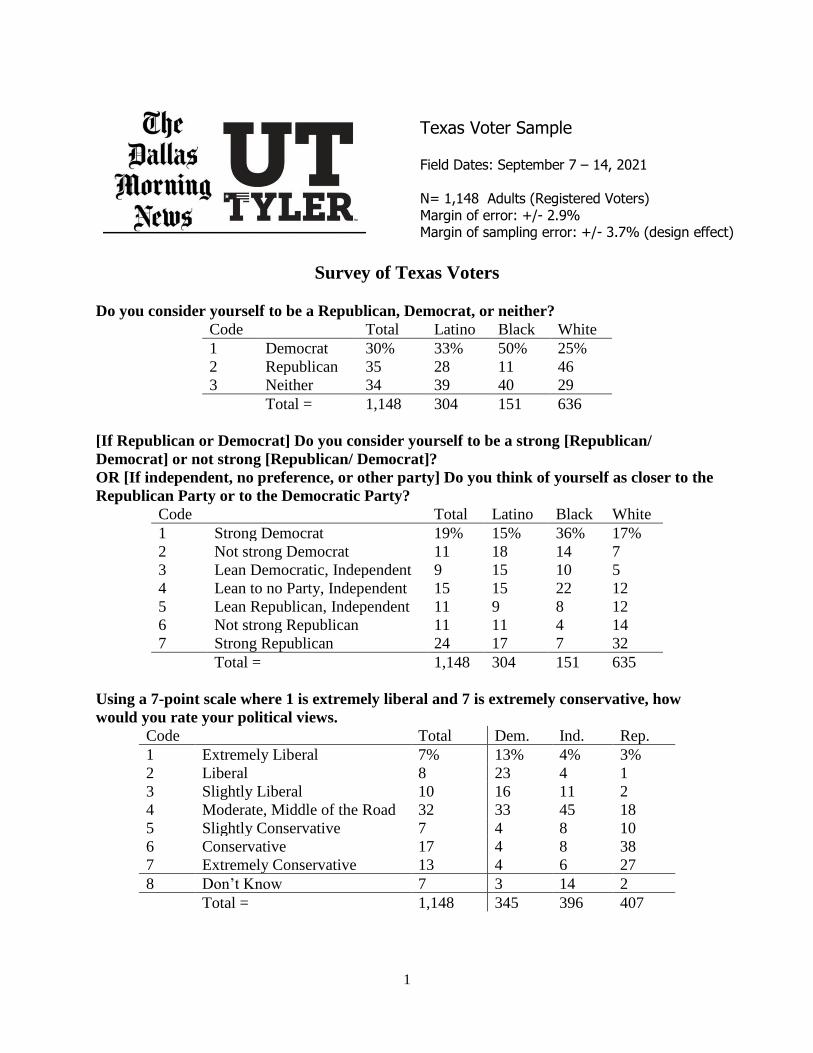
Texas Voter Sample Field Dates: September 7 – 14, 2021 N= 1,148 Adults (Registered Voters) Margin of error: +/- 2.9% Margin of sampling error: +/- 3.7% (design effect)
Survey of Texas Voters
Do you consider yourself to be a Republican, Democrat, or neither?
Code Total Latino Black White
1 Democrat 30% 33% 50% 25%
2 Republican 35 28 11 46
3 Neither 34 39 40 29
Total = 1,148 304 151 636
[If Republican or Democrat] Do you consider yourself to be a strong [Republican/
Democrat] or not strong [Republican/ Democrat]?
OR [If independent, no preference, or other party] Do you think of yourself as closer to the
Republican Party or to the Democratic Party?
Code Total Latino Black White
1 Strong Democrat 19% 15% 36% 17%
2 Not strong Democrat 11 18 14 7
3 Lean Democratic, Independent 9 15 10 5
4 Lean to no Party, Independent 15 15 22 12
5 Lean Republican, Independent 11 9 8 12
6 Not strong Republican 11 11 4 14
7 Strong Republican 24 17 7 32
Total = 1,148 304 151 635
Using a 7-point scale where 1 is extremely liberal and 7 is extremely conservative, how
would you rate your political views.
Code Total Dem. Ind. Rep.
1 Extremely Liberal 7% 13% 4% 3%
2 Liberal 8 23 4 1
3 Slightly Liberal 10 16 11 2
4 Moderate, Middle of the Road 32 33 45 18
5 Slightly Conservative 7 4 8 10
6 Conservative 17 4 8 38
7 Extremely Conservative 13 4 6 27
8 Don’t Know 7 3 14 2
Total = 1,148 345 396 407
2
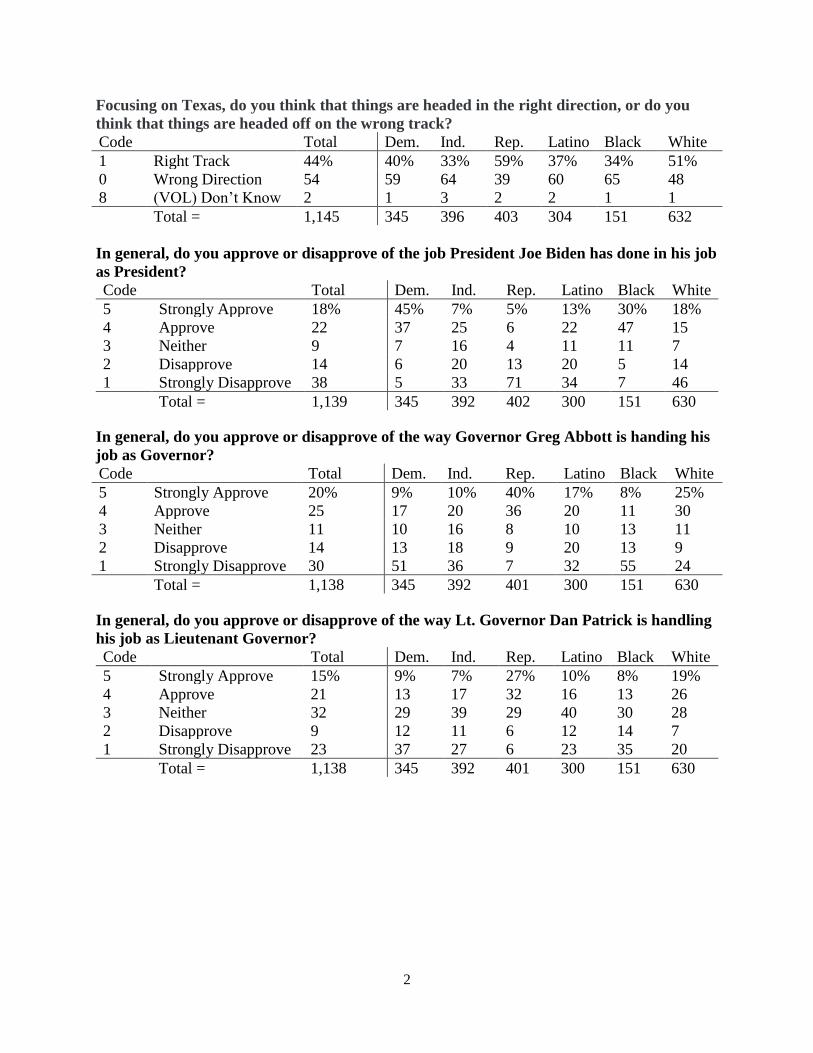
Focusing on Texas, do you think that things are headed in the right direction, or do you
think that things are headed off on the wrong track?
Code Total Dem. Ind. Rep. Latino Black White
1 Right Track 44% 40% 33% 59% 37% 34% 51%
0 Wrong Direction 54 59 64 39 60 65 48
8 (VOL) Don’t Know 2 1 3 2 2 1 1
Total = 1,145 345 396 403 304 151 632
In general, do you approve or disapprove of the job President Joe Biden has done in his job
as President?
Code Total Dem. Ind. Rep. Latino Black White
5 Strongly Approve 18% 45% 7% 5% 13% 30% 18%
4 Approve 22 37 25 6 22 47 15
3 Neither 9 7 16 4 11 11 7
2 Disapprove 14 6 20 13 20 5 14
1 Strongly Disapprove 38 5 33 71 34 7 46
Total = 1,139 345 392 402 300 151 630
In general, do you approve or disapprove of the way Governor Greg Abbott is handing his
job as Governor?
Code Total Dem. Ind. Rep. Latino Black White
5 Strongly Approve 20% 9% 10% 40% 17% 8% 25%
4 Approve 25 17 20 36 20 11 30
3 Neither 11 10 16 8 10 13 11
2 Disapprove 14 13 18 9 20 13 9
1 Strongly Disapprove 30 51 36 7 32 55 24
Total = 1,138 345 392 401 300 151 630
In general, do you approve or disapprove of the way Lt. Governor Dan Patrick is handling
his job as Lieutenant Governor?
Code Total Dem. Ind. Rep. Latino Black White
5 Strongly Approve 15% 9% 7% 27% 10% 8% 19%
4 Approve 21 13 17 32 16 13 26
3 Neither 32 29 39 29 40 30 28
2 Disapprove 9 12 11 6 12 14 7
1 Strongly Disapprove 23 37 27 6 23 35 20
Total = 1,138 345 392 401 300 151 630
3
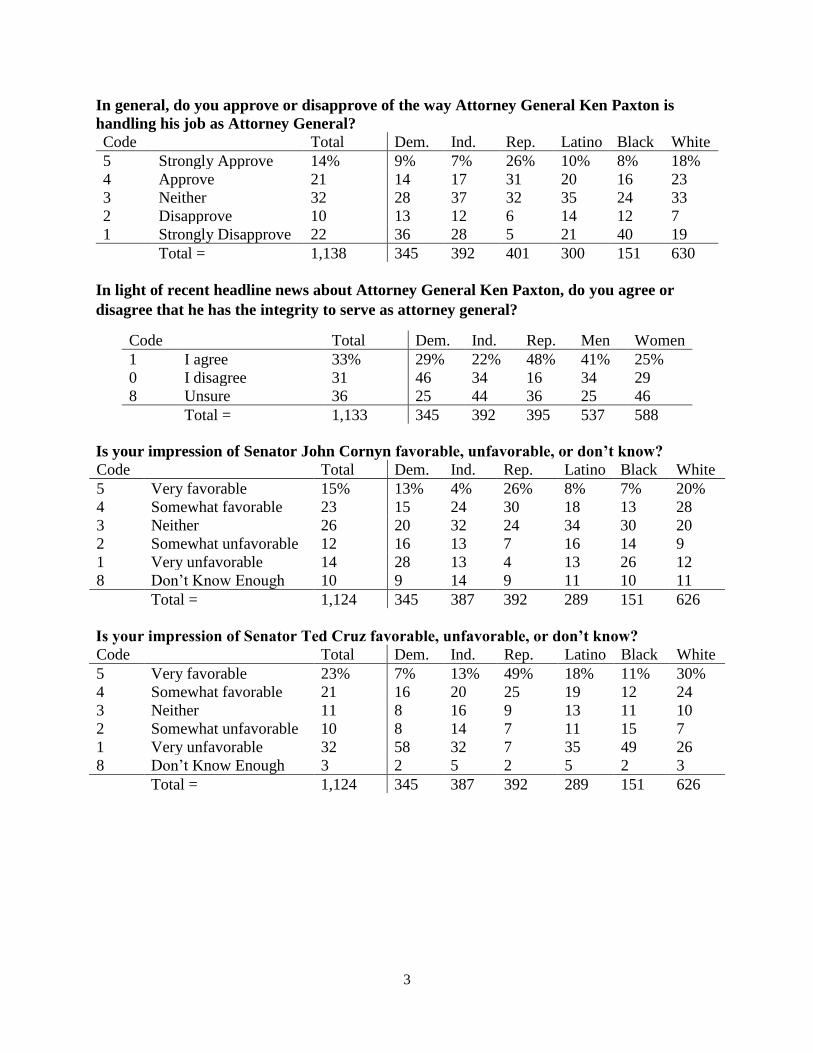
In general, do you approve or disapprove of the way Attorney General Ken Paxton is
handling his job as Attorney General?
Code Total Dem. Ind. Rep. Latino Black White
5 Strongly Approve 14% 9% 7% 26% 10% 8% 18%
4 Approve 21 14 17 31 20 16 23
3 Neither 32 28 37 32 35 24 33
2 Disapprove 10 13 12 6 14 12 7
1 Strongly Disapprove 22 36 28 5 21 40 19
Total = 1,138 345 392 401 300 151 630
In light of recent headline news about Attorney General Ken Paxton, do you agree or
disagree that he has the integrity to serve as attorney general?
Code Total Dem. Ind. Rep. Men Women
1 I agree 33% 29% 22% 48% 41% 25%
0 I disagree 31 46 34 16 34 29
8 Unsure 36 25 44 36 25 46
Total = 1,133 345 392 395 537 588
Is your impression of Senator John Cornyn favorable, unfavorable, or don’t know?
Code Total Dem. Ind. Rep. Latino Black White
5 Very favorable 15% 13% 4% 26% 8% 7% 20%
4 Somewhat favorable 23 15 24 30 18 13 28
3 Neither 26 20 32 24 34 30 20
2 Somewhat unfavorable 12 16 13 7 16 14 9
1 Very unfavorable 14 28 13 4 13 26 12
8 Don’t Know Enough 10 9 14 9 11 10 11
Total = 1,124 345 387 392 289 151 626
Is your impression of Senator Ted Cruz favorable, unfavorable, or don’t know?
Code Total Dem. Ind. Rep. Latino Black White
5 Very favorable 23% 7% 13% 49% 18% 11% 30%
4 Somewhat favorable 21 16 20 25 19 12 24
3 Neither 11 8 16 9 13 11 10
2 Somewhat unfavorable 10 8 14 7 11 15 7
1 Very unfavorable 32 58 32 7 35 49 26
8 Don’t Know Enough 3 2 5 2 5 2 3
Total = 1,124 345 387 392 289 151 626
4
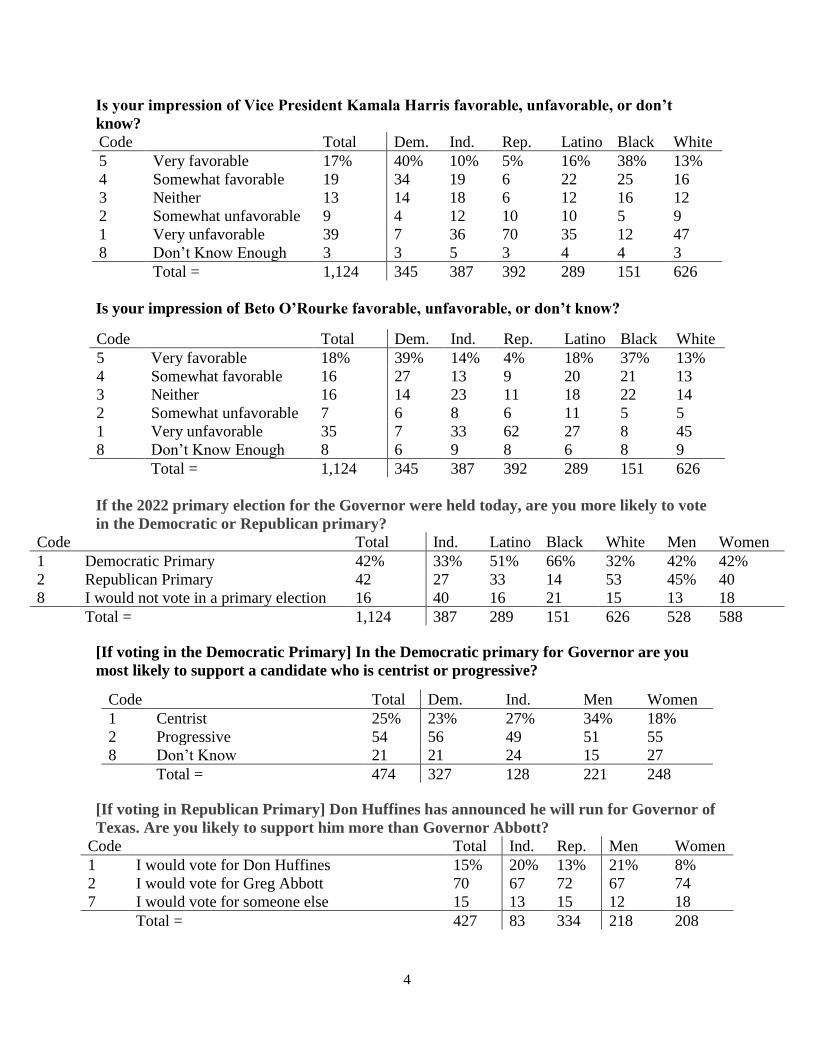
Is your impression of Vice President Kamala Harris favorable, unfavorable, or don’t
know?
Code Total Dem. Ind. Rep. Latino Black White
5 Very favorable 17% 40% 10% 5% 16% 38% 13%
4 Somewhat favorable 19 34 19 6 22 25 16
3 Neither 13 14 18 6 12 16 12
2 Somewhat unfavorable 9 4 12 10 10 5 9
1 Very unfavorable 39 7 36 70 35 12 47
8 Don’t Know Enough 3 3 5 3 4 4 3
Total = 1,124 345 387 392 289 151 626
Is your impression of Beto O’Rourke favorable, unfavorable, or don’t know?
Code Total Dem. Ind. Rep. Latino Black White
5 Very favorable 18% 39% 14% 4% 18% 37% 13%
4 Somewhat favorable 16 27 13 9 20 21 13
3 Neither 16 14 23 11 18 22 14
2 Somewhat unfavorable 7 6 8 6 11 5 5
1 Very unfavorable 35 7 33 62 27 8 45
8 Don’t Know Enough 8 6 9 8 6 8 9
Total = 1,124 345 387 392 289 151 626
If the 2022 primary election for the Governor were held today, are you more likely to vote
in the Democratic or Republican primary?
Code Total Ind. Latino Black White Men Women
1 Democratic Primary 42% 33% 51% 66% 32% 42% 42%
2 Republican Primary 42 27 33 14 53 45% 40
8 I would not vote in a primary election 16 40 16 21 15 13 18
Total = 1,124 387 289 151 626 528 588
[If voting in the Democratic Primary] In the Democratic primary for Governor are you
most likely to support a candidate who is centrist or progressive?
Code Total Dem. Ind. Men Women
1 Centrist 25% 23% 27% 34% 18%
2 Progressive 54 56 49 51 55
8 Don’t Know 21 21 24 15 27
Total = 474 327 128 221 248
[If voting in Republican Primary] Don Huffines has announced he will run for Governor of
Texas. Are you likely to support him more than Governor Abbott?
Code Total Ind. Rep. Men Women
1 I would vote for Don Huffines 15% 20% 13% 21% 8%
2 I would vote for Greg Abbott 70 67 72 67 74
7 I would vote for someone else 15 13 15 12 18
Total = 427 83 334 218 208
5
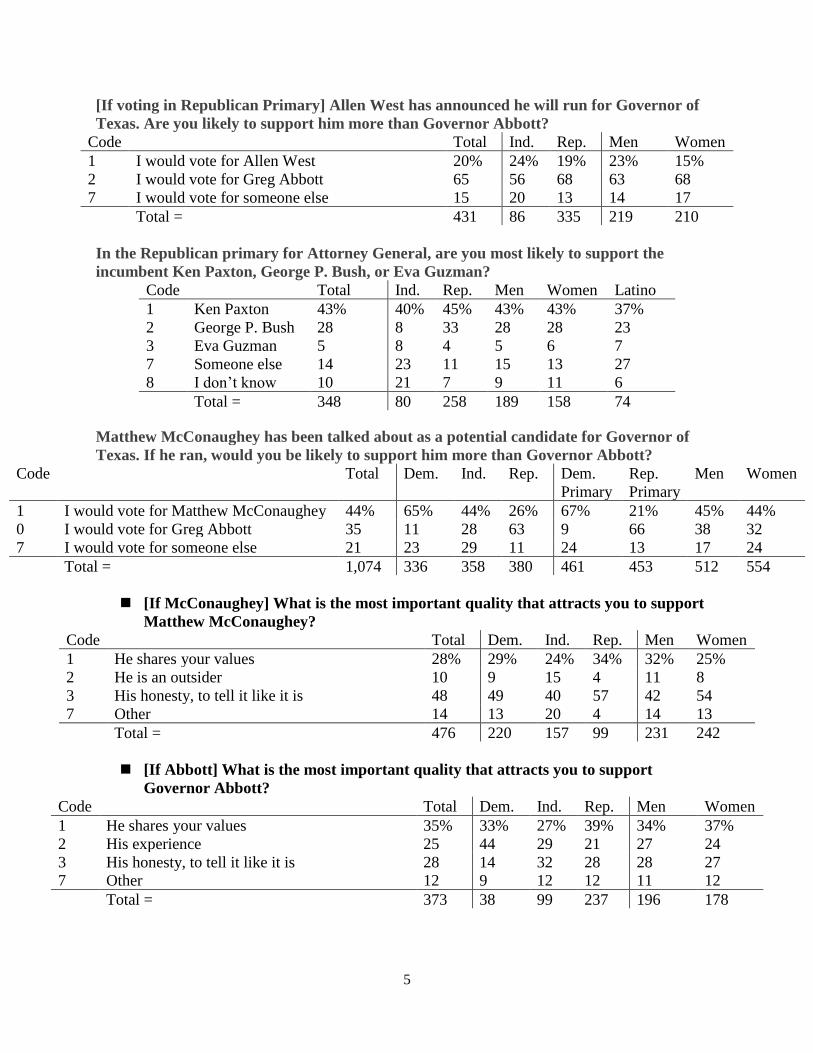
[If voting in Republican Primary] Allen West has announced he will run for Governor of
Texas. Are you likely to support him more than Governor Abbott?
Code Total Ind. Rep. Men Women
1 I would vote for Allen West 20% 24% 19% 23% 15%
2 I would vote for Greg Abbott 65 56 68 63 68
7 I would vote for someone else 15 20 13 14 17
Total = 431 86 335 219 210
In the Republican primary for Attorney General, are you most likely to support the
incumbent Ken Paxton, George P. Bush, or Eva Guzman?
Code Total Ind. Rep. Men Women Latino
1 Ken Paxton 43% 40% 45% 43% 43% 37%
2 George P. Bush 28 8 33 28 28 23
3 Eva Guzman 5 8 4 5 6 7
7 Someone else 14 23 11 15 13 27
8 I don’t know 10 21 7 9 11 6
Total = 348 80 258 189 158 74
Matthew McConaughey has been talked about as a potential candidate for Governor of
Texas. If he ran, would you be likely to support him more than Governor Abbott?
Code Total Dem. Ind. Rep. Dem.
Primary
Rep.
Primary
Men Women
1 I would vote for Matthew McConaughey 44% 65% 44% 26% 67% 21% 45% 44%
0 I would vote for Greg Abbott 35 11 28 63 9 66 38 32
7 I would vote for someone else 21 23 29 11 24 13 17 24
Total = 1,074 336 358 380 461 453 512 554
◼ [If McConaughey] What is the most important quality that attracts you to support
Matthew McConaughey?
Code Total Dem. Ind. Rep. Men Women
1 He shares your values 28% 29% 24% 34% 32% 25%
2 He is an outsider 10 9 15 4 11 8
3 His honesty, to tell it like it is 48 49 40 57 42 54
7 Other 14 13 20 4 14 13
Total = 476 220 157 99 231 242
◼ [If Abbott] What is the most important quality that attracts you to support
Governor Abbott?
Code Total Dem. Ind. Rep. Men Women
1 He shares your values 35% 33% 27% 39% 34% 37%
2 His experience 25 44 29 21 27 24
3 His honesty, to tell it like it is 28 14 32 28 28 27
7 Other 12 9 12 12 11 12
Total = 373 38 99 237 196 178
6
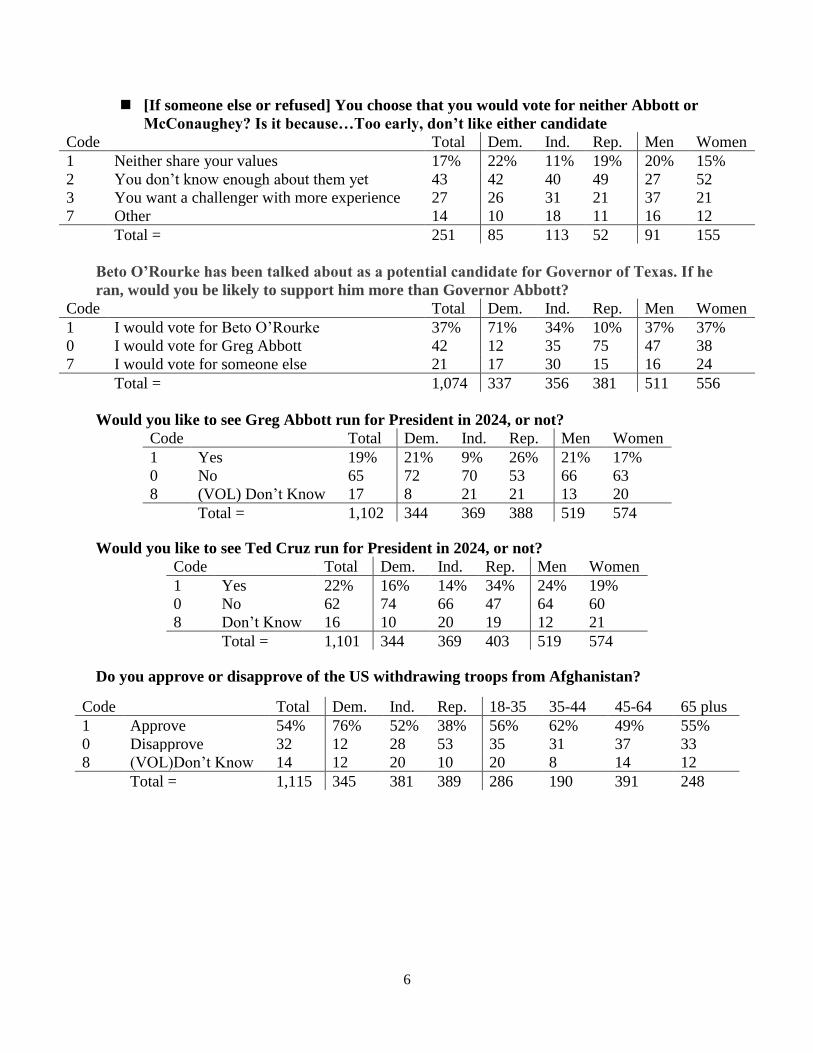
◼ [If someone else or refused] You choose that you would vote for neither Abbott or
McConaughey? Is it because…Too early, don’t like either candidate
Code Total Dem. Ind. Rep. Men Women
1 Neither share your values 17% 22% 11% 19% 20% 15%
2 You don’t know enough about them yet 43 42 40 49 27 52
3 You want a challenger with more experience 27 26 31 21 37 21
7 Other 14 10 18 11 16 12
Total = 251 85 113 52 91 155
Beto O’Rourke has been talked about as a potential candidate for Governor of Texas. If he
ran, would you be likely to support him more than Governor Abbott?
Code Total Dem. Ind. Rep. Men Women
1 I would vote for Beto O’Rourke 37% 71% 34% 10% 37% 37%
0 I would vote for Greg Abbott 42 12 35 75 47 38
7 I would vote for someone else 21 17 30 15 16 24
Total = 1,074 337 356 381 511 556
Would you like to see Greg Abbott run for President in 2024, or not?
Code Total Dem. Ind. Rep. Men Women
1 Yes 19% 21% 9% 26% 21% 17%
0 No 65 72 70 53 66 63
8 (VOL) Don’t Know 17 8 21 21 13 20
Total = 1,102 344 369 388 519 574
Would you like to see Ted Cruz run for President in 2024, or not?
Code Total Dem. Ind. Rep. Men Women
1 Yes 22% 16% 14% 34% 24% 19%
0 No 62 74 66 47 64 60
8 Don’t Know 16 10 20 19 12 21
Total = 1,101 344 369 403 519 574
Do you approve or disapprove of the US withdrawing troops from Afghanistan?
Code Total Dem. Ind. Rep. 18-35 35-44 45-64 65 plus
1 Approve 54% 76% 52% 38% 56% 62% 49% 55%
0 Disapprove 32 12 28 53 35 31 37 33
8 (VOL)Don’t Know 14 12 20 10 20 8 14 12
Total = 1,115 345 381 389 286 190 391 248
7
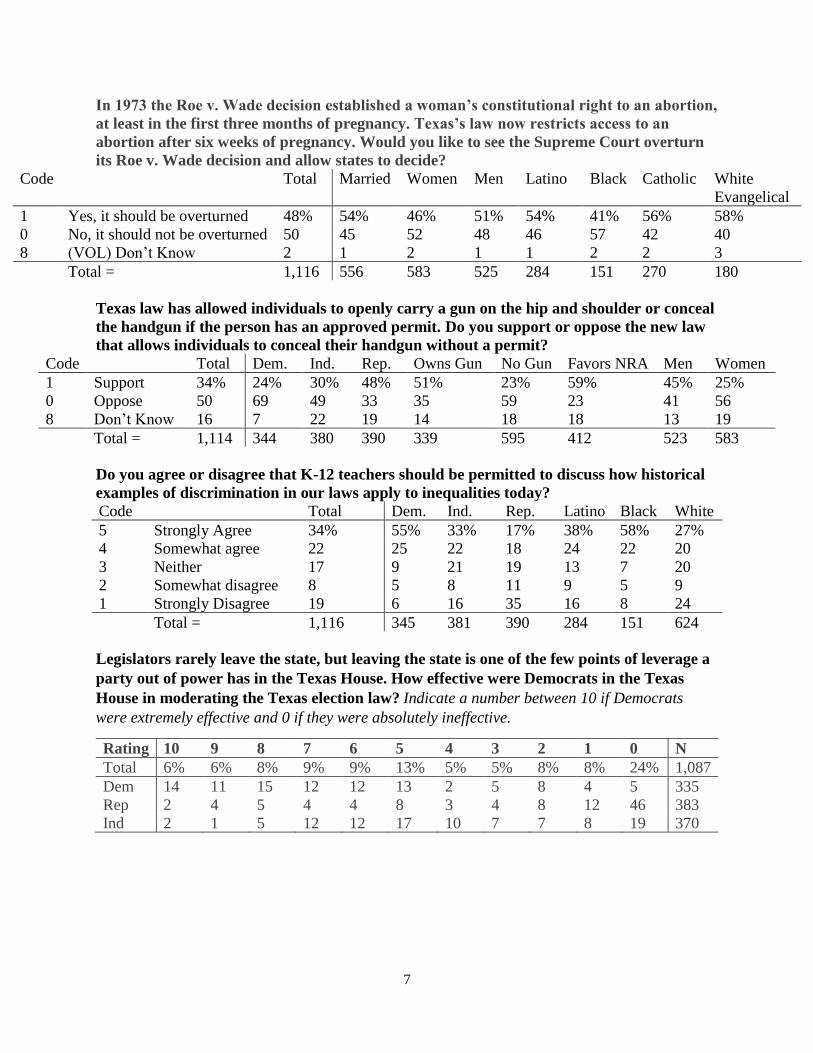
In 1973 the Roe v. Wade decision established a woman’s constitutional right to an abortion,
at least in the first three months of pregnancy. Texas’s law now restricts access to an
abortion after six weeks of pregnancy. Would you like to see the Supreme Court overturn
its Roe v. Wade decision and allow states to decide?
Code Total Married Women Men Latino Black Catholic White
Evangelical
1 Yes, it should be overturned 48% 54% 46% 51% 54% 41% 56% 58%
0 No, it should not be overturned 50 45 52 48 46 57 42 40
8 (VOL) Don’t Know 2 1 2 1 1 2 2 3
Total = 1,116 556 583 525 284 151 270 180
Texas law has allowed individuals to openly carry a gun on the hip and shoulder or conceal
the handgun if the person has an approved permit. Do you support or oppose the new law
that allows individuals to conceal their handgun without a permit?
Code Total Dem. Ind. Rep. Owns Gun No Gun Favors NRA Men Women
1 Support 34% 24% 30% 48% 51% 23% 59% 45% 25%
0 Oppose 50 69 49 33 35 59 23 41 56
8 Don’t Know 16 7 22 19 14 18 18 13 19
Total = 1,114 344 380 390 339 595 412 523 583
Do you agree or disagree that K-12 teachers should be permitted to discuss how historical
examples of discrimination in our laws apply to inequalities today?
Code Total Dem. Ind. Rep. Latino Black White
5 Strongly Agree 34% 55% 33% 17% 38% 58% 27%
4 Somewhat agree 22 25 22 18 24 22 20
3 Neither 17 9 21 19 13 7 20
2 Somewhat disagree 8 5 8 11 9 5 9
1 Strongly Disagree 19 6 16 35 16 8 24
Total = 1,116 345 381 390 284 151 624
Legislators rarely leave the state, but leaving the state is one of the few points of leverage a
party out of power has in the Texas House. How effective were Democrats in the Texas
House in moderating the Texas election law? Indicate a number between 10 if Democrats
were extremely effective and 0 if they were absolutely ineffective.
Rating 10 9 8 7 6 5 4 3 2 1 0 N
Total 6% 6% 8% 9% 9% 13% 5% 5% 8% 8% 24% 1,087
Dem 14 11 15 12 12 13 2 5 8 4 5 335
Rep 2 4 5 4 4 8 3 4 8 12 46 383
Ind 2 1 5 12 12 17 10 7 7 8 19 370
8
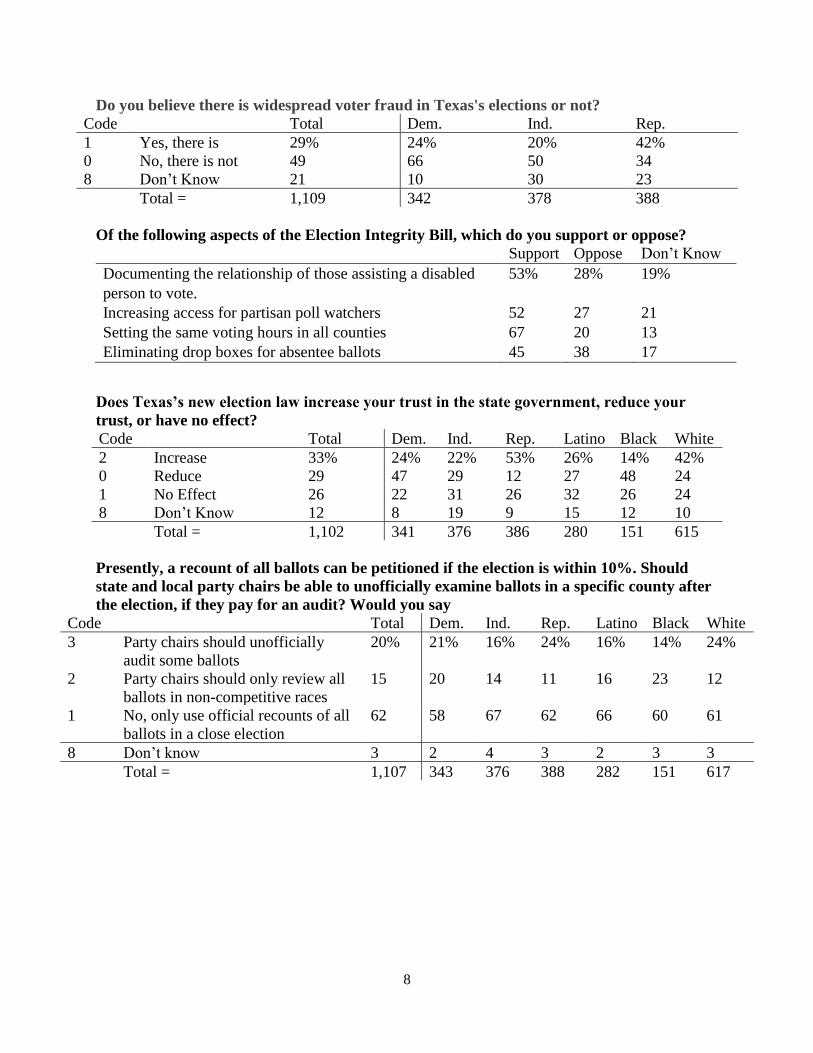
Do you believe there is widespread voter fraud in Texas's elections or not?
Code Total Dem. Ind. Rep.
1 Yes, there is 29% 24% 20% 42%
0 No, there is not 49 66 50 34
8 Don’t Know 21 10 30 23
Total = 1,109 342 378 388
Of the following aspects of the Election Integrity Bill, which do you support or oppose?
Support Oppose Don’t Know
Documenting the relationship of those assisting a disabled
person to vote.
53% 28% 19%
Increasing access for partisan poll watchers 52 27 21
Setting the same voting hours in all counties 67 20 13
Eliminating drop boxes for absentee ballots 45 38 17
Does Texas’s new election law increase your trust in the state government, reduce your
trust, or have no effect?
Code Total Dem. Ind. Rep. Latino Black White
2 Increase 33% 24% 22% 53% 26% 14% 42%
0 Reduce 29 47 29 12 27 48 24
1 No Effect 26 22 31 26 32 26 24
8 Don’t Know 12 8 19 9 15 12 10
Total = 1,102 341 376 386 280 151 615
Presently, a recount of all ballots can be petitioned if the election is within 10%. Should
state and local party chairs be able to unofficially examine ballots in a specific county after
the election, if they pay for an audit? Would you say
Code Total Dem. Ind. Rep. Latino Black White
3 Party chairs should unofficially
audit some ballots
20% 21% 16% 24% 16% 14% 24%
2 Party chairs should only review all
ballots in non-competitive races
15 20 14 11 16 23 12
1 No, only use official recounts of all
ballots in a close election
62 58 67 62 66 60 61
8 Don’t know 3 2 4 3 2 3 3
Total = 1,107 343 376 388 282 151 617
9
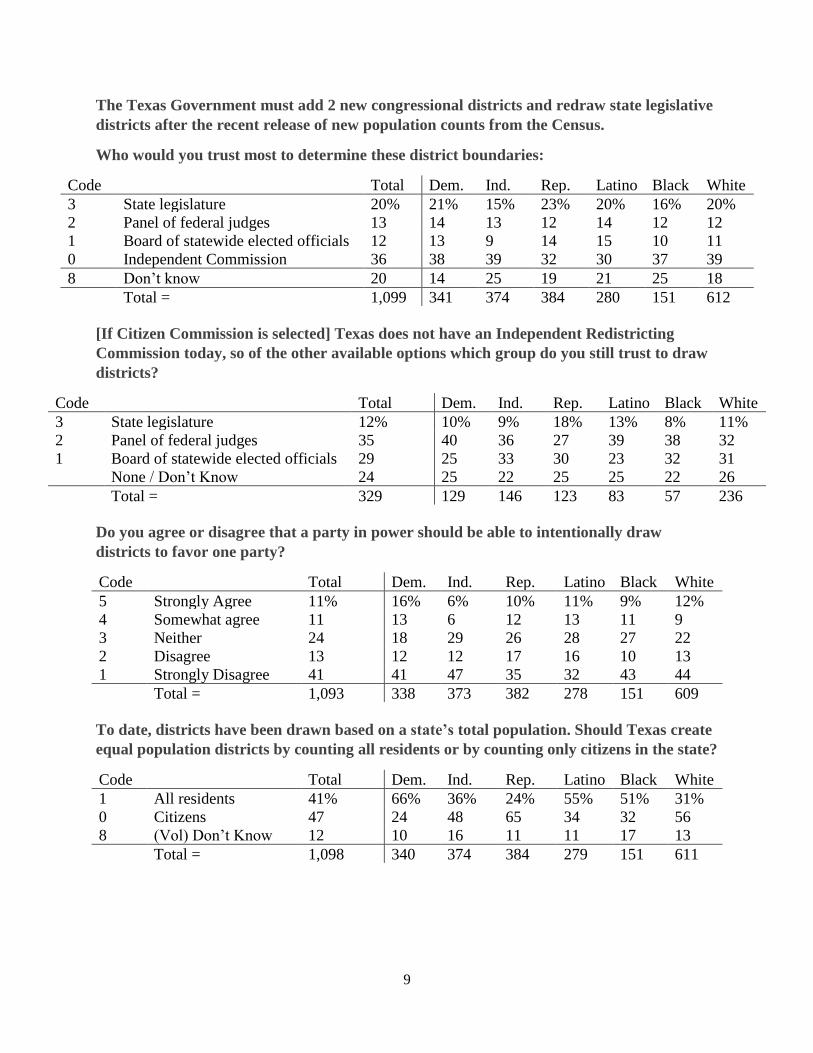
The Texas Government must add 2 new congressional districts and redraw state legislative
districts after the recent release of new population counts from the Census.
Who would you trust most to determine these district boundaries:
Code Total Dem. Ind. Rep. Latino Black White
3 State legislature 20% 21% 15% 23% 20% 16% 20%
2 Panel of federal judges 13 14 13 12 14 12 12
1 Board of statewide elected officials 12 13 9 14 15 10 11
0 Independent Commission 36 38 39 32 30 37 39
8 Don’t know 20 14 25 19 21 25 18
Total = 1,099 341 374 384 280 151 612
[If Citizen Commission is selected] Texas does not have an Independent Redistricting
Commission today, so of the other available options which group do you still trust to draw
districts?
Code Total Dem. Ind. Rep. Latino Black White
3 State legislature 12% 10% 9% 18% 13% 8% 11%
2 Panel of federal judges 35 40 36 27 39 38 32
1 Board of statewide elected officials 29 25 33 30 23 32 31
None / Don’t Know 24 25 22 25 25 22 26
Total = 329 129 146 123 83 57 236
Do you agree or disagree that a party in power should be able to intentionally draw
districts to favor one party?
Code Total Dem. Ind. Rep. Latino Black White
5 Strongly Agree 11% 16% 6% 10% 11% 9% 12%
4 Somewhat agree 11 13 6 12 13 11 9
3 Neither 24 18 29 26 28 27 22
2 Disagree 13 12 12 17 16 10 13
1 Strongly Disagree 41 41 47 35 32 43 44
Total = 1,093 338 373 382 278 151 609
To date, districts have been drawn based on a state’s total population. Should Texas create
equal population districts by counting all residents or by counting only citizens in the state?
Code Total Dem. Ind. Rep. Latino Black White
1 All residents 41% 66% 36% 24% 55% 51% 31%
0 Citizens 47 24 48 65 34 32 56
8 (Vol) Don’t Know 12 10 16 11 11 17 13
Total = 1,098 340 374 384 279 151 611
10
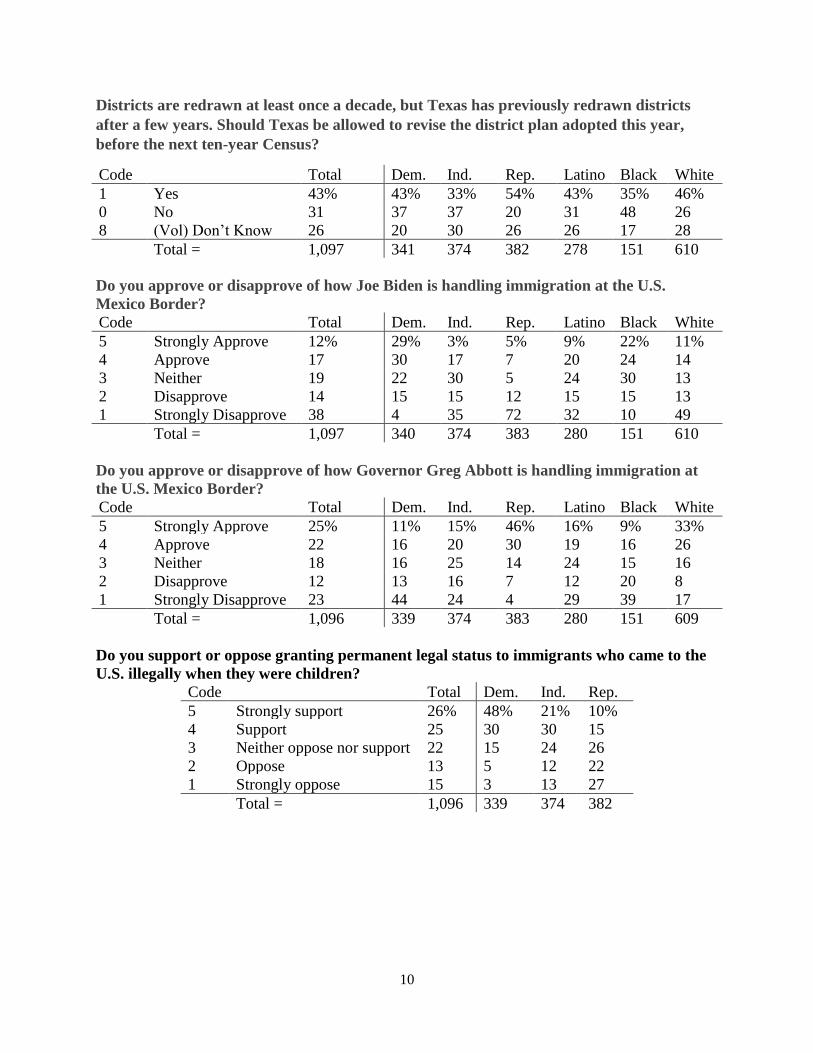
Districts are redrawn at least once a decade, but Texas has previously redrawn districts
after a few years. Should Texas be allowed to revise the district plan adopted this year,
before the next ten-year Census?
Code Total Dem. Ind. Rep. Latino Black White
1 Yes 43% 43% 33% 54% 43% 35% 46%
0 No 31 37 37 20 31 48 26
8 (Vol) Don’t Know 26 20 30 26 26 17 28
Total = 1,097 341 374 382 278 151 610
Do you approve or disapprove of how Joe Biden is handling immigration at the U.S.
Mexico Border?
Code Total Dem. Ind. Rep. Latino Black White
5 Strongly Approve 12% 29% 3% 5% 9% 22% 11%
4 Approve 17 30 17 7 20 24 14
3 Neither 19 22 30 5 24 30 13
2 Disapprove 14 15 15 12 15 15 13
1 Strongly Disapprove 38 4 35 72 32 10 49
Total = 1,097 340 374 383 280 151 610
Do you approve or disapprove of how Governor Greg Abbott is handling immigration at
the U.S. Mexico Border?
Code Total Dem. Ind. Rep. Latino Black White
5 Strongly Approve 25% 11% 15% 46% 16% 9% 33%
4 Approve 22 16 20 30 19 16 26
3 Neither 18 16 25 14 24 15 16
2 Disapprove 12 13 16 7 12 20 8
1 Strongly Disapprove 23 44 24 4 29 39 17
Total = 1,096 339 374 383 280 151 609
Do you support or oppose granting permanent legal status to immigrants who came to the
U.S. illegally when they were children?
Code Total Dem. Ind. Rep.
5 Strongly support 26% 48% 21% 10%
4 Support 25 30 30 15
3 Neither oppose nor support 22 15 24 26
2 Oppose 13 5 12 22
1 Strongly oppose 15 3 13 27
Total = 1,096 339 374 382
11
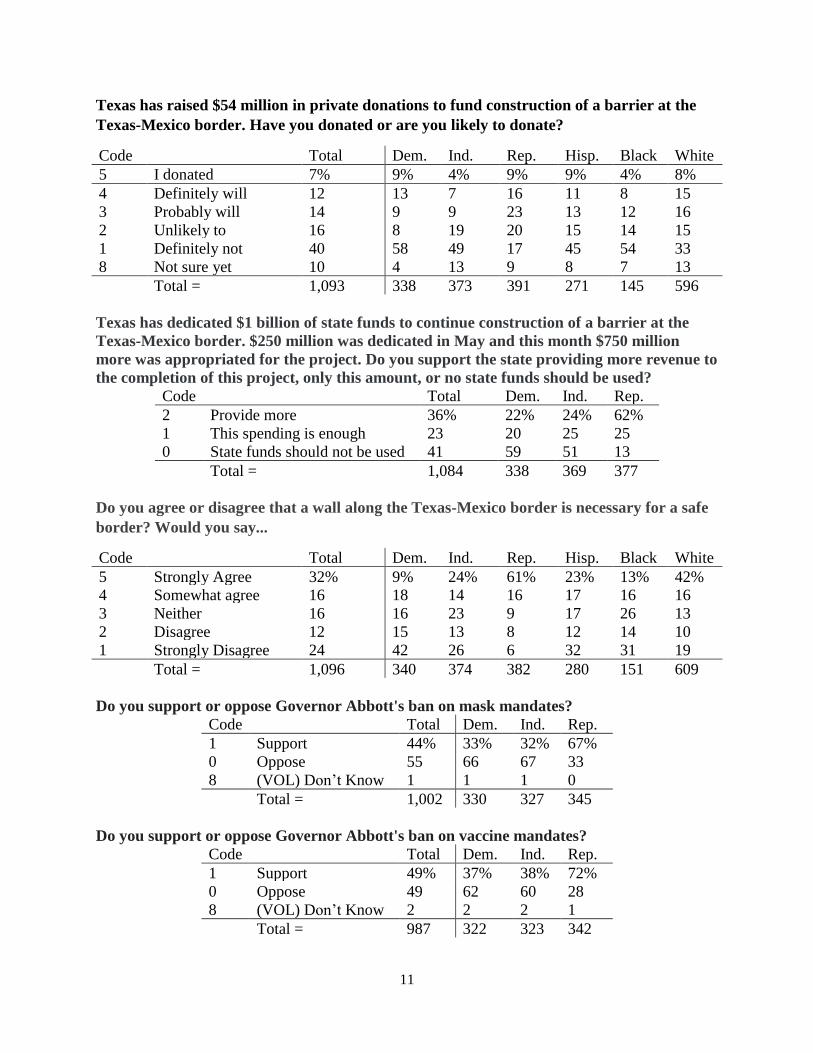
Texas has raised $54 million in private donations to fund construction of a barrier at the
Texas-Mexico border. Have you donated or are you likely to donate?
Code Total Dem. Ind. Rep. Hisp. Black White
5 I donated 7% 9% 4% 9% 9% 4% 8%
4 Definitely will 12 13 7 16 11 8 15
3 Probably will 14 9 9 23 13 12 16
2 Unlikely to 16 8 19 20 15 14 15
1 Definitely not 40 58 49 17 45 54 33
8 Not sure yet 10 4 13 9 8 7 13
Total = 1,093 338 373 391 271 145 596
Texas has dedicated $1 billion of state funds to continue construction of a barrier at the
Texas-Mexico border. $250 million was dedicated in May and this month $750 million
more was appropriated for the project. Do you support the state providing more revenue to
the completion of this project, only this amount, or no state funds should be used?
Code Total Dem. Ind. Rep.
2 Provide more 36% 22% 24% 62%
1 This spending is enough 23 20 25 25
0 State funds should not be used 41 59 51 13
Total = 1,084 338 369 377
Do you agree or disagree that a wall along the Texas-Mexico border is necessary for a safe
border? Would you say...
Code Total Dem. Ind. Rep. Hisp. Black White
5 Strongly Agree 32% 9% 24% 61% 23% 13% 42%
4 Somewhat agree 16 18 14 16 17 16 16
3 Neither 16 16 23 9 17 26 13
2 Disagree 12 15 13 8 12 14 10
1 Strongly Disagree 24 42 26 6 32 31 19
Total = 1,096 340 374 382 280 151 609
Do you support or oppose Governor Abbott's ban on mask mandates?
Code Total Dem. Ind. Rep.
1 Support 44% 33% 32% 67%
0 Oppose 55 66 67 33
8 (VOL) Don’t Know 1 1 1 0
Total = 1,002 330 327 345
Do you support or oppose Governor Abbott's ban on vaccine mandates?
Code Total Dem. Ind. Rep.
1 Support 49% 37% 38% 72%
0 Oppose 49 62 60 28
8 (VOL) Don’t Know 2 2 2 1
Total = 987 322 323 342
12
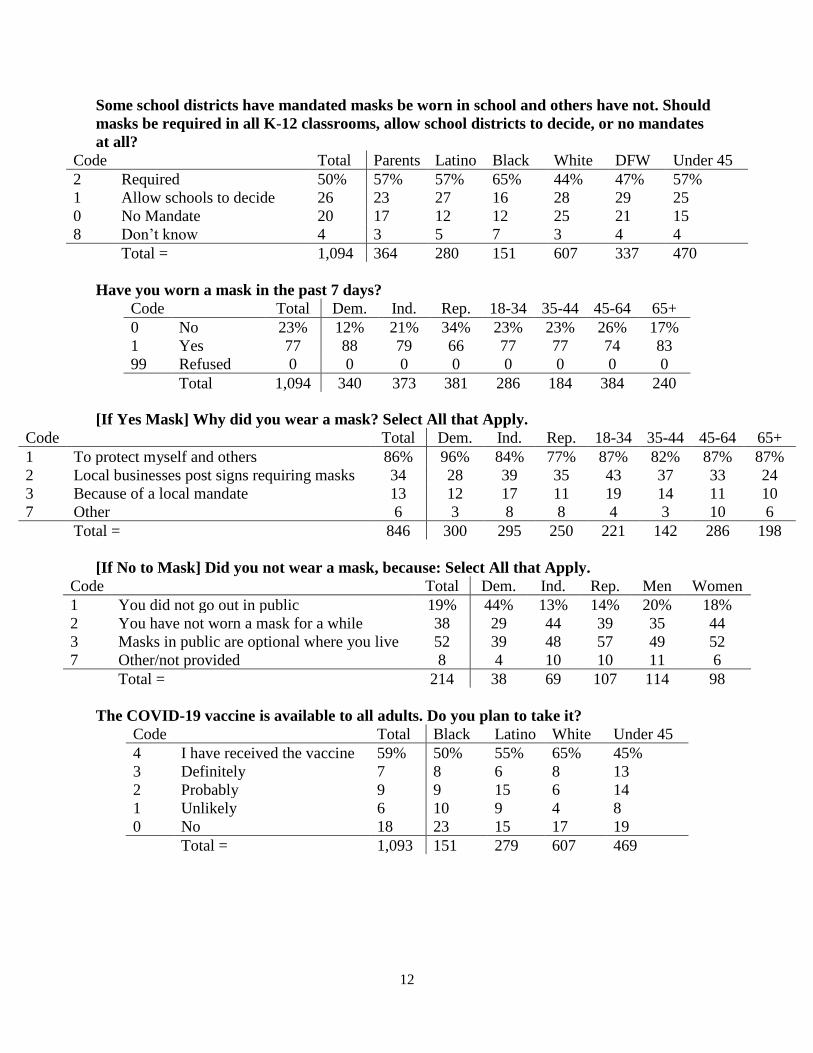
Some school districts have mandated masks be worn in school and others have not. Should
masks be required in all K-12 classrooms, allow school districts to decide, or no mandates
at all?
Code Total Parents Latino Black White DFW Under 45
2 Required 50% 57% 57% 65% 44% 47% 57%
1 Allow schools to decide 26 23 27 16 28 29 25
0 No Mandate 20 17 12 12 25 21 15
8 Don’t know 4 3 5 7 3 4 4
Total = 1,094 364 280 151 607 337 470
Have you worn a mask in the past 7 days?
Code Total Dem. Ind. Rep. 18-34 35-44 45-64 65+
0 No 23% 12% 21% 34% 23% 23% 26% 17%
1 Yes 77 88 79 66 77 77 74 83
99 Refused 0 0 0 0 0 0 0 0
Total 1,094 340 373 381 286 184 384 240
[If Yes Mask] Why did you wear a mask? Select All that Apply.
Code Total Dem. Ind. Rep. 18-34 35-44 45-64 65+
1 To protect myself and others 86% 96% 84% 77% 87% 82% 87% 87%
2 Local businesses post signs requiring masks 34 28 39 35 43 37 33 24
3 Because of a local mandate 13 12 17 11 19 14 11 10
7 Other 6 3 8 8 4 3 10 6
Total = 846 300 295 250 221 142 286 198
[If No to Mask] Did you not wear a mask, because: Select All that Apply.
Code Total Dem. Ind. Rep. Men Women
1 You did not go out in public 19% 44% 13% 14% 20% 18%
2 You have not worn a mask for a while 38 29 44 39 35 44
3 Masks in public are optional where you live 52 39 48 57 49 52
7 Other/not provided 8 4 10 10 11 6
Total = 214 38 69 107 114 98
The COVID-19 vaccine is available to all adults. Do you plan to take it?
Code Total Black Latino White Under 45
4 I have received the vaccine 59% 50% 55% 65% 45%
3 Definitely 7 8 6 8 13
2 Probably 9 9 15 6 14
1 Unlikely 6 10 9 4 8
0 No 18 23 15 17 19
Total = 1,093 151 279 607 469
13
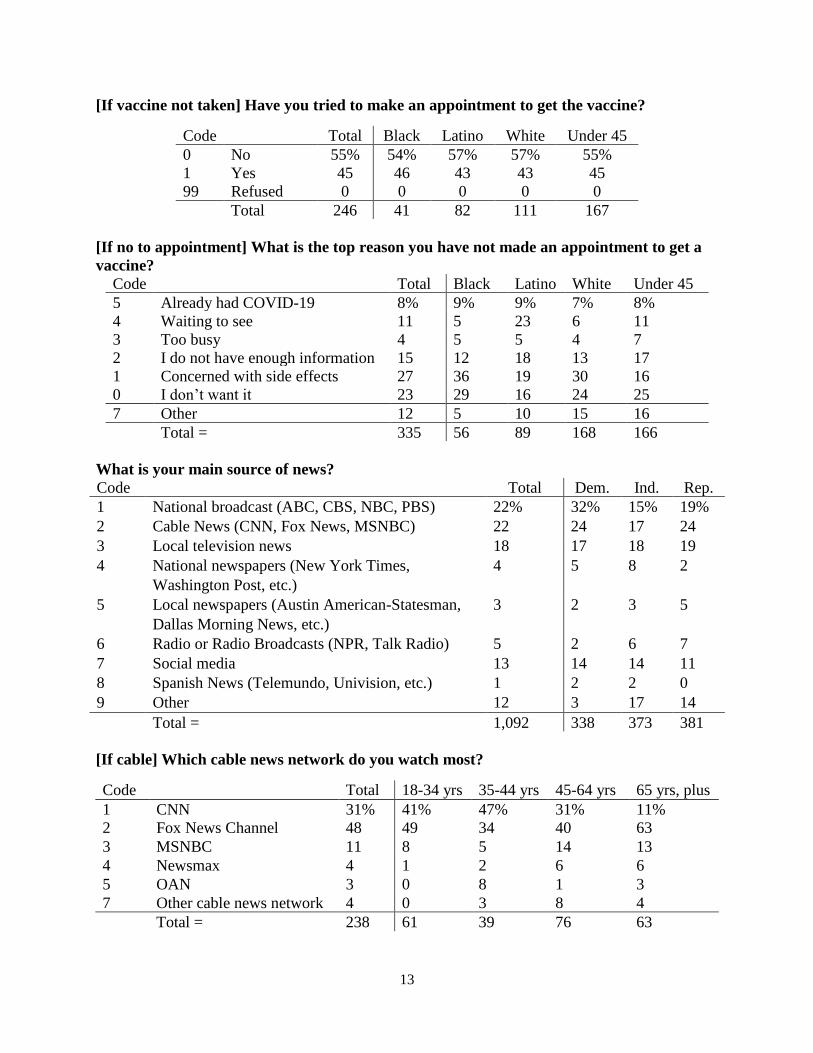
[If vaccine not taken] Have you tried to make an appointment to get the vaccine?
Code Total Black Latino White Under 45
0 No 55% 54% 57% 57% 55%
1 Yes 45 46 43 43 45
99 Refused 0 0 0 0 0
Total 246 41 82 111 167
[If no to appointment] What is the top reason you have not made an appointment to get a
vaccine?
Code Total Black Latino White Under 45
5 Already had COVID-19 8% 9% 9% 7% 8%
4 Waiting to see 11 5 23 6 11
3 Too busy 4 5 5 4 7
2 I do not have enough information 15 12 18 13 17
1 Concerned with side effects 27 36 19 30 16
0 I don’t want it 23 29 16 24 25
7 Other 12 5 10 15 16
Total = 335 56 89 168 166
What is your main source of news?
Code Total Dem. Ind. Rep.
1 National broadcast (ABC, CBS, NBC, PBS) 22% 32% 15% 19%
2 Cable News (CNN, Fox News, MSNBC) 22 24 17 24
3 Local television news 18 17 18 19
4 National newspapers (New York Times,
Washington Post, etc.)
4 5 8 2
5 Local newspapers (Austin American-Statesman,
Dallas Morning News, etc.)
3 2 3 5
6 Radio or Radio Broadcasts (NPR, Talk Radio) 5 2 6 7
7 Social media 13 14 14 11
8 Spanish News (Telemundo, Univision, etc.) 1 2 2 0
9 Other 12 3 17 14
Total = 1,092 338 373 381
[If cable] Which cable news network do you watch most?
Code Total 18-34 yrs 35-44 yrs 45-64 yrs 65 yrs, plus
1 CNN 31% 41% 47% 31% 11%
2 Fox News Channel 48 49 34 40 63
3 MSNBC 11 8 5 14 13
4 Newsmax 4 1 2 6 6
5 OAN 3 0 8 1 3
7 Other cable news network 4 0 3 8 4
Total = 238 61 39 76 63
14
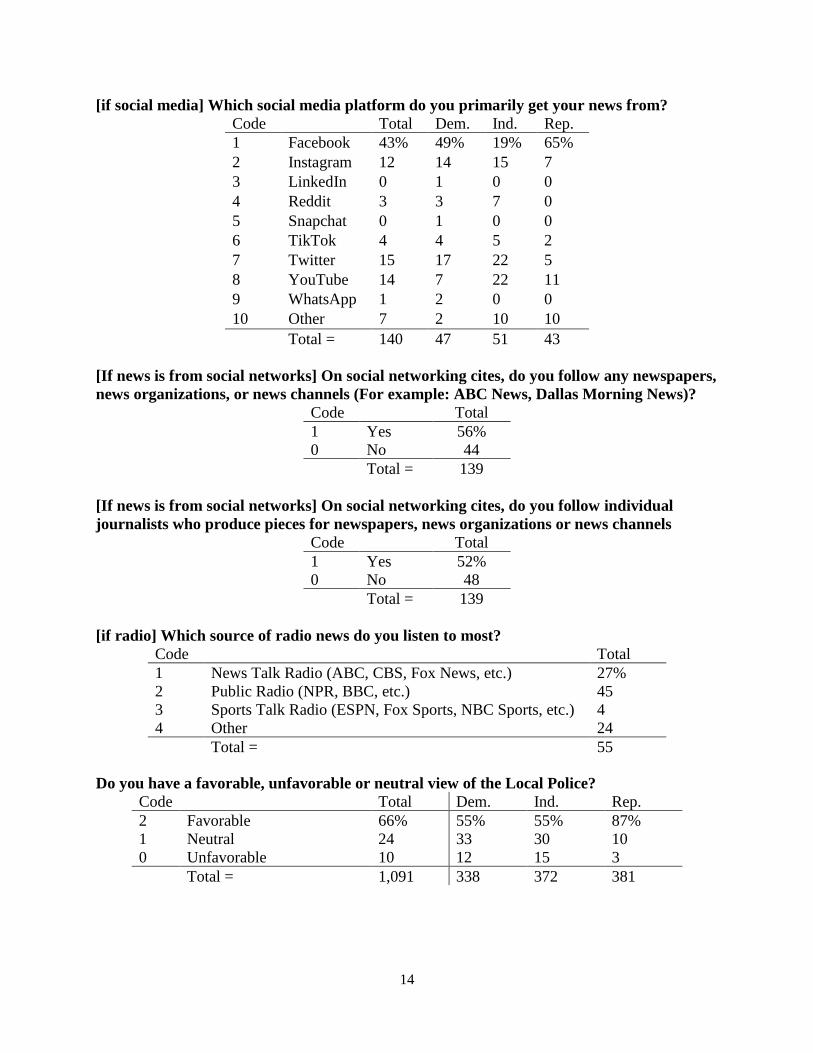
[if social media] Which social media platform do you primarily get your news from?
Code Total Dem. Ind. Rep.
1 Facebook 43% 49% 19% 65%
2 Instagram 12 14 15 7
3 LinkedIn 0 1 0 0
4 Reddit 3 3 7 0
5 Snapchat 0 1 0 0
6 TikTok 4 4 5 2
7 Twitter 15 17 22 5
8 YouTube 14 7 22 11
9 WhatsApp 1 2 0 0
10 Other 7 2 10 10
Total = 140 47 51 43
[If news is from social networks] On social networking cites, do you follow any newspapers,
news organizations, or news channels (For example: ABC News, Dallas Morning News)?
Code Total
1 Yes 56%
0 No 44
Total = 139
[If news is from social networks] On social networking cites, do you follow individual
journalists who produce pieces for newspapers, news organizations or news channels
Code Total
1 Yes 52%
0 No 48
Total = 139
[if radio] Which source of radio news do you listen to most?
Code Total
1 News Talk Radio (ABC, CBS, Fox News, etc.) 27%
2 Public Radio (NPR, BBC, etc.) 45
3 Sports Talk Radio (ESPN, Fox Sports, NBC Sports, etc.) 4
4 Other 24
Total = 55
Do you have a favorable, unfavorable or neutral view of the Local Police?
Code Total Dem. Ind. Rep.
2 Favorable 66% 55% 55% 87%
1 Neutral 24 33 30 10
0 Unfavorable 10 12 15 3
Total = 1,091 338 372 381
15
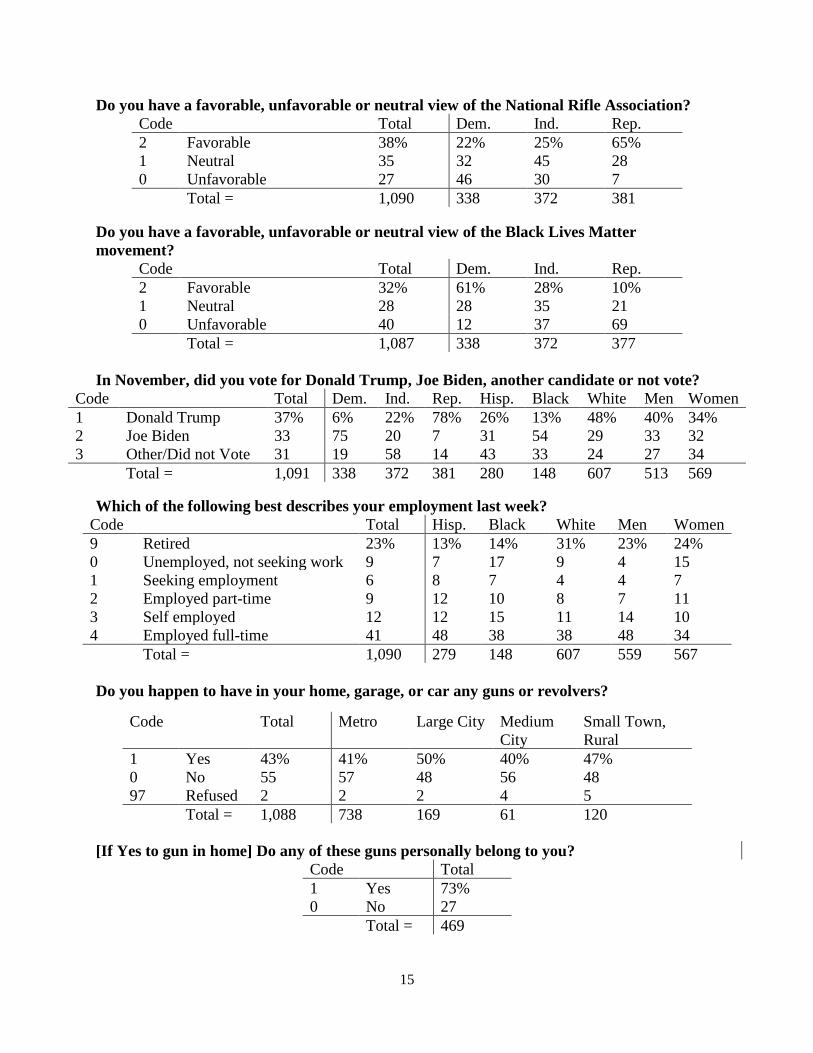
Do you have a favorable, unfavorable or neutral view of the National Rifle Association?
Code Total Dem. Ind. Rep.
2 Favorable 38% 22% 25% 65%
1 Neutral 35 32 45 28
0 Unfavorable 27 46 30 7
Total = 1,090 338 372 381
Do you have a favorable, unfavorable or neutral view of the Black Lives Matter
movement?
Code Total Dem. Ind. Rep.
2 Favorable 32% 61% 28% 10%
1 Neutral 28 28 35 21
0 Unfavorable 40 12 37 69
Total = 1,087 338 372 377
In November, did you vote for Donald Trump, Joe Biden, another candidate or not vote?
Code Total Dem. Ind. Rep. Hisp. Black White Men Women
1 Donald Trump 37% 6% 22% 78% 26% 13% 48% 40% 34%
2 Joe Biden 33 75 20 7 31 54 29 33 32
3 Other/Did not Vote 31 19 58 14 43 33 24 27 34
Total = 1,091 338 372 381 280 148 607 513 569
Which of the following best describes your employment last week?
Code Total Hisp. Black White Men Women
9 Retired 23% 13% 14% 31% 23% 24%
0 Unemployed, not seeking work 9 7 17 9 4 15
1 Seeking employment 6 8 7 4 4 7
2 Employed part-time 9 12 10 8 7 11
3 Self employed 12 12 15 11 14 10
4 Employed full-time 41 48 38 38 48 34
Total = 1,090 279 148 607 559 567
Do you happen to have in your home, garage, or car any guns or revolvers?
Code Total Metro Large City Medium
City
Small Town,
Rural
1 Yes 43% 41% 50% 40% 47%
0 No 55 57 48 56 48
97 Refused 2 2 2 4 5
Total = 1,088 738 169 61 120
[If Yes to gun in home] Do any of these guns personally belong to you?
Code Total
1 Yes 73%
0 No 27
Total = 469
16
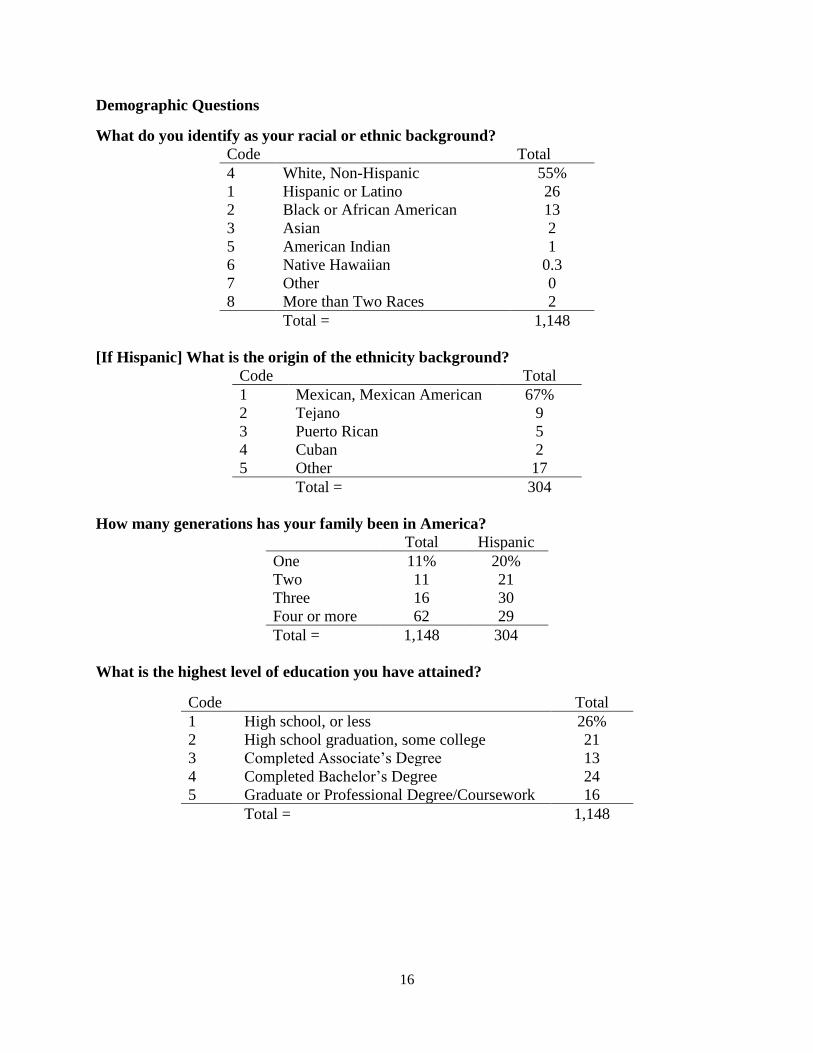
Demographic Questions
What do you identify as your racial or ethnic background?
Code Total
4 White, Non-Hispanic 55%
1 Hispanic or Latino 26
2 Black or African American 13
3 Asian 2
5 American Indian 1
6 Native Hawaiian 0.3
7 Other 0
8 More than Two Races 2
Total = 1,148
[If Hispanic] What is the origin of the ethnicity background?
Code Total
1 Mexican, Mexican American 67%
2 Tejano 9
3 Puerto Rican 5
4 Cuban 2
5 Other 17
Total = 304
How many generations has your family been in America?
Total Hispanic
One 11% 20%
Two 11 21
Three 16 30
Four or more 62 29
Total = 1,148 304
What is the highest level of education you have attained?
Code Total
1 High school, or less 26%
2 High school graduation, some college 21
3 Completed Associate’s Degree 13
4 Completed Bachelor’s Degree 24
5 Graduate or Professional Degree/Coursework 16
Total = 1,148
17
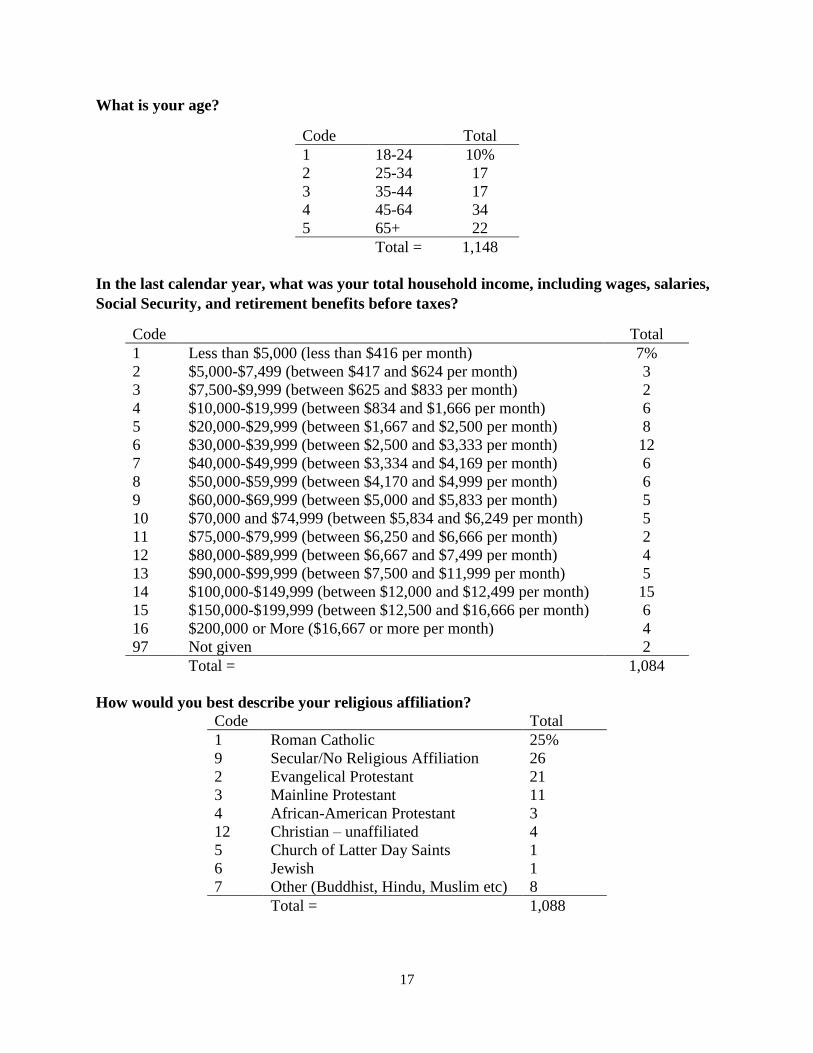
What is your age?
Code Total
1 18-24 10%
2 25-34 17
3 35-44 17
4 45-64 34
5 65+ 22
Total = 1,148
In the last calendar year, what was your total household income, including wages, salaries,
Social Security, and retirement benefits before taxes?
Code Total
1 Less than $5,000 (less than $416 per month) 7%
2 $5,000-$7,499 (between $417 and $624 per month) 3
3 $7,500-$9,999 (between $625 and $833 per month) 2
4 $10,000-$19,999 (between $834 and $1,666 per month) 6
5 $20,000-$29,999 (between $1,667 and $2,500 per month) 8
6 $30,000-$39,999 (between $2,500 and $3,333 per month) 12
7 $40,000-$49,999 (between $3,334 and $4,169 per month) 6
8 $50,000-$59,999 (between $4,170 and $4,999 per month) 6
9 $60,000-$69,999 (between $5,000 and $5,833 per month) 5
10 $70,000 and $74,999 (between $5,834 and $6,249 per month) 5
11 $75,000-$79,999 (between $6,250 and $6,666 per month) 2
12 $80,000-$89,999 (between $6,667 and $7,499 per month) 4
13 $90,000-$99,999 (between $7,500 and $11,999 per month) 5
14 $100,000-$149,999 (between $12,000 and $12,499 per month) 15
15 $150,000-$199,999 (between $12,500 and $16,666 per month) 6
16 $200,000 or More ($16,667 or more per month) 4
97 Not given 2
Total = 1,084
How would you best describe your religious affiliation?
Code Total
1 Roman Catholic 25%
9 Secular/No Religious Affiliation 26
2 Evangelical Protestant 21
3 Mainline Protestant 11
4 African-American Protestant 3
12 Christian – unaffiliated 4
5 Church of Latter Day Saints 1
6 Jewish 1
7 Other (Buddhist, Hindu, Muslim etc) 8
Total = 1,088
18
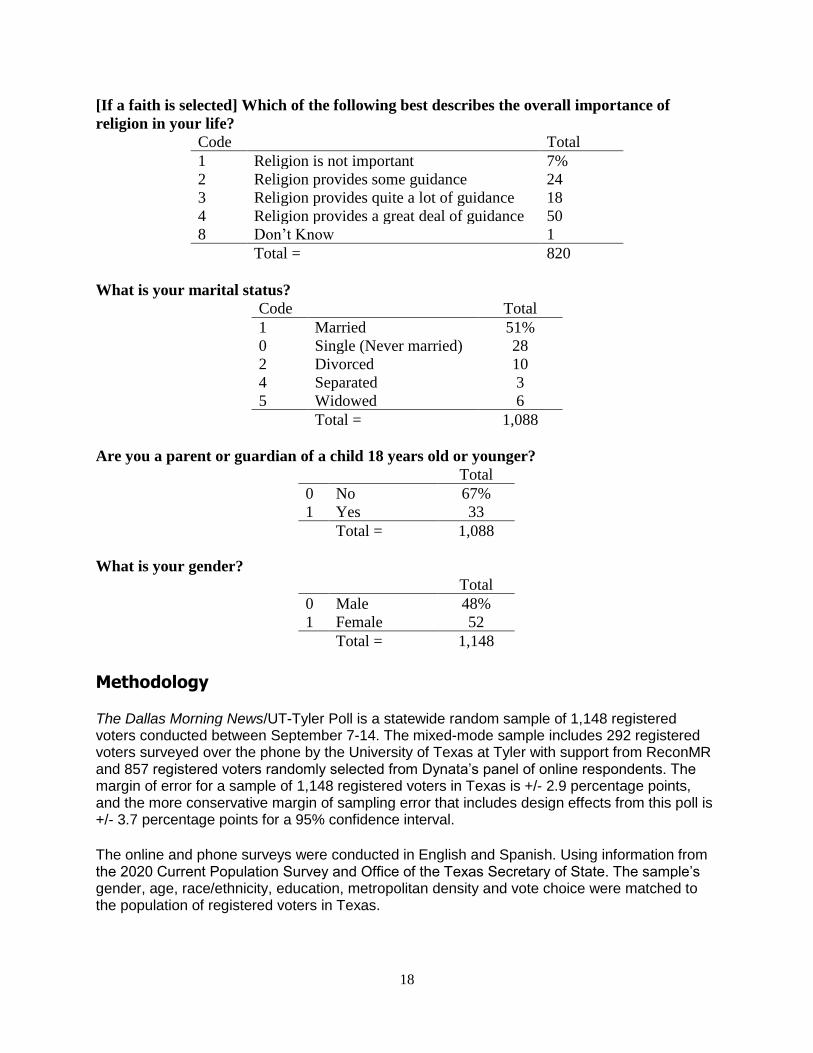
[If a faith is selected] Which of the following best describes the overall importance of
religion in your life?
Code Total
1 Religion is not important 7%
2 Religion provides some guidance 24
3 Religion provides quite a lot of guidance 18
4 Religion provides a great deal of guidance 50
8 Don’t Know 1
Total = 820
What is your marital status?
Code Total
1 Married 51%
0 Single (Never married) 28
2 Divorced 10
4 Separated 3
5 Widowed 6
Total = 1,088
Are you a parent or guardian of a child 18 years old or younger?
What is your gender?
Methodology The Dallas Morning News/UT-Tyler Poll is a statewide random sample of 1,148 registered voters conducted between September 7-14. The mixed-mode sample includes 292 registered voters surveyed over the phone by the University of Texas at Tyler with support from ReconMR and 857 registered voters randomly selected from Dynata’s panel of online respondents. The margin of error for a sample of 1,148 registered voters in Texas is +/- 2.9 percentage points, and the more conservative margin of sampling error that includes design effects from this poll is +/- 3.7 percentage points for a 95% confidence interval. The online and phone surveys were conducted in English and Spanish. Using information from the 2020 Current Population Survey and Office of the Texas Secretary of State. The sample’s gender, age, race/ethnicity, education, metropolitan density and vote choice were matched to the population of registered voters in Texas.
Total
0 No 67%
1 Yes 33
Total = 1,088
Total
0 Male 48%
1 Female 52
Total = 1,148

19
Visit http://www.uttyler.edu/politicalscience/pollingcenter for more information about our
current and previous studies.