Tempe Bike Count Report 2015 1 of 22 Tempe Bike Count Report 2015 By Clifford Anderson, Scott...
22
Page 1 of 22 Tempe Bike Count Report 2015 By Clifford Anderson, Scott Walters, Kim Gresham and William T. Terrance Tempe Bicycle Action Group Rev 2: 3/5/2017 1. Abstract In April the fifth annual city-wide bike count in Tempe was conducted as a way of understanding cycling habits and to identify routes and intersections that are problematic or dangerous. In total, 15,429 bicyclists were counted by 81 volunteers from a total of 53 different locations, with 15 locations counted for all 5 years from 2011 to 2015. Overall helmet use was 21%, wrong way riding was 17% and sidewalk riding was 38%. Helmet use and wrong way riding were fairly consistent between the four years of bike count data. Sidewalk riding percentage had more variability year-to-year. Helmet use was lower while wrong way and sidewalk riding were higher than values obtained for similar count data in Pima County, AZ (Tucson area).
Transcript of Tempe Bike Count Report 2015 1 of 22 Tempe Bike Count Report 2015 By Clifford Anderson, Scott...

Page 1 of 22
Tempe Bike Count Report
2015
By Clifford Anderson, Scott Walters, Kim Gresham and William T. Terrance
Tempe Bicycle Action Group Rev 2: 3/5/2017
1. Abstract In April the fifth annual city-wide bike count in Tempe was conducted as a way of understanding
cycling habits and to identify routes and intersections that are problematic or dangerous. In total, 15,429
bicyclists were counted by 81 volunteers from a total of 53 different locations, with 15 locations counted
for all 5 years from 2011 to 2015. Overall helmet use was 21%, wrong way riding was 17% and
sidewalk riding was 38%. Helmet use and wrong way riding were fairly consistent between the four
years of bike count data. Sidewalk riding percentage had more variability year-to-year. Helmet use was
lower while wrong way and sidewalk riding were higher than values obtained for similar count data in
Pima County, AZ (Tucson area).
Page 2 of 22
2. Introduction In 1974, the Planning Department of the City of Tempe released the comprehensive Tempe Bikeway
Plan, the first plan of its kind in Arizona. The Bikeway Plan aimed to “encourage use of the bicycle for
everyday transportation,” among other goals, as a way to decrease automobile traffic, reduce the
environmental impacts of transportation, and raise the quality of living in Tempe. Now, over forty years
later, Tempe has more than 175 miles of bikeways [1], was recently promoted to the gold-level League
of American Bicyclists ‘Bicycle Friendly Community’ [2] (first inducted 1997), and has the highest
percentage of residents who bike to work, at 4.2%, in the county [1]. The City of Tempe has a long-
standing commitment to encouraging bicycle and pedestrian travel [1], a goal shared by Tempe Bicycle
Action Group (T.B.A.G.). T.B.A.G. is a non-profit 501(c)(3) organization dedicated to advancing the
bicycle as a safe, efficient, and sustainable form of transportation [3]. Despite bicycling infrastructure
progress, collision data is still high, at 1107 pedalcyclist collisions over the 5-year period from 2010 to
2014 [4], [5].
This is the 5th
annual Tempe Bike Count Report [6]-[9]. On March 24th
, 25th
and 26th
, 2015, 81
volunteers observed a total of 15,429 cyclists at 53 intersections during morning (7-9 am) and evening
(4-6 pm) rush hours. The count of cyclists traveling through an imaginary cordon around the ASU-
Tempe campus was 691 per hour in-bound in the morning and 1122 per hour out-bound in the afternoon.
Besides a count, additional data was collected covering rider gender, helmet use, riding on the sidewalk,
and riding on the wrong side of the street (against traffic). In addition to these data, our analysis
considers vehicular traffic volume data by intersection made available by the City of Tempe [10]. The
Tempe bike count method was modeled in part after a similar program by the Pima Association of
Governments (PAG) [11]-[14]. Other recent reports on bicycle transportation include those from
Maricopa Association of Governments [15], [16] and a Bike Network Connectivity Study for SRP [17].
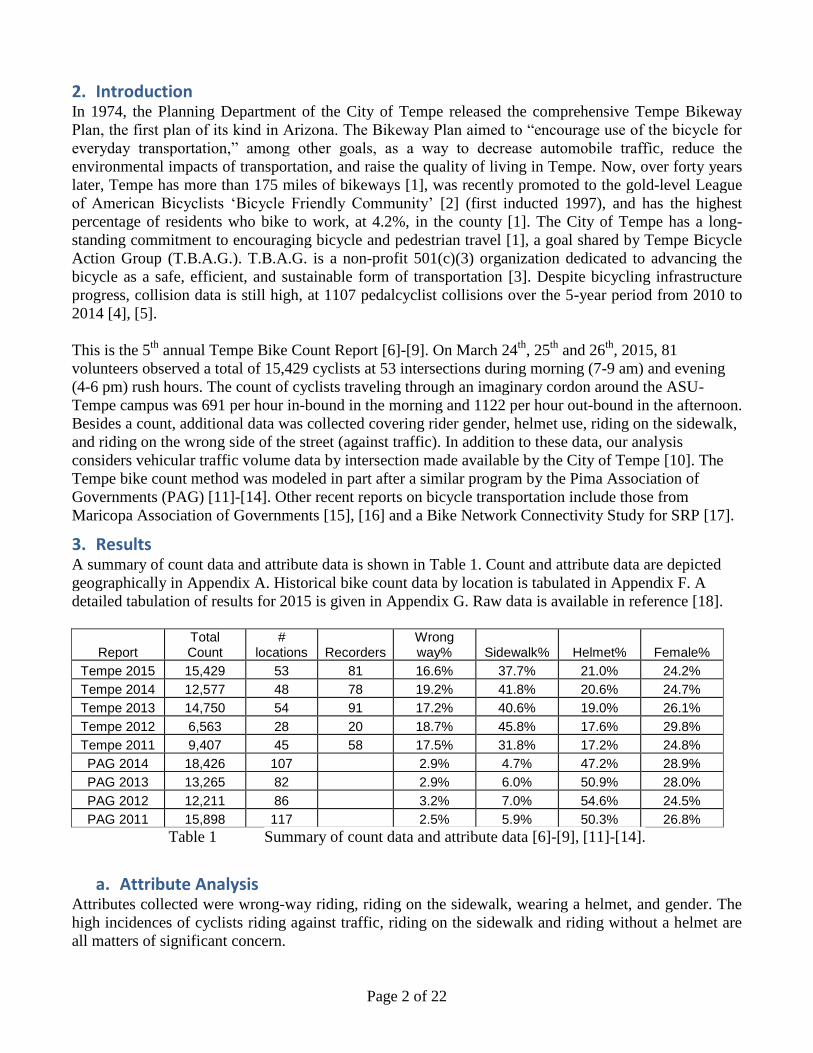
3. Results A summary of count data and attribute data is shown in Table 1. Count and attribute data are depicted
geographically in Appendix A. Historical bike count data by location is tabulated in Appendix F. A
detailed tabulation of results for 2015 is given in Appendix G. Raw data is available in reference [18].
Report Total Count
# locations Recorders
Wrong way% Sidewalk% Helmet% Female%
Tempe 2015 15,429 53 81 16.6% 37.7% 21.0% 24.2%
Tempe 2014 12,577 48 78 19.2% 41.8% 20.6% 24.7%
Tempe 2013 14,750 54 91 17.2% 40.6% 19.0% 26.1%
Tempe 2012 6,563 28 20 18.7% 45.8% 17.6% 29.8%
Tempe 2011 9,407 45 58 17.5% 31.8% 17.2% 24.8%
PAG 2014 18,426 107
2.9% 4.7% 47.2% 28.9%
PAG 2013 13,265 82
2.9% 6.0% 50.9% 28.0%
PAG 2012 12,211 86
3.2% 7.0% 54.6% 24.5%
PAG 2011 15,898 117
2.5% 5.9% 50.3% 26.8%
Table 1 Summary of count data and attribute data [6]-[9], [11]-[14].
a. Attribute Analysis Attributes collected were wrong-way riding, riding on the sidewalk, wearing a helmet, and gender. The
high incidences of cyclists riding against traffic, riding on the sidewalk and riding without a helmet are
all matters of significant concern.

Page 3 of 22
The 20 intersections with the highest fraction of wrong-way riding are shown in Figure 1. In all, there
were 13 intersections at which 25% or more of the cyclists observed were riding the wrong direction.
ARS §28-812 concerns applicability of traffic laws to bicycle riders. Riding on the wrong side is
dangerous, as motorists often do not anticipate or look for wrong-way traffic. While some of the
intersections with high wrong-way riding lack a dedicated bike lane in the problem direction, many,
such as several along University Drive in the ASU area, do have bike lanes.
Sidewalk riding had even higher percentages. Six intersections had greater than 90% sidewalk riding.
The 20 intersections with the highest fraction of sidewalk riding are shown in Figure 2. In all, 37
intersections out of 53 had 25% or more of the cyclists riding on the sidewalk. Tempe City Code sec. 7-
52 concerns riding on sidewalks or bicycle lanes. Sidewalk riding can create a hazard for pedestrians
and it can create conflicts between motorists and cyclists, as motorists often do not anticipate relatively
fast-moving traffic on sidewalks. This is especially true when the sidewalk traffic is moving opposite of
street traffic.
Overall helmet use was 21%. This is substantially lower than that observed in the count by Pima
Association of Government (PAG) of roughly 50% [14]. Wrong way riding was 17% and sidewalk
riding was 38%, both substantially higher than the PAG count (3% and 5% respectively). Wrong-way
riding was counted for both on-street and on-sidewalk riding. The calculation of overall attribute
percentages was weighted according to the total count for each intersection/direction.
Figure 1 Top 20 locations by percentage of wrong-way riders, by intersection (directions
combined)

Page 4 of 22
Figure 2 Top 20 locations by percentage of cyclists on sidewalk, by intersection (directions
combined).
b. Correlation Analysis Both sidewalk riding and wrong way riding are positively correlated with vehicular traffic volume as
shown in Figure 3 and Figure 4. That is, the higher the volume of vehicular traffic in a particular
direction, the higher the incidence of both riding on the sidewalk and riding against traffic. These
correlations indicate the need to recognize the effect of traffic volume on cyclist riding behavior.
Figure 3 Correlation between sidewalk riding % and vehicular traffic count (24 hour period), E/W
and N/S directions separated. R2 = 0.57.

Page 5 of 22
Figure 4 Correlation between wrong way riding % and vehicular traffic count (24 hour period),
E/W and N/S directions separated. R2 = 0.46.
With regard to collision data analysis, the reader is referred to Tempe Bike Count Report 2014 [9],
section 3b, Figure 5 and Appendix B of that report.
The plot in Figure 5 shows that the highest bicycle usage areas are adjacent to the ASU campus.
Figure 5 Relationship between cyclist count per hour and distance to ASU (miles).
c. Error Detection Error detection methods were applied to the collected data. The detailed procedure is provided in
Appendix A. Errors were detected by visual inspection and numerically as attribute count exceeding the
bike count for a specific time and direction. Six recording sessions (pairs of count sheets) were thrown
out due to anomalies such as high numerical error count or significant missing data. Of the remaining

Page 6 of 22
data, there were 14 transcription errors and 10 recording errors detected numerically, and subsequently
corrected, out of 3616 data rows (where “row” is a 15-minute time block containing count and attribute
data). A recording error occurs at the time of the count; a transcription error occurs when converting
handwritten marks to numbers in a database. Corrections to transcriptions are straight forward and
simply involves checking the count sheets. Corrections to recording data errors can be estimated by
inferring that either a bike count mark was missed or a false mark was applied to the attribute column.
Most of the recording corrections applied here resulted in an increase of 1 count for the given time
segment. As a result of these estimated corrections, the total bicycle count increased by 7. Based on the
low percentage of errors for included sessions, the counting procedure appears to be sound. While the
detection of errors may indicate problems in the data collection methodology, it does not imply the
results are less accurate than comparable count data analysis results in other cities. The fact that error
detection methods were applied to detect questionable data improves the final data analysis accuracy. In
addition, some data fields indicated wrong way and/or sidewalk riding for intersection approaches where
motor vehicles are not allowed and wrong way riding is not applicable. These were corrected by nulling
the sidewalk and wrong way riding in the appropriate direction since these data contradict the intent of
the statistic to represent bad behavior.
4. Recommendations The City of Tempe has made great strides in developing the city as a bicycle-friendly community. This
bike count indicates that there is still work to do to improve bicycle safety both in terms of infrastructure
improvement (bicycle lanes and paths) and education. In particular, we recommend that the city look at
bike lanes on routes that are popular with cyclists. Sidewalk riding is a concern relating to car-bike
collisions, especially when the bike is going the wrong way on the sidewalk. T.B.A.G. continues to work
with the city on plans to improve roads, to add bike lanes, and to work on educational and enforcement
campaigns.
5. References [1] Tempe Transportation Master Plan (Jan 2015),
http://www.tempe.gov/home/showdocument?id=30317.
[2] Tempe, AZ Bicycle Friendly Community. The League of American Bicyclists, Fall, 2015.
http://www.bikeleague.org/sites/default/files/bfareportcards/BFC_Fall_2015_ReportCard_Tempe_A
Z.pdf
[3] Tempe Bicycle Action Group (T.B.A.G.), www.biketempe.org.
[4] Tempe Traffic Collisions. Arizona Bike Law, Dec 11, 2015. http://azbikelaw.org/tempe-traffic-
collisions/.
[5] ADOT traffic collision database, http://azbikelaw.org/blog/adot-traffic-collision-database/
http://azbikelaw.org/blog/arizona-crash-facts-2013/
[6] 2011 Tempe Bike Count Report, http://www.biketempe.org/wp-content/uploads/2011/12/Tempe-
Bike-Count-2011-Final-Report1.pdf.
[7] Tempe Bike Count Report 2012, http://www.biketempe.org/wp-
content/uploads/2013/01/Tempe_Bike_Count_Report_2012.pdf.
[8] Tempe Bike Count Report 2013, http://www.biketempe.org/wp-
content/uploads/2014/04/Tempe_Bike_Count_Report_2013.pdf.
[9] Tempe Bike Count Report 2014, http://www.biketempe.org/dls/Tempe_Bike_Count_Report_2014.pdf
[10] Traffic count data from the City of Tempe. http://www.tempe.gov/city-hall/public-
works/transportation/traffic-counts-.
[11] 2011 Regional Bicycle/Pedestrian Count Summary,
http://www.pagnet.org/documents/bicycle/2011RegionalBicycleCountReport.pdf.

Page 7 of 22
[12] 2012 Regional Bicycle and Pedestrian Count Summary Report,
http://www.pagnet.org/documents/bicycle/2012RegionalBicycleCountReport.pdf.
[13] 2013 Regional Bicycle and Pedestrian Count Summary Report,
http://www.pagnet.org/documents/bicycle/2013RegionalBicycleCountReport.pdf.
[14] 2014 Regional Bicycle and Pedestrian Count Summary Report,
http://www.pagnet.org/documents/bicycle/2014RegionalBicyclePedestrianCountReport.pdf.
[15] MAG Bicycles Count: Final Report and Implementation Plan,
https://www.azmag.gov/Documents/BaP_2014-08-21_FINAL-MAG-Bicycle-Count-Data-
Summary-Report.pdf
[16] MAG Bicycle Count Data Summary Presentation,
https://www.azmag.gov/Documents/BaP_2014-05-21_MAG-Bicycle-Count-Data-Summary-
Presentation.pdf.
[17] Bike Network Connectivity Study for SRP Service Area,
http://www.public.asu.edu/~mikekuby/BikeNetworkConnectivity/.
[18] Raw data for Tempe Bike Count: https://github.com/biketempe/DataAnalysis.
Acknowledgements Tempe Bike Count 2015 was a concerted effort by a diverse team representing a wide cross-section of
the bicycle-interest community. Many thanks go out to the volunteers who contributed their time to
recording data and other areas of this effort.
Bike count coordinator:
Scott Walters, T.B.A.G.
Other bike count contributors:
Jenn Guzy, T.B.A.G.
Count recorders:
81 count volunteers
REVISION HISTORY
Revision Description Date
1 Initial 3/24/2015
2 Correction to data for LocID 102,113,115,116,129,133,146 & Fig 1,2,6,7, Tab 1,
App A,B, F relating to algorithm for handling duplicate counts . “15 locations
counted for all 4 years” was 21. Cordon out-bound 1122 was 549. Ignore wrong
way and sidewalk riding for intersection approaches where motor vehicles are
not allowed and wrong way riding is not applicable.
3/5/2017

Page 8 of 22
Appendix A Geographical Presentation of Statistics
Figure A1. Total Bicycle Count per Hour

Page 9 of 22
Figure A2. Percent of Wrong Way Riders

Page 10 of 22
Figure A3. Percent of Riders Using Sidewalk

Page 11 of 22
Figure A4. Percent of Riders Wearing Helmets

Page 12 of 22
Appendix B Methodology Locations and times for collecting data were selected based on the following characteristics:
a. High anticipated bicycle count
b. Intersections
c. Recent or planned infrastructure improvements
d. High incidence of bicycle collisions
e. Establishment of cordon around (traffic in and out of) ASU
f. Coverage of a representative sample of the City of Tempe
g. Practicality of volunteer participation
h. Historical count location
i. Stakeholder recommendations (e.g., City of Tempe)
The total number of intersections in the initial plan was capped at about 50, but was limited practically
by volunteer participation.
The cordon for ASU was defined as follows:
West border: Mill Ave
South border: Apache Blvd
East border: Rural Rd
North border: Rio Salado Pkwy
The time periods 7-9am and 4-6pm were chosen to be consistent with prior years and to include the
morning and afternoon peak time periods while also allowing volunteers to participate with minimal
interference with their normal work schedules. Tuesday, Wednesday and Thursday were selected to be
consistent with prior years’ counts, and are anticipated to be the highest volume days of the week and
roughly equivalent to each other. Volunteers were allowed to select, at will, any one of the three days for
data collection. The data collection worksheet consisted of 15 minute bins.
The set of instructions conveyed to recorders is shown in Appendix D. Training sessions were held and
made available to all recorders.
Bicycle count data was collected for each of the directions (typically 4) of each intersection. For
analysis, two statistics reported are a) the sum of all directions; and b) the sum of the two opposite
direction counts, e.g., E/W = sum of east, west.
Total count per hour is calculated as the sum of the A.M. and P.M. sessions (4 hours total) divided 4, or
if data is available only for A.M. or P.M., then the total for 2 hours is divided by 2. In the unusual event
of duplicate valid counts, the counts are averaged so that total count per hour is consistent. Note that
because of the difference between AM and PM count averages as shown in Figure B1, averages reported
that consist of only AM or only PM are potentially skewed. This should be taken into account when
comparing data between years.
Error detection methods were applied to the collected data. For each cyclist observed, instructions
required that one notation be recorded in the count column, with attribute data recorded in addition in
each respective column as applicable. Therefore, for a given 15 minute bin, if the sum of notations for
any one attribute exceeds the count column total, an error has occurred. Possible causes for errors
include:
a. accidental double-counting in the attribute column
b. accidental uncounted data in the count column

Page 13 of 22
c. improper procedure followed
d. data translation error from hand-written sheets to database
Time of day for the manual count was consistent with prior Tempe counts. It is intended to capture the
peak morning and afternoon “rush hour” bicycle traffic, while accommodating work schedules of
prospective volunteers. Average bike count per hour vs. time of day, as shown in Figure B1, peaked for
the AM counts at the end of the morning shift (8:45 to 9:00 am). For the PM counts, relative peaks
occurred for the 4:15-4:30 and 5:45-6:00PM segments. PM counts were higher than AM, on average.
Since these are averages over all locations, it is possible that some areas exhibited peak ridership at other
times. The data was likely influenced by class schedule at ASU.
Figure B1. Average bike count per hour vs. time of day
Traffic count was obtained from City of Tempe data [10][14]. This data represents vehicular traffic flow
over a 24-hour period in the two opposite directions (e.g., east and west, or north and south). The
locations are generally not at intersections. Vehicular data has been collected over a number of years,
but the locations change somewhat from year to year. The following method was used to interpret
vehicular traffic data for the purpose of this study:
The most recent data for each sampling location was used.
For the two sides of a given intersection/direction (east/west or north/south), the larger of the two
values was used. If data was available for only one side, that value was used.

Page 14 of 22
Appendix C - Bike Count Form

Page 15 of 22
Appendix D - Bike Count Instructions 1. Count Form Structure.
a. 1 hr: each form tracks 1 full hr of activity, broken into 15 minute increments. b. Total # of Cyclists recorded in “Count” Column. Attributes broken out in following
columns. 2. Fill In: - Important please include the following info on each tracking sheet.
a. Your Name (cell#) b. Location ID# & Location (Intersection) – this info was sent to you in your volunteer
confirmation email. c. Hour (i.e. 4-5pm) – please record hr in far left column d. Total Hrs (bottom left) = total amount of time you were able to stay & count that
location (i.e. 1.5 hrs or 2hrs) e. Page # (example: 1 of 2 – etc.)
3. Count Shifts (2 hr) – you will need at least 2 count sheets per shift. Busier locations may require more sheets. Extra count sheets will be available.
AM Rush hour: 7-9am
PM Rush hour: 4-6pm 4. Priority 1: Count (Bikes) 5. Columns “Count” = Total # Cyclists
a. Approach Direction (NB, SB, EB, WB): Record the approach direction (northbound, southbound –etc.)
b. note: turn direction is not recorded c. Intervals – the data is recorded in 15 minute intervals.
6. Priority 2: Record Attributes once you’ve marked the cyclists (or pedestrian) then break out the attributes a well as you can.
7. Cyclist Attributes: ** Default = Male without Helmet ** a. Approach Direction (NB, EB, WB, SB) b. Gender: Male is assumed * Mark if cyclist Female c. Helmet (No Helmet is assumed) - Mark if the cyclist is wearing a Helmet d. Wrong-Way Riding - cycling against traffic e. Sidewalk Riding – does not include quick transitions at intersections or parking lots
etc. 8. Special cases
a. if there are multiple riders on a bike (tandem, child carrier or trailer, riding on BMX pegs, etc), each person gets counted
b. Mopeds and e-bikes operating under peddle power are included in the count Notes:
Count sheets with pre-filled shift (location, hour, am/pm, intersection, location id) and counter's name were given to most new counters (those attending a training session), starting 2015.

Page 16 of 22
Appendix E – Additional Graphs

Page 17 of 22
Appendix F – Historical Bike Count Data
Loc ID
Location or Intersection: E/W
Location or Intersection: N/S
2011 Total per hr
2012 Total per hr
2013 Total per hr
2014 Total per hr
2015 Total per hr
101 Washington/Curry Mill Ave 35 45 29 48
102 Rio Salado Pkwy Mill Ave 47 68 64 60
103 Rio Salado Pkwy Rural Rd 48 44 70 61 57
104 Rio Salado Pkwy McClintock Dr 39 19 21 30 26
105 Rio Salado Pkwy Hardy Dr 8 19
106 5th St Mill Ave 118 91 111 101 112
107 5th St Forest Ave 48 67
108 5th St Farmer Ave 79 78 107
109 5th St Hardy Dr 32 59
110 5th St Priest Dr 18 17 20 20
111 10th St Mill Ave 138 136 113 124
112 Superstition Fwy College Ave 33 28 38 28 36
113 13th St Mill Ave 49 32 56 53 58
114 13th St Hardy Dr 50 40 43
115 University Dr College Ave 452 174 220 216 310
116 University Dr Dorsey Ln 66 62 73 88
117 University Dr Rural Rd 116 181 143 145 197
118 University Dr Mill Ave 93 117 123 141 154
119 University Dr Ash Ave 88 61 95 96 92
120 University Dr Roosevelt St 46 51 55 53 68
121 University Dr Hardy Dr 62 35 47 57 36
122 McKellips Rd Greenbelt Path 42 41 43 44 47
123 Western Canal Rural Rd 45 62 41 40
124 Western Canal McClintock Dr 38 38 38
125 Western Canal Lakeshore Dr 86 43 55
126 Baseline Rd Western Canal 25 38 37 25
127 Elliot Rd McClintock Dr 10 13
128 Alameda Dr McClintock Dr 22 24 18 31
129 Alameda Dr Rural Rd 60 64 50
130 Alameda Dr Country Club Wy 12 21
131 Apache Blvd Rural Rd 191 146 180 184
132 Apache Blvd S Dorsey Ln 38 64 66 66
133 Apache Blvd College Ave 233 164 243 220
134 Apache Blvd Paseo Del Saber 121 102 182 233
135 Lemon St Rural Rd 151 149 168 177
136 Spence St Rural Rd 92 135 170
137 Broadway Rd Priest Dr 16 23 17
138 Broadway Rd Rural Rd 65 93 72 73
139 Broadway Rd College Ave 105 135 150 152
140 Southern Ave Priest Dr 19 27
141 Southern Ave College Ave 70 62 66 72
142 Southern Ave Rural Rd 33 43 41
143 Southern Ave Hardy Dr 25 23 24 31 22
144 Southern Ave Mill Ave 48 48 41 40 38
145 Alameda Dr Mill Ave 30 24 21 22 20

Page 18 of 22
146 Broadway Rd Mill Ave 37 36 27 34
147 Baseline Rd Mill Ave 17 27 16 21
148 Guadalupe Rd Kyrene Rd 27
149 Guadalupe Rd Country Club Wy 12 18
150 Guadalupe Rd Lakeshore Dr 23 23
151 University Dr Forest Ave 130 90 128
152 Tempe Lake S. TCA Bridge 36 43 18 47
153 Apache Blvd McAllister Ave
154 Terrace Rd Rural Rd 195
155 University Dr McClintock Dr 56 67 68
156 Crosscut Canal Mill Ave 36 18
157 Curry Rd College Ave 27 27
158 Washington St Priest Dr 33
159 Broadway Rd McClintock Dr 32 41
160 Broadway Rd Hardy Dr 24 20
161 University Dr Price Rd 25 28
162 Broadway Rd Roosevelt St 20 20
163 University Dr Farmer Ave 60 64
164 Southern Ave McClintock Dr 34 29
165 University Dr Priest Dr 26 21
166 8th St Dorsey Ln 56
167 Town Lake Path S Priest Dr 17
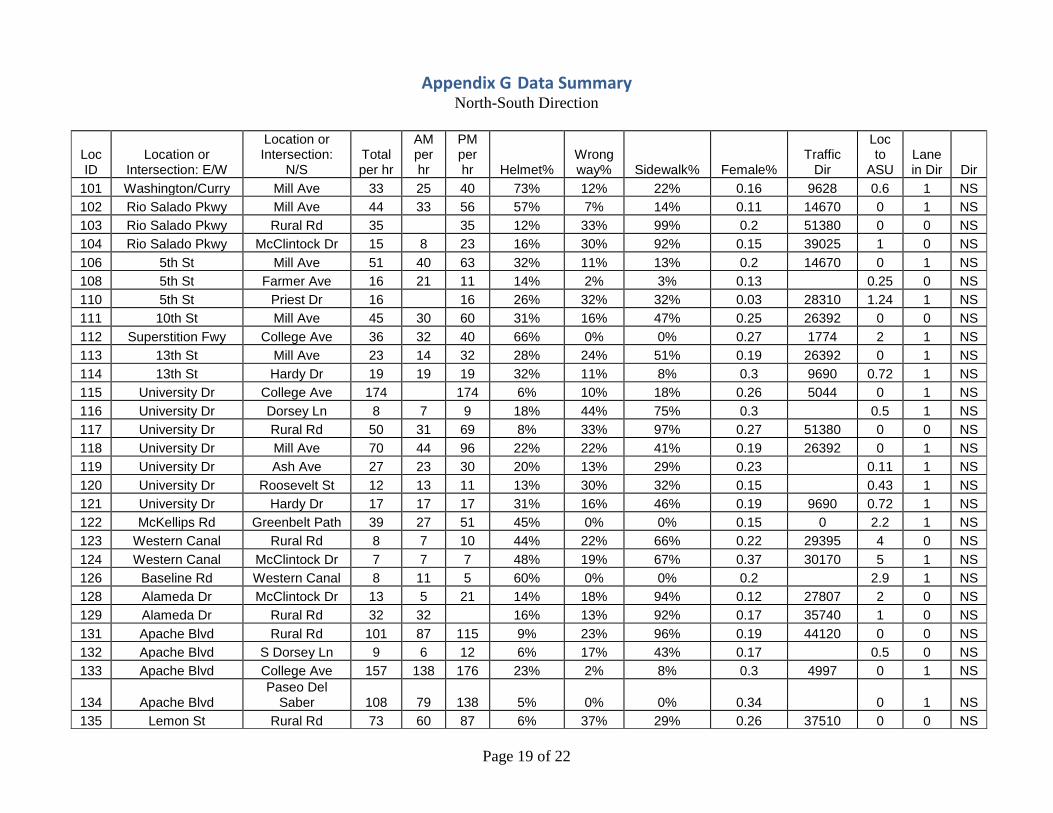
Page 19 of 22
Appendix G Data Summary North-South Direction
Loc ID
Location or Intersection: E/W
Location or Intersection:
N/S Total per hr
AM per hr
PM per hr Helmet%
Wrong way% Sidewalk% Female%
Traffic Dir
Loc to
ASU Lane in Dir Dir
101 Washington/Curry Mill Ave 33 25 40 73% 12% 22% 0.16 9628 0.6 1 NS
102 Rio Salado Pkwy Mill Ave 44 33 56 57% 7% 14% 0.11 14670 0 1 NS
103 Rio Salado Pkwy Rural Rd 35 35 12% 33% 99% 0.2 51380 0 0 NS
104 Rio Salado Pkwy McClintock Dr 15 8 23 16% 30% 92% 0.15 39025 1 0 NS
106 5th St Mill Ave 51 40 63 32% 11% 13% 0.2 14670 0 1 NS
108 5th St Farmer Ave 16 21 11 14% 2% 3% 0.13 0.25 0 NS
110 5th St Priest Dr 16 16 26% 32% 32% 0.03 28310 1.24 1 NS
111 10th St Mill Ave 45 30 60 31% 16% 47% 0.25 26392 0 0 NS
112 Superstition Fwy College Ave 36 32 40 66% 0% 0% 0.27 1774 2 1 NS
113 13th St Mill Ave 23 14 32 28% 24% 51% 0.19 26392 0 1 NS
114 13th St Hardy Dr 19 19 19 32% 11% 8% 0.3 9690 0.72 1 NS
115 University Dr College Ave 174 174 6% 10% 18% 0.26 5044 0 1 NS
116 University Dr Dorsey Ln 8 7 9 18% 44% 75% 0.3 0.5 1 NS
117 University Dr Rural Rd 50 31 69 8% 33% 97% 0.27 51380 0 0 NS
118 University Dr Mill Ave 70 44 96 22% 22% 41% 0.19 26392 0 1 NS
119 University Dr Ash Ave 27 23 30 20% 13% 29% 0.23 0.11 1 NS
120 University Dr Roosevelt St 12 13 11 13% 30% 32% 0.15 0.43 1 NS
121 University Dr Hardy Dr 17 17 17 31% 16% 46% 0.19 9690 0.72 1 NS
122 McKellips Rd Greenbelt Path 39 27 51 45% 0% 0% 0.15 0 2.2 1 NS
123 Western Canal Rural Rd 8 7 10 44% 22% 66% 0.22 29395 4 0 NS
124 Western Canal McClintock Dr 7 7 7 48% 19% 67% 0.37 30170 5 1 NS
126 Baseline Rd Western Canal 8 11 5 60% 0% 0% 0.2 2.9 1 NS
128 Alameda Dr McClintock Dr 13 5 21 14% 18% 94% 0.12 27807 2 0 NS
129 Alameda Dr Rural Rd 32 32 16% 13% 92% 0.17 35740 1 0 NS
131 Apache Blvd Rural Rd 101 87 115 9% 23% 96% 0.19 44120 0 0 NS
132 Apache Blvd S Dorsey Ln 9 6 12 6% 17% 43% 0.17 0.5 0 NS
133 Apache Blvd College Ave 157 138 176 23% 2% 8% 0.3 4997 0 1 NS
134 Apache Blvd Paseo Del
Saber 108 79 138 5% 0% 0% 0.34 0 1 NS
135 Lemon St Rural Rd 73 60 87 6% 37% 29% 0.26 37510 0 0 NS

Page 20 of 22
137 Broadway Rd Priest Dr 10 10 10 30% 35% 60% 0.2 24403 1.75 1 NS
138 Broadway Rd Rural Rd 50 40 61 12% 27% 97% 0.26 44120 0.5 0 NS
139 Broadway Rd College Ave 139 131 148 38% 3% 5% 0.26 4997 0.5 1 NS
141 Southern Ave College Ave 53 45 61 48% 5% 12% 0.27 4442 1.5 1 NS
142 Southern Ave Rural Rd 21 19 23 23% 23% 99% 0.07 40059 1.5 0 NS
143 Southern Ave Hardy Dr 12 10 15 48% 2% 33% 0.23 13469 2.22 1 NS
144 Southern Ave Mill Ave 18 14 23 16% 42% 89% 0.3 34482 1.5 1 NS
145 Alameda Dr Mill Ave 12 12 12 19% 19% 62% 0.32 26912 1 1 NS
146 Broadway Rd Mill Ave 20 18 22 14% 32% 66% 0.18 26912 0.5 1 NS
147 Baseline Rd Mill Ave 8 3 14 15% 24% 88% 0.24 24224 2.5 1 NS
152 Tempe Lake S. TCA Bridge 10 10 60% 0% 0% 0.15 0 0.8 1 NS
155 University Dr McClintock Dr 18 16 20 21% 27% 94% 0.14 36366 1 1 NS
156 Crosscut Canal Mill Ave 11 10 12 77% 0% 0% 0.09 14670 0.7 1 NS
157 Curry Rd College Ave 18 20 17 66% 7% 15% 0.16 5499 1.1 1 NS
158 Washington St Priest Dr 13 11 14 54% 18% 58% 0.08 23678 1.5 1 NS
159 Broadway Rd McClintock Dr 23 15 30 4% 29% 93% 0.14 31175 1.5 0 NS
160 Broadway Rd Hardy Dr 13 12 14 47% 10% 35% 0.25 13469 1.3 1 NS
161 University Dr Price Rd 9 8 11 0% 30% 97% 0.19 8101 2 0 NS
162 Broadway Rd Roosevelt St 12 8 17 40% 17% 27% 0.27 5329 1.1 1 NS
163 University Dr Farmer Ave 12 13 10 4% 15% 22% 0.28 0.2 1 NS
164 Southern Ave McClintock Dr 12 10 15 22% 27% 92% 0.2 39001 2.5 0 NS
165 University Dr Priest Dr 12 11 13 21% 25% 58% 0.06 28310 1.2 1 NS
166 8th St Dorsey Ln 24 10 38 8% 17% 46% 0.19 0.5 1 NS
167 Town Lake Path S Priest Dr 9 5 14 46% 14% 70% 0.19 41943 2 0 NS

Page 21 of 22
East-West Direction
Loc ID
Location or Intersection: E/W
Location or Intersection:
N/S
Total per hr
AM per hr
PM per hr Helmet%
Wrong way% Sidewalk% Female%
Traffic Dir
Loc to
ASU Lane in Dir Dir
101 Washington/Curry Mill Ave 16 12 20 62% 10% 17% 0.19 14035 0.6 1 EW
102 Rio Salado Pkwy Mill Ave 16 7 24 37% 13% 50% 0.16 14634 0 1 EW
103 Rio Salado Pkwy Rural Rd 23 23 44% 22% 76% 0.31 14634 0 1 EW
104 Rio Salado Pkwy McClintock Dr 11 15 7 55% 27% 55% 0.11 20597 1 1 EW
106 5th St Mill Ave 61 61 61 21% 5% 8% 0.28 6739 0 1 EW
108 5th St Farmer Ave 92 80 103 8% 5% 8% 0.21 3508 0.25 1 EW
110 5th St Priest Dr 5 5 11% 11% 11% 0 3747 1.24 1 EW
111 10th St Mill Ave 79 71 87 11% 4% 8% 0.36 0 1 EW
112 Superstition Fwy College Ave 2 0 EW
113 13th St Mill Ave 35 19 52 22% 23% 16% 0.25 3917 0 1 EW
114 13th St Hardy Dr 24 17 31 18% 15% 3% 0.44 3917 0.72 1 EW
115 University Dr College Ave 136 136 6% 31% 40% 0.21 26482 0 1 EW
116 University Dr Dorsey Ln 80 62 99 9% 30% 59% 0.31 30015 0.5 1 EW
117 University Dr Rural Rd 147 103 192 8% 37% 60% 0.28 30015 0 1 EW
118 University Dr Mill Ave 84 59 109 10% 33% 46% 0.22 27003 0 1 EW
119 University Dr Ash Ave 65 49 82 16% 21% 26% 0.22 27003 0.11 1 EW
120 University Dr Roosevelt St 56 52 60 11% 18% 31% 0.2 27003 0.43 1 EW
121 University Dr Hardy Dr 19 14 25 12% 21% 36% 0.21 27003 0.72 1 EW
122 McKellips Rd Greenbelt Path 8 2 14 3% 35% 84% 0 14788 2.2 1 EW
123 Western Canal Rural Rd 32 29 36 59% 0% 0% 0.28 4 1 EW
124 Western Canal McClintock Dr 31 24 39 58% 0% 0% 0.33 5 1 EW
126 Baseline Rd Western Canal 17 14 20 25% 28% 94% 0.25 24094 2.9 0 EW
128 Alameda Dr McClintock Dr 19 20 17 64% 1% 11% 0.2 2 1 EW
129 Alameda Dr Rural Rd 19 19 49% 0% 22% 0.3 1841 1 1 EW
131 Apache Blvd Rural Rd 83 73 94 12% 27% 50% 0.29 22165 0 1 EW
132 Apache Blvd S Dorsey Ln 57 54 61 21% 16% 32% 0.18 18699 0.5 1 EW
133 Apache Blvd College Ave 64 63 65 13% 22% 33% 0.33 22165 0 1 EW
134 Apache Blvd Paseo Del
Saber 125 121 128 8% 0% 0% 0.29 22165 0 1 EW
135 Lemon St Rural Rd 104 73 135 6% 16% 32% 0.3 0 1 EW
137 Broadway Rd Priest Dr 7 5 10 14% 39% 93% 0.25 37476 1.75 0 EW
138 Broadway Rd Rural Rd 23 20 26 10% 41% 97% 0.25 30063 0.5 0 EW
139 Broadway Rd College Ave 13 12 15 12% 12% 48% 0.29 29614 0.5 0 EW
141 Southern Ave College Ave 20 16 24 21% 18% 95% 0.14 35372 1.5 0 EW
142 Southern Ave Rural Rd 21 9 32 18% 24% 93% 0.17 35372 1.5 0 EW

Page 22 of 22
143 Southern Ave Hardy Dr 10 7 13 21% 13% 87% 0.18 28429 2.22 0 EW
144 Southern Ave Mill Ave 20 15 25 15% 31% 93% 0.2 35372 1.5 0 EW
145 Alameda Dr Mill Ave 9 7 11 44% 6% 9% 0.24 1841 1 1 EW
146 Broadway Rd Mill Ave 14 9 20 11% 21% 93% 0.25 31585 0.5 0 EW
147 Baseline Rd Mill Ave 12 14 11 29% 20% 96% 0.24 22102 2.5 0 EW
152 Tempe Lake S. TCA Bridge 42 25 59 47% 0% 0% 0.16 0 0.8 1 EW
155 University Dr McClintock Dr 50 45 56 15% 18% 77% 0.34 30015 1 1 EW
156 Crosscut Canal Mill Ave 7 6 8 74% 0% 59% 0.15 0 0.7 1 EW
157 Curry Rd College Ave 9 8 10 42% 17% 36% 0.11 15990 1.1 1 EW
158 Washington St Priest Dr 21 17 25 52% 22% 40% 0.08 14565 1.5 1 EW
159 Broadway Rd McClintock Dr 19 18 20 3% 33% 100% 0.24 32138 1.5 0 EW
160 Broadway Rd Hardy Dr 7 5 9 7% 41% 100% 0.15 31585 1.3 0 EW
161 University Dr Price Rd 19 17 22 29% 13% 71% 0.14 29056 2 1 EW
162 Broadway Rd Roosevelt St 8 6 11 3% 24% 97% 0.27 31585 1.1 0 EW
163 University Dr Farmer Ave 52 43 62 13% 19% 32% 0.2 27003 0.2 1 EW
164 Southern Ave McClintock Dr 17 14 20 12% 40% 97% 0.22 28316 2.5 0 EW
165 University Dr Priest Dr 9 5 13 43% 20% 43% 0.06 28413 1.2 1 EW
166 8th St Dorsey Ln 32 9 56 6% 10% 10% 0.23 0.5 1 EW
167 Town Lake Path S Priest Dr 8 11 5 74% 6% 74% 0.29 2 1 EW