
Pedestrian and Bicycle Count Data Part 2 Equipment · Pedestrian and Bicycle Count Data ......
63
Pedestrian and Bicycle Count Data Part 2 – Equipment Krista Nordback UNC Highway Safety Research Center Frank Proulx Alta Planning + Design Sarah O’Brien NCSU Institute for Transportation Research and Education PBIC Webinar
Transcript of Pedestrian and Bicycle Count Data Part 2 Equipment · Pedestrian and Bicycle Count Data ......
Pedestrian and Bicycle Count DataPart 2 – Equipment
Krista NordbackUNC Highway Safety Research Center
Frank ProulxAlta Planning + Design
Sarah O’BrienNCSU Institute for Transportation Research and Education
PBIC Webinar

Today’s Presentation
Introduction and housekeeping
Presentations
Questions at the end

Webinar Issues
Audio issues?Dial into the phone line instead of using “mic & speakers.”
Webinar issues?Re-Load the webpage and log back into the webinar. Or send note of an issue through the Question box.
Questions?Submit your questions at any time in the Questions box.
CM Credits and Email
Certificate of AttendanceYou will receive a certificate of attendance by email from the UNC Highway Safety Research Center

PBIC Webinars and News
Find PBIC webinars and webinar archivespedbikeinfo.org/webinars
Follow us for the latest PBIC Newsfacebook.com/pedbikeinfotwitter.com/pedbikeinfo
Join us on Twitter using #PBICWebinar
Sign up for our mailing listpedbikeinfo.org/signup

Upcoming Webinars
Upcoming session on counts:
APBP Webinar on June 21:Beyond Counting - Putting the Data to Work for Better Planning and Evaluation (visit www.apbp.org)
PBIC’s next webinar:
March 14 session co-sponsored with GHSA:Laying the Groundwork for Successful Safety Education and Enforcement Activities
(visit www.pedbikeinfo.org/webinars)

Pedestrian and Bicycle Count
Programs
Krista Nordback, P.E., Ph.D.
Tuesday, February 21, 2017
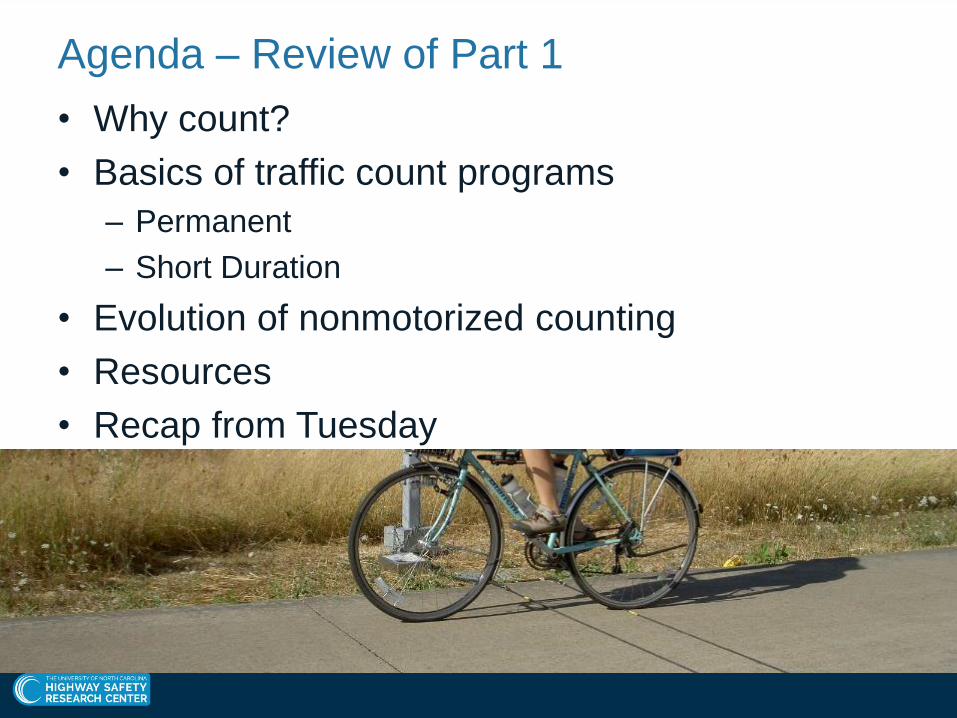
Agenda – Review of Part 1
• Why count?
• Basics of traffic count programs
– Permanent
– Short Duration
• Evolution of nonmotorized counting
• Resources
• Recap from Tuesday
Why measure biking and walking?
If we don’t count it, it doesn’t count.
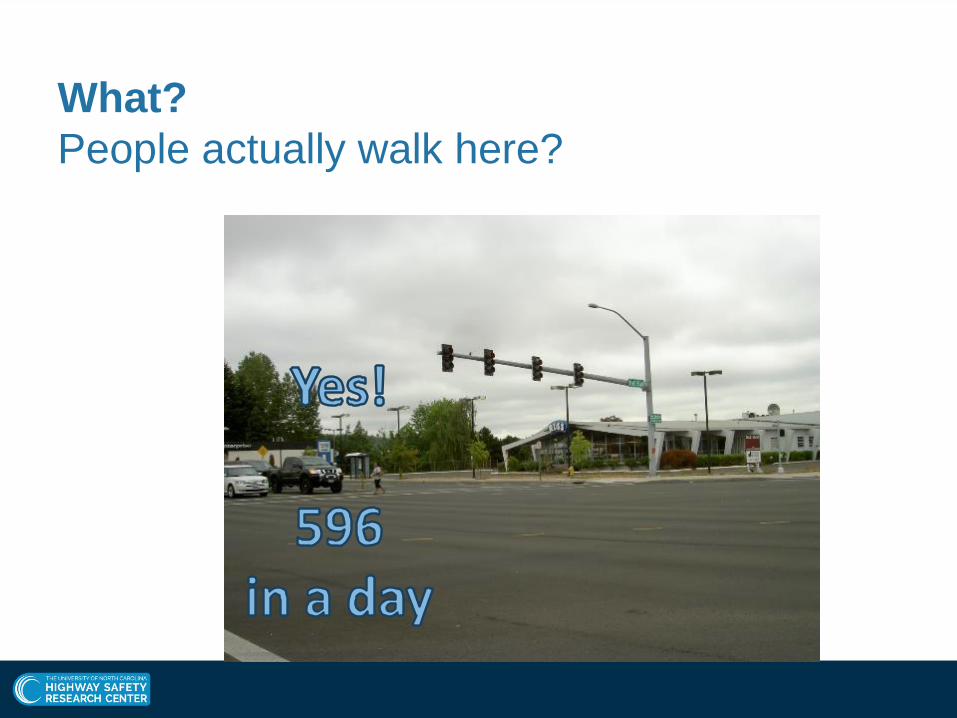
What?
People actually walk here?
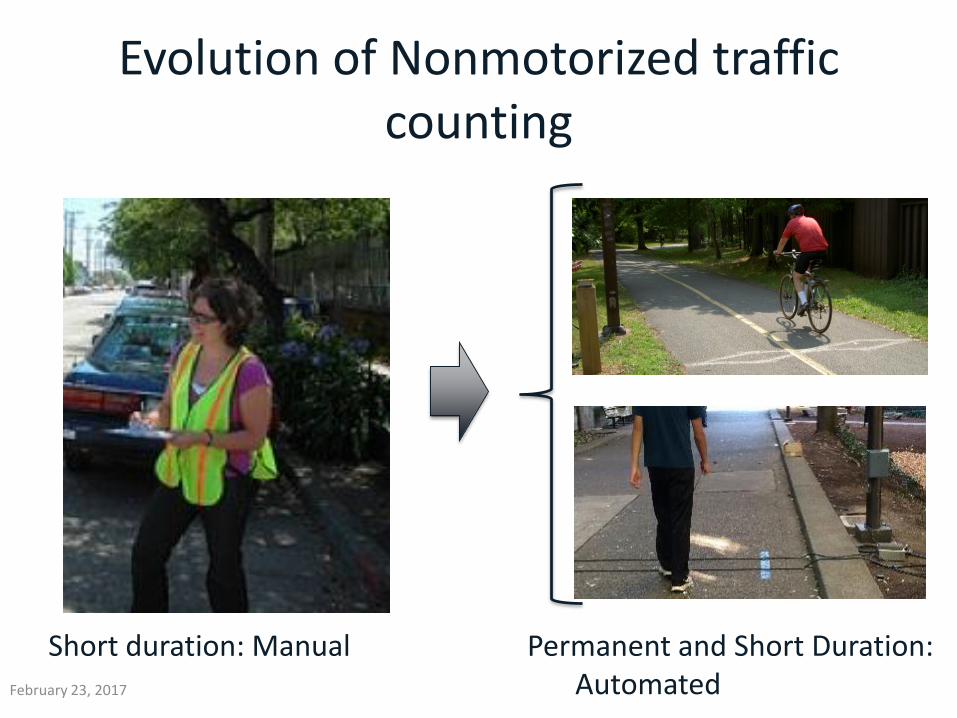
Short duration: Manual Permanent and Short Duration: Automated
Evolution of Nonmotorized traffic counting
February 23, 2017
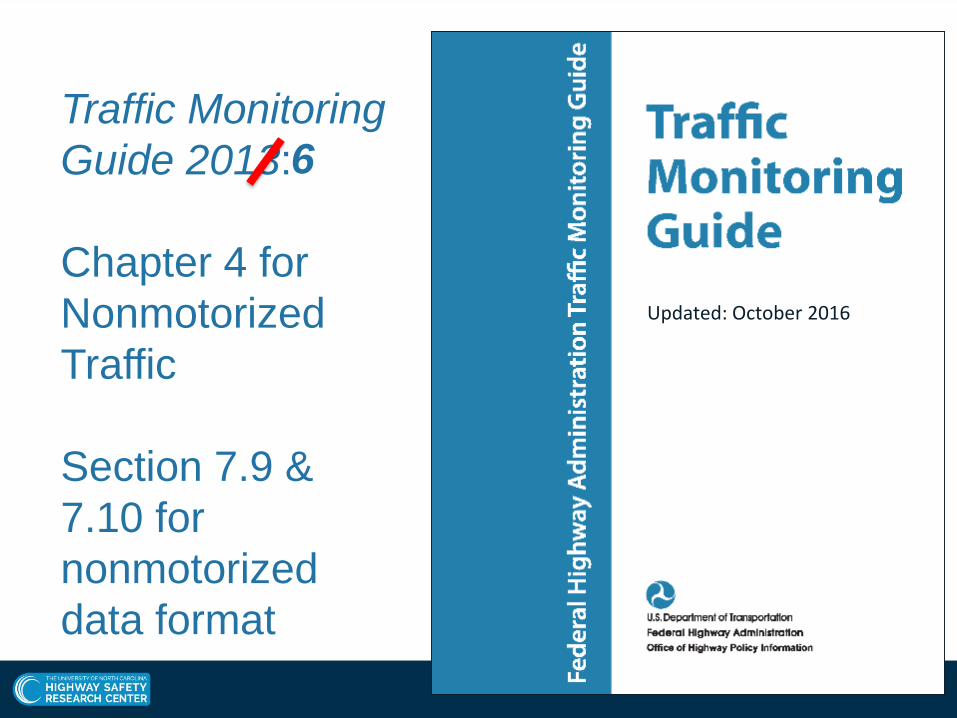
Traffic Monitoring
Guide 2013:
Chapter 4 for
Nonmotorized
Traffic
Section 7.9 &
7.10 for
nonmotorized
data format
Updated: October 2016
6
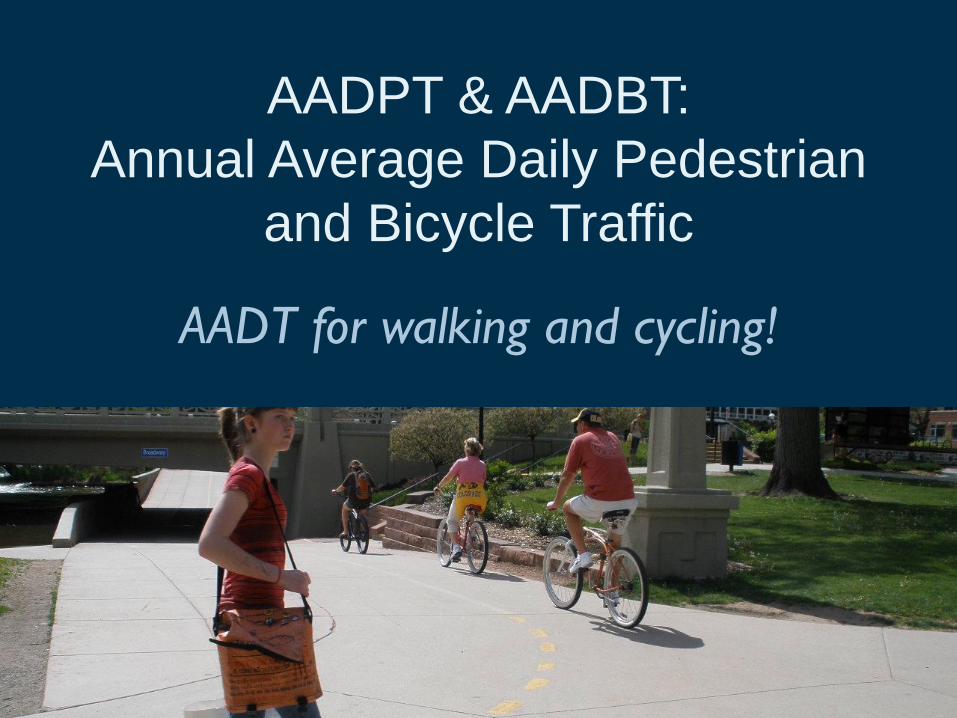
AADPT & AADBT:
Annual Average Daily Pedestrian
and Bicycle Traffic
AADT for walking and cycling!
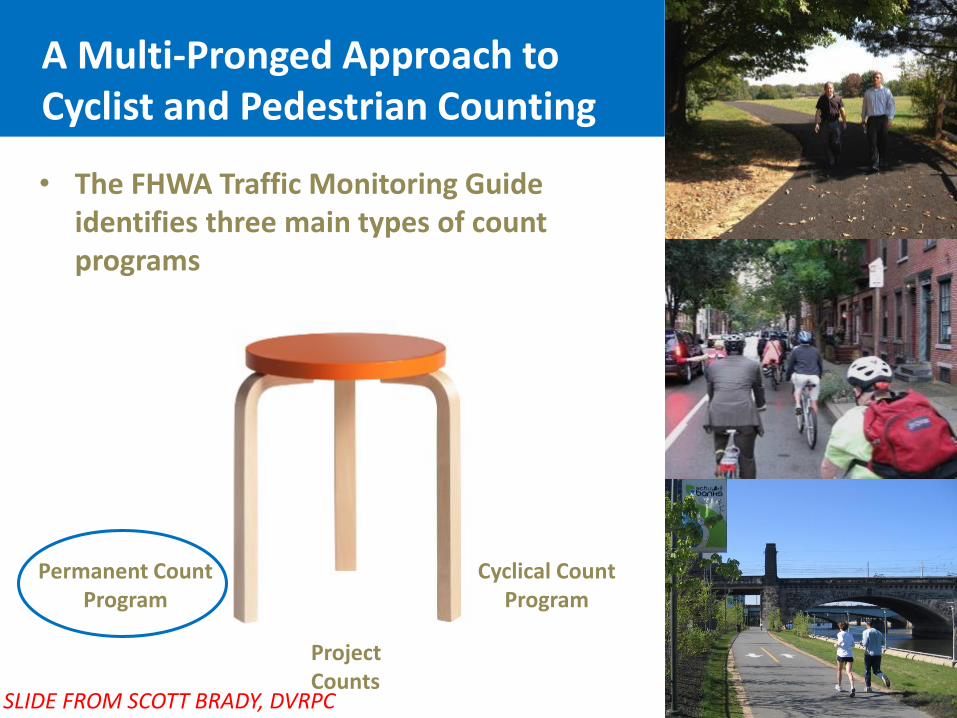
A Multi-Pronged Approach to Cyclist and Pedestrian Counting
• The FHWA Traffic Monitoring Guide identifies three main types of count programs
Permanent CountProgram
Cyclical CountProgram
Project Counts
SLIDE FROM SCOTT BRADY, DVRPC
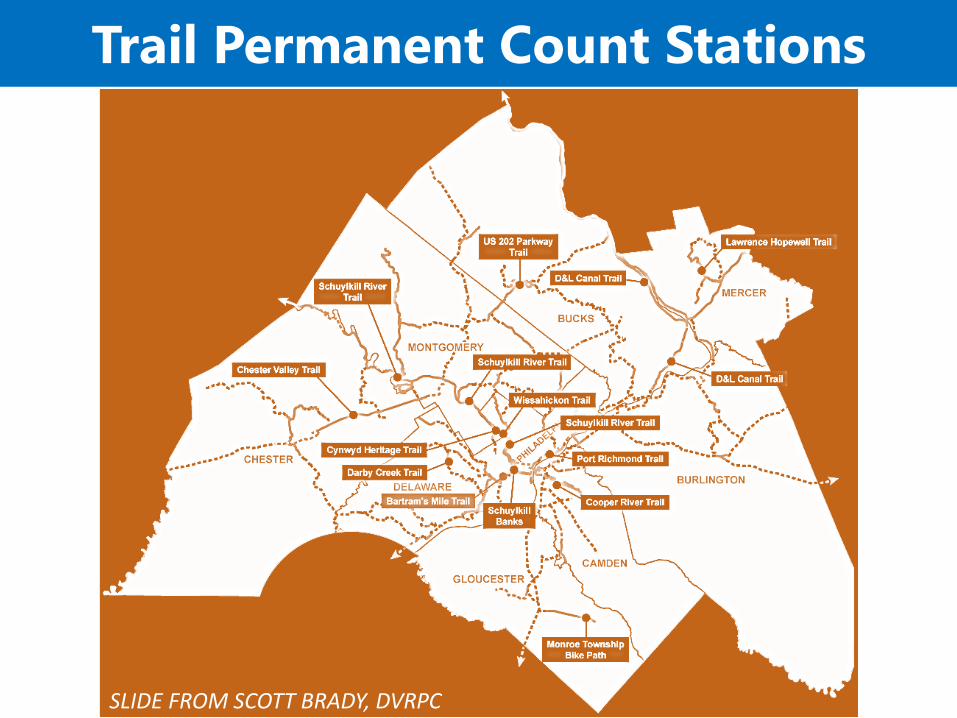
Trail Permanent Count Stations
SLIDE FROM SCOTT BRADY, DVRPC
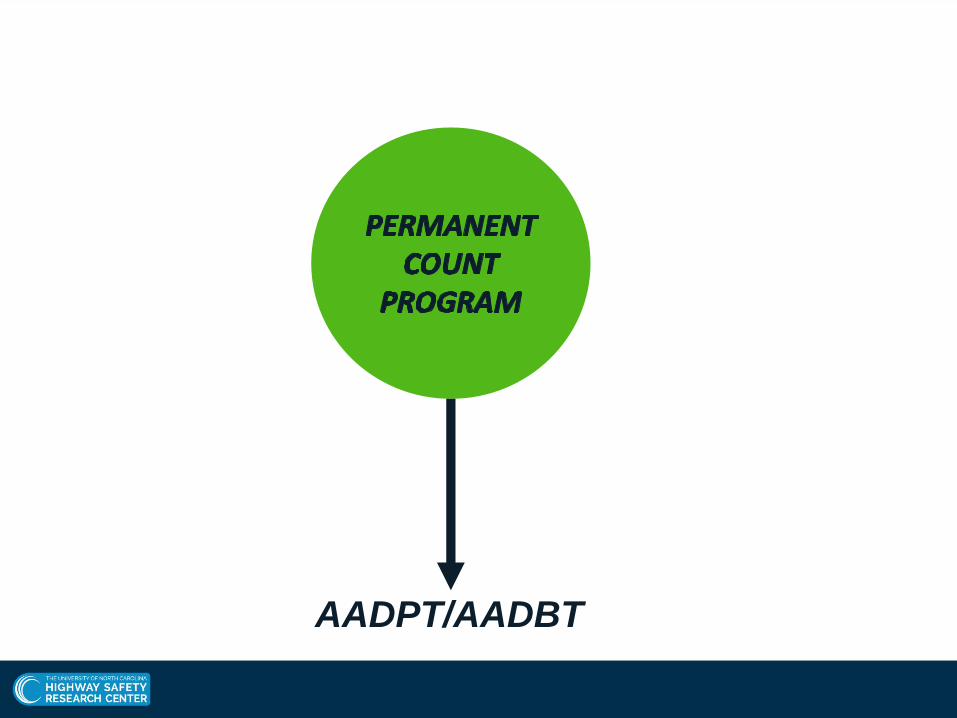
AADPT/AADBT
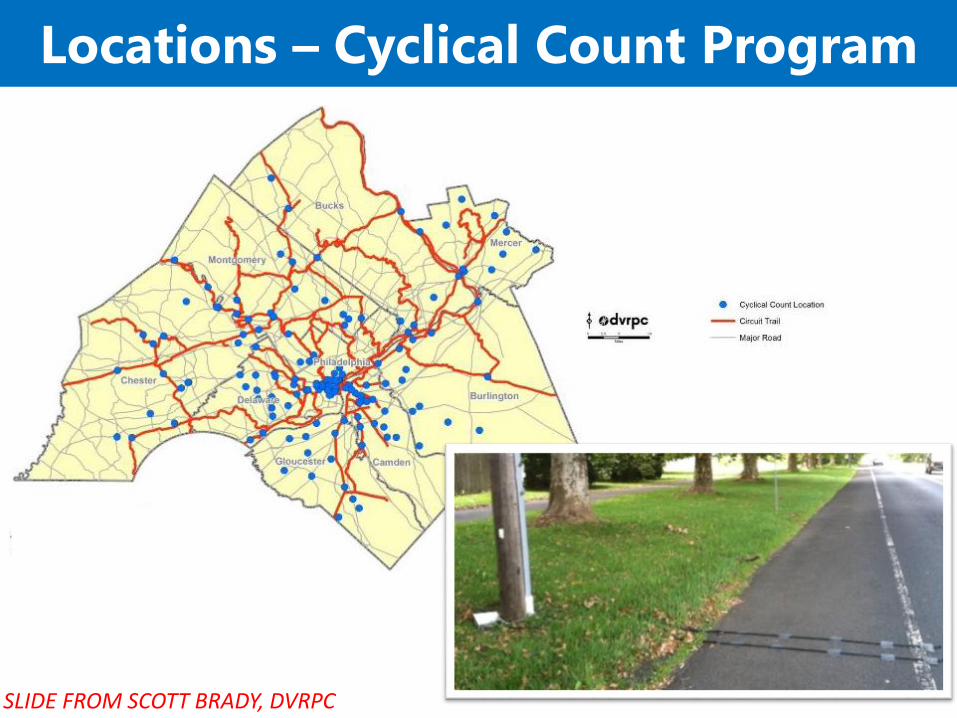
Locations – Cyclical Count Program
SLIDE FROM SCOTT BRADY, DVRPC
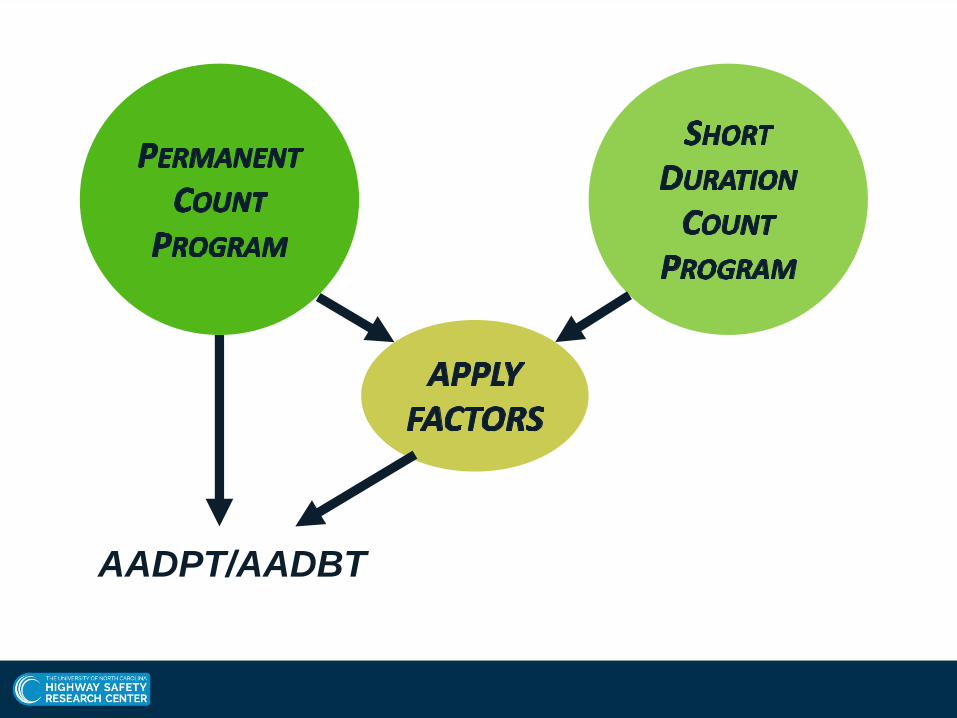
AADPT/AADBT
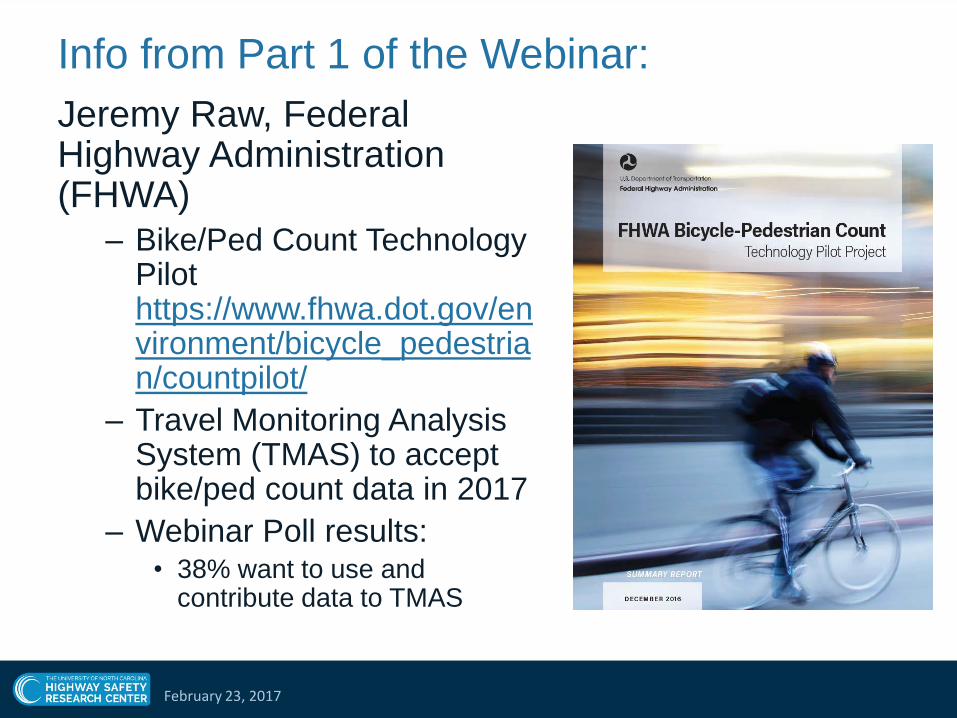
Info from Part 1 of the Webinar:
Jeremy Raw, Federal Highway Administration (FHWA)
– Bike/Ped Count Technology Pilot https://www.fhwa.dot.gov/environment/bicycle_pedestrian/countpilot/
– Travel Monitoring Analysis System (TMAS) to accept bike/ped count data in 2017
– Webinar Poll results:• 38% want to use and
contribute data to TMAS
February 23, 2017

Info from Part 1 of the Webinar:
Kelly Laustsen, Kittelson & Associates
– FHWA Guide for coding TMG nonmotorized format
https://www.fhwa.dot.gov/environment/bicycle_pedestria
n/publications/tmg_coding/
February 23, 2017
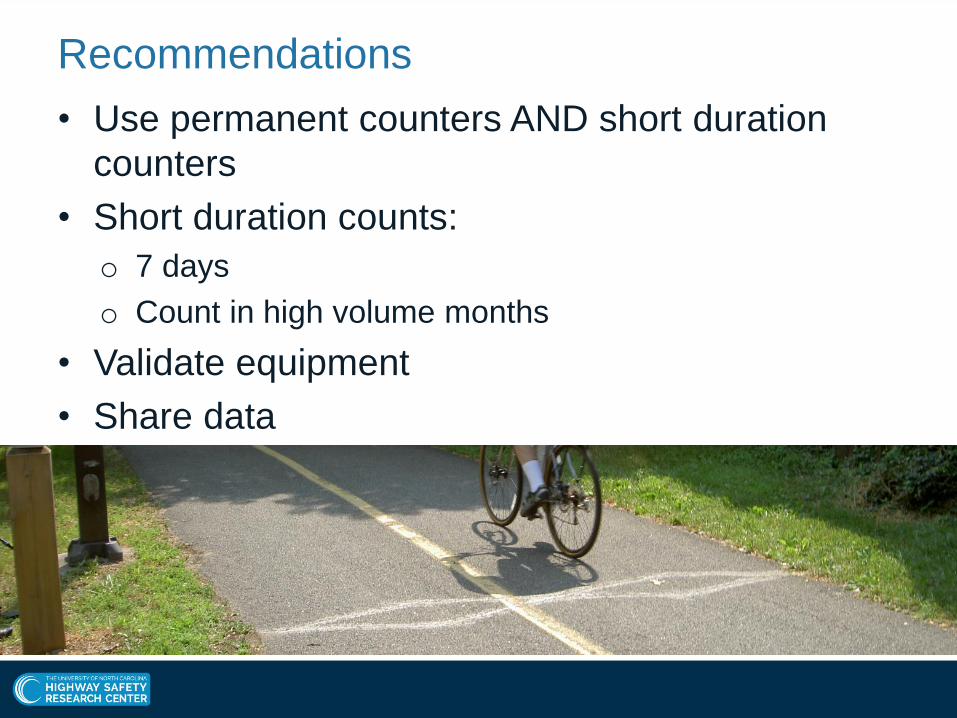
Recommendations
• Use permanent counters AND short duration
counters
• Short duration counts:
o 7 days
o Count in high volume months
• Validate equipment
• Share data
ALTA PLANNING + DESIGN | PBIC WEBINAR | FEBRUARY 23, 2017
EQUIPMENT FOR COUNTING BIKING AND WALKINGFrank Proulx, [email protected]

ALTA PLANNING + DESIGN | PBIC WEBINAR | FEBRUARY 23, 2017
OVERVIEWIntroduction
Active Transportation
Planning + DesignALTA
• What technologies are available?
• What’s the right tool for the job?
ALTA PLANNING + DESIGN | PBIC WEBINAR | FEBRUARY 23, 2017
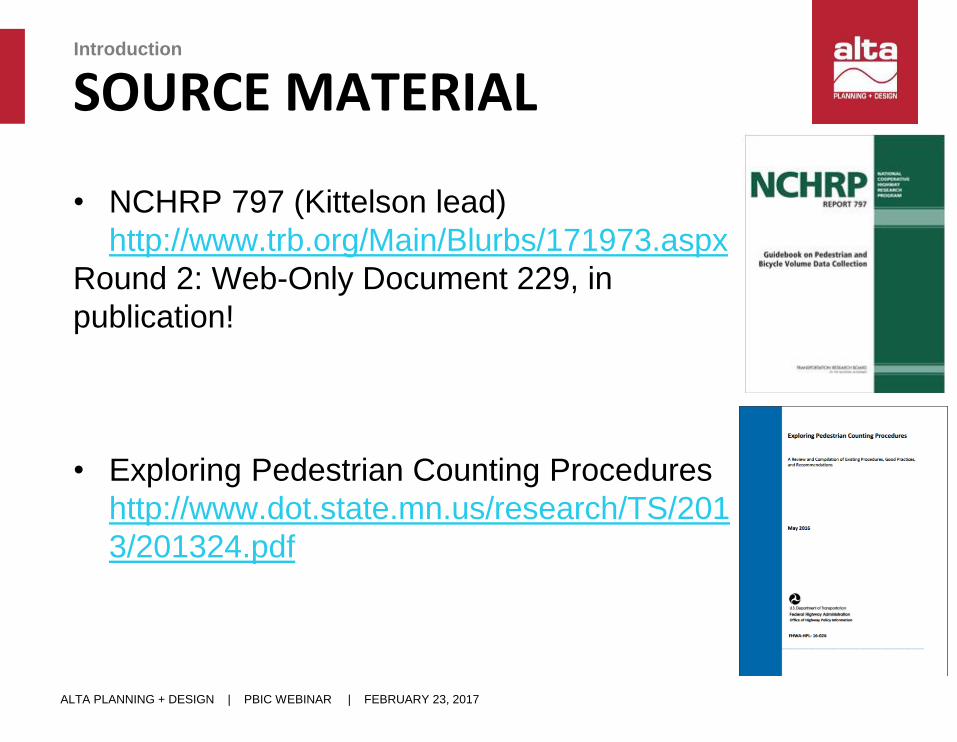
SOURCE MATERIALIntroduction
Active Transportation
Planning + DesignALTA
• NCHRP 797 (Kittelson lead)
http://www.trb.org/Main/Blurbs/171973.aspx
Round 2: Web-Only Document 229, in
publication!
• Exploring Pedestrian Counting Procedures
http://www.dot.state.mn.us/research/TS/201
3/201324.pdf
ALTA PLANNING + DESIGN | PBIC WEBINAR | FEBRUARY 23, 2017
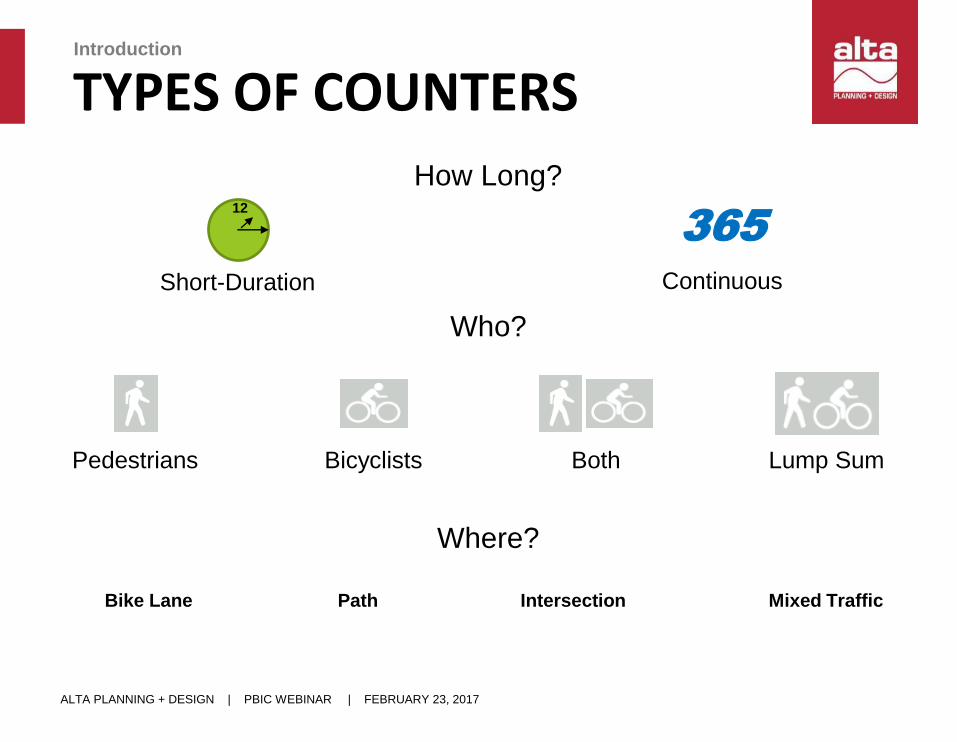
TYPES OF COUNTERSIntroduction
12
Short-Duration
365
Continuous
Pedestrians Bicyclists Both Lump Sum
Intersection Mixed TrafficBike Lane Path
How Long?
Who?
Where?
ALTA PLANNING + DESIGN | PBIC WEBINAR | FEBRUARY 23, 2017
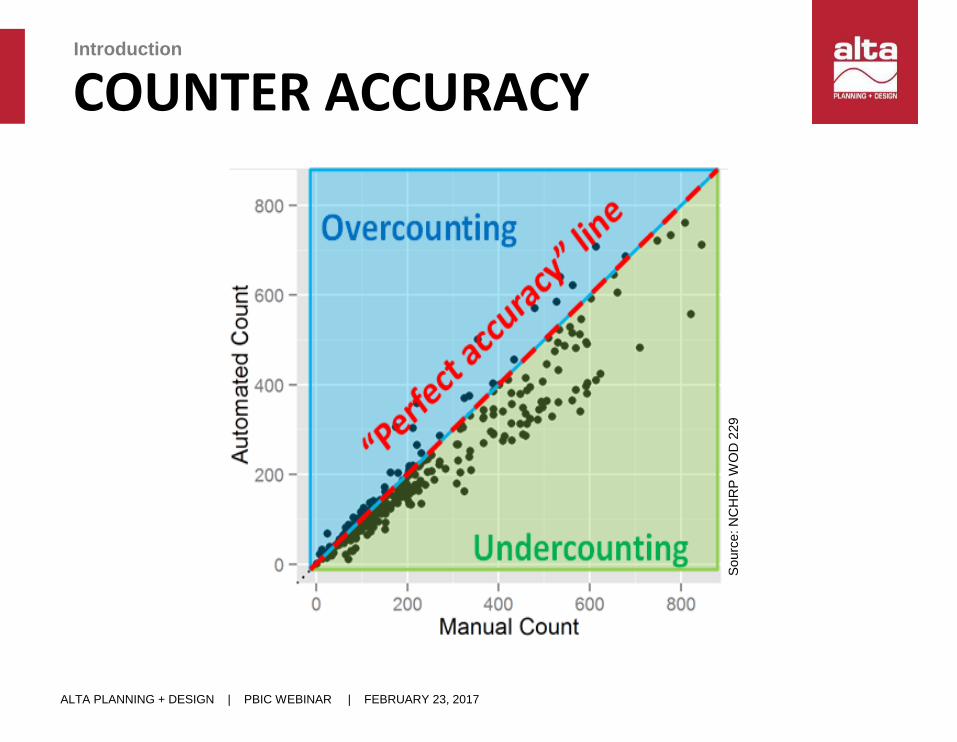
COUNTER ACCURACYIntroduction
Active Transportation
Planning + DesignALTA
Sourc
e: N
CH
RP
WO
D 2
29
ALTA PLANNING + DESIGN | PBIC WEBINAR | FEBRUARY 23, 2017
COUNT TECHNOLOGIES
ALTA PLANNING + DESIGN | PBIC WEBINAR | FEBRUARY 23, 2017
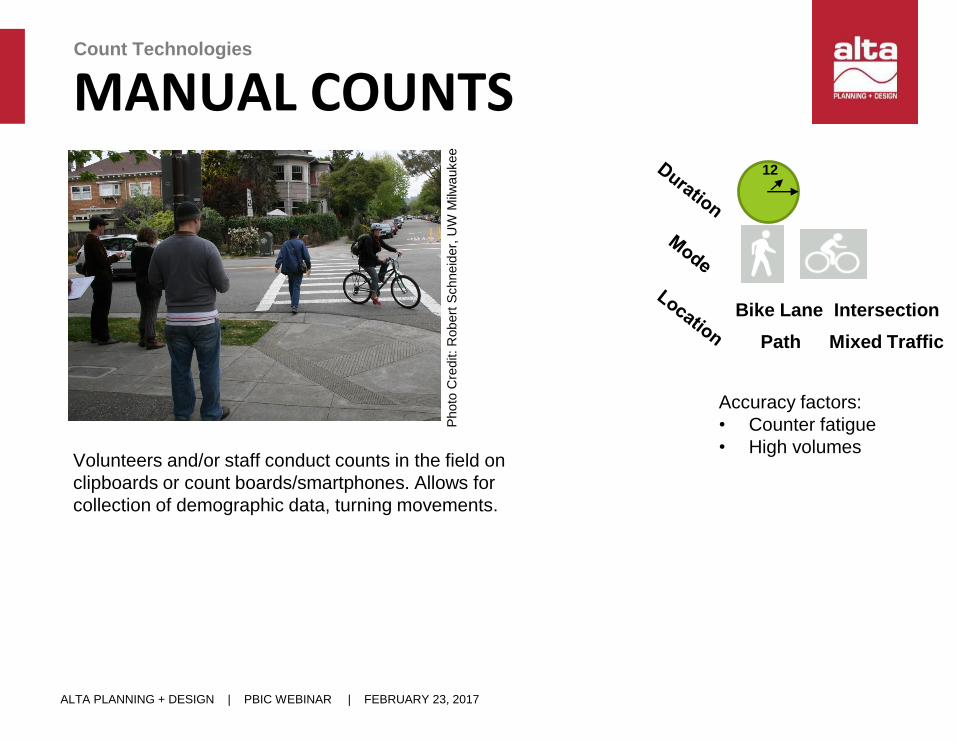
MANUAL COUNTSCount Technologies
Active Transportation
Planning + DesignALTA
Volunteers and/or staff conduct counts in the field on
clipboards or count boards/smartphones. Allows for
collection of demographic data, turning movements.
Accuracy factors:
• Counter fatigue
• High volumesP
hoto
Cre
dit: R
obert
Schneid
er,
UW
Milw
aukee
12
Intersection
Mixed Traffic
Bike Lane
Path
ALTA PLANNING + DESIGN | PBIC WEBINAR | FEBRUARY 23, 2017
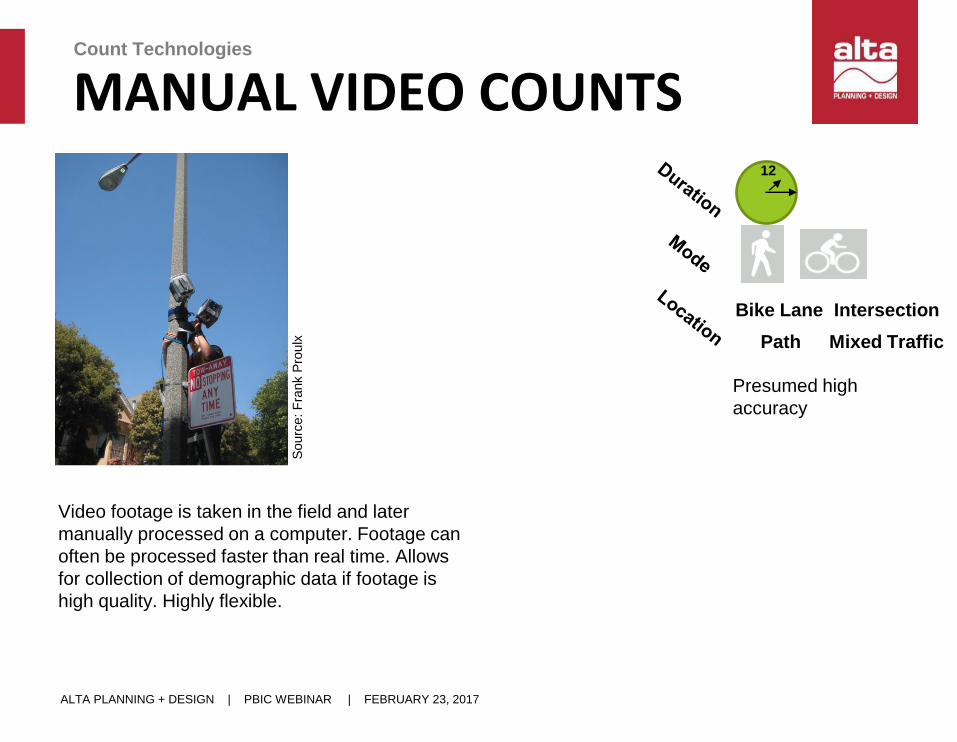
MANUAL VIDEO COUNTSCount Technologies
Active Transportation
Planning + DesignALTA
Video footage is taken in the field and later
manually processed on a computer. Footage can
often be processed faster than real time. Allows
for collection of demographic data if footage is
high quality. Highly flexible.
Presumed high
accuracy
12
Intersection
Mixed Traffic
Bike Lane
Path
Sourc
e: F
rank P
roulx

ALTA PLANNING + DESIGN | PBIC WEBINAR | FEBRUARY 23, 2017
AUTOMATED VIDEOCount Technologies
Active Transportation
Planning + DesignALTA
Video footage is processed by a computer vision
algorithm. Capability of conducting crossing and
turning-movement counts.
12
Intersection
Mixed Traffic
Bike Lane
Path
365
Sourc
e: M
iovis
ion
Limited third party validation.
ALTA PLANNING + DESIGN | PBIC WEBINAR | FEBRUARY 23, 2017
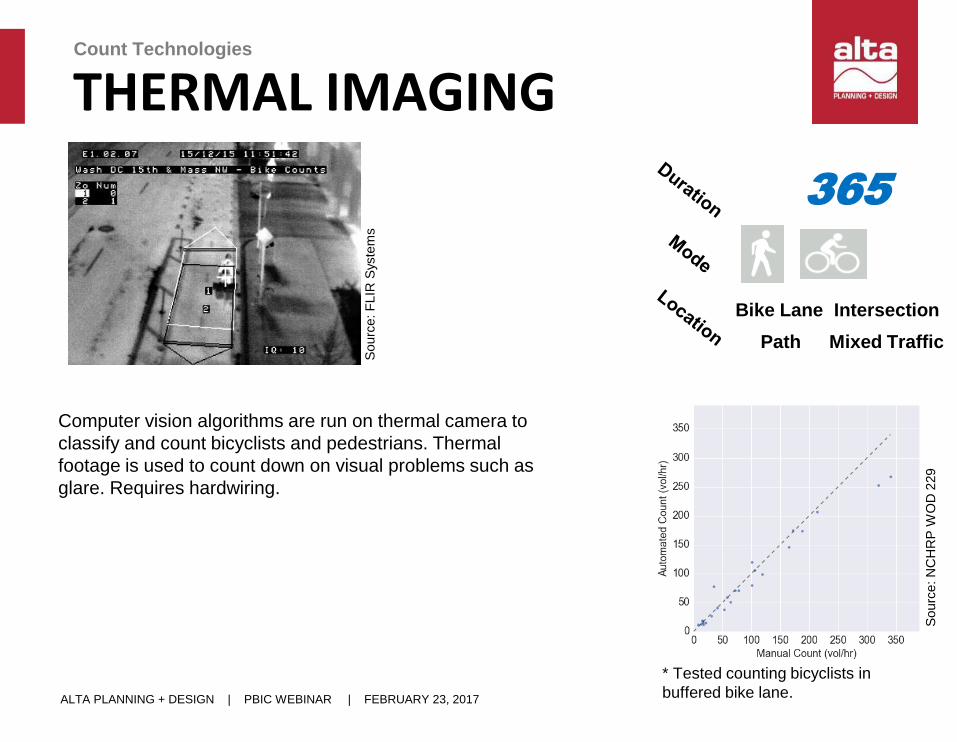
THERMAL IMAGINGCount Technologies
Active Transportation
Planning + DesignALTA
Computer vision algorithms are run on thermal camera to
classify and count bicyclists and pedestrians. Thermal
footage is used to count down on visual problems such as
glare. Requires hardwiring.
365
Intersection
Mixed Traffic
Bike Lane
Path
* Tested counting bicyclists in
buffered bike lane.
Sourc
e: N
CH
RP
WO
D 2
29
Sourc
e: F
LIR
Syste
ms
ALTA PLANNING + DESIGN | PBIC WEBINAR | FEBRUARY 23, 2017
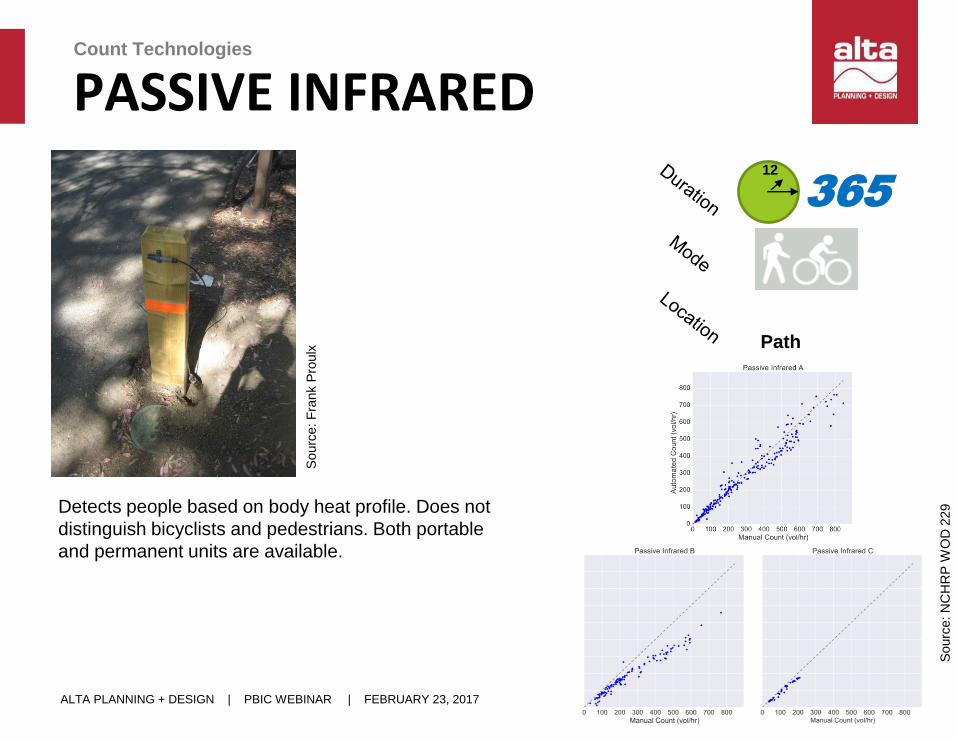
PASSIVE INFRAREDCount Technologies
ALTA
Detects people based on body heat profile. Does not
distinguish bicyclists and pedestrians. Both portable
and permanent units are available.
365
12
Path
Sourc
e: N
CH
RP
WO
D 2
29
Sourc
e: F
rank P
roulx
ALTA PLANNING + DESIGN | PBIC WEBINAR | FEBRUARY 23, 2017
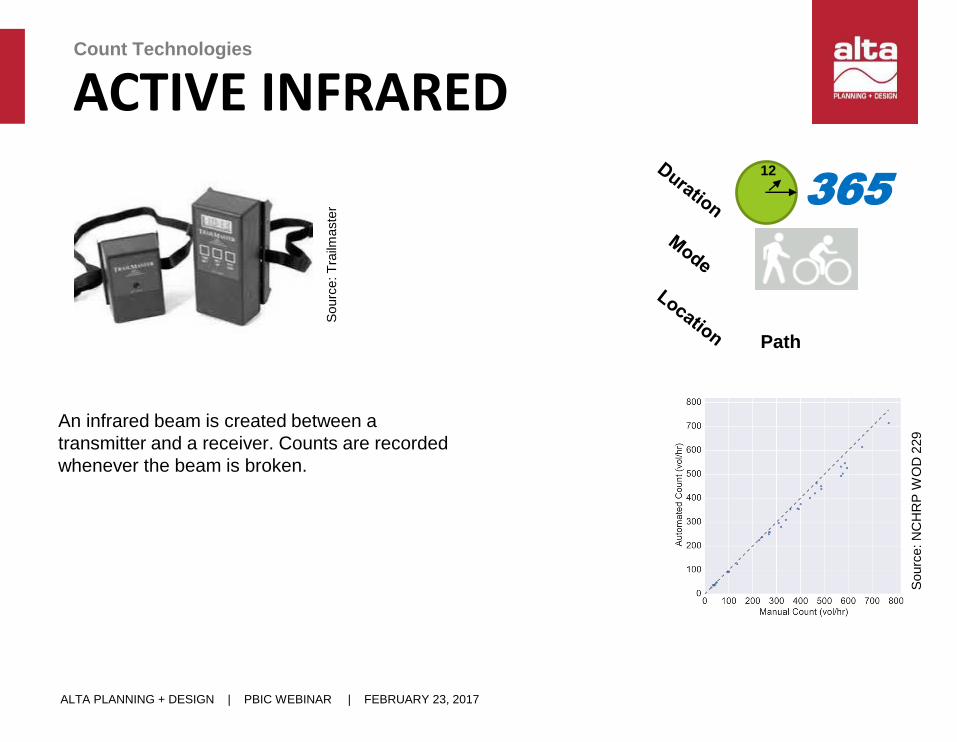
ACTIVE INFRAREDCount Technologies
Active Transportation
Planning + DesignALTA
An infrared beam is created between a
transmitter and a receiver. Counts are recorded
whenever the beam is broken.
365
12
Path
Sourc
e: N
CH
RP
WO
D 2
29
Sourc
e: T
railm
aste
r
ALTA PLANNING + DESIGN | PBIC WEBINAR | FEBRUARY 23, 2017
PRESSURE PADSCount Technologies
Active Transportation
Planning + DesignALTA
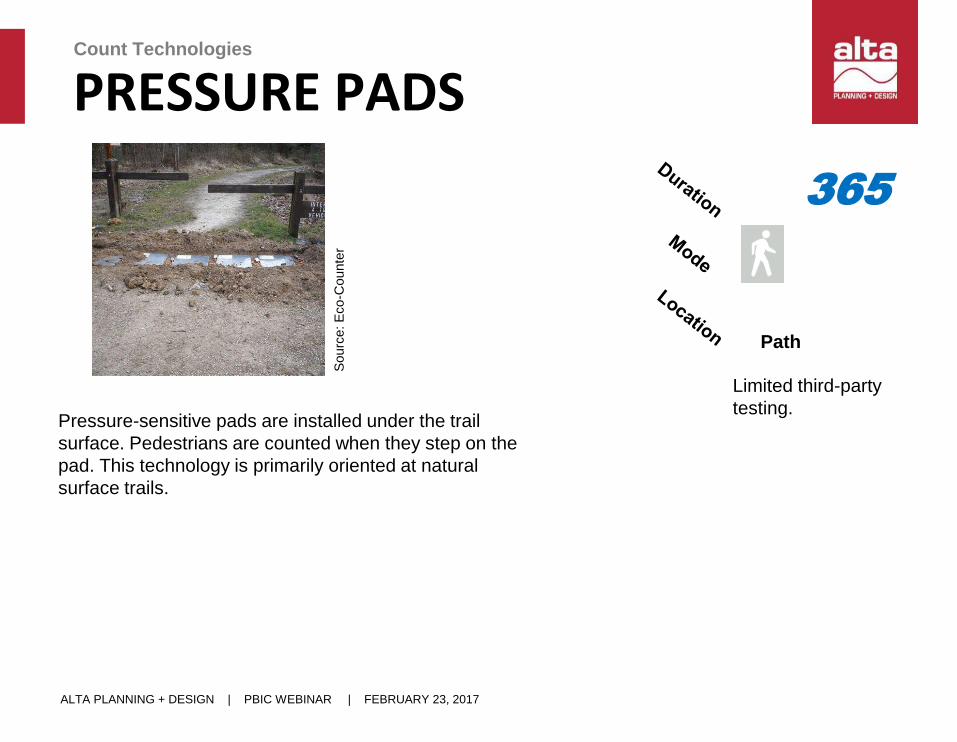
Pressure-sensitive pads are installed under the trail
surface. Pedestrians are counted when they step on the
pad. This technology is primarily oriented at natural
surface trails.
Limited third-party
testing.
365
PathS
ourc
e: E
co
-Counte
r
ALTA PLANNING + DESIGN | PBIC WEBINAR | FEBRUARY 23, 2017
RADARCount Technologies
Active Transportation
Planning + DesignALTA
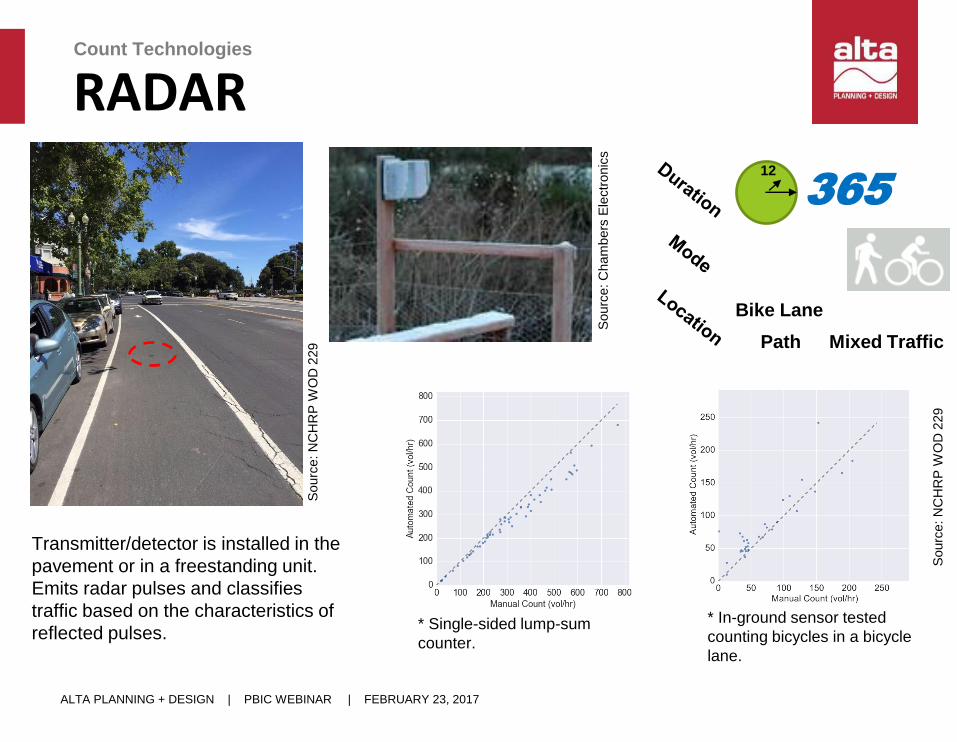
Transmitter/detector is installed in the
pavement or in a freestanding unit.
Emits radar pulses and classifies
traffic based on the characteristics of
reflected pulses.
365
Mixed Traffic
Bike Lane
Path
Sourc
e: N
CH
RP
WO
D 2
29
Sourc
e: N
CH
RP
WO
D 2
29
* In-ground sensor tested
counting bicycles in a bicycle
lane.
Sourc
e: C
ham
bers
Ele
ctr
onic
s
12
* Single-sided lump-sum
counter.
ALTA PLANNING + DESIGN | PBIC WEBINAR | FEBRUARY 23, 2017
INDUCTIVE LOOPSCount Technologies
Active Transportation
Planning + DesignALTA
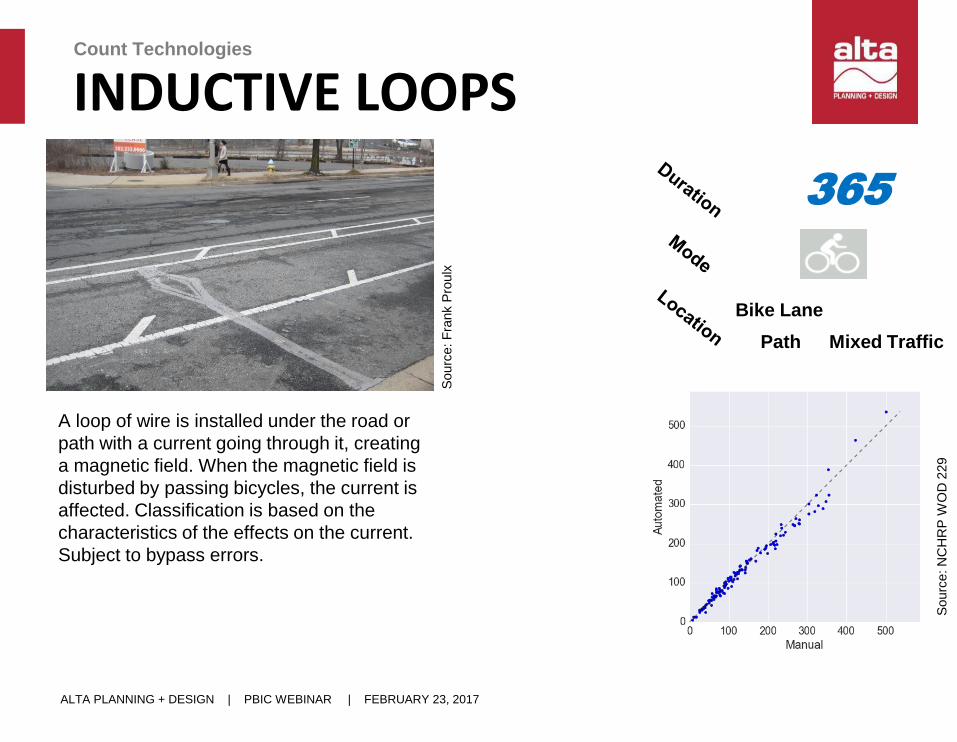
A loop of wire is installed under the road or
path with a current going through it, creating
a magnetic field. When the magnetic field is
disturbed by passing bicycles, the current is
affected. Classification is based on the
characteristics of the effects on the current.
Subject to bypass errors.
365
Mixed Traffic
Bike Lane
Path
Sourc
e: N
CH
RP
WO
D 2
29
Sourc
e: F
rank P
roulx
ALTA PLANNING + DESIGN | PBIC WEBINAR | FEBRUARY 23, 2017
PNEUMATIC TUBESCount Technologies
Active Transportation
Planning + DesignALTA
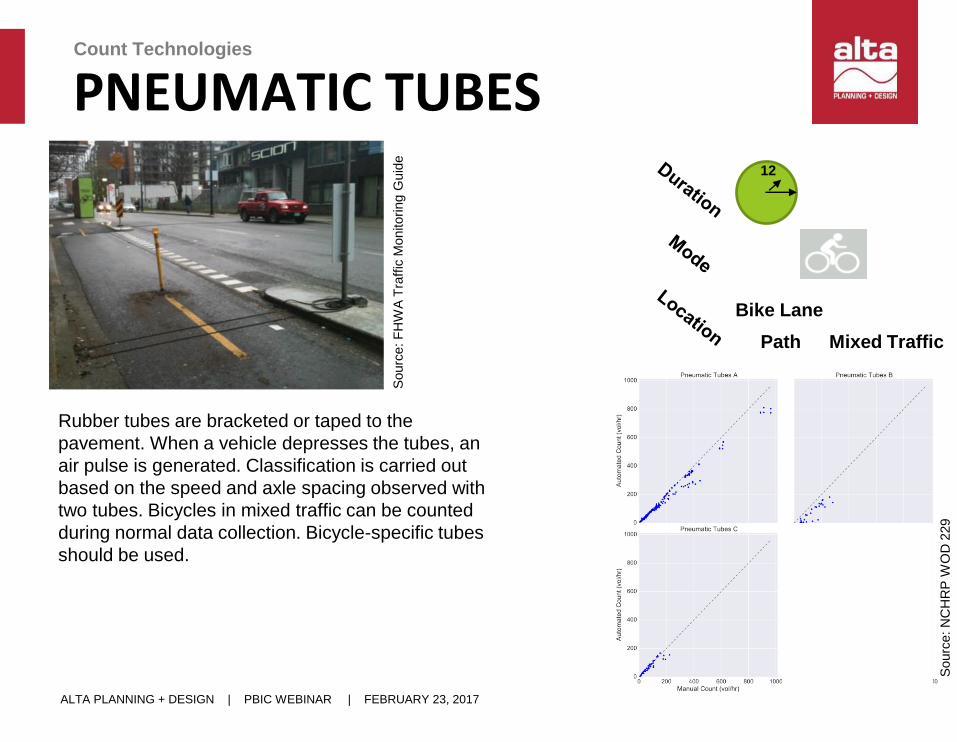
Rubber tubes are bracketed or taped to the
pavement. When a vehicle depresses the tubes, an
air pulse is generated. Classification is carried out
based on the speed and axle spacing observed with
two tubes. Bicycles in mixed traffic can be counted
during normal data collection. Bicycle-specific tubes
should be used.
12
Mixed Traffic
Bike Lane
Path
Sourc
e: N
CH
RP
WO
D 2
29
Sourc
e: F
HW
A T
raff
ic M
onitoring G
uid
e
ALTA PLANNING + DESIGN | PBIC WEBINAR | FEBRUARY 23, 2017
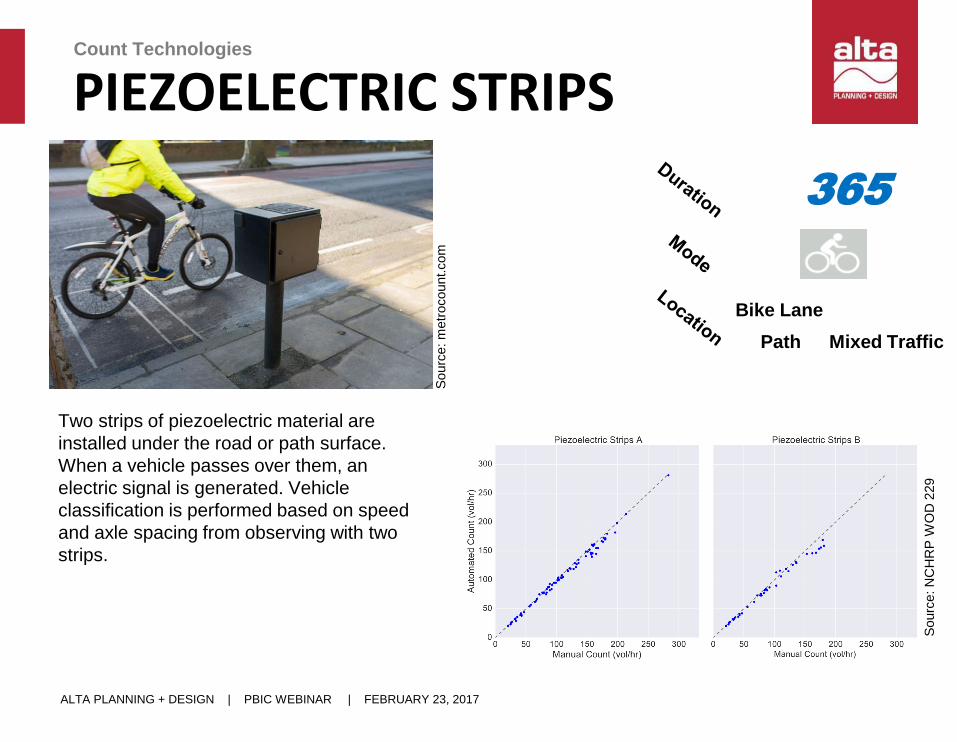
PIEZOELECTRIC STRIPSCount Technologies
Active Transportation
Planning + DesignALTA
Two strips of piezoelectric material are
installed under the road or path surface.
When a vehicle passes over them, an
electric signal is generated. Vehicle
classification is performed based on speed
and axle spacing from observing with two
strips.
365
Mixed Traffic
Bike Lane
Path
Sourc
e: N
CH
RP
WO
D 2
29
Sourc
e: m
etr
ocount.com
ALTA PLANNING + DESIGN | PBIC WEBINAR | FEBRUARY 23, 2017
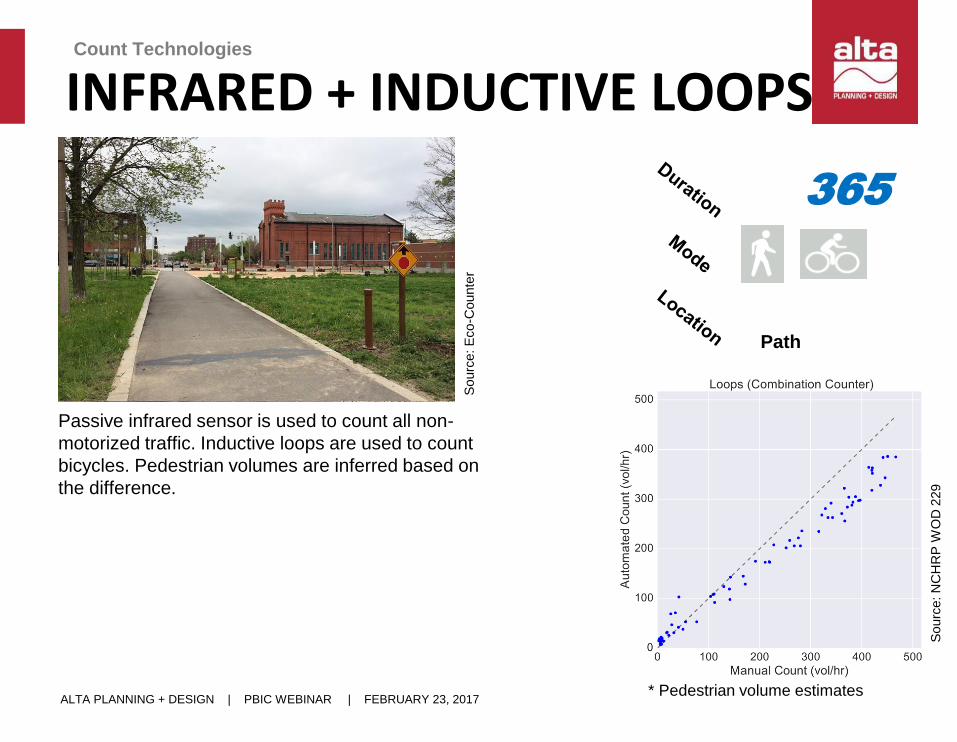
INFRARED + INDUCTIVE LOOPSCount Technologies
Active Transportation
Planning + DesignALTA
Passive infrared sensor is used to count all non-
motorized traffic. Inductive loops are used to count
bicycles. Pedestrian volumes are inferred based on
the difference.
365
Path
* Pedestrian volume estimates
Sourc
e: E
co
-Counte
r
Sourc
e: N
CH
RP
WO
D 2
29
ALTA PLANNING + DESIGN | PBIC WEBINAR | FEBRUARY 23, 2017
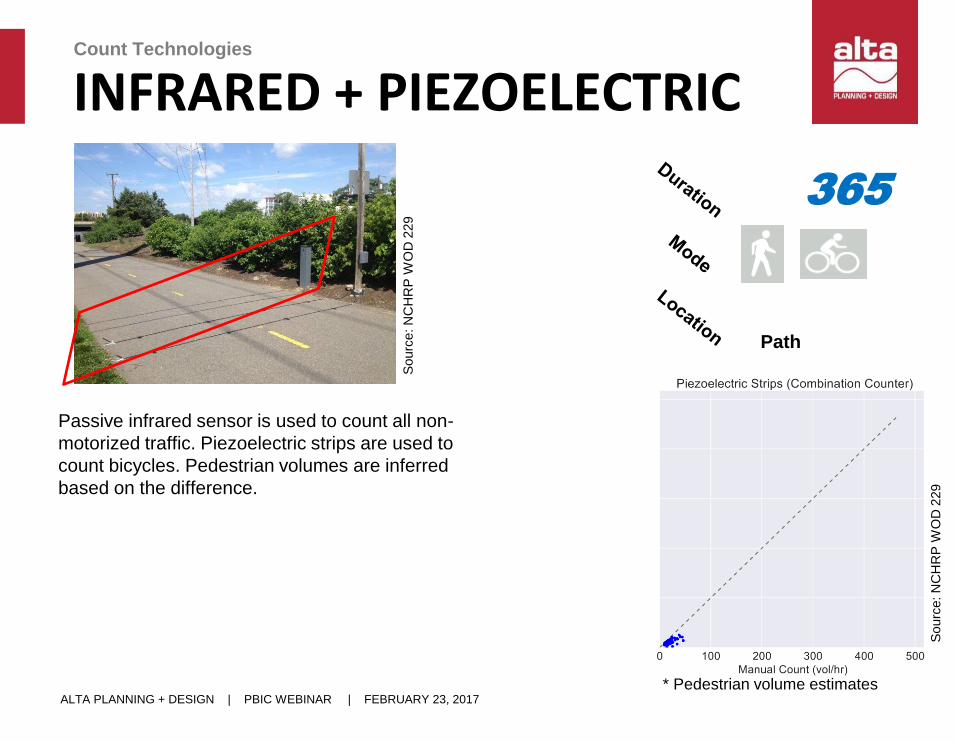
INFRARED + PIEZOELECTRICCount Technologies
Active Transportation
Planning + DesignALTA
Passive infrared sensor is used to count all non-
motorized traffic. Piezoelectric strips are used to
count bicycles. Pedestrian volumes are inferred
based on the difference.
365
Path
Sourc
e: N
CH
RP
WO
D 2
29
* Pedestrian volume estimates
Sourc
e: N
CH
RP
WO
D 2
29
ALTA PLANNING + DESIGN | PBIC WEBINAR | FEBRUARY 23, 2017
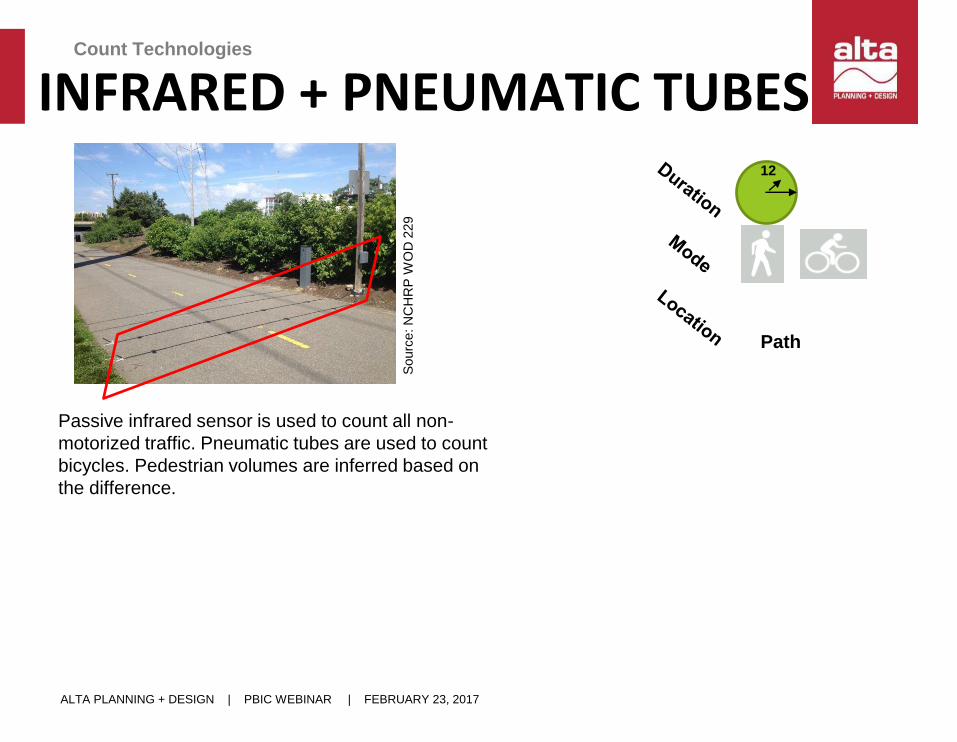
INFRARED + PNEUMATIC TUBESCount Technologies
Active Transportation
Planning + DesignALTA
Passive infrared sensor is used to count all non-
motorized traffic. Pneumatic tubes are used to count
bicycles. Pedestrian volumes are inferred based on
the difference.
12
Path
Sourc
e: N
CH
RP
WO
D 2
29
ALTA PLANNING + DESIGN | PBIC WEBINAR | FEBRUARY 23, 2017
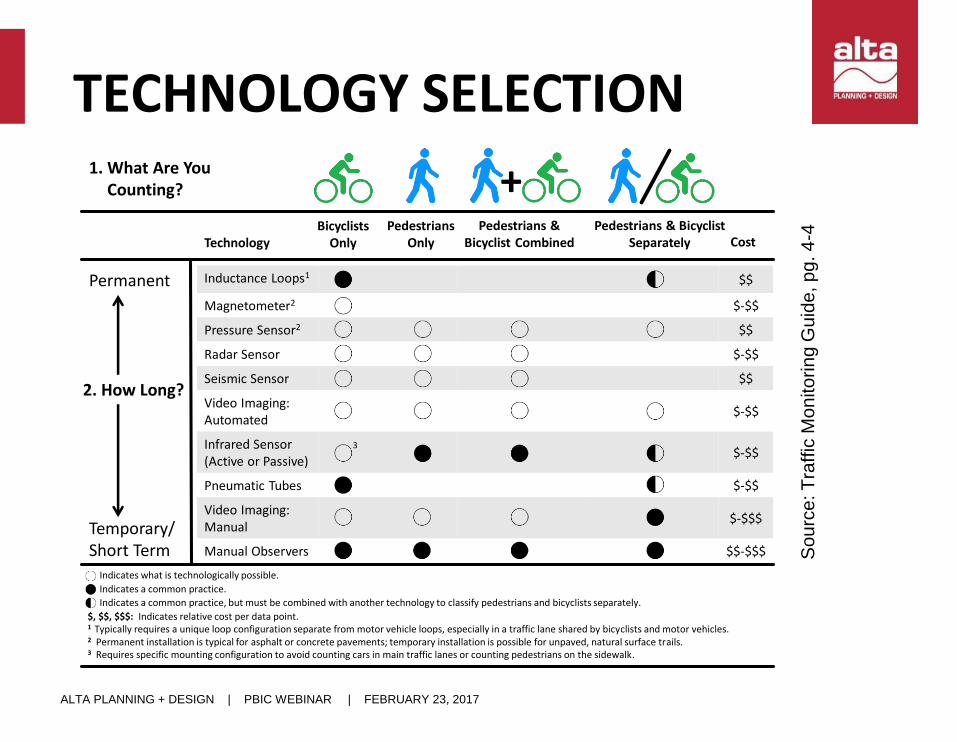
TECHNOLOGY SELECTION
2. How Long?
1. What Are You Counting?
Permanent
Temporary/ Short Term
Bicyclists Only
Pedestrians Only
+Pedestrians &
Bicyclist CombinedPedestrians & Bicyclist
Separately Cost
Inductance Loops1 $$
Magnetometer2 $-$$
Pressure Sensor2 $$
Radar Sensor $-$$
Seismic Sensor $$
Video Imaging:Automated
$-$$
Infrared Sensor(Active or Passive)
$-$$
Pneumatic Tubes $-$$
Video Imaging:Manual
$-$$$
Manual Observers $$-$$$
Technology
Indicates what is technologically possible.
Indicates a common practice.
Indicates a common practice, but must be combined with another technology to classify pedestrians and bicyclists separately.
$, $$, $$$: Indicates relative cost per data point.1 Typically requires a unique loop configuration separate from motor vehicle loops, especially in a traffic lane shared by bicyclists and motor vehicles.2 Permanent installation is typical for asphalt or concrete pavements; temporary installation is possible for unpaved, natural surface trails. 3 Requires specific mounting configuration to avoid counting cars in main traffic lanes or counting pedestrians on the sidewalk.
3
So
urc
e: T
raff
ic M
on
ito
rin
g G
uid
e, p
g. 4
-4
ALTA PLANNING + DESIGN | PBIC WEBINAR | FEBRUARY 23, 2017
REMAINING CHALLENGES
• Continuous pedestrian crossing counts
• Continuous bicycle turning-movement counts
• Bypass errors for on-street bicycle counts
ALTA PLANNING + DESIGN | PBIC WEBINAR | FEBRUARY 23, 2017
… AND REMEMBER!
Follow installation instructions
Calibrate your devices
Perform validation counts

Getting Quality DataMake Sure You Validate That!
Feb. 23, 2017
PBICWebinar
SARAH O’BRIENBicycle and Pedestrian ProgramInstitute for Transportation Research and Education
2
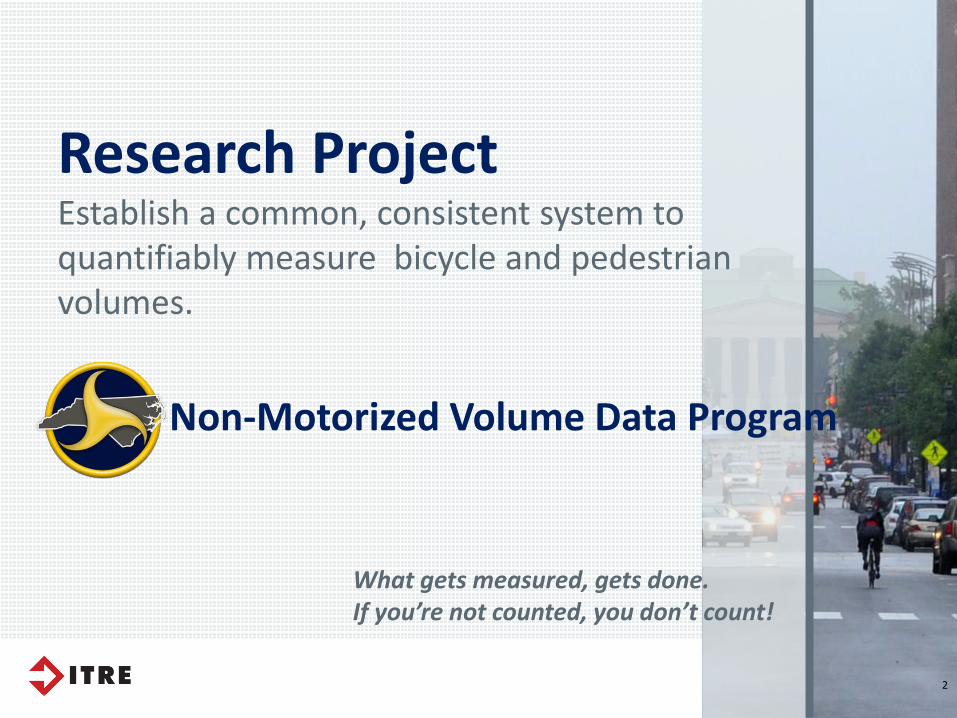
Research ProjectEstablish a common, consistent system to quantifiably measure bicycle and pedestrian volumes.
What gets measured, gets done.If you’re not counted, you don’t count!
Non-Motorized Volume Data Program
3
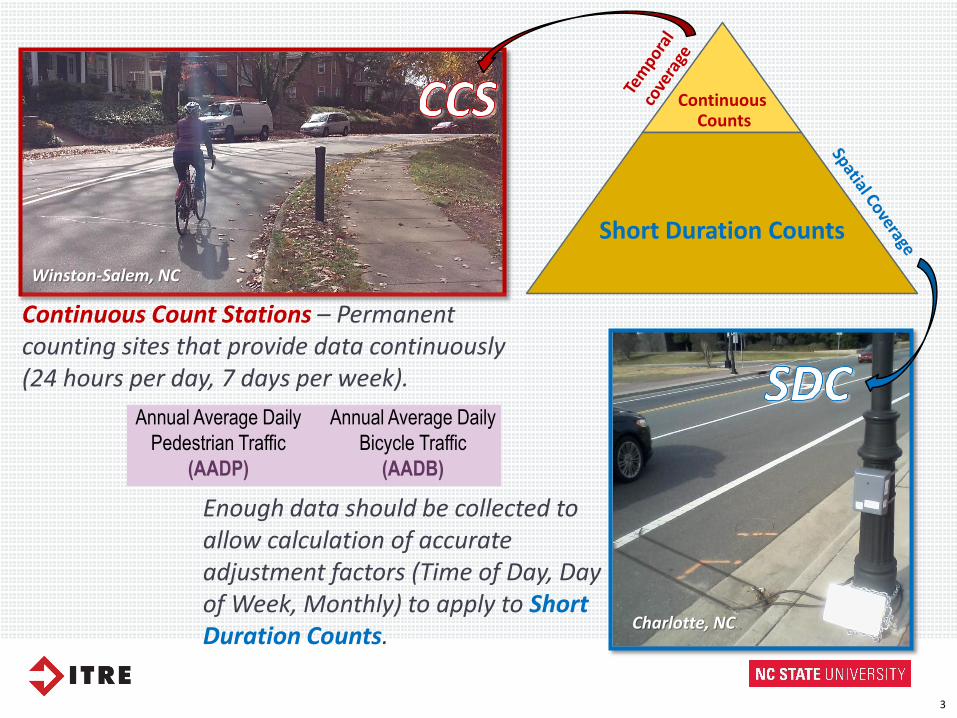
ContinuousCounts
Short Duration Counts
Continuous Count Stations – Permanent counting sites that provide data continuously (24 hours per day, 7 days per week).
Winston-Salem, NC
Charlotte, NC
Enough data should be collected to allow calculation of accurate adjustment factors (Time of Day, Day of Week, Monthly) to apply to Short Duration Counts.
Annual Average Daily
Bicycle Traffic
(AADB)
Annual Average Daily
Pedestrian Traffic
(AADP)
Accuracy of the data collected by CCSs are critical for credibility of the program and usefulness of the data.
4
5
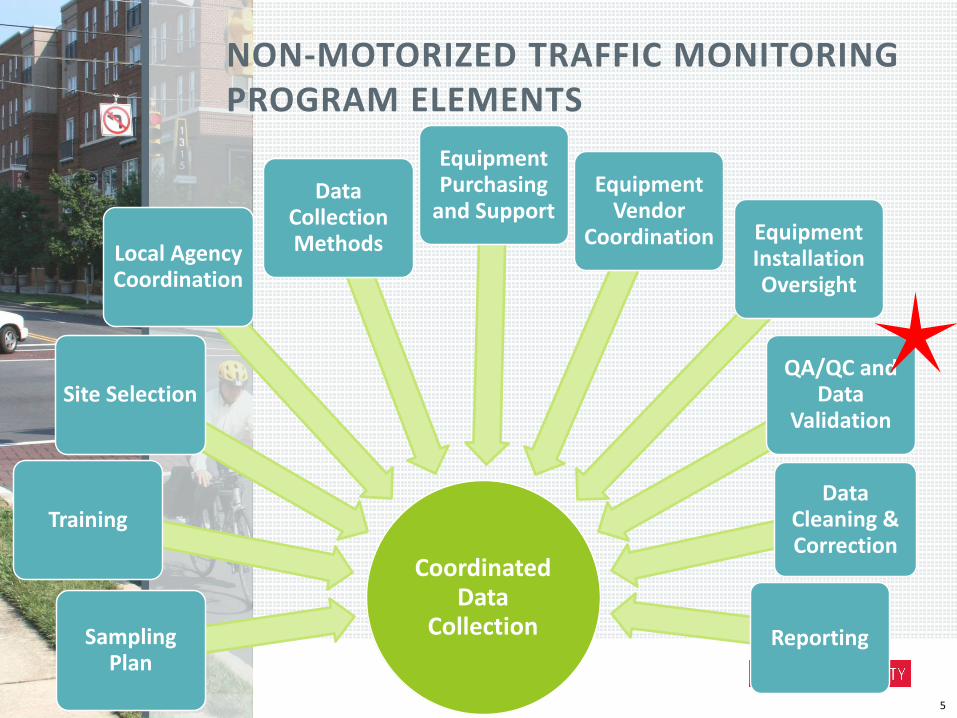
NON-MOTORIZED TRAFFIC MONITORING PROGRAM ELEMENTS
Coordinated Data
CollectionSampling Plan
Training
Site Selection
Local Agency Coordination
Data Collection Methods
Equipment Purchasing
and SupportEquipment
Vendor Coordination Equipment
Installation Oversight
QA/QC and Data
Validation
Data Cleaning & Correction
Reporting
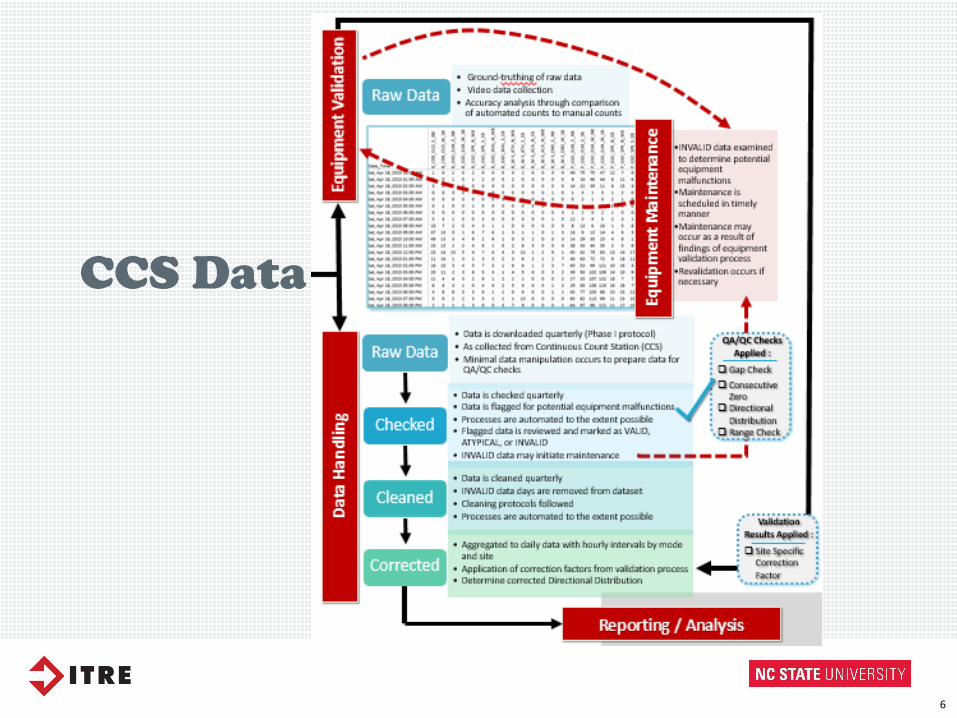
CCS Data
6
7
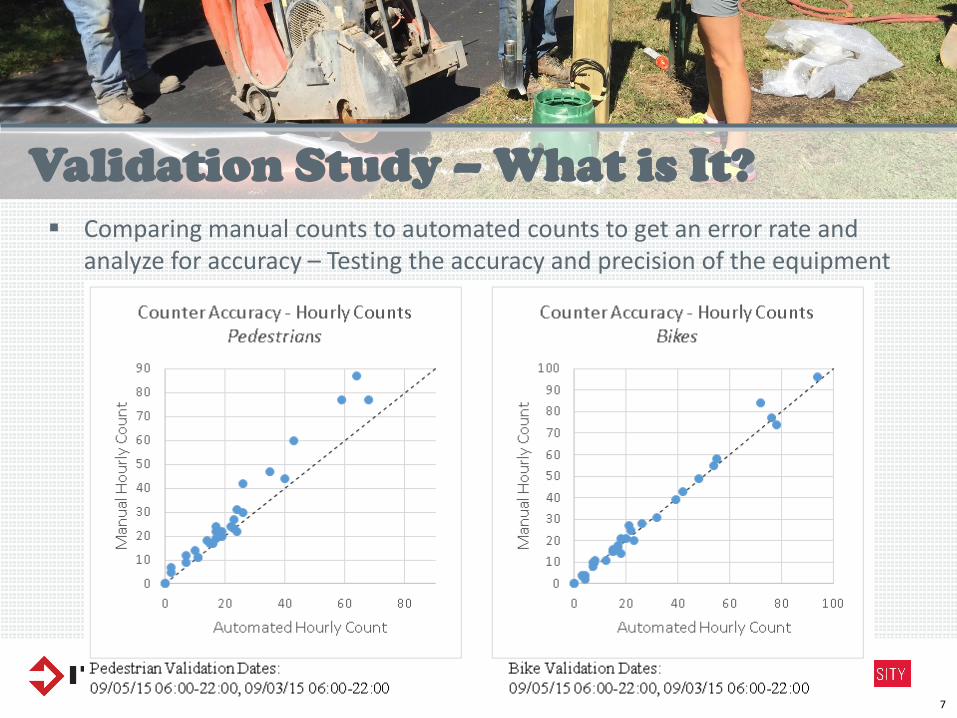
Comparing manual counts to automated counts to get an error rate and analyze for accuracy – Testing the accuracy and precision of the equipment
Validation Study – What is It?
8
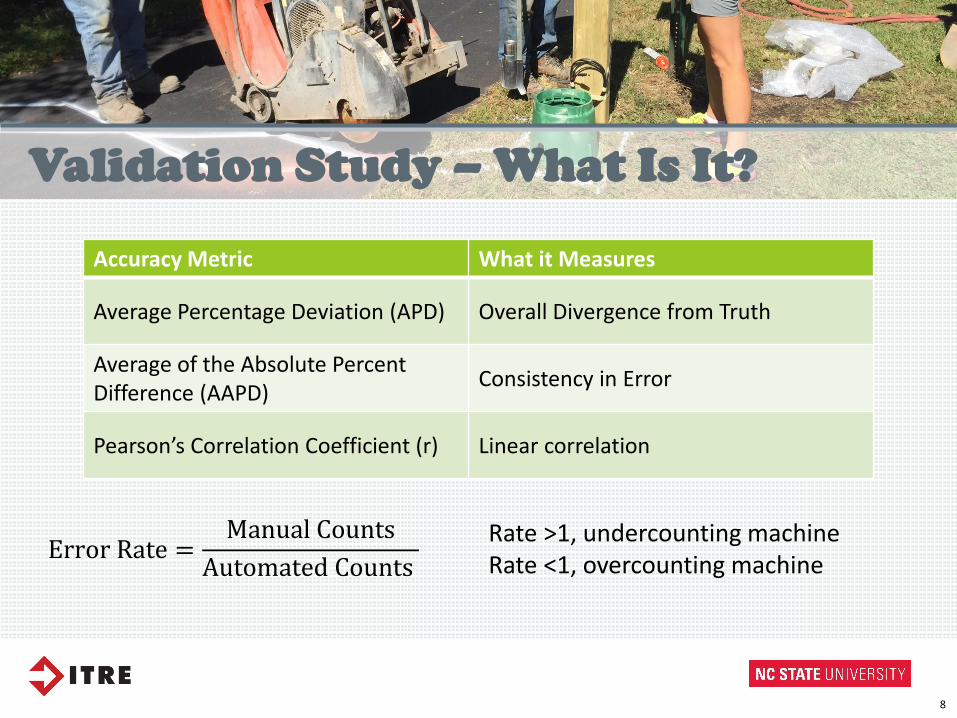
Error Rate =Manual Counts
Automated Counts
Validation Study – What Is It?
Accuracy Metric What it Measures
Average Percentage Deviation (APD) Overall Divergence from Truth
Average of the Absolute Percent Difference (AAPD)
Consistency in Error
Pearson’s Correlation Coefficient (r) Linear correlation
Rate >1, undercounting machineRate <1, overcounting machine

9
Best Practice: Annually
Validation Study – When to Do It?
At new station installation Maintenance Trigger
10
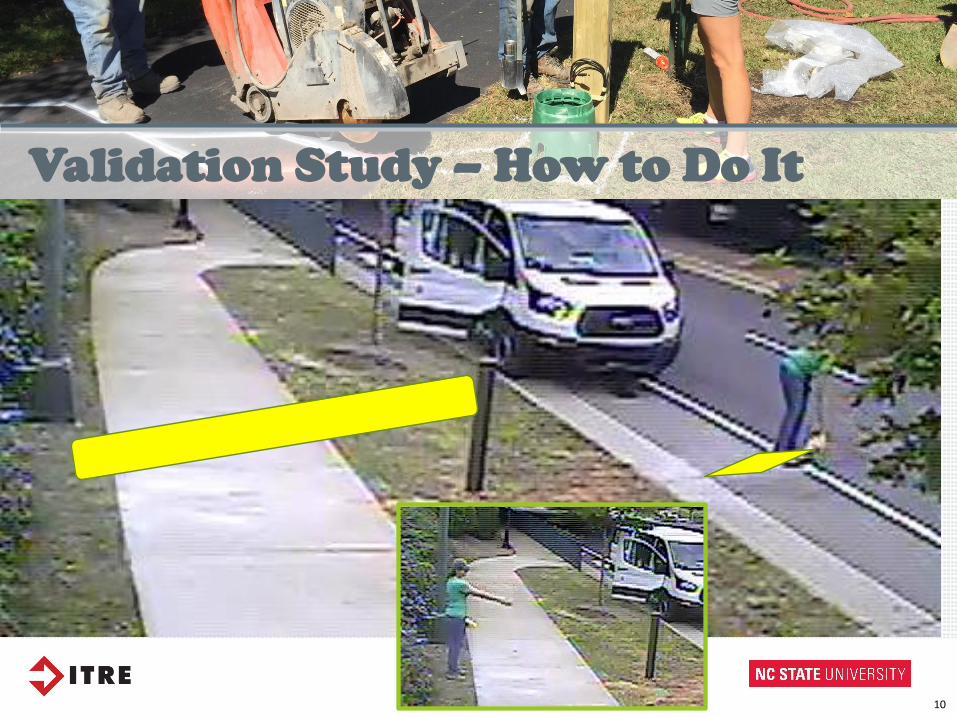
Validation Study – How to Do It
11
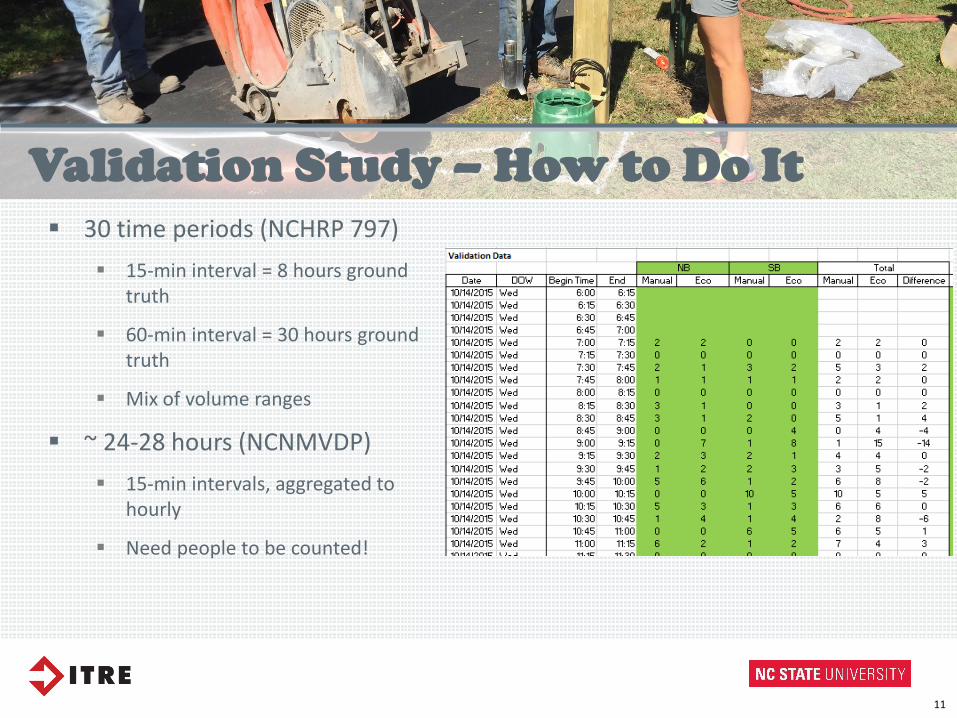
30 time periods (NCHRP 797)
15-min interval = 8 hours ground truth
60-min interval = 30 hours ground truth
Mix of volume ranges
~ 24-28 hours (NCNMVDP)
15-min intervals, aggregated to hourly
Need people to be counted!
Validation Study – How to Do It
12
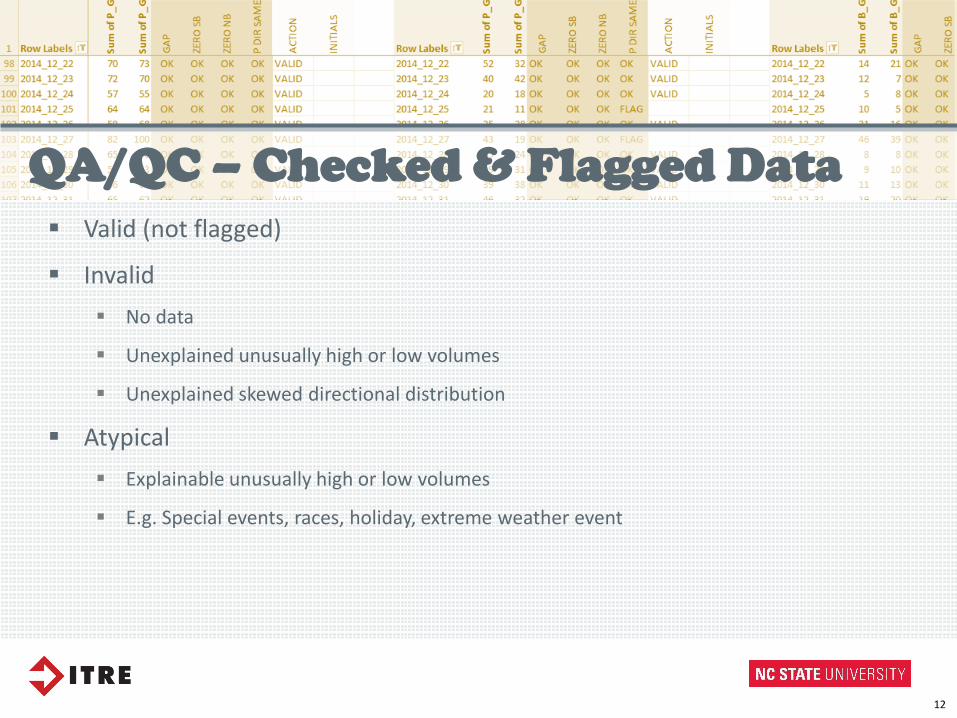
Valid (not flagged)
Invalid
No data
Unexplained unusually high or low volumes
Unexplained skewed directional distribution
Atypical
Explainable unusually high or low volumes
E.g. Special events, races, holiday, extreme weather event
QA/QC – Checked & Flagged Data
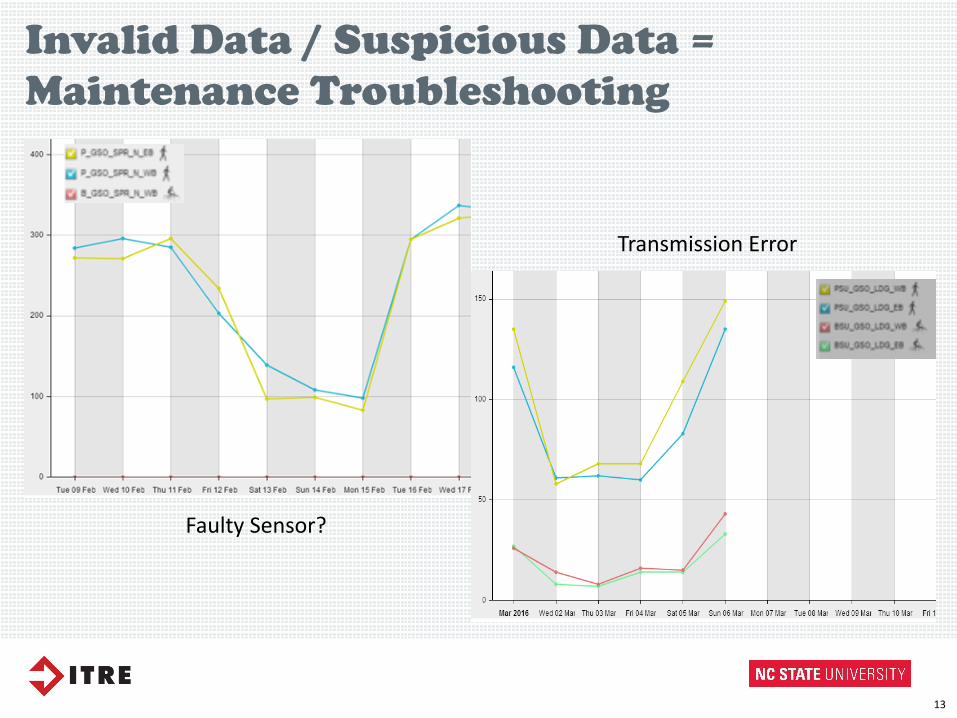
Invalid Data / Suspicious Data =
Maintenance Troubleshooting
13
Faulty Sensor?
Transmission Error
14
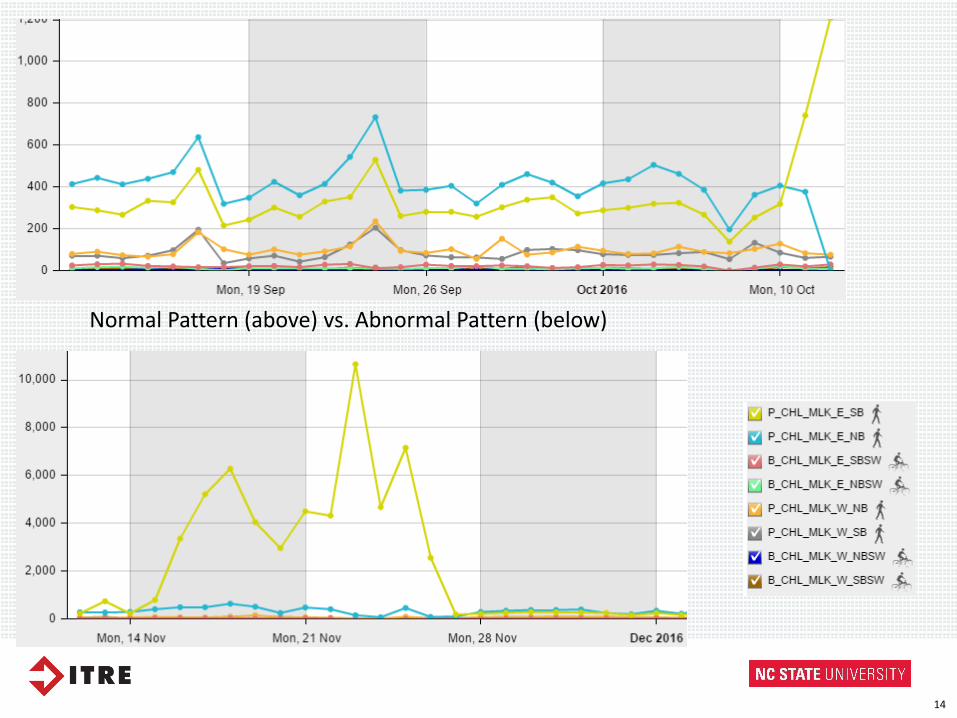
Normal Pattern (above) vs. Abnormal Pattern (below)
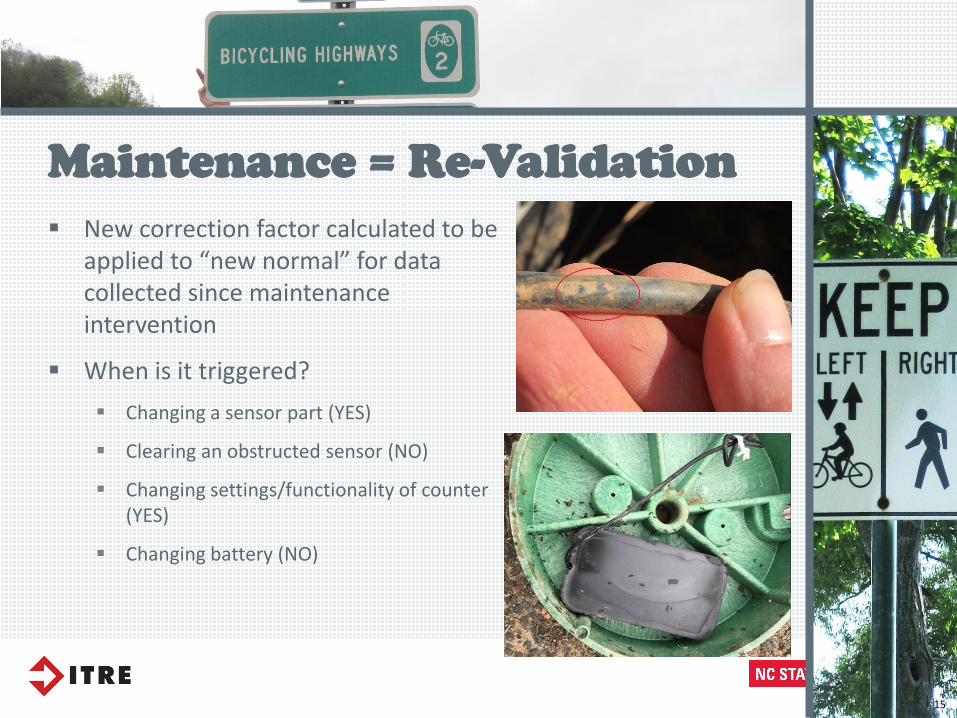
Maintenance = Re-Validation
New correction factor calculated to be applied to “new normal” for data collected since maintenance intervention
When is it triggered?
Changing a sensor part (YES)
Clearing an obstructed sensor (NO)
Changing settings/functionality of counter (YES)
Changing battery (NO)
15

16
Thank You!
itre.ncsu.edu/focus/bike-ped/nc-nmvdp/
SARAH O’BRIENProgram ManagerBicycle and Pedestrian [email protected]
INSTITUTE FOR TRANSPORTATION RESEARCH AND EDUCATION

Questions?
Archive at www.pedbikeinfo.org/webinarsDownload a video recording and presentation slides
Questions?
Krista Nordback [email protected]
Frank Proulx [email protected]
Sarah O’Brien [email protected]
General Inquiries [email protected]