Bike Plan Citywide Bike Count
26
City of San Francisco 2008 Bicycle Count Report December 2008
-
Upload
markmarketing -
Category
Documents
-
view
231 -
download
1
description
This was a document I edited for the Bicycle Coalition.
Transcript of Bike Plan Citywide Bike Count
City of San Francisco 2008 Bicycle Count Report
December 2008
Table of Contents List of Tables & Figures....................................................................... 1
Report Highlights................................................................................. 2
Introduction & Methodology................................................................. 3-4
Results................................................................................................. 5-9
A Note on Gas Prices.......................................................................... 10
Recommendations............................................................................... 11-14
Conclusions......................................................................................... 15
List of Appendices.......................................................................................... 16
Appendix A – Citywide Bicycle Count Locations Map........................ 17
Appendix B – Relative Volume Distribution......................................... 18
Appendix C – Rider Gender................................................................ 19
Appendix D – Helmet Use................................................................... 20
Appendix E – Sidewalk Riders……..................................................... 21
Appendix F – Wrong-way Riders........................................................ 22
Appendix G & H – Downtown and Non-downtown Cordon Counts... 23
Appendix I – Weather Data ……………............................................. 24
2008 Citywide Bicycle Counts Report San Francisco Municipal Transportation Agency
1
List of Tables and Figures Table 1. Existing measures of Bicycle Ridership in San Francisco Table 2. 2008 Total Volumes with 2006 & 2007 Total Volumes Comparison Table 3. Locations with statistically significant increases in PM Peak Volumes (2007-08) Table 4. Locations with statistically significant increases in PM Peak Volumes (2006-08) Table 5. Rider Gender (2006-08) Table 6. Helmet Use (2006-08) Table 7. Number of High Volume Locations by Year Figure 1. San Francisco Bicycle Counts (2006-08) Figure 2. Average Retail Gas Prices in San Francisco & California (2006-08)
2008 Citywide Bicycle Counts Report San Francisco Municipal Transportation Agency
2
Report Highlights
2,395 2,651 3,375
3,105 3,683
4,509
-
1,000
2,000
3,000
4,000
5,000
6,000
7,000
8,000
9,000
2006 2007 2008
Num
ber o
f bic
yclis
ts
Year
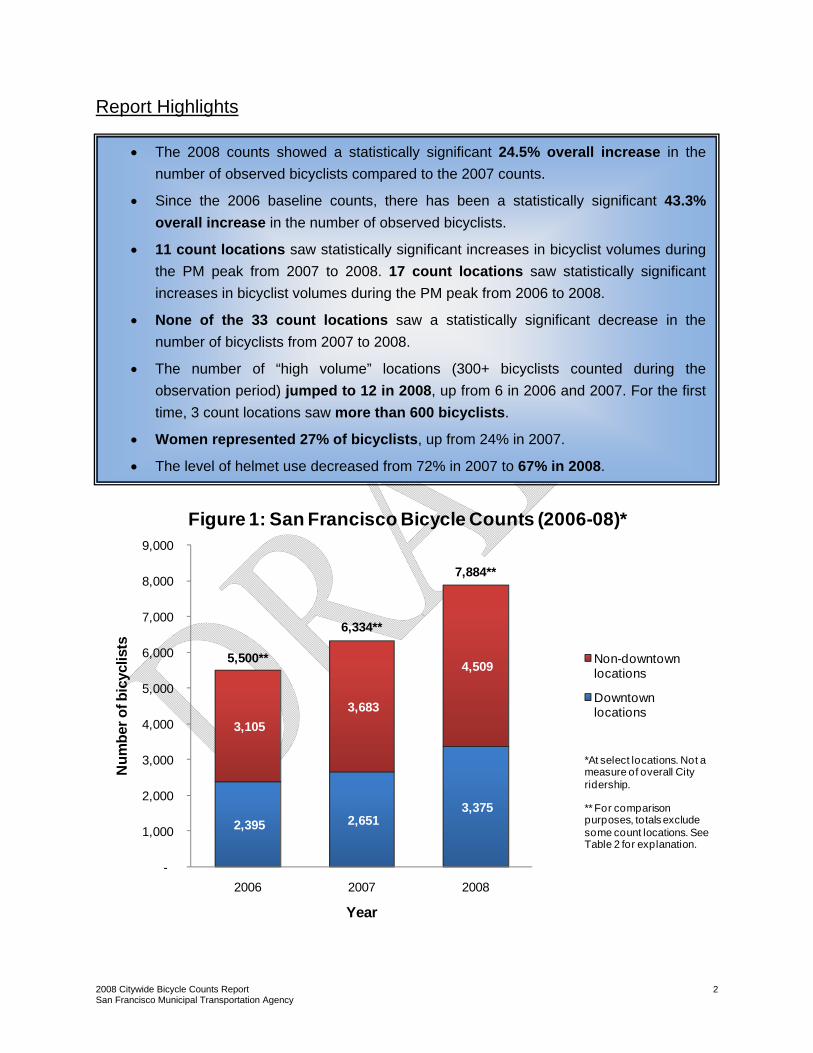
Figure 1: San Francisco Bicycle Counts (2006-08)*
Non-downtown locations
Downtown locations
5,500**
7,884**
6,334**
*At select locations. Not a measure of overall City ridership.
** For comparison purposes, totals excludesome count locations. See Table 2 for explanation.
• The 2008 counts showed a statistically significant 24.5% overall increase in the number of observed bicyclists compared to the 2007 counts.
• Since the 2006 baseline counts, there has been a statistically significant 43.3% overall increase in the number of observed bicyclists.
• 11 count locations saw statistically significant increases in bicyclist volumes during the PM peak from 2007 to 2008. 17 count locations saw statistically significant increases in bicyclist volumes during the PM peak from 2006 to 2008.
• None of the 33 count locations saw a statistically significant decrease in the number of bicyclists from 2007 to 2008.
• The number of “high volume” locations (300+ bicyclists counted during the observation period) jumped to 12 in 2008, up from 6 in 2006 and 2007. For the first time, 3 count locations saw more than 600 bicyclists.
• Women represented 27% of bicyclists, up from 24% in 2007.
• The level of helmet use decreased from 72% in 2007 to 67% in 2008.
2008 Citywide Bicycle Counts Report San Francisco Municipal Transportation Agency
3
Introduction In August 2006, the SFMTA Bicycle Program conducted its first citywide bicycle count, with the goal of establishing a baseline of bicycling use around the City. In 2007 and 2008, the SFMTA conducted its second and third annual bicycle counts. By comparing the 2007 and 2008 data to the baseline 2006 data, the SFMTA has been able to identify and measure some basic trends in bicyclist ridership throughout San Francisco. Furthermore, the bicycle counts will inform the City's bicycle planning efforts, providing the data needed to evaluate the efficacy and efficiency of the City's bicycle network, as well as identifying locations where additional infrastructure improvements are needed. It is important to note, however, that the SFMTA bicycle counts are not meant to measure the exact number of people who bicycle in San Francisco, nor are they intended to determine travel mode splits. Identifying the exact level of bicycle ridership in San Francisco could be accomplished better through a combination of U.S. Census results, a representative survey of the City’s residents (see Table 1), and automatic bicycle counters1. These counts are instead designed to help identify basic trends in bicycle use over time.
Table 1: Existing measures of bicycle ridership in San Francisco S.F. CA U.S.
Percentage of trips to work by bicycle (2000 U.S. Census)*
2.1% 0.8% 0.4%
Percentage of trips to work by bicycle (2007 American Community Survey)*
2.7% 0.9% 0.5%
Estimated percentage of all trips by bicycle (2008)** 5.9%
Estimated daily number of bicycle trips (2008)** 128,000
* Does not include w orkers w ho w orked at home.
** The "2008 State of Cycling" report is an additional SFMTA report that estimates daily bicycle ridership and travel mode splits. Roughly 800 responses from phone and intercept surveys w ere used to to estimate that 128,000 bicycle trips are made each day in San Francisco, and that 5.9% of all trips in San Francisco are made by bicycle. Data from the SFMTA bicycle counts w as not used to determine these f igures. Go to w w w .sfmta.com/bikes to see the full results of the "2008 State of Cycling" report.
1 Please see discussion of automatic counters in the “Recommendations” section.
2008 Citywide Bicycle Counts Report San Francisco Municipal Transportation Agency
4
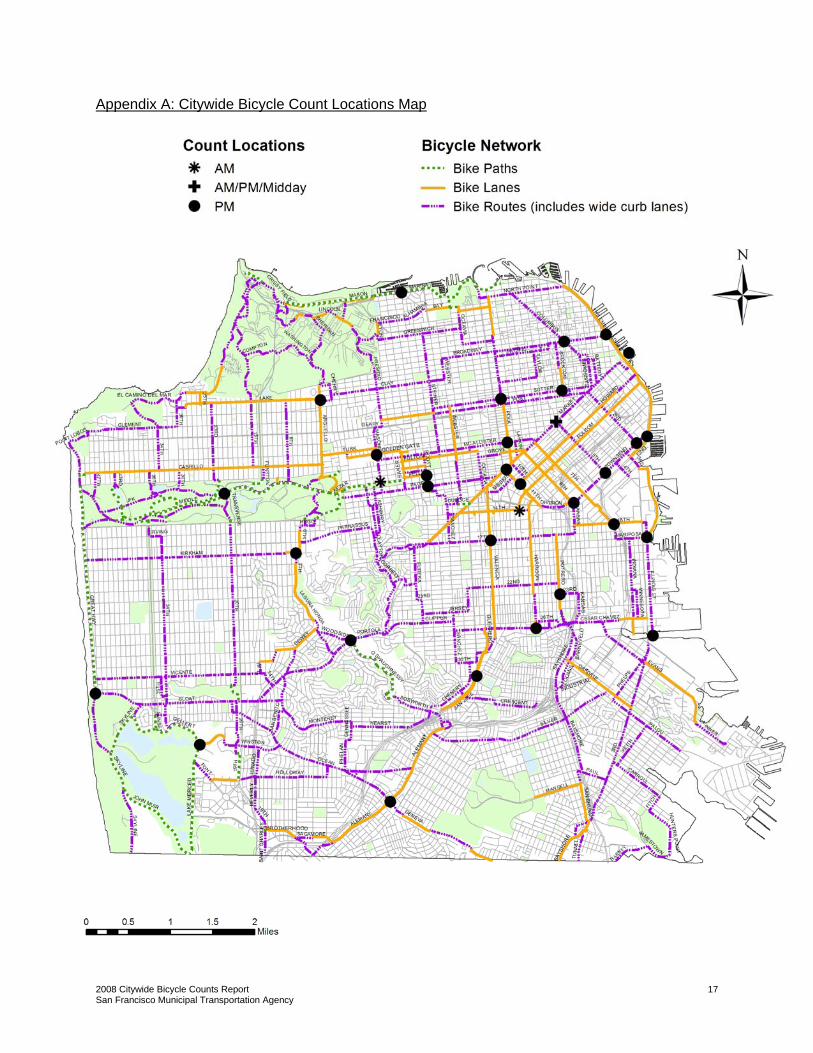
Methodology Since 2006 all of San Francisco's bicycle counts have been conducted in August due to the typically dry weather and longer days that generally encourage bicycling, as well as the availability of SFMTA summer interns to assist with the counts. September would be the ideal month2 for the bicycle counts as school would be in session, and variability in bicycle volumes, due to vacations, would be minimized. In addition, September is traditionally the month when many other U.S. cities conduct their bicycle counts. Unfortunately, most SFMTA interns have returned to school by September and available person-power is significantly diminished. While the volume counted in August might be slightly less than that of September, as long as consistency is maintained, a clear trend should be visible. All of the counts were performed manually by SFMTA staff. All observers attended an hour long training session prior to field observation. A total of 35 counts were conducted. The counts were conducted at 33 locations, with 31 counts occurring during the evening peak period, from 5:00-6:30 PM. Three counts took place in the morning peak period, from 8:00-9:00 AM, and one during the midday period, from 1:00-2:00 PM. Bicyclists at 5th and Market Streets were counted during all three periods. The evening peak period was chosen as the focus of the bicycle counts, as there is a better mix of trips than in the morning, where the majority of trips are work-related. Counts were only conducted during fair weather. A detailed weather report for the 2006-08 counts can be found in Appendix I. Counts were focused around the downtown core in order to capture the volume of bicycle commuters on some of the City’s most heavily used bicycle routes. Twelve of the thirty-three locations were counted simultaneously on August 14th as part of the downtown cordon count in order to capture travel in and out of the downtown core. A secondary cordon, established approximately midway across the City along key bicycle routes, was used to count cross-town riders. These counts were not conducted simultaneously, but were spaced out over a three week period. Lastly, some count locations were in outlying neighborhoods. Most count locations were at the intersection of two bicycle routes in order to maximize coverage of the City’s bicycle route network. A map of the count locations is shown in Appendix A. At each count location, bicyclists on all legs of an intersection were counted manually, with each movement noted – left turn, right turn, and straight through the intersection. Bicyclists riding on sidewalks were counted and grouped separately from cyclists riding on the street (Appendix E). Wrong-way riders were also counted (Appendix F). At locations where the volume was not so high as to demand all the attention of the observer3, helmet use and cyclist gender were also recorded (Appendices C & D, respectively). Locations for which portions of the data were not collected are noted in the appendices. 2 Please see discussion of September counts in the “Recommendations” section. 3 Please see discussion of "high volume" locations in the “Recommendations” section.
2008 Citywide Bicycle Counts Report San Francisco Municipal Transportation Agency
5
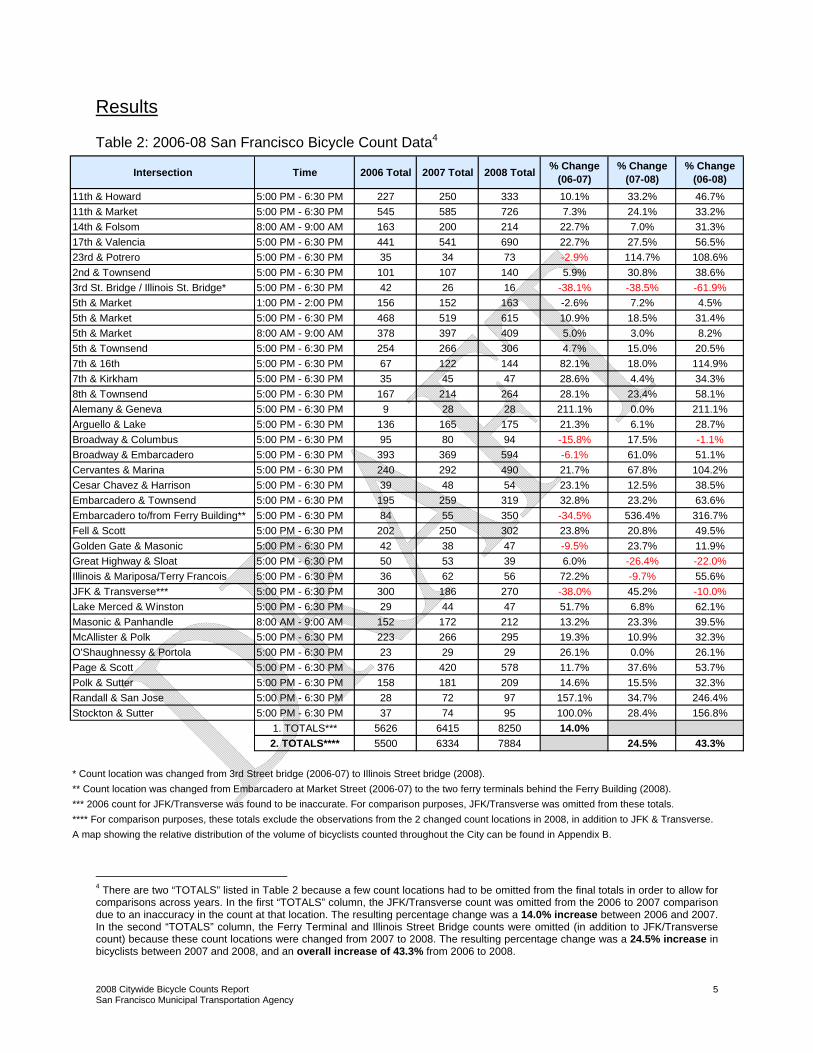
Results Table 2: 2006-08 San Francisco Bicycle Count Data4
4 There are two “TOTALS” listed in Table 2 because a few count locations had to be omitted from the final totals in order to allow for comparisons across years. In the first “TOTALS” column, the JFK/Transverse count was omitted from the 2006 to 2007 comparison due to an inaccuracy in the count at that location. The resulting percentage change was a 14.0% increase between 2006 and 2007. In the second “TOTALS” column, the Ferry Terminal and Illinois Street Bridge counts were omitted (in addition to JFK/Transverse count) because these count locations were changed from 2007 to 2008. The resulting percentage change was a 24.5% increase in bicyclists between 2007 and 2008, and an overall increase of 43.3% from 2006 to 2008.
Intersection Time 2006 Total 2007 Total 2008 Total % Change (06-07)
% Change (07-08)
% Change (06-08)
11th & Howard 5:00 PM - 6:30 PM 227 250 333 10.1% 33.2% 46.7%11th & Market 5:00 PM - 6:30 PM 545 585 726 7.3% 24.1% 33.2%14th & Folsom 8:00 AM - 9:00 AM 163 200 214 22.7% 7.0% 31.3%17th & Valencia 5:00 PM - 6:30 PM 441 541 690 22.7% 27.5% 56.5%23rd & Potrero 5:00 PM - 6:30 PM 35 34 73 -2.9% 114.7% 108.6%2nd & Townsend 5:00 PM - 6:30 PM 101 107 140 5.9% 30.8% 38.6%3rd St. Bridge / Illinois St. Bridge* 5:00 PM - 6:30 PM 42 26 16 -38.1% -38.5% -61.9%5th & Market 1:00 PM - 2:00 PM 156 152 163 -2.6% 7.2% 4.5%5th & Market 5:00 PM - 6:30 PM 468 519 615 10.9% 18.5% 31.4%5th & Market 8:00 AM - 9:00 AM 378 397 409 5.0% 3.0% 8.2%5th & Townsend 5:00 PM - 6:30 PM 254 266 306 4.7% 15.0% 20.5%7th & 16th 5:00 PM - 6:30 PM 67 122 144 82.1% 18.0% 114.9%7th & Kirkham 5:00 PM - 6:30 PM 35 45 47 28.6% 4.4% 34.3%8th & Townsend 5:00 PM - 6:30 PM 167 214 264 28.1% 23.4% 58.1%Alemany & Geneva 5:00 PM - 6:30 PM 9 28 28 211.1% 0.0% 211.1%Arguello & Lake 5:00 PM - 6:30 PM 136 165 175 21.3% 6.1% 28.7%Broadway & Columbus 5:00 PM - 6:30 PM 95 80 94 -15.8% 17.5% -1.1%Broadway & Embarcadero 5:00 PM - 6:30 PM 393 369 594 -6.1% 61.0% 51.1%Cervantes & Marina 5:00 PM - 6:30 PM 240 292 490 21.7% 67.8% 104.2%Cesar Chavez & Harrison 5:00 PM - 6:30 PM 39 48 54 23.1% 12.5% 38.5%Embarcadero & Townsend 5:00 PM - 6:30 PM 195 259 319 32.8% 23.2% 63.6%Embarcadero to/from Ferry Building** 5:00 PM - 6:30 PM 84 55 350 -34.5% 536.4% 316.7%Fell & Scott 5:00 PM - 6:30 PM 202 250 302 23.8% 20.8% 49.5%Golden Gate & Masonic 5:00 PM - 6:30 PM 42 38 47 -9.5% 23.7% 11.9%Great Highway & Sloat 5:00 PM - 6:30 PM 50 53 39 6.0% -26.4% -22.0%Illinois & Mariposa/Terry Francois 5:00 PM - 6:30 PM 36 62 56 72.2% -9.7% 55.6%JFK & Transverse*** 5:00 PM - 6:30 PM 300 186 270 -38.0% 45.2% -10.0%Lake Merced & Winston 5:00 PM - 6:30 PM 29 44 47 51.7% 6.8% 62.1%Masonic & Panhandle 8:00 AM - 9:00 AM 152 172 212 13.2% 23.3% 39.5%McAllister & Polk 5:00 PM - 6:30 PM 223 266 295 19.3% 10.9% 32.3%O'Shaughnessy & Portola 5:00 PM - 6:30 PM 23 29 29 26.1% 0.0% 26.1%Page & Scott 5:00 PM - 6:30 PM 376 420 578 11.7% 37.6% 53.7%Polk & Sutter 5:00 PM - 6:30 PM 158 181 209 14.6% 15.5% 32.3%Randall & San Jose 5:00 PM - 6:30 PM 28 72 97 157.1% 34.7% 246.4%Stockton & Sutter 5:00 PM - 6:30 PM 37 74 95 100.0% 28.4% 156.8%
1. TOTALS*** 5626 6415 8250 14.0%2. TOTALS**** 5500 6334 7884 24.5% 43.3%
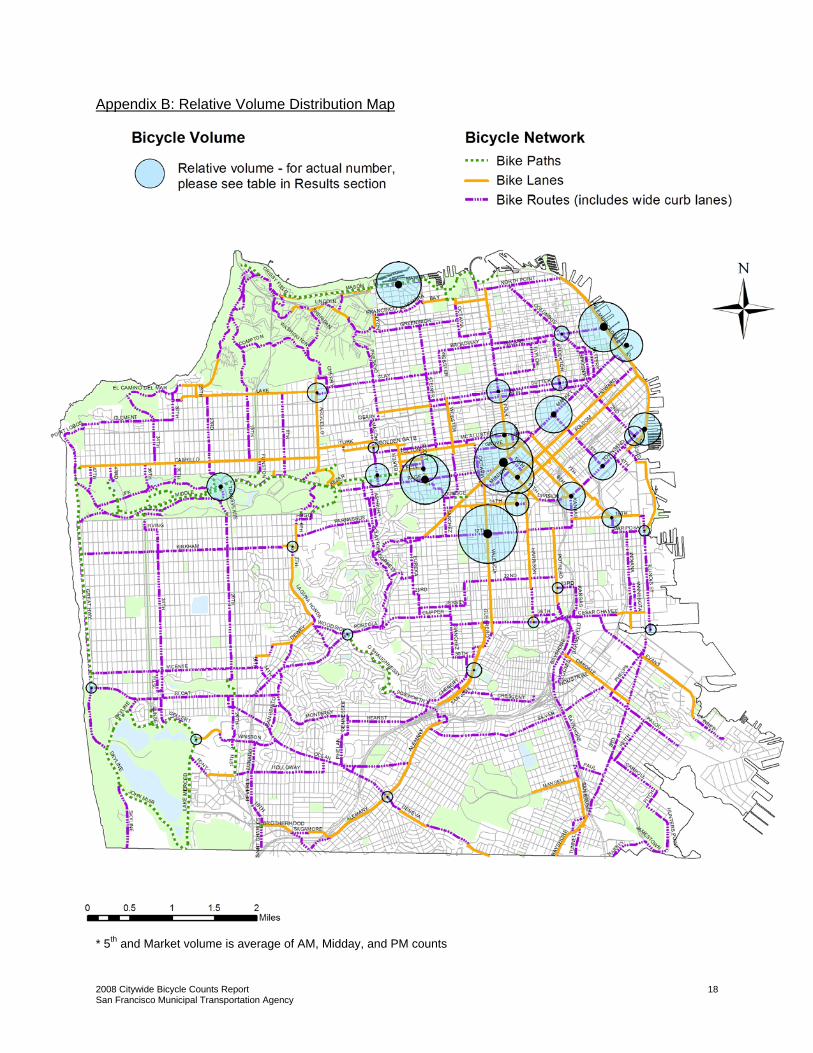
* Count location was changed from 3rd Street bridge (2006-07) to Illinois Street bridge (2008). ** Count location was changed from Embarcadero at Market Street (2006-07) to the two ferry terminals behind the Ferry Building (2008). *** 2006 count for JFK/Transverse was found to be inaccurate. For comparison purposes, JFK/Transverse was omitted from these totals.**** For comparison purposes, these totals exclude the observations from the 2 changed count locations in 2008, in addition to JFK & Transverse.A map showing the relative distribution of the volume of bicyclists counted throughout the City can be found in Appendix B.
2008 Citywide Bicycle Counts Report San Francisco Municipal Transportation Agency
6
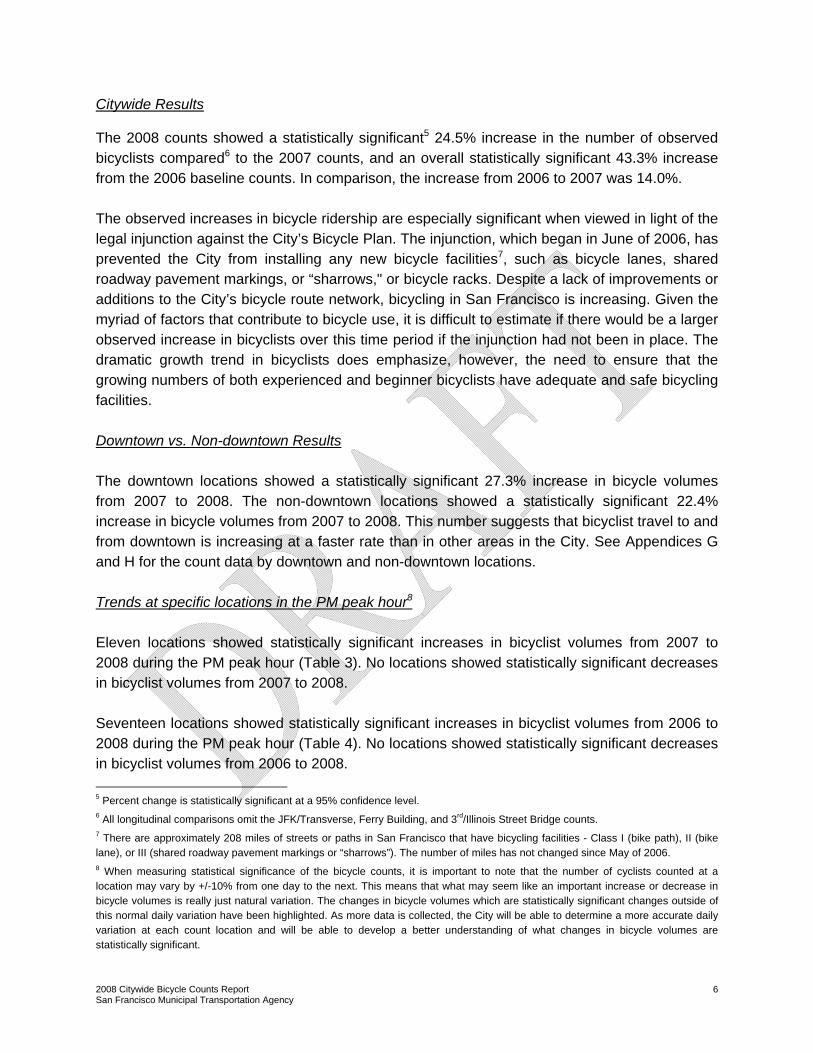
Citywide Results The 2008 counts showed a statistically significant5 24.5% increase in the number of observed bicyclists compared6 to the 2007 counts, and an overall statistically significant 43.3% increase from the 2006 baseline counts. In comparison, the increase from 2006 to 2007 was 14.0%. The observed increases in bicycle ridership are especially significant when viewed in light of the legal injunction against the City’s Bicycle Plan. The injunction, which began in June of 2006, has prevented the City from installing any new bicycle facilities7, such as bicycle lanes, shared roadway pavement markings, or “sharrows," or bicycle racks. Despite a lack of improvements or additions to the City’s bicycle route network, bicycling in San Francisco is increasing. Given the myriad of factors that contribute to bicycle use, it is difficult to estimate if there would be a larger observed increase in bicyclists over this time period if the injunction had not been in place. The dramatic growth trend in bicyclists does emphasize, however, the need to ensure that the growing numbers of both experienced and beginner bicyclists have adequate and safe bicycling facilities. Downtown vs. Non-downtown Results The downtown locations showed a statistically significant 27.3% increase in bicycle volumes from 2007 to 2008. The non-downtown locations showed a statistically significant 22.4% increase in bicycle volumes from 2007 to 2008. This number suggests that bicyclist travel to and from downtown is increasing at a faster rate than in other areas in the City. See Appendices G and H for the count data by downtown and non-downtown locations. Trends at specific locations in the PM peak hour8 Eleven locations showed statistically significant increases in bicyclist volumes from 2007 to 2008 during the PM peak hour (Table 3). No locations showed statistically significant decreases in bicyclist volumes from 2007 to 2008. Seventeen locations showed statistically significant increases in bicyclist volumes from 2006 to 2008 during the PM peak hour (Table 4). No locations showed statistically significant decreases in bicyclist volumes from 2006 to 2008. 5 Percent change is statistically significant at a 95% confidence level. 6 All longitudinal comparisons omit the JFK/Transverse, Ferry Building, and 3rd/Illinois Street Bridge counts. 7 There are approximately 208 miles of streets or paths in San Francisco that have bicycling facilities - Class I (bike path), II (bike lane), or III (shared roadway pavement markings or “sharrows”). The number of miles has not changed since May of 2006. 8 When measuring statistical significance of the bicycle counts, it is important to note that the number of cyclists counted at a location may vary by +/-10% from one day to the next. This means that what may seem like an important increase or decrease in bicycle volumes is really just natural variation. The changes in bicycle volumes which are statistically significant changes outside of this normal daily variation have been highlighted. As more data is collected, the City will be able to determine a more accurate daily variation at each count location and will be able to develop a better understanding of what changes in bicycle volumes are statistically significant.
2008 Citywide Bicycle Counts Report San Francisco Municipal Transportation Agency
7
Table 3: Locations with statistically significant increases in PM Peak Hour Volumes (2007-08)
2007 PM Peak Volumes
2008 PM Peak Volumes
% change
11th & Market 419 522 24.6%11th & Howard 173 232 34.1%8th & Townsend 149 191 28.2%Embarcadero & Townsend 180 240 33.3%Embarcadero & Broadway 326 458 40.5%5th & Market 322 443 37.6%17th & Valencia 360 485 34.7%23rd & Potrero 27 50 85.2%Randall & San Jose 49 76 55.1%Scott & Page 286 418 46.2%Marina & Cervantes 197 352 78.7% Table 4: Locations with statistically significant increases in PM Peak Hour Volumes (2006-08)
2006 PM Peak Volumes
2008 PM Peak Volumes
% change
11th & Market 390 522 33.8%11th & Howard 156 232 48.7%8th & Townsend 123 191 55.3%Embarcadero & Townsend 131 240 83.2%Embarcadero & Broadway 236 458 94.1%Sutter & Stockton 32 69 115.6%Polk & McAllister 169 214 26.6%5th & Market 314 443 41.1%7th & 16th 59 105 78.0%Illinois & Mariposa/T.F. 26 43 65.4%17th & Valencia 325 485 49.2%23rd & Potrero 24 50 108.3%Randall & San Jose 24 76 216.7%Scott & Fell 147 222 51.0%Scott & Page 292 418 43.2%Geneva & Alemany 8 22 175.0%Marina & Cervantes 183 352 92.3%
2008 Citywide Bicycle Counts Report San Francisco Municipal Transportation Agency
8
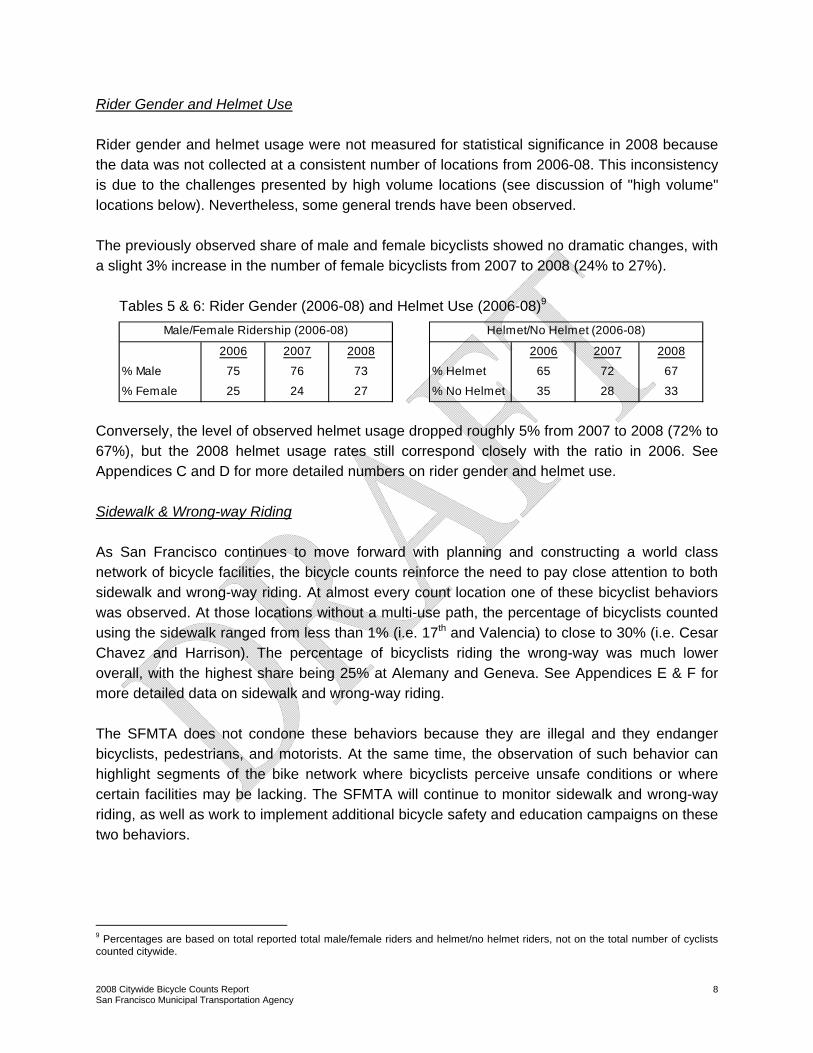
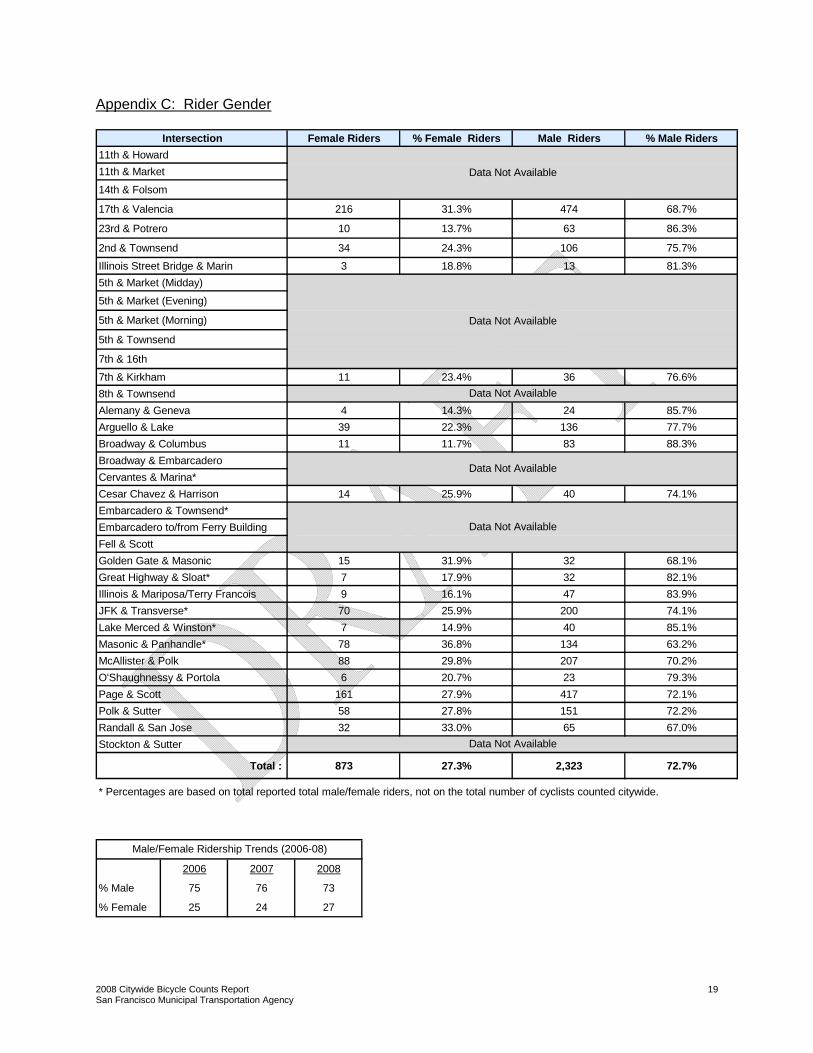
Rider Gender and Helmet Use Rider gender and helmet usage were not measured for statistical significance in 2008 because the data was not collected at a consistent number of locations from 2006-08. This inconsistency is due to the challenges presented by high volume locations (see discussion of "high volume" locations below). Nevertheless, some general trends have been observed. The previously observed share of male and female bicyclists showed no dramatic changes, with a slight 3% increase in the number of female bicyclists from 2007 to 2008 (24% to 27%). Tables 5 & 6: Rider Gender (2006-08) and Helmet Use (2006-08)9
2006 2007 2008
% Male 75 76 73
% Female 25 24 27
Male/Female Ridership (2006-08)
2006 2007 2008
% Helmet 65 72 67
% No Helmet 35 28 33
Helmet/No Helmet (2006-08)
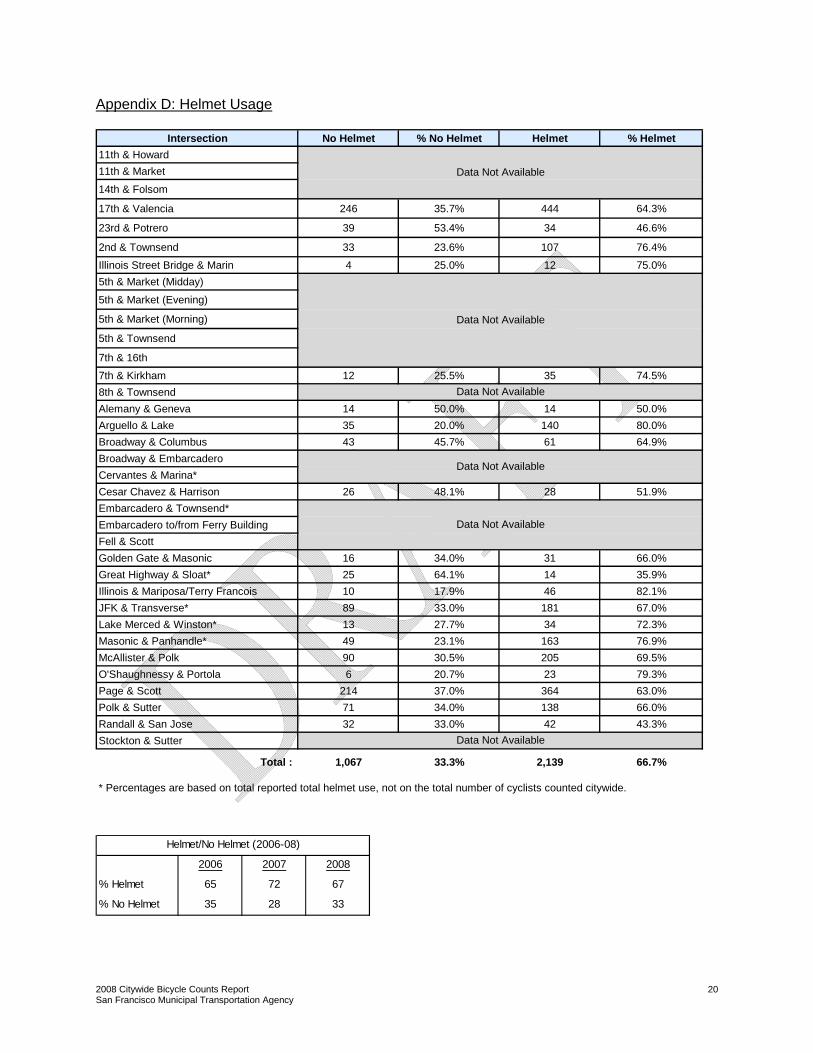
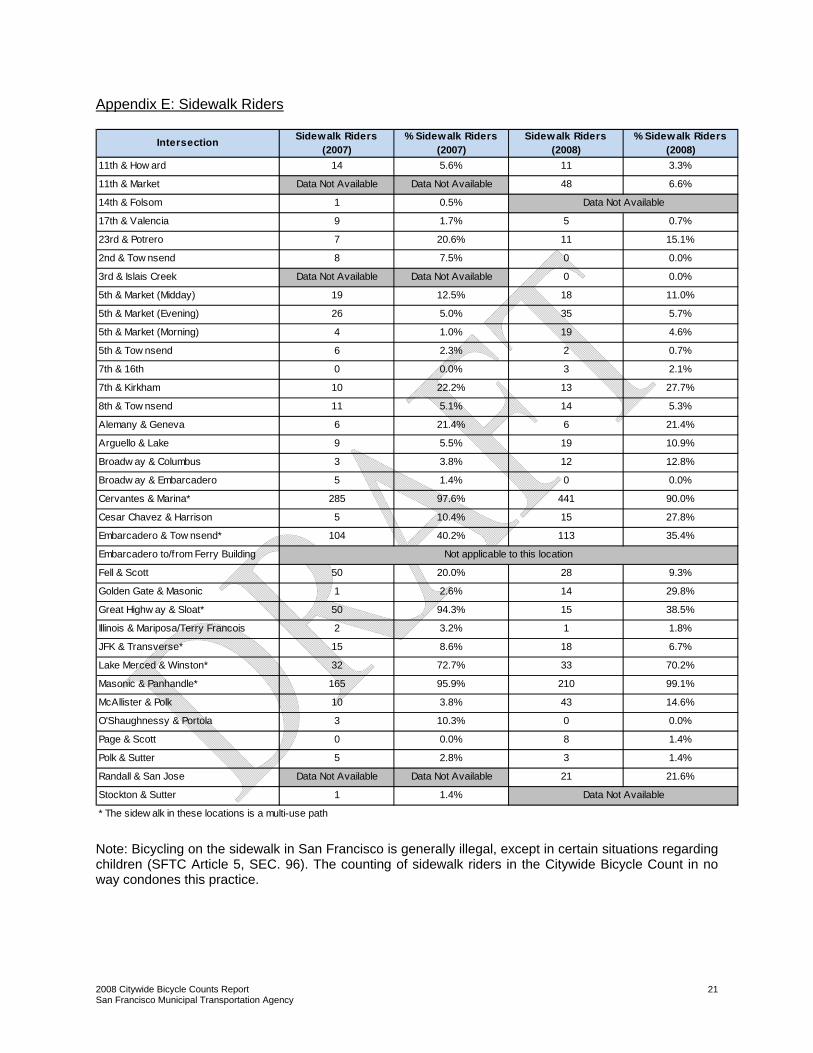
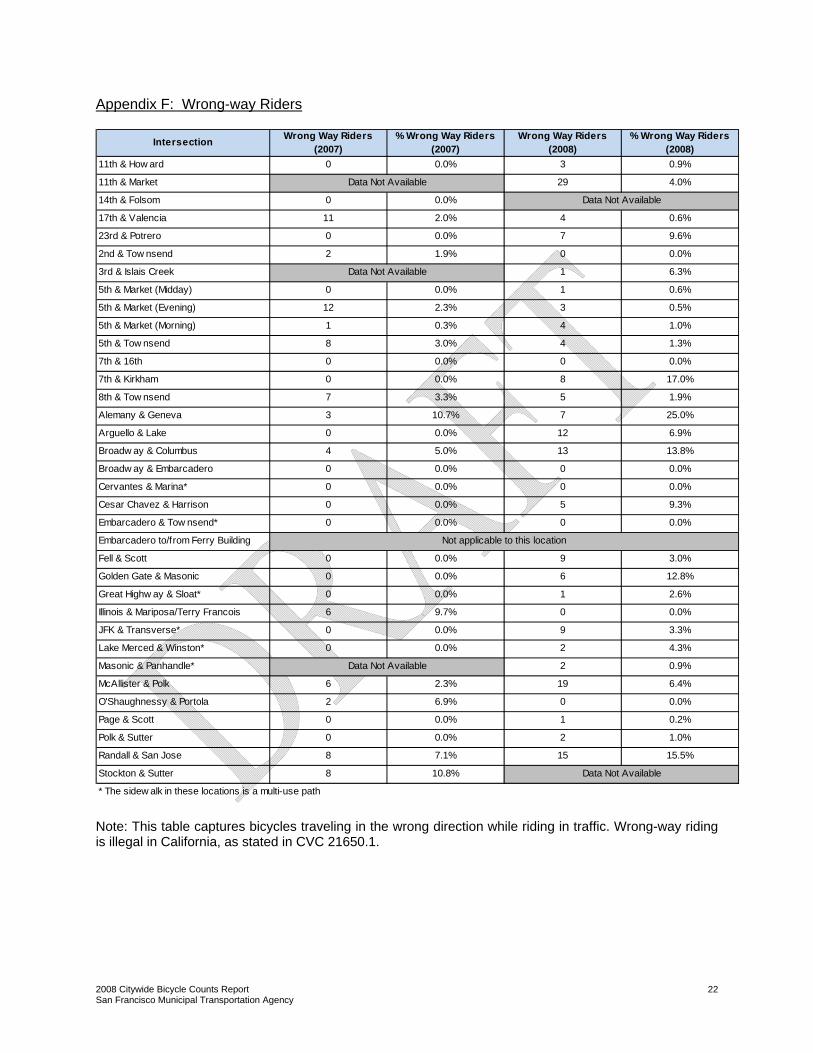
Conversely, the level of observed helmet usage dropped roughly 5% from 2007 to 2008 (72% to 67%), but the 2008 helmet usage rates still correspond closely with the ratio in 2006. See Appendices C and D for more detailed numbers on rider gender and helmet use. Sidewalk & Wrong-way Riding As San Francisco continues to move forward with planning and constructing a world class network of bicycle facilities, the bicycle counts reinforce the need to pay close attention to both sidewalk and wrong-way riding. At almost every count location one of these bicyclist behaviors was observed. At those locations without a multi-use path, the percentage of bicyclists counted using the sidewalk ranged from less than 1% (i.e. 17th and Valencia) to close to 30% (i.e. Cesar Chavez and Harrison). The percentage of bicyclists riding the wrong-way was much lower overall, with the highest share being 25% at Alemany and Geneva. See Appendices E & F for more detailed data on sidewalk and wrong-way riding. The SFMTA does not condone these behaviors because they are illegal and they endanger bicyclists, pedestrians, and motorists. At the same time, the observation of such behavior can highlight segments of the bike network where bicyclists perceive unsafe conditions or where certain facilities may be lacking. The SFMTA will continue to monitor sidewalk and wrong-way riding, as well as work to implement additional bicycle safety and education campaigns on these two behaviors.
9 Percentages are based on total reported total male/female riders and helmet/no helmet riders, not on the total number of cyclists counted citywide.
2008 Citywide Bicycle Counts Report San Francisco Municipal Transportation Agency
9
Further discussion of noteworthy count locations
• Illinois Street Bridge: In 2008, the count at the 3rd Street Bridge was moved to the Illinois Street Bridge in order to capture ridership on this newly constructed facility. It should be noted that a number of bicyclists were observed still using the 3rd Street Bridge. While the Illinois Street Bridge offers better facilities for bicyclists, Bicycle Route 5 has not yet been realigned and it is possible that many bicyclists are not aware that the Illinois Street Bridge is open to bicyclists. Finally, as noted in the 2007 report, the recently opened T-Third Street Muni streetcar line might have permanently absorbed some bicycle ridership from this area to and from downtown. Future bicycle counts might want to plan for simultaneous counts on these two facilities to better observe ridership trends in this corridor.
• Ferry Terminals: In 2008, the count at Embarcadero and Market was moved to the two ferry terminals located behind the Ferry Building in order to better capture the number of bicyclists commuting into the City via ferries. It was observed that a large percentage of the 350 counted bicyclists at the ferry terminals had rental bikes, indicating that this is also a popular route for tourists.
• Illinois Street & Mariposa/Terry A. Francois Boulevard: The decrease in bicycle volumes at this location from 2007 to 2008 was not found to be statistically significant.
• Great Highway & Sloat: The decrease in bicycle volumes at this location from 2007 to 2008 was not found to be statistically significant.
• Cesar Chavez & Harrison: Cesar Chavez serves as one of the City’s major automobile corridors given its connection to Highway 101. Despite the high vehicular speeds on this street, the number of bicyclists counted at this location has increased since 2006. At the same time, the observers at this location have consistently noticed that a large number of bicyclists ride on 26th Street and Alabama Street, the streets that run parallel to Cesar Chavez and Harrison Street, respectively. Projects 5-5 and 5-610 in the City’s Bicycle Plan propose significant changes to this roadway, including the addition of bicycle lanes. Future observations should consider simultaneous counts at these parallel locations to better monitor bicyclist travel throughout this corridor.
10 Please go to www.sfmta.com/bikes for more information on these specific projects.
2008 Citywide Bicycle Counts Report San Francisco Municipal Transportation Agency
10
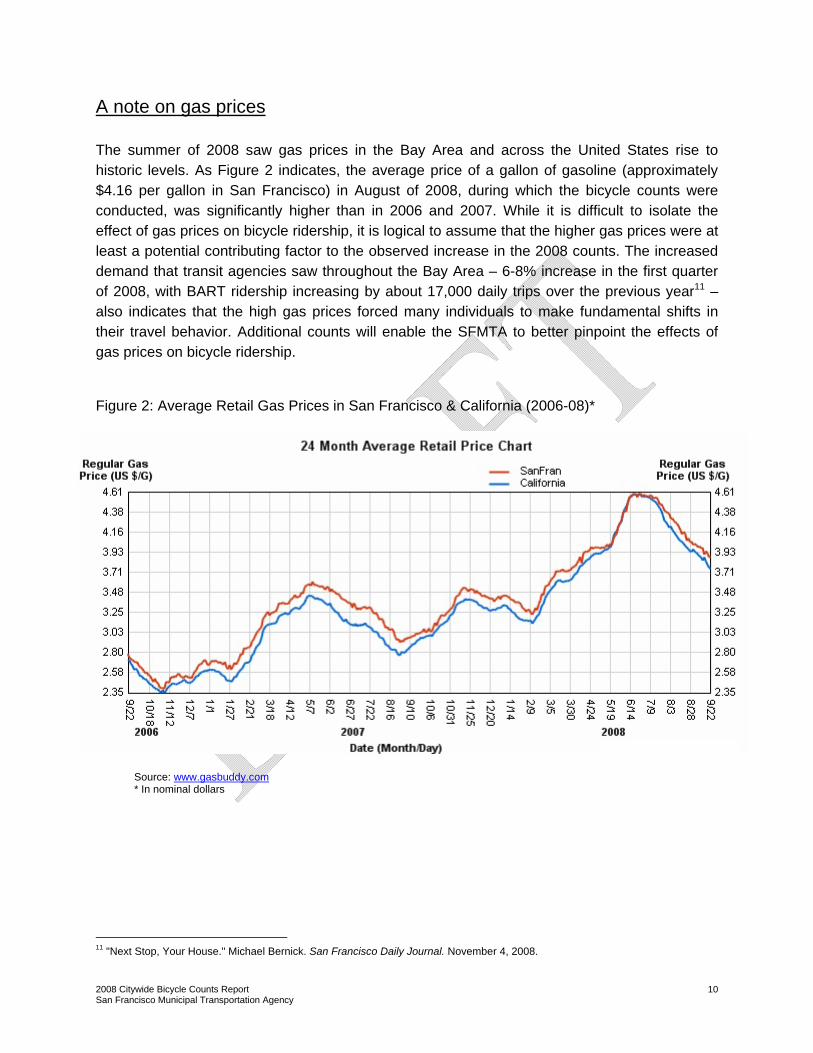
A note on gas prices The summer of 2008 saw gas prices in the Bay Area and across the United States rise to historic levels. As Figure 2 indicates, the average price of a gallon of gasoline (approximately $4.16 per gallon in San Francisco) in August of 2008, during which the bicycle counts were conducted, was significantly higher than in 2006 and 2007. While it is difficult to isolate the effect of gas prices on bicycle ridership, it is logical to assume that the higher gas prices were at least a potential contributing factor to the observed increase in the 2008 counts. The increased demand that transit agencies saw throughout the Bay Area – 6-8% increase in the first quarter of 2008, with BART ridership increasing by about 17,000 daily trips over the previous year11 – also indicates that the high gas prices forced many individuals to make fundamental shifts in their travel behavior. Additional counts will enable the SFMTA to better pinpoint the effects of gas prices on bicycle ridership. Figure 2: Average Retail Gas Prices in San Francisco & California (2006-08)*
Source: www.gasbuddy.com * In nominal dollars
11 "Next Stop, Your House." Michael Bernick. San Francisco Daily Journal. November 4, 2008.
2008 Citywide Bicycle Counts Report San Francisco Municipal Transportation Agency
11
Recommendations Recommendations from Alta Planning + Design As part of the "2008 State of Cycling” report authored by Alta Planning + Design, a review of SFMTA’s bicycle count program was undertaken. Several key recommendations from that report are listed below:
• Collect traffic data at all bicycle count locations. One of the key long-term goals of the SFMTA bicycle counts is to assess the effectiveness of bicycle infrastructure and program improvements in encouraging greater levels of cycling. In order to understand the true cause of an apparent increase in bicycle volumes, it is critical to identify whether or not an increase in bicycle volumes is an artifact of overall increases in transportation use or whether it is due to some other external factor controlled by SFMTA. Percent changes in motor vehicle traffic counts are used as one proxy for comparing changes in overall transportation use to changes in bicycle use.
• SFMTA should work with BART, AC Transit, and Golden Gate Transit to collect bicycle use data at adjacent ferry terminals and stations. Transit is a key destination in trip-linking cycling and transit for the purpose of regional travel. While the count effort is concerned primarily with local bicycle travel within San Francisco, it is important to understand the role bike-to-transit plays in bicycle volumes.
• SFMTA should work with bicycle messenger companies or the San Francisco Bicycle Messenger Association (SFBMA) to maintain data about numbers of messengers operating and typical routes. While commuters must make a trip choice based on a variety of different possible modes, bicycle messengers are professional riders whose trip choice does not vary. For this reason, volumes of bicycle messengers are likely to change based on other socio-economic factors rather than external factors controlled by SFMTA. Understanding the level of bicycle courier use in downtown San Francisco could lead to a more accurate understanding of changes in bicycle volumes in that area.
• SFMTA should work with bicycle rental companies to maintain data about numbers of rentals and routes selected by users. This data would allow a more specific analysis of the impact of bicycle rentals on the bicycle volumes at select locations, such as the Ferry Terminals.
Make the transition to September bicycle counts The National Bicycle and Pedestrian Documentation Project (NBPD) is an annual bicycle and pedestrian count and survey effort sponsored by the Institute of Transportation Engineers Pedestrian and Bicycle Council. It seeks to establish a standardized bicycle and pedestrian count methodology and disseminate this methodology to cities across the country. The ultimate
2008 Citywide Bicycle Counts Report San Francisco Municipal Transportation Agency
12
goal is to develop a national database of count information that will provide bicycle and pedestrian planners with crucial data to support their work. The NBPD has established September as the ideal month for conducting bicycle and pedestrian counts given the mild weather conditions and less variability due to summer vacations. Conducting bicycle counts in September, however, has been a great challenge for the SFMTA. The bicycle counts require a tremendous amount of manpower – roughly 20 part-time counters and one full-time staff member to coordinate the counts, compile the data, and write the report. As a result, the SFMTA has relied heavily on its summer intern program to support the bicycle counts, and, unfortunately, most of the summer interns have returned to school by September. While the 2006-08 bicycle counts, conducted thus far in August, have been extremely valuable, it is recommended that SFMTA make the transition to September bicycle counts in order to maximize the benefits of the NBPD. This transition will be made easier with SFMTA’s pilot program to install automatic bicycle counters in 2008-09 (see discussion below). Only about 15 of the 33 count locations, however, will be covered by the initial automatic bicycle counters project. Therefore, manual counts will still be required for at least the next year or two. One potential solution to the “manpower” issue in September is for the SFMTA to hire temporary workers to supplement the gaps left by departing interns. The SFMTA is currently assessing the costs of hiring temporary counters in September. This investment will not only strengthen the SFMTA’s bicycle count effort, but also enable San Francisco to incorporate its data into the NBPD database. Maintain high training standards for summer interns In the meantime, it is recommended that the citywide bicycle count continue to be officially incorporated into the MTA Summer Intern Program. All supervisors and interns should be aware of the count, and interns should continue to have it assigned as one of their required tasks for the summer. Thorough training of summer interns should continue to ensure that each counter understands the proper techniques for counting bicycles. Ensure SFMTA methodology is compatible with national bicycle count efforts The SFMTA has been careful to ensure that its bicycle counts follow bicycle count best practices and a consistent methodology. Nevertheless, it is recommended that the SFMTA thoroughly review, and incorporate in future counts, the methodology put forth by the NBPD. For example, the NBPD has disseminated sample count forms, surveys, and tabulation methodologies. The SFMTA should further integrate these best practices to ensure consistency with national standards.
2008 Citywide Bicycle Counts Report San Francisco Municipal Transportation Agency
13
Count Locations After three successive counts, many of the "locational" challenges have been managed. The proposed location changes from 2007 (Illinois Street Bridge and ferry terminals) were implemented and it appears that they will provide more meaningful observations. As suggested above, however, certain locations, such as Illinois Street Bridge and Cesar Chavez/Harrison, might benefit from simultaneous counts on parallel streets. Bicyclists appear to be avoiding certain designated bicycle routes and simultaneous counts might provide better insights as to the reasons why. Furthermore, as bicycle facilities are constructed post-injunction, simultaneous counts might illustrate the full impact of the Bicycle Plan’s targeted infrastructure investments. Locations adjacent to the Mission Bay Development project should also be monitored closely as the counts may be influenced by the completion of this major development project. Counts at Townsend at 5th Street, 2nd Street and the Embarcadero, as well as at 7th Street and 16th Street, Illinois Street and Mariposa Street, and Illinois Street Bridge should be tracked carefully as this project progresses. As potential bicycle volumes in the area grow, it may be necessary to relocate or add count locations outside the area of influence of this development. Finally, special attention should continue to be paid to downtown locations, as they can be more problematic to count than periphery locations given their high volumes. Furthermore, due to close proximity to AT&T Park, bicycle counts can be distorted if they are conducted on days when a ballgame or other major event is scheduled. For consistency, counts should continue to not be taken on days when events are scheduled. High Volume Locations The 2008 counts reveal that bicycling is a growing mode of travel in San Francisco. While this trend is to be celebrated, the sheer volume at many of the count locations presents another set of challenges for the bicycle counts. As Table 7 shows, in 2008 there were 12 locations where more than 300 bicyclists were counted during the 1 to 1.5 hour observation period.
Table 7: Number of High Volume Locations by Year
# of Bicyclists 2006 2007 2008
300+ 6* 6 12
500+ 1 3 5
600+ 0 0 3
* Total excludes inaccurate JFK/Transverse count As part of the SFMTA count methodology, locations with more than 300 bicyclists all require the use of "click-counters." The high volumes at these locations, however, may be greater than the observational capacity of even the best counter. Furthermore, at these locations it is all but
2008 Citywide Bicycle Counts Report San Francisco Municipal Transportation Agency
14
impossible for the observer(s) to gather much of the “auxiliary” rider data (gender, helmet use, etc.) that provides another useful dimension to the data. As the number of 300+ locations rise, the chance for counting error increases, while the amount of “auxiliary” data that is gathered decreases. One solution to this problem is to increase the number of counters per location, but with limited manpower, that is not necessarily practical. Another potential solution is automatic bicycle counters, but automatic counters will never be able to capture rider gender or helmet use. Future organizers of the citywide bicycle count should continue to consult past volumes to determine the utilization of click-counters, as well as where to potentially allocate additional counters. Automatic Bicycle Counters While the manual citywide bicycle counts have allowed the SFMTA to identify various bicycling trends, they ultimately only produce a snapshot view of bicycling in the San Francisco. In order to address many of the limitations of the manual counts, and to provide continuous data of bicycle ridership throughout the City, the SFMTA is currently working to install automatic bicycle counters at the 33 count locations. Automatic bicycle counters are a proven technology that provides a continuous stream of ridership data in a fast, cost-effective, and safe manner. In late 2008 and early 2009, the SFMTA will be conducting a pilot test of ZELT Inductive Loop Counters12 at select locations throughout the City. Inductive loop counters are installed 1-3 inches below the road surface, and each time a bicycle goes over the loop, the system detects the bicycle's electromagnetic signature and registers a count. These counters are invisible to the public and designed to be able to distinguish between bicyclists and other users of the street, such as automobiles or pedestrians. Furthermore, they require minimal maintenance, as their batteries last for roughly ten years. Depending on the pilot test results, the SFMTA hopes to install the first round of 30 counters at 15 locations in mid to late 2009. The main drawback of the automatic bicycle counters is their inability to detect rider gender, helmet usage, or other forms of bicyclist behavior. It is recommended that the SFMTA continue to utilize manual counts on systematic basis to not only monitor rider gender, helmet usage, and ground conditions at the locations, but to also validate the automatic counts. 12 See www.eco-compteur.com for more information.
2008 Citywide Bicycle Counts Report San Francisco Municipal Transportation Agency
15
Conclusion The 2008 Citywide Bicycle Count was successful in its goal of capturing a sample of bicycle use across the City. While it is difficult to make specific conclusions about bicycle use or patterns from the bicycle counts, it is possible to make general observations. The recorded increase in volume of 24.5% percent over the 2007 count, and 43.3% over the 2006 count, indicates that bicycling in San Francisco is on the rise. As future counts are done, and additional data from the automatic bicycle counters becomes available, it will be possible to remark more conclusively on specific trends at certain locations and throughout San Francisco. The citywide bicycle count is an evolving project, one with a core foundation of established techniques and a consistent methodology. However, new lessons will continue to be learned. It is important to make changes and improvements in the counts when circumstances warrant. In the future, new locations may be added, and the methodology may further be refined. As long as a careful eye is directed towards consistency, the goal of capturing bicycle use trends in San Francisco will be met.
2008 Citywide Bicycle Counts Report San Francisco Municipal Transportation Agency
16
Appendices
Appendix A……………................... Citywide Bicycle Count Locations Map
Appendix B……………................... Relative Volume Distribution Map
Appendix C……………................... Rider Gender
Appendix D……………................... Helmet Use
Appendix E……………................... Sidewalk Riders
Appendix F……………................... Wrong-way Riders
Appendix G & H………................... Downtown & Non-downtown Cordon Counts
Appendix I……………................... Weather Data
2008 Citywide Bicycle Counts Report San Francisco Municipal Transportation Agency
17
Appendix A: Citywide Bicycle Count Locations Map
2008 Citywide Bicycle Counts Report San Francisco Municipal Transportation Agency
18
Appendix B: Relative Volume Distribution Map * 5th and Market volume is average of AM, Midday, and PM counts
2008 Citywide Bicycle Counts Report San Francisco Municipal Transportation Agency
19
Appendix C: Rider Gender
2006 2007 2008
% Male 75 76 73
% Female 25 24 27
Male/Female Ridership Trends (2006-08)
Intersection Female Riders % Female Riders Male Riders % Male Riders11th & Howard11th & Market
14th & Folsom
17th & Valencia 216 31.3% 474 68.7%
23rd & Potrero 10 13.7% 63 86.3%
2nd & Townsend 34 24.3% 106 75.7%
Illinois Street Bridge & Marin 3 18.8% 13 81.3%5th & Market (Midday)
5th & Market (Evening)
5th & Market (Morning)
5th & Townsend
7th & 16th
7th & Kirkham 11 23.4% 36 76.6%8th & TownsendAlemany & Geneva 4 14.3% 24 85.7%Arguello & Lake 39 22.3% 136 77.7%Broadway & Columbus 11 11.7% 83 88.3%Broadway & EmbarcaderoCervantes & Marina*Cesar Chavez & Harrison 14 25.9% 40 74.1%Embarcadero & Townsend*Embarcadero to/from Ferry BuildingFell & ScottGolden Gate & Masonic 15 31.9% 32 68.1%Great Highway & Sloat* 7 17.9% 32 82.1%Illinois & Mariposa/Terry Francois 9 16.1% 47 83.9%JFK & Transverse* 70 25.9% 200 74.1%Lake Merced & Winston* 7 14.9% 40 85.1%Masonic & Panhandle* 78 36.8% 134 63.2%McAllister & Polk 88 29.8% 207 70.2%O'Shaughnessy & Portola 6 20.7% 23 79.3%Page & Scott 161 27.9% 417 72.1%Polk & Sutter 58 27.8% 151 72.2%Randall & San Jose 32 33.0% 65 67.0%Stockton & Sutter
Total : 873 27.3% 2,323 72.7%
* Percentages are based on total reported total male/female riders, not on the total number of cyclists counted citywide.
Data Not Available
Data Not Available
Data Not Available
Data Not Available
Data Not Available
Data Not Available
2008 Citywide Bicycle Counts Report San Francisco Municipal Transportation Agency
20
Appendix D: Helmet Usage
2006 2007 2008
% Helmet 65 72 67
% No Helmet 35 28 33
Helmet/No Helmet (2006-08)
Intersection No Helmet % No Helmet Helmet % Helmet11th & Howard11th & Market
14th & Folsom
17th & Valencia 246 35.7% 444 64.3%
23rd & Potrero 39 53.4% 34 46.6%
2nd & Townsend 33 23.6% 107 76.4%
Illinois Street Bridge & Marin 4 25.0% 12 75.0%5th & Market (Midday)
5th & Market (Evening)
5th & Market (Morning)
5th & Townsend
7th & 16th
7th & Kirkham 12 25.5% 35 74.5%8th & TownsendAlemany & Geneva 14 50.0% 14 50.0%Arguello & Lake 35 20.0% 140 80.0%Broadway & Columbus 43 45.7% 61 64.9%Broadway & EmbarcaderoCervantes & Marina*Cesar Chavez & Harrison 26 48.1% 28 51.9%Embarcadero & Townsend*Embarcadero to/from Ferry BuildingFell & ScottGolden Gate & Masonic 16 34.0% 31 66.0%Great Highway & Sloat* 25 64.1% 14 35.9%Illinois & Mariposa/Terry Francois 10 17.9% 46 82.1%JFK & Transverse* 89 33.0% 181 67.0%Lake Merced & Winston* 13 27.7% 34 72.3%Masonic & Panhandle* 49 23.1% 163 76.9%McAllister & Polk 90 30.5% 205 69.5%O'Shaughnessy & Portola 6 20.7% 23 79.3%Page & Scott 214 37.0% 364 63.0%Polk & Sutter 71 34.0% 138 66.0%Randall & San Jose 32 33.0% 42 43.3%Stockton & Sutter
Total : 1,067 33.3% 2,139 66.7%
* Percentages are based on total reported total helmet use, not on the total number of cyclists counted citywide.
Data Not Available
Data Not Available
Data Not Available
Data Not Available
Data Not Available
Data Not Available
2008 Citywide Bicycle Counts Report San Francisco Municipal Transportation Agency
21
Appendix E: Sidewalk Riders
Intersection Sidewalk Riders (2007)
% Sidewalk Riders (2007)
Sidewalk Riders (2008)
% Sidewalk Riders (2008)
11th & How ard 14 5.6% 11 3.3%
11th & Market Data Not Available Data Not Available 48 6.6%
14th & Folsom 1 0.5%
17th & Valencia 9 1.7% 5 0.7%
23rd & Potrero 7 20.6% 11 15.1%
2nd & Tow nsend 8 7.5% 0 0.0%
3rd & Islais Creek Data Not Available Data Not Available 0 0.0%
5th & Market (Midday) 19 12.5% 18 11.0%
5th & Market (Evening) 26 5.0% 35 5.7%
5th & Market (Morning) 4 1.0% 19 4.6%
5th & Tow nsend 6 2.3% 2 0.7%
7th & 16th 0 0.0% 3 2.1%
7th & Kirkham 10 22.2% 13 27.7%
8th & Tow nsend 11 5.1% 14 5.3%
Alemany & Geneva 6 21.4% 6 21.4%
Arguello & Lake 9 5.5% 19 10.9%
Broadw ay & Columbus 3 3.8% 12 12.8%
Broadw ay & Embarcadero 5 1.4% 0 0.0%
Cervantes & Marina* 285 97.6% 441 90.0%
Cesar Chavez & Harrison 5 10.4% 15 27.8%
Embarcadero & Tow nsend* 104 40.2% 113 35.4%
Embarcadero to/from Ferry Building
Fell & Scott 50 20.0% 28 9.3%
Golden Gate & Masonic 1 2.6% 14 29.8%
Great Highw ay & Sloat* 50 94.3% 15 38.5%
Illinois & Mariposa/Terry Francois 2 3.2% 1 1.8%
JFK & Transverse* 15 8.6% 18 6.7%
Lake Merced & Winston* 32 72.7% 33 70.2%
Masonic & Panhandle* 165 95.9% 210 99.1%
McAllister & Polk 10 3.8% 43 14.6%
O'Shaughnessy & Portola 3 10.3% 0 0.0%
Page & Scott 0 0.0% 8 1.4%
Polk & Sutter 5 2.8% 3 1.4%
Randall & San Jose Data Not Available Data Not Available 21 21.6%
Stockton & Sutter 1 1.4%
* The sidew alk in these locations is a multi-use path
Data Not Available
Data Not Available
Not applicable to this location
Note: Bicycling on the sidewalk in San Francisco is generally illegal, except in certain situations regarding children (SFTC Article 5, SEC. 96). The counting of sidewalk riders in the Citywide Bicycle Count in no way condones this practice.
2008 Citywide Bicycle Counts Report San Francisco Municipal Transportation Agency
22
Appendix F: Wrong-way Riders
Intersection Wrong Way Riders (2007)
% Wrong Way Riders (2007)
Wrong Way Riders (2008)
% Wrong Way Riders (2008)
11th & How ard 0 0.0% 3 0.9%
11th & Market 29 4.0%
14th & Folsom 0 0.0%
17th & Valencia 11 2.0% 4 0.6%
23rd & Potrero 0 0.0% 7 9.6%
2nd & Tow nsend 2 1.9% 0 0.0%
3rd & Islais Creek 1 6.3%
5th & Market (Midday) 0 0.0% 1 0.6%
5th & Market (Evening) 12 2.3% 3 0.5%
5th & Market (Morning) 1 0.3% 4 1.0%
5th & Tow nsend 8 3.0% 4 1.3%
7th & 16th 0 0.0% 0 0.0%
7th & Kirkham 0 0.0% 8 17.0%
8th & Tow nsend 7 3.3% 5 1.9%
Alemany & Geneva 3 10.7% 7 25.0%
Arguello & Lake 0 0.0% 12 6.9%
Broadw ay & Columbus 4 5.0% 13 13.8%
Broadw ay & Embarcadero 0 0.0% 0 0.0%
Cervantes & Marina* 0 0.0% 0 0.0%
Cesar Chavez & Harrison 0 0.0% 5 9.3%
Embarcadero & Tow nsend* 0 0.0% 0 0.0%
Embarcadero to/from Ferry Building
Fell & Scott 0 0.0% 9 3.0%
Golden Gate & Masonic 0 0.0% 6 12.8%
Great Highw ay & Sloat* 0 0.0% 1 2.6%
Illinois & Mariposa/Terry Francois 6 9.7% 0 0.0%
JFK & Transverse* 0 0.0% 9 3.3%
Lake Merced & Winston* 0 0.0% 2 4.3%
Masonic & Panhandle* 2 0.9%
McAllister & Polk 6 2.3% 19 6.4%
O'Shaughnessy & Portola 2 6.9% 0 0.0%
Page & Scott 0 0.0% 1 0.2%
Polk & Sutter 0 0.0% 2 1.0%
Randall & San Jose 8 7.1% 15 15.5%
Stockton & Sutter 8 10.8%
* The sidew alk in these locations is a multi-use path
Data Not Available
Data Not Available
Data Not Available
Data Not Available
Not applicable to this location
Data Not Available
Note: This table captures bicycles traveling in the wrong direction while riding in traffic. Wrong-way riding is illegal in California, as stated in CVC 21650.1.
2008 Citywide Bicycle Counts Report San Francisco Municipal Transportation Agency
23
Appendix G: Downtown Cordon Counts (2006-08)
Appendix H: Non-downtown Cordon Counts
Downtown Cordon Intersections Time 2006 Total 2007 Total 2008 Total
% Change (06-07)
% Change (07-08)
% Change (06-08)
11th & How ard 5:00 PM - 6:30 PM 227 250 333 10.1% 33.2% 46.7%
11th & Market 5:00 PM - 6:30 PM 545 585 726 7.3% 24.1% 33.2%
2nd & Tow nsend 5:00 PM - 6:30 PM 101 107 140 5.0% 32.1% 38.6%
5th & Tow nsend 5:00 PM - 6:30 PM 254 266 306 4.7% 15.0% 20.5%
8th & Tow nsend 5:00 PM - 6:30 PM 167 214 264 28.1% 23.4% 58.1%
Broadw ay & Columbus 5:00 PM - 6:30 PM 95 80 94 -15.8% 17.5% -1.1%
Broadw ay & Embarcadero 5:00 PM - 6:30 PM 393 369 594 -6.1% 61.0% 51.1%
Embarcadero & Tow nsend 5:00 PM - 6:30 PM 195 259 319 32.8% 23.2% 63.6%
Ferry Building Terminals* 5:00 PM - 6:30 PM 84 55 350 -34.5% 536.4% 316.7%
McAllister & Polk 5:00 PM - 6:30 PM 223 266 295 19.3% 10.9% 32.3%
Polk & Sutter 5:00 PM - 6:30 PM 158 181 209 14.6% 15.5% 32.3%
Stockton & Sutter 5:00 PM - 6:30 PM 37 74 95 100.0% 28.4% 156.8%
TOTALS* 2395 2651 3375 10.7% 27.3% 40.9%
* For comparison purposes, these totals exclude the Ferry Building Terminal count, w hich w as relocated in 2008.
Non-Downtown Cordon Intersections Time 2006 Total 2007 Total 2008 Total
% Change (06-07)
% Change (07-08)
% Change (06-08)
14th & Folsom 8:00 AM - 9:00 AM 163 200 214 22.7% 7.0% 31.3%17th & Valencia 5:00 PM - 6:30 PM 441 541 690 22.7% 27.5% 56.5%23rd & Potrero 5:00 PM - 6:30 PM 35 34 73 -2.9% 114.7% 108.6%3rd St. Bridge / Illinois St. Bridge* 5:00 PM - 6:30 PM 42 26 16 -38.1% -38.5% -61.9%5th & Market 1:00 PM - 2:00 PM 156 152 163 -2.6% 7.2% 4.5%5th & Market 5:00 PM - 6:30 PM 468 519 615 10.9% 18.5% 31.4%5th & Market 8:00 AM - 9:00 AM 378 397 409 5.0% 3.0% 8.2%7th & 16th 5:00 PM - 6:30 PM 67 122 144 82.1% 18.0% 114.9%7th & Kirkham 5:00 PM - 6:30 PM 35 45 47 28.6% 4.4% 34.3%Alemany & Geneva 5:00 PM - 6:30 PM 9 28 28 211.1% 0.0% 211.1%Arguello & Lake 5:00 PM - 6:30 PM 136 165 175 21.3% 6.1% 28.7%Cervantes & Marina 5:00 PM - 6:30 PM 240 292 490 21.7% 67.8% 104.2%Cesar Chavez & Harrison 5:00 PM - 6:30 PM 39 48 54 23.1% 12.5% 38.5%Fell & Scott 5:00 PM - 6:30 PM 202 250 302 23.8% 20.8% 49.5%Golden Gate & Masonic 5:00 PM - 6:30 PM 42 38 47 -9.5% 23.7% 11.9%Great Highw ay & Sloat 5:00 PM - 6:30 PM 50 53 39 6.0% -26.4% -22.0%Illinois & Mariposa/Terry Francois 5:00 PM - 6:30 PM 36 62 56 72.2% -9.7% 55.6%JFK & Transverse*** 5:00 PM - 6:30 PM 300 186 270 -38.0% 45.2% -10.0%Lake Merced & Winston 5:00 PM - 6:30 PM 29 44 47 51.7% 6.8% 62.1%Masonic & Panhandle 8:00 AM - 9:00 AM 152 172 212 13.2% 23.3% 39.5%O'Shaughnessy & Portola 5:00 PM - 6:30 PM 23 29 29 26.1% 0.0% 26.1%Page & Scott 5:00 PM - 6:30 PM 376 420 578 11.7% 37.6% 53.7%Randall & San Jose 5:00 PM - 6:30 PM 28 72 97 157.1% 34.7% 246.4%
TOTALS* 3105 3683 4509 18.6% 22.4% 45.2%
* For comparison purposes, these totals exclude the JFK/Transverse (inaccurate in 2006) and the Illinois St. Bridge (location moved in 2008).
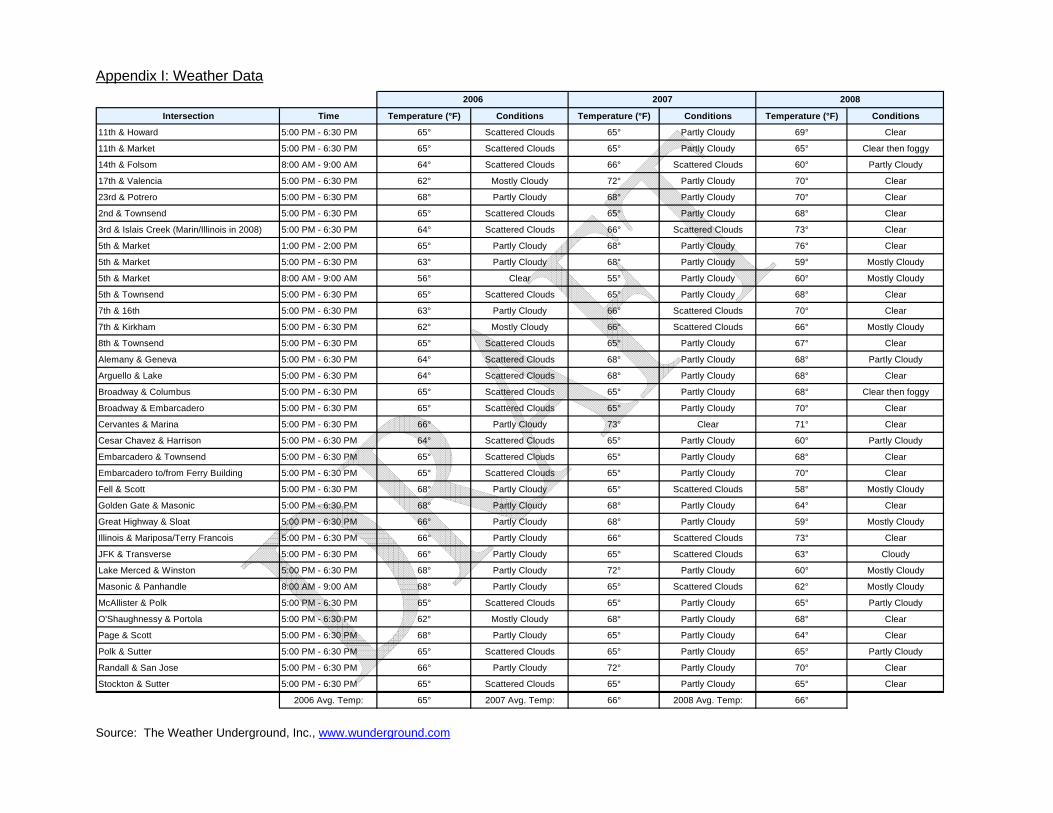
Appendix I: Weather Data
Source: The Weather Underground, Inc., www.wunderground.com
Intersection Time Temperature (°F) Conditions Temperature (°F) Conditions Temperature (°F) Conditions
11th & Howard 5:00 PM - 6:30 PM 65° Scattered Clouds 65° Partly Cloudy 69° Clear
11th & Market 5:00 PM - 6:30 PM 65° Scattered Clouds 65° Partly Cloudy 65° Clear then foggy
14th & Folsom 8:00 AM - 9:00 AM 64° Scattered Clouds 66° Scattered Clouds 60° Partly Cloudy
17th & Valencia 5:00 PM - 6:30 PM 62° Mostly Cloudy 72° Partly Cloudy 70° Clear
23rd & Potrero 5:00 PM - 6:30 PM 68° Partly Cloudy 68° Partly Cloudy 70° Clear
2nd & Townsend 5:00 PM - 6:30 PM 65° Scattered Clouds 65° Partly Cloudy 68° Clear
3rd & Islais Creek (Marin/Illinois in 2008) 5:00 PM - 6:30 PM 64° Scattered Clouds 66° Scattered Clouds 73° Clear
5th & Market 1:00 PM - 2:00 PM 65° Partly Cloudy 68° Partly Cloudy 76° Clear
5th & Market 5:00 PM - 6:30 PM 63° Partly Cloudy 68° Partly Cloudy 59° Mostly Cloudy
5th & Market 8:00 AM - 9:00 AM 56° Clear 55° Partly Cloudy 60° Mostly Cloudy
5th & Townsend 5:00 PM - 6:30 PM 65° Scattered Clouds 65° Partly Cloudy 68° Clear
7th & 16th 5:00 PM - 6:30 PM 63° Partly Cloudy 66° Scattered Clouds 70° Clear
7th & Kirkham 5:00 PM - 6:30 PM 62° Mostly Cloudy 66° Scattered Clouds 66° Mostly Cloudy
8th & Townsend 5:00 PM - 6:30 PM 65° Scattered Clouds 65° Partly Cloudy 67° Clear
Alemany & Geneva 5:00 PM - 6:30 PM 64° Scattered Clouds 68° Partly Cloudy 68° Partly Cloudy
Arguello & Lake 5:00 PM - 6:30 PM 64° Scattered Clouds 68° Partly Cloudy 68° Clear
Broadway & Columbus 5:00 PM - 6:30 PM 65° Scattered Clouds 65° Partly Cloudy 68° Clear then foggy
Broadway & Embarcadero 5:00 PM - 6:30 PM 65° Scattered Clouds 65° Partly Cloudy 70° Clear
Cervantes & Marina 5:00 PM - 6:30 PM 66° Partly Cloudy 73° Clear 71° Clear
Cesar Chavez & Harrison 5:00 PM - 6:30 PM 64° Scattered Clouds 65° Partly Cloudy 60° Partly Cloudy
Embarcadero & Townsend 5:00 PM - 6:30 PM 65° Scattered Clouds 65° Partly Cloudy 68° Clear
Embarcadero to/from Ferry Building 5:00 PM - 6:30 PM 65° Scattered Clouds 65° Partly Cloudy 70° Clear
Fell & Scott 5:00 PM - 6:30 PM 68° Partly Cloudy 65° Scattered Clouds 58° Mostly Cloudy
Golden Gate & Masonic 5:00 PM - 6:30 PM 68° Partly Cloudy 68° Partly Cloudy 64° Clear
Great Highway & Sloat 5:00 PM - 6:30 PM 66° Partly Cloudy 68° Partly Cloudy 59° Mostly Cloudy
Illinois & Mariposa/Terry Francois 5:00 PM - 6:30 PM 66° Partly Cloudy 66° Scattered Clouds 73° Clear
JFK & Transverse 5:00 PM - 6:30 PM 66° Partly Cloudy 65° Scattered Clouds 63° Cloudy
Lake Merced & Winston 5:00 PM - 6:30 PM 68° Partly Cloudy 72° Partly Cloudy 60° Mostly Cloudy
Masonic & Panhandle 8:00 AM - 9:00 AM 68° Partly Cloudy 65° Scattered Clouds 62° Mostly Cloudy
McAllister & Polk 5:00 PM - 6:30 PM 65° Scattered Clouds 65° Partly Cloudy 65° Partly Cloudy
O'Shaughnessy & Portola 5:00 PM - 6:30 PM 62° Mostly Cloudy 68° Partly Cloudy 68° Clear
Page & Scott 5:00 PM - 6:30 PM 68° Partly Cloudy 65° Partly Cloudy 64° Clear
Polk & Sutter 5:00 PM - 6:30 PM 65° Scattered Clouds 65° Partly Cloudy 65° Partly Cloudy
Randall & San Jose 5:00 PM - 6:30 PM 66° Partly Cloudy 72° Partly Cloudy 70° Clear
Stockton & Sutter 5:00 PM - 6:30 PM 65° Scattered Clouds 65° Partly Cloudy 65° Clear
2006 Avg. Temp: 65° 2007 Avg. Temp: 66° 2008 Avg. Temp: 66°
2006 2007 2008


![Citywide Intelligence Hub e-Learning · A^ cWT CchfXST 8]cT[[XVT]RT HdQ Using the Citywide Intelligence Hub Data Profiler Using the Citywide Intelligence Hub Data Correlator Citywide](https://static.fdocuments.in/doc/165x107/5fb9423785d7246345058e12/citywide-intelligence-hub-e-learning-a-cwt-cchfxst-8ctxvtrt-hdq-using-the-citywide.jpg)