Teknologi Konservasi_Danau
62
PRELIMINARY DEVELOPMENT OF VERTICAL SEGMENTATION MODEL FOR WATER QUALITY PREDICTION IN ELONGATED RESERVOIRS Priana Sudj ono Dept. of Environmental Engineering Bandung Institute of Technology [email protected] 1
-
Upload
nafisa-meisa -
Category
Documents
-
view
215 -
download
0
Transcript of Teknologi Konservasi_Danau
8/13/2019 Teknologi Konservasi_Danau
http://slidepdf.com/reader/full/teknologi-konservasidanau 1/62
PRELIMINARY DEVELOPMENT
OF VERTICAL SEGMENTATIONMODEL FOR WATER QUALITY
PREDICTION IN ELONGATED
RESERVOIRS
Priana SudjonoDept. of Environmental Engineering
Bandung Institute of Technology
1
8/13/2019 Teknologi Konservasi_Danau
http://slidepdf.com/reader/full/teknologi-konservasidanau 2/62
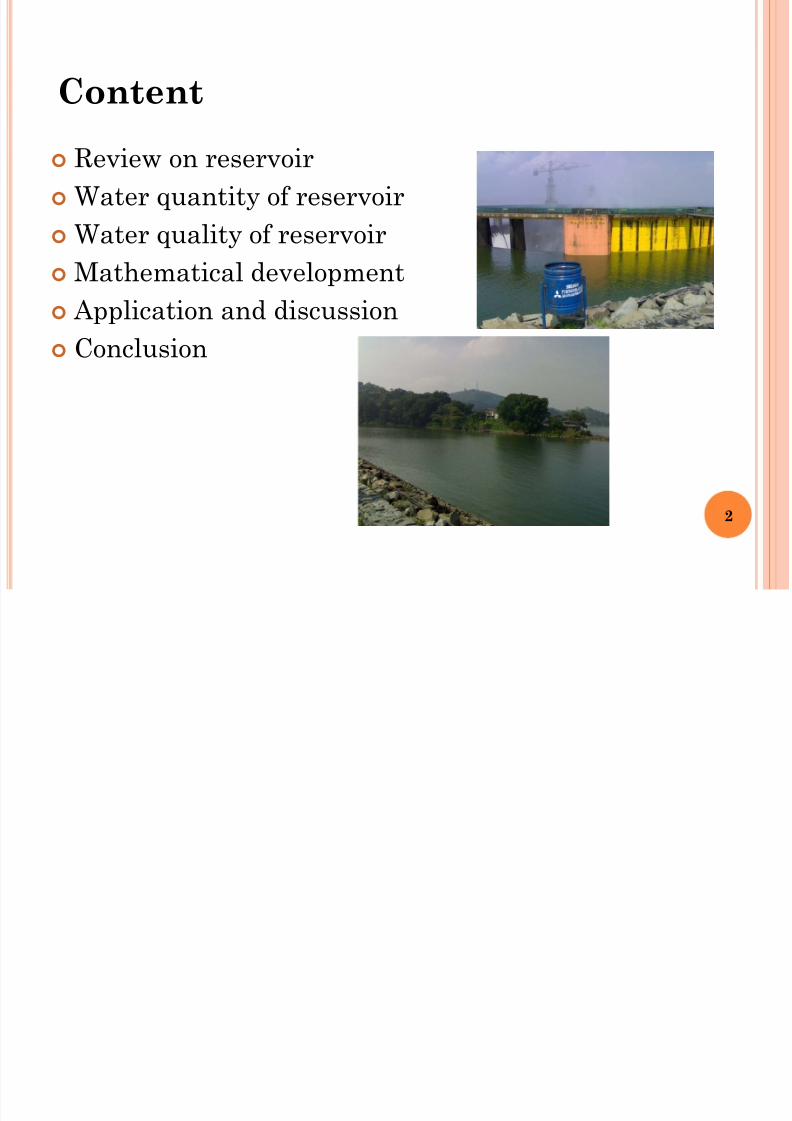
Review on reservoir
Water quantity of reservoir
Water quality of reservoir
Mathematical development Application and discussion
Conclusion
Content
2

8/13/2019 Teknologi Konservasi_Danau
http://slidepdf.com/reader/full/teknologi-konservasidanau 3/62
Jatiluhur reservoir, West Java 3
8/13/2019 Teknologi Konservasi_Danau
http://slidepdf.com/reader/full/teknologi-konservasidanau 4/62
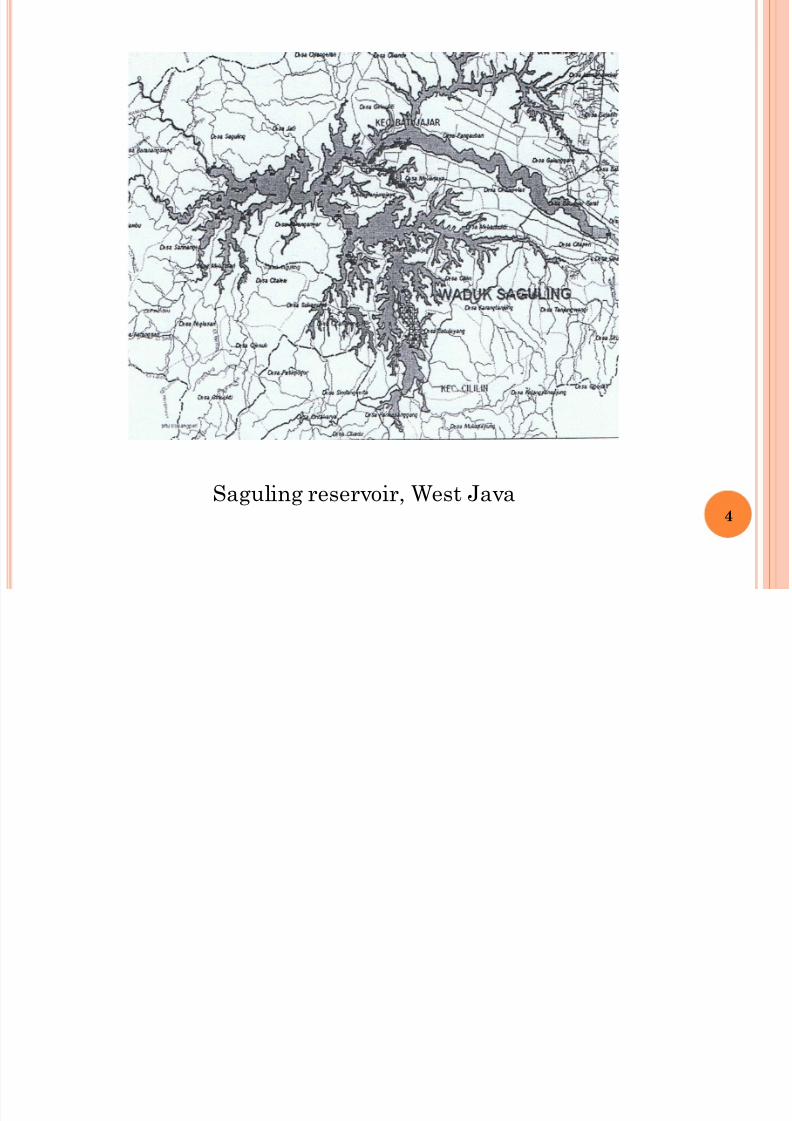
Saguling reservoir, West Java4
8/13/2019 Teknologi Konservasi_Danau
http://slidepdf.com/reader/full/teknologi-konservasidanau 5/62
5

8/13/2019 Teknologi Konservasi_Danau
http://slidepdf.com/reader/full/teknologi-konservasidanau 6/62
Introduction
Reservoir usually support cities
Industries
Recreation
Transportation
Fisheries
Aesthetics
Also: Irrigated Agriculture
Flood Control
Power Plant
WATER QUANTITY OF RESERVOIR
6

8/13/2019 Teknologi Konservasi_Danau
http://slidepdf.com/reader/full/teknologi-konservasidanau 7/62
7
8/13/2019 Teknologi Konservasi_Danau
http://slidepdf.com/reader/full/teknologi-konservasidanau 8/62
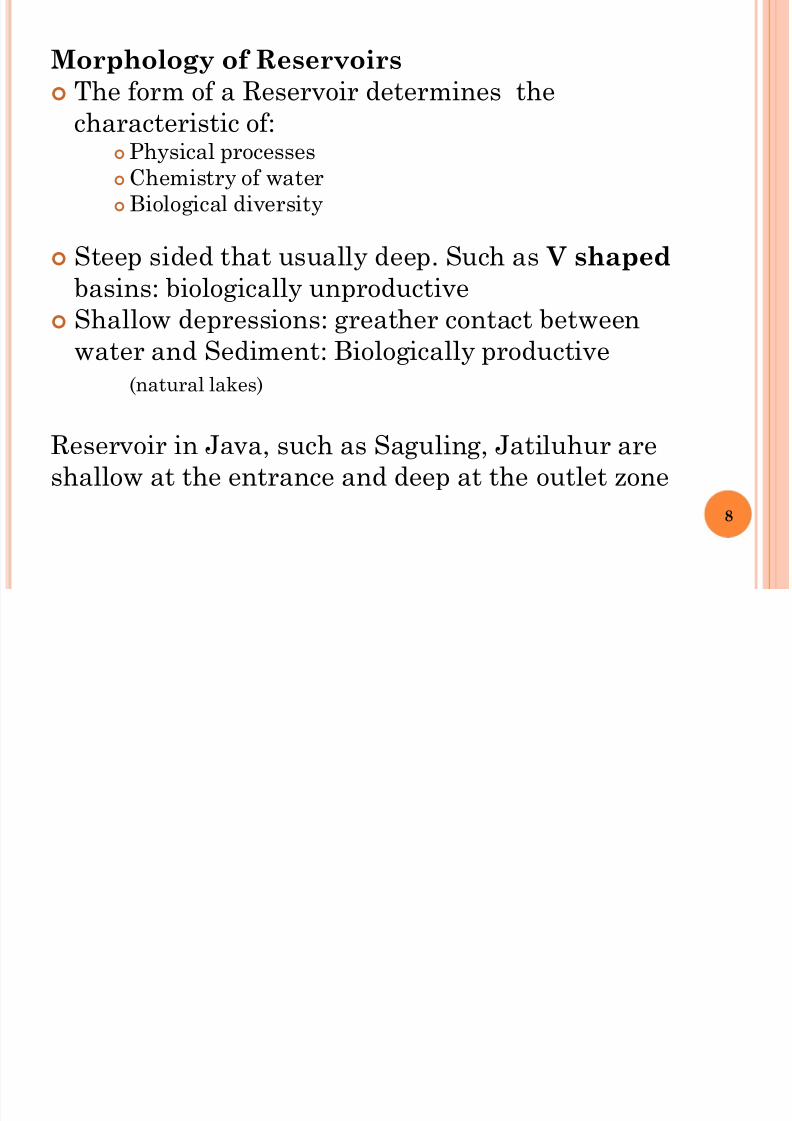
Morphology of Reservoirs
The form of a Reservoir determines the
characteristic of:Physical processes
Chemistry of water
Biological diversity
Steep sided that usually deep. Such as V shaped
basins: biologically unproductive
Shallow depressions: greather contact between
water and Sediment: Biologically productive
(natural lakes)
Reservoir in Java, such as Saguling, Jatiluhur are
shallow at the entrance and deep at the outlet zone
8
8/13/2019 Teknologi Konservasi_Danau
http://slidepdf.com/reader/full/teknologi-konservasidanau 9/62
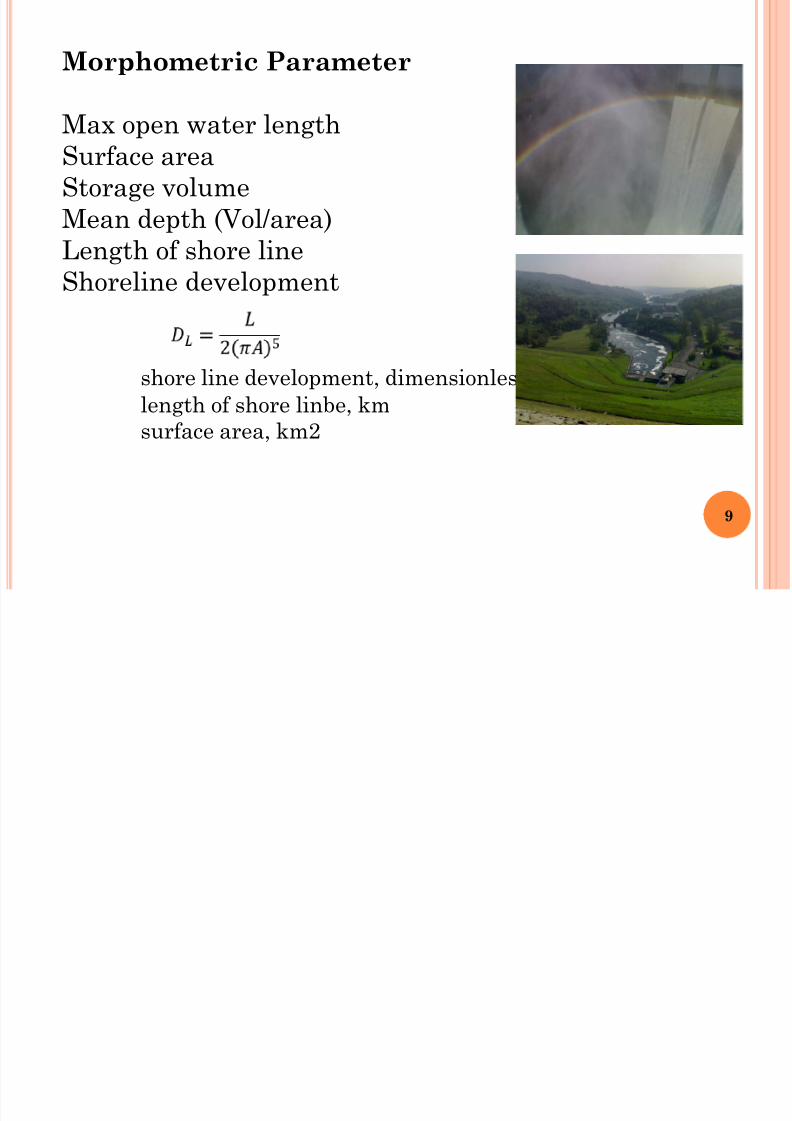
Morphometric Parameter
Max open water length
Surface area
Storage volume
Mean depth (Vol/area)
Length of shore line
Shoreline development
shore line development, dimensionless
length of shore linbe, kmsurface area, km2
9
8/13/2019 Teknologi Konservasi_Danau
http://slidepdf.com/reader/full/teknologi-konservasidanau 10/62
Many natural Lakes are subcircular or eleptical
Elongated reservoirs in river valley
Water renewal time of a Reservoir
Q is coming from river inflow, groundwater
seepage.
Outflow is the outflow and evaporation
2 < < 3 ≈ 5 =
Vol
q
10
8/13/2019 Teknologi Konservasi_Danau
http://slidepdf.com/reader/full/teknologi-konservasidanau 11/62
11
8/13/2019 Teknologi Konservasi_Danau
http://slidepdf.com/reader/full/teknologi-konservasidanau 12/62
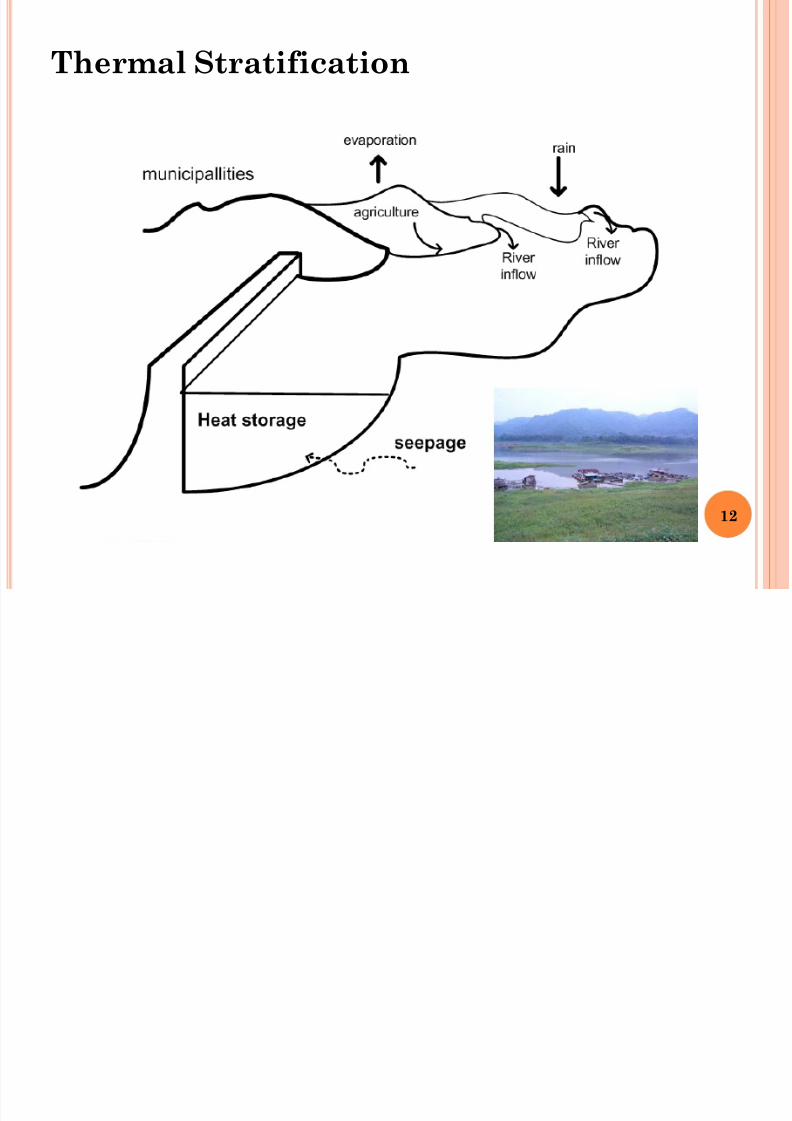
Thermal Stratification
12

8/13/2019 Teknologi Konservasi_Danau
http://slidepdf.com/reader/full/teknologi-konservasidanau 13/62
Solar radiation penetrates to reservoirs
Solar energy = f (latitude; season of the year)
Light is absorbed by water = f(wave length)
Long wavelength (red) dissipates within impounded
of pure water Short wavelength (blue) - penetrate deeper
So there will be stratification
13

8/13/2019 Teknologi Konservasi_Danau
http://slidepdf.com/reader/full/teknologi-konservasidanau 14/62
14
8/13/2019 Teknologi Konservasi_Danau
http://slidepdf.com/reader/full/teknologi-konservasidanau 15/62
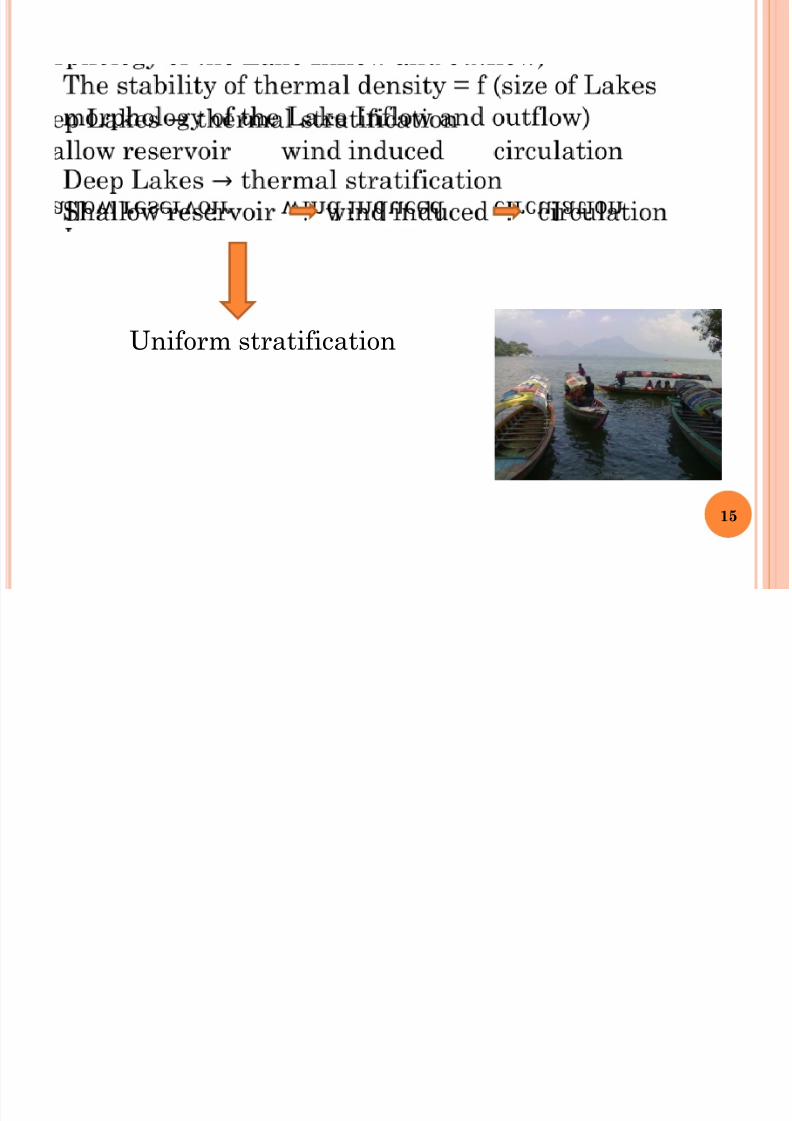
Uniform stratification
15
8/13/2019 Teknologi Konservasi_Danau
http://slidepdf.com/reader/full/teknologi-konservasidanau 16/62
16

8/13/2019 Teknologi Konservasi_Danau
http://slidepdf.com/reader/full/teknologi-konservasidanau 17/62
Surface Water Movement
Mixing
17

8/13/2019 Teknologi Konservasi_Danau
http://slidepdf.com/reader/full/teknologi-konservasidanau 18/62
Internal Movement of Water
……………. …………….
…………….
…..…………….
………………….
……….
…………….
…………….
…..
….. …..
…..…..
…..
reservoir
reservoir
reservoir
river
river
river
nutrient
Density factor
Density factor
18

8/13/2019 Teknologi Konservasi_Danau
http://slidepdf.com/reader/full/teknologi-konservasidanau 19/62
19

8/13/2019 Teknologi Konservasi_Danau
http://slidepdf.com/reader/full/teknologi-konservasidanau 20/62
W ATER QUALITY IN RESERVOIR
Problem
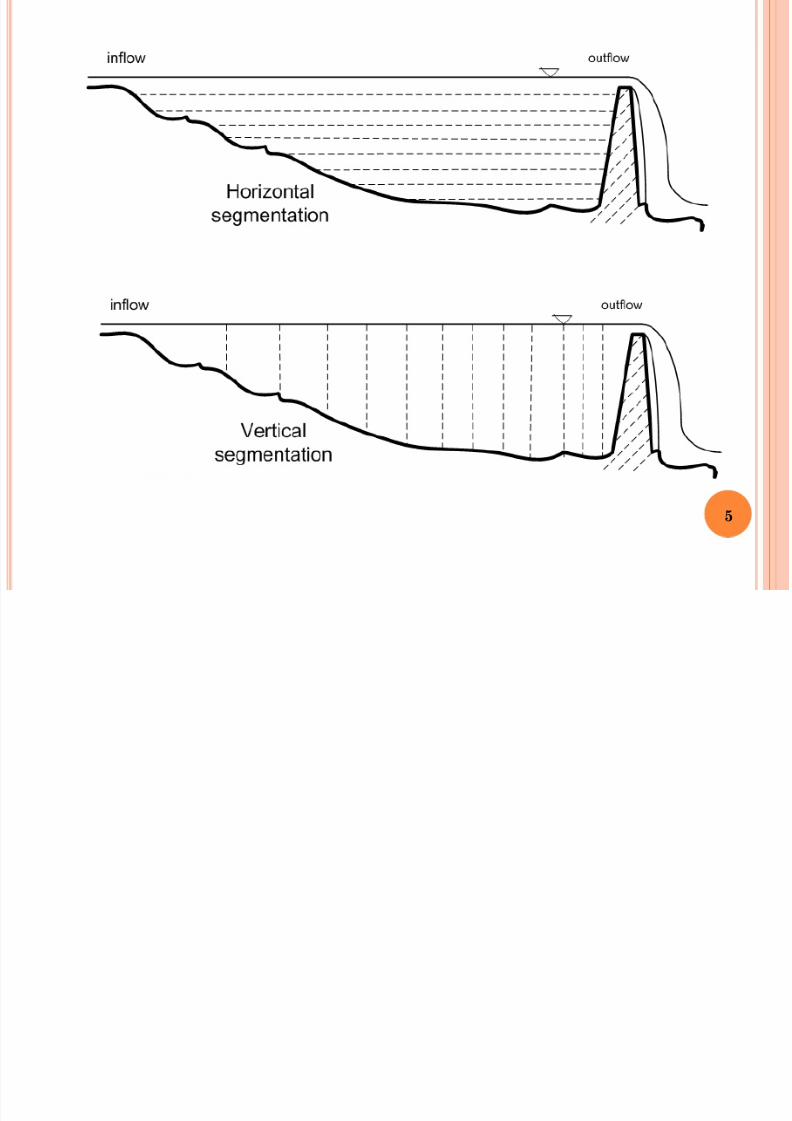
Dam or reservoir is usually long and narrow
following the regime of rivers
In shallow area light penetrate to the bottomThe productivity is not uniform
20

8/13/2019 Teknologi Konservasi_Danau
http://slidepdf.com/reader/full/teknologi-konservasidanau 21/62
Mayor consideration in WQM:
Water quality control
Beneficial use Dilution of wastewater
Water quality control
We need to predict water quality
21

8/13/2019 Teknologi Konservasi_Danau
http://slidepdf.com/reader/full/teknologi-konservasidanau 22/62
22

8/13/2019 Teknologi Konservasi_Danau
http://slidepdf.com/reader/full/teknologi-konservasidanau 23/62
23

8/13/2019 Teknologi Konservasi_Danau
http://slidepdf.com/reader/full/teknologi-konservasidanau 24/62
Oxygen Content
O2 from Atmosphere Photosynthesis
Inorganic CarbonInorganic forms: CO2, HCO3
-, CO3=
pH=4,3
H2CO3 H+ +HCO3- H+ + CO3
=
pH=4,5 pH=8,3
Bicarbonate ion Carbonate ion
24

8/13/2019 Teknologi Konservasi_Danau
http://slidepdf.com/reader/full/teknologi-konservasidanau 25/62
Inorganic carbon
Seepage of groundwater
Surface drainage
Respiration of aquatic animals
Bacteriological
decomposition
of organic matter
25

8/13/2019 Teknologi Konservasi_Danau
http://slidepdf.com/reader/full/teknologi-konservasidanau 26/62
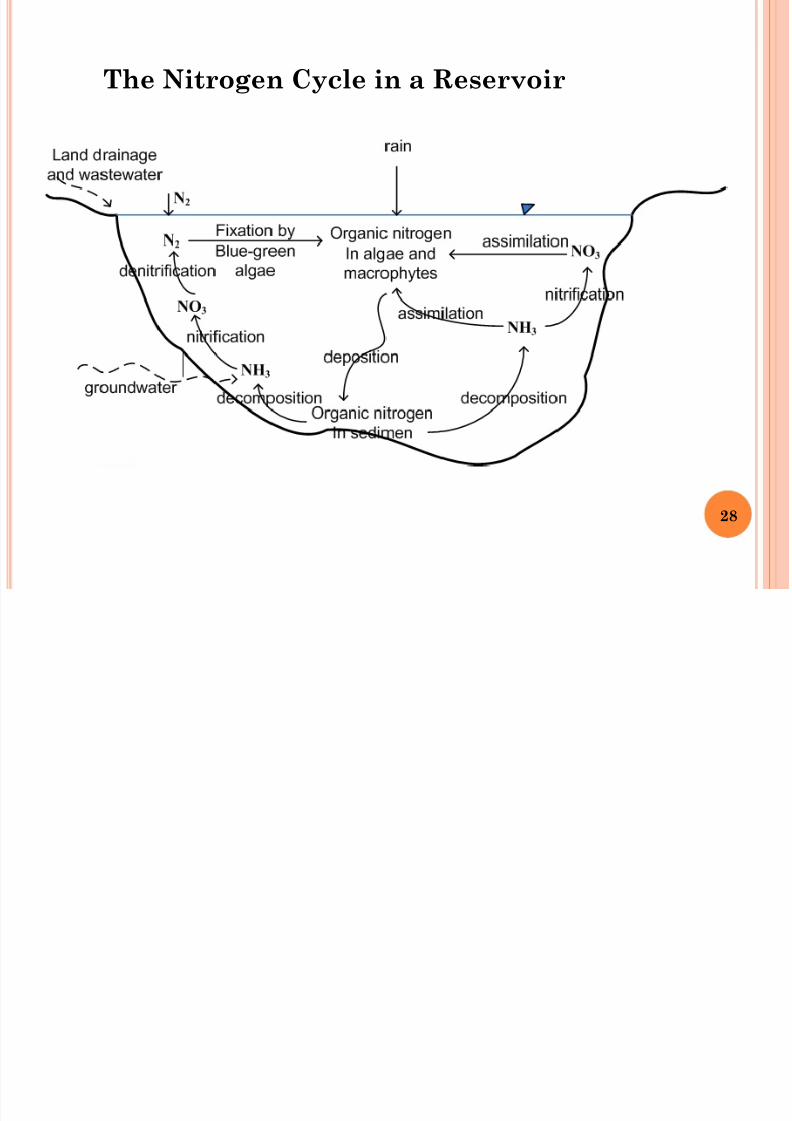
Blue green algae fixation N2
Organic N
26
8/13/2019 Teknologi Konservasi_Danau
http://slidepdf.com/reader/full/teknologi-konservasidanau 27/62
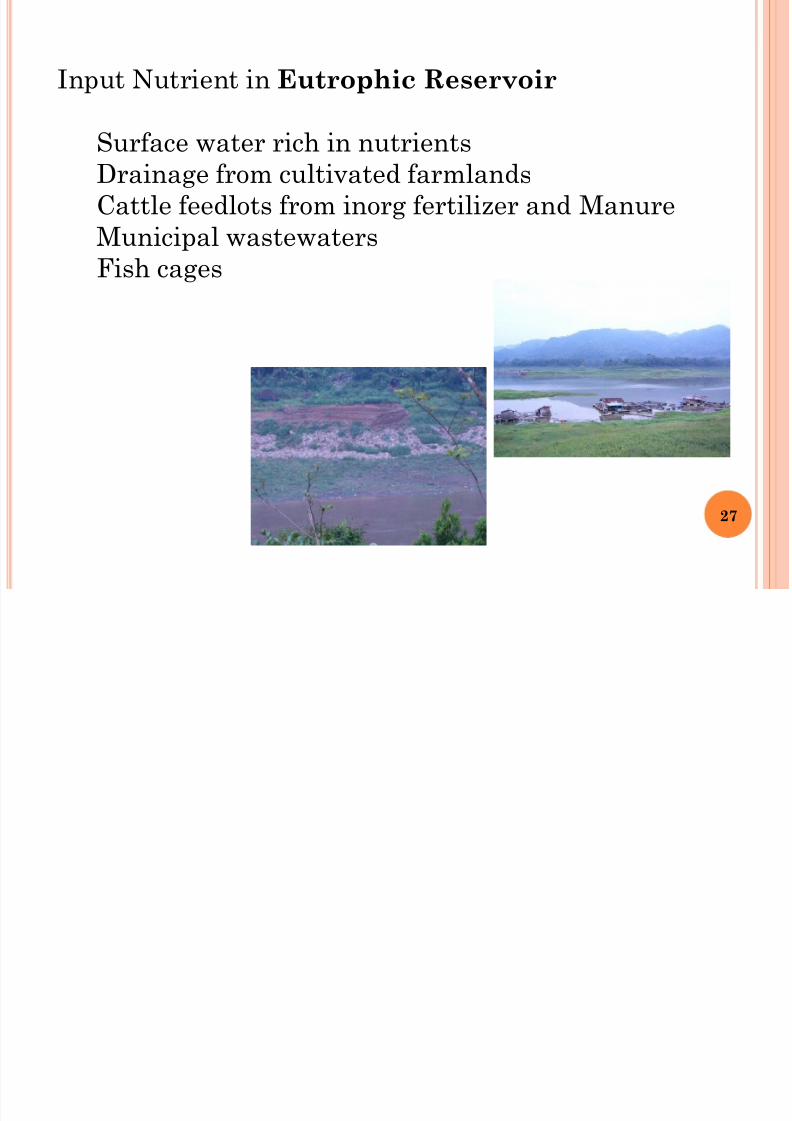
Input Nutrient in Eutrophic Reservoir
Surface water rich in nutrientsDrainage from cultivated farmlands
Cattle feedlots from inorg fertilizer and Manure
Municipal wastewaters
Fish cages
27
8/13/2019 Teknologi Konservasi_Danau
http://slidepdf.com/reader/full/teknologi-konservasidanau 28/62
The Nitrogen Cycle in a Reservoir
28

8/13/2019 Teknologi Konservasi_Danau
http://slidepdf.com/reader/full/teknologi-konservasidanau 29/62
29

8/13/2019 Teknologi Konservasi_Danau
http://slidepdf.com/reader/full/teknologi-konservasidanau 30/62
The Phosphorous Cycle in a Reservoir
30

8/13/2019 Teknologi Konservasi_Danau
http://slidepdf.com/reader/full/teknologi-konservasidanau 31/62
Ecology of Lakes and Reservoirs
31
8/13/2019 Teknologi Konservasi_Danau
http://slidepdf.com/reader/full/teknologi-konservasidanau 32/62
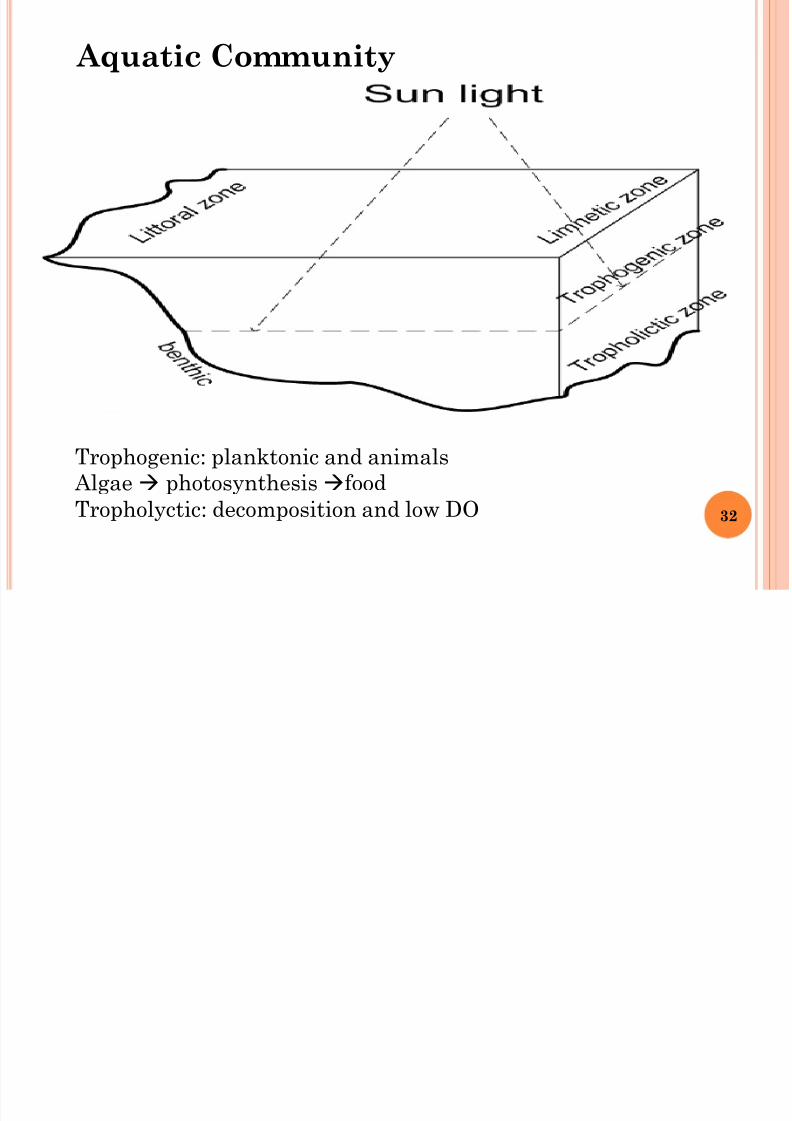
Aquatic Community
Trophogenic: planktonic and animals
Algae photosynthesisfood
Tropholyctic: decomposition and low DO 32
8/13/2019 Teknologi Konservasi_Danau
http://slidepdf.com/reader/full/teknologi-konservasidanau 33/62
• Chlorophyl a
• Planktonic algae
• Phytoplankton• Zooplankton
• Blue green Algae
Plant life in most enriched lakes is dominated byBlue Green Algae
Phytoplankton = f (Temp, Light, Mixing, Species
Competition, Predator, Nutrient)
Algae = f (Nutrient (P))
33

8/13/2019 Teknologi Konservasi_Danau
http://slidepdf.com/reader/full/teknologi-konservasidanau 34/62
Cultural Eutrophication
Natural Environments Eutrophication isslow
Cultural Eutrophication is accelerated by
fertilization of a reservoir, stream arising from
pollution associated with
Population Growth
Industrial Development
Intensive Agriculture
34

8/13/2019 Teknologi Konservasi_Danau
http://slidepdf.com/reader/full/teknologi-konservasidanau 35/62
The response of aquatic ecosystems to increased
input of Nutrients is greater productivity to the
detrimental of Water Quality
Decaying blue-
green algae
Excessive growth
of phytoplanktonreducing
transparancy
Increasedorganic content depleting DO
• release foul and odor
• loss of less tolerant fish
species• littoral zones choked
with aquatic weeds
Cultural eutrophication short period of a few
years after introduction of excess Nutrient.35

8/13/2019 Teknologi Konservasi_Danau
http://slidepdf.com/reader/full/teknologi-konservasidanau 36/62
Allowable Nutrient Loadings
Data on the indicator parameters of nutrient
concentrations:
can’t be applieddirectly in Engg.
Analysis
36
8/13/2019 Teknologi Konservasi_Danau
http://slidepdf.com/reader/full/teknologi-konservasidanau 37/62
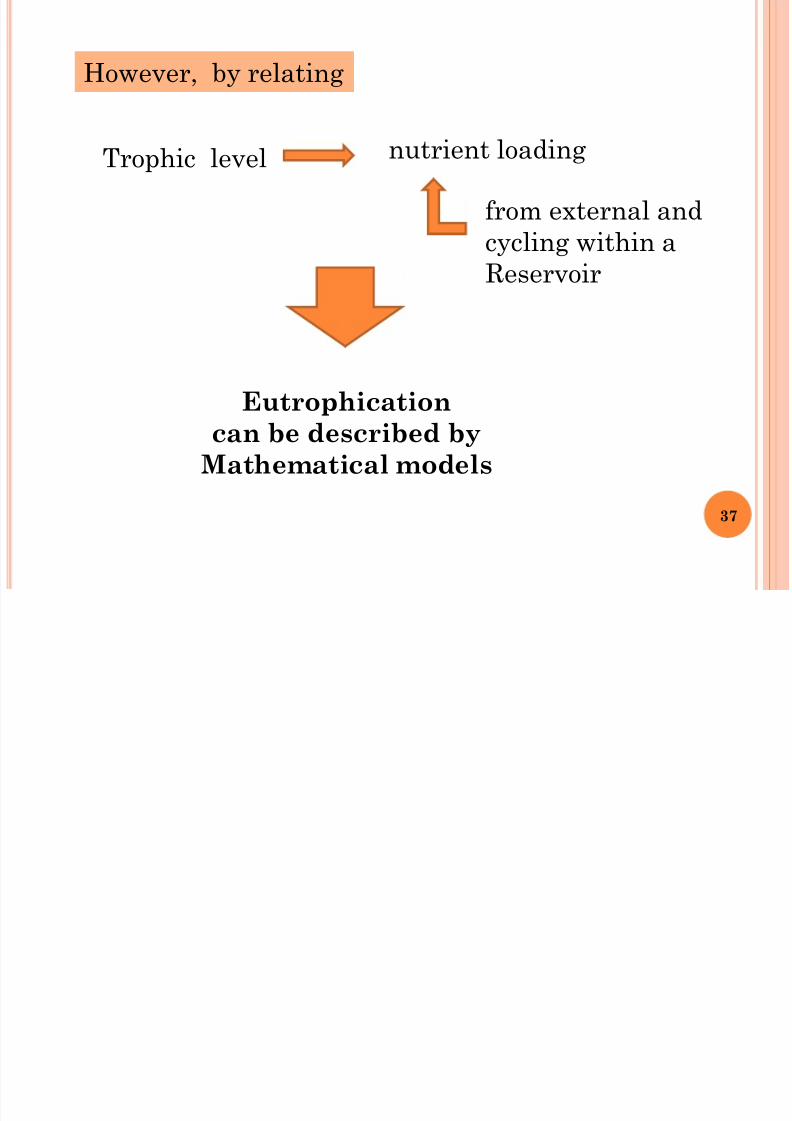
However, by relating
Trophic level nutrient loading
from external and
cycling within a
Reservoir
Eutrophication
can be described by
Mathematical models
37
8/13/2019 Teknologi Konservasi_Danau
http://slidepdf.com/reader/full/teknologi-konservasidanau 38/62
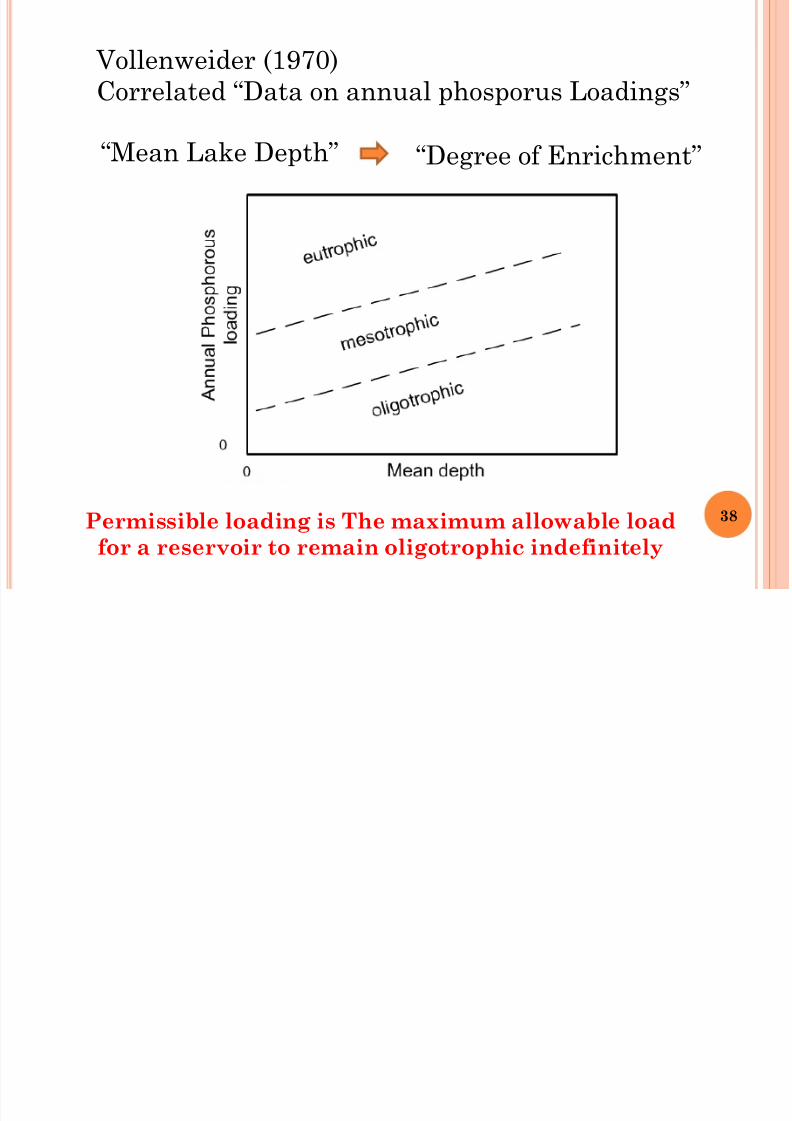
Vollenweider (1970)
Correlated “Data on annual phosporus Loadings”
“Mean Lake Depth” “Degree of Enrichment”
Permissible loading is The maximum allowable load
for a reservoir to remain oligotrophic indefinitely
38

8/13/2019 Teknologi Konservasi_Danau
http://slidepdf.com/reader/full/teknologi-konservasidanau 39/62
typical plant tissue of phytoplankton and
Macrophytes contains phosphorus, nitrogen, and
carbon in the approximate ratio of 1P: 7N : 40C per100 dry weight).
The Phosphorus Loadings include all biologically
available forms of which the majority are dissolved
orthophosphate and acid hydrolyzable phosphate.
The principle inorganic nitrogen forms taken up by
plants are Nitrate and Ammonia.
influene the
degree ofEutrophication
39
8/13/2019 Teknologi Konservasi_Danau
http://slidepdf.com/reader/full/teknologi-konservasidanau 40/62
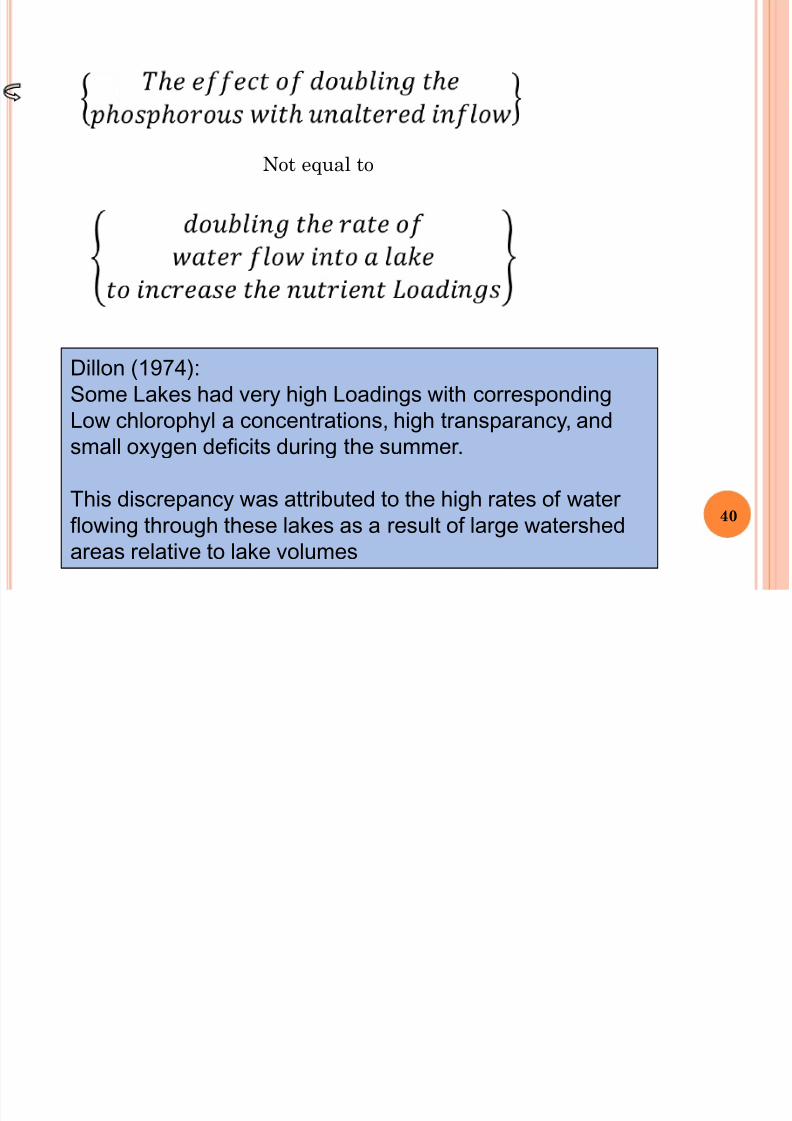
Not equal to
Dillon (1974):
Some Lakes had very high Loadings with corresponding
Low chlorophyl a concentrations, high transparancy, andsmall oxygen deficits during the summer.
This discrepancy was attributed to the high rates of water
flowing through these lakes as a result of large watershed
areas relative to lake volumes
40

8/13/2019 Teknologi Konservasi_Danau
http://slidepdf.com/reader/full/teknologi-konservasidanau 41/62
MATHEMATICAL DEVELOPMENT
Water Quantity Model
Water Quality Model
41
8/13/2019 Teknologi Konservasi_Danau
http://slidepdf.com/reader/full/teknologi-konservasidanau 42/62
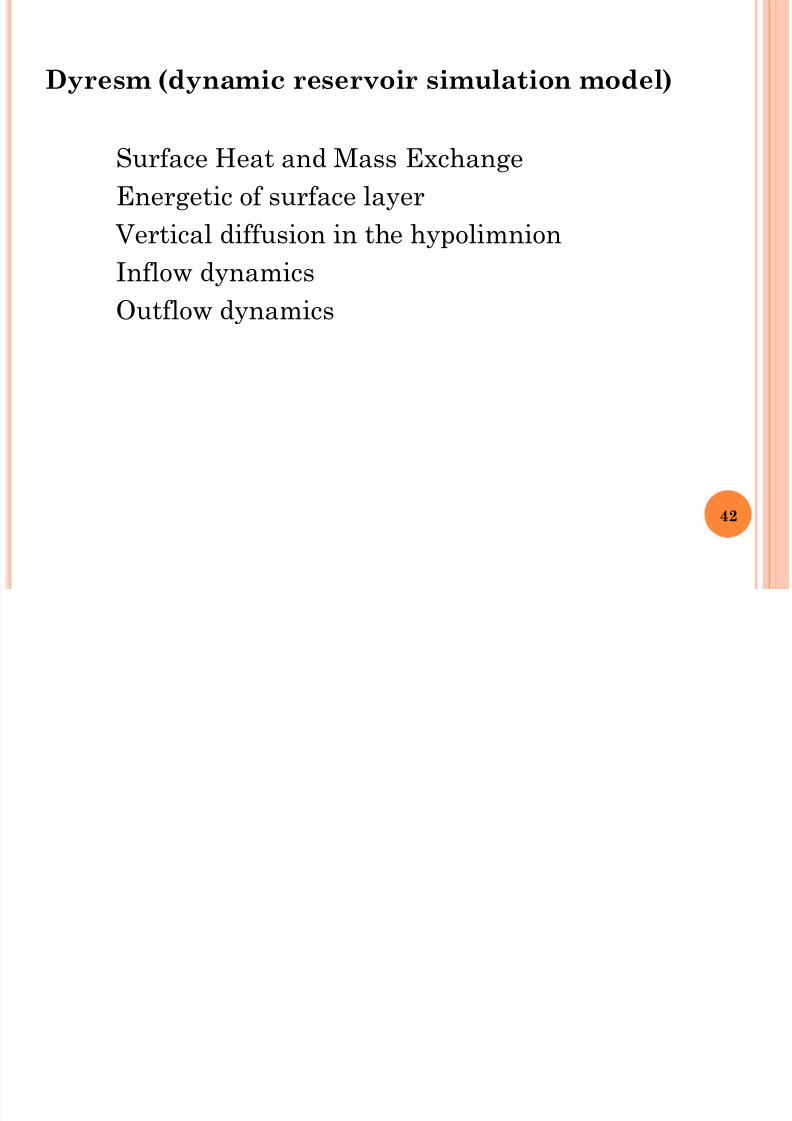
Surface Heat and Mass Exchange
Energetic of surface layer
Vertical diffusion in the hypolimnion
Inflow dynamicsOutflow dynamics
Dyresm (dynamic reservoir simulation model)
42

8/13/2019 Teknologi Konservasi_Danau
http://slidepdf.com/reader/full/teknologi-konservasidanau 43/62
Difficulties in building models applicable for
Indonesian situation
1. Lack of data
2. Ecological cycle or process takes place all over
the year (the weather is warm)
3. Less fund needed
43
T i l R i E t hi ti M d l (TREM)

8/13/2019 Teknologi Konservasi_Danau
http://slidepdf.com/reader/full/teknologi-konservasidanau 44/62
The schematization: reservoir is divided into (m) segments that the
water in the segment remain for a time-step
then moves to the direction of flow to the next segment. The number
of segment is estimated by dividing hydraulic detention time by
)( t ∆
)( t ∆
1 m
overland flowsubsurface flow
intake
evaporation
main
stream
intake
evaporation
outlet
overland flowsubsurface flow
Tropical Reservoir Eutrophication Model (TREM)
44
8/13/2019 Teknologi Konservasi_Danau
http://slidepdf.com/reader/full/teknologi-konservasidanau 45/62
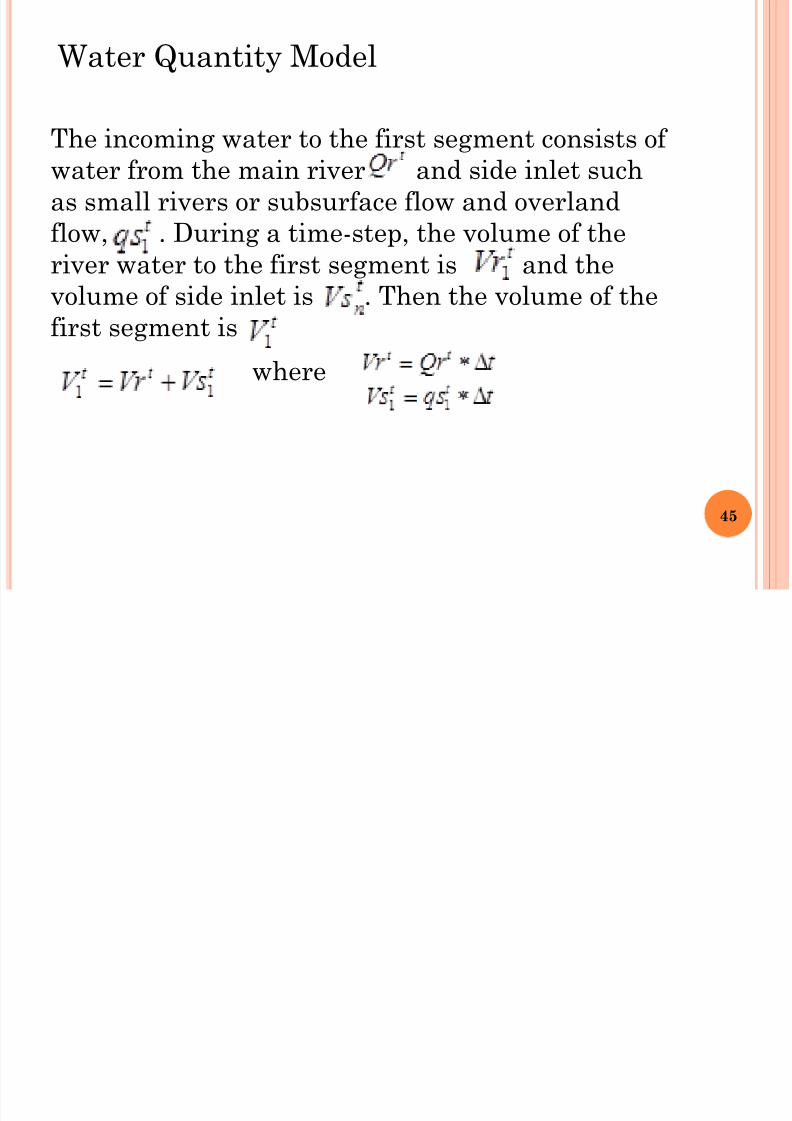
The incoming water to the first segment consists ofwater from the main river and side inlet such
as small rivers or subsurface flow and overland
flow, . During a time-step, the volume of the
river water to the first segment is and the
volume of side inlet is . Then the volume of the
first segment is
Water Quantity Model
where
45

8/13/2019 Teknologi Konservasi_Danau
http://slidepdf.com/reader/full/teknologi-konservasidanau 46/62
In every segment: agriculture, water supply,
evaporation or other activities need water, as their
total amount of water intake is .
During a time-step, the volume of intake-water,
as;
So that, the volume of water in the first segment,
t t t t VoVsVr V 111 −+=
t t t VoViV 111 −=
t qoVo t
n
t
n ∆∗=
46

8/13/2019 Teknologi Konservasi_Danau
http://slidepdf.com/reader/full/teknologi-konservasidanau 47/62
It is assumed that all water in upper segment
moves to the downstream segment, and side inflow
and intake also take place, then the general
equation can be written as
t
n
t
n
t
n VsV Vi += −
−
1
1
if Then,
t
n
t
n
t
n VoViV −=
Initial volume is placed as for all segmentsinit V
47
8/13/2019 Teknologi Konservasi_Danau
http://slidepdf.com/reader/full/teknologi-konservasidanau 48/62
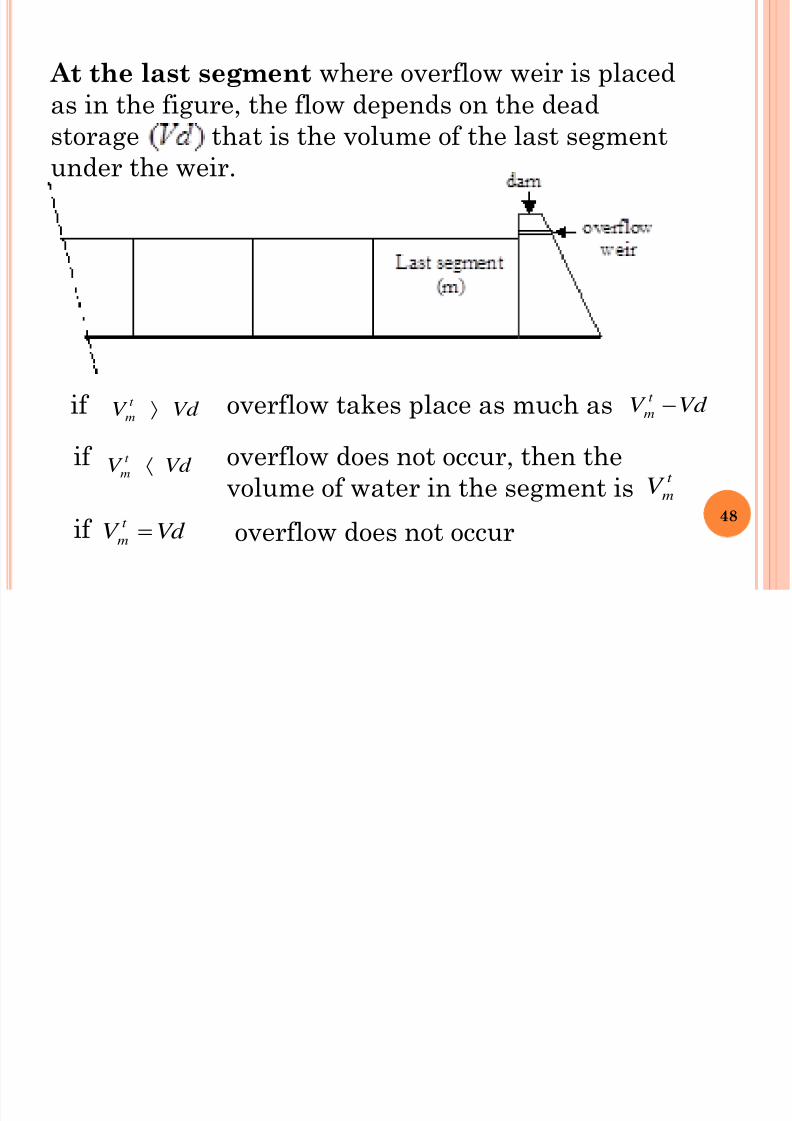
At the last segment where overflow weir is placed
as in the figure, the flow depends on the dead
storage that is the volume of the last segmentunder the weir.
Vd V t
m
⟩if overflow takes place as much as Vd V t
m −
if
if
Vd V t
m ⟨ overflow does not occur, then the
volume of water in the segment ist
mV
Vd V t
m = overflow does not occur
48

8/13/2019 Teknologi Konservasi_Danau
http://slidepdf.com/reader/full/teknologi-konservasidanau 49/62
Load of pollutants in reservoir comes from river
water, overland flow, and activities in segments,
such as fish farming. Pollutant load at the first
segment during a specified time
Water Quality Model
( )t ∆
t t t t l Li Lr L 111 −+= where
t t t ciQr Lr =1
t t t t f coqs Li 1111 +=
49
8/13/2019 Teknologi Konservasi_Danau
http://slidepdf.com/reader/full/teknologi-konservasidanau 50/62
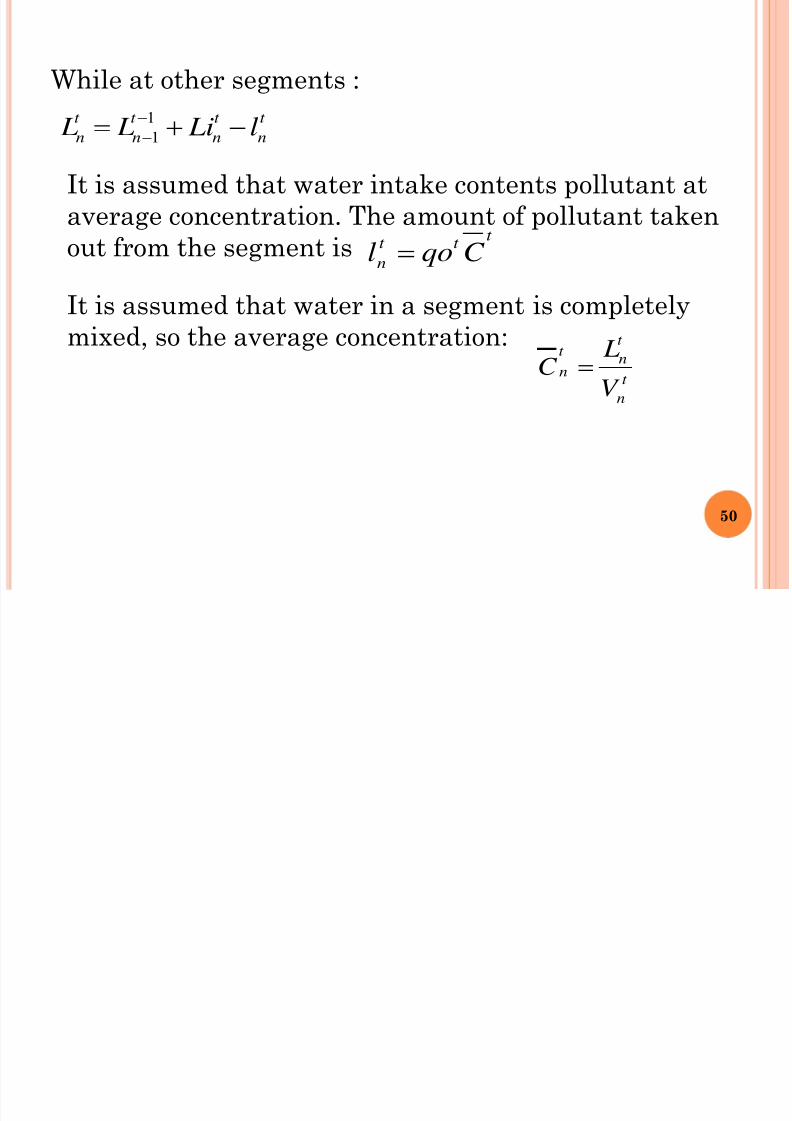
While at other segments :
t
n
t
n
t
n
t
n l Li L L −+=
−
−
1
1
It is assumed that water intake contents pollutant at
average concentration. The amount of pollutant taken
out from the segment ist
t t
n C qol =
It is assumed that water in a segment is completely
mixed, so the average concentration:
t
n
t
nt
n
V
LC =
50
8/13/2019 Teknologi Konservasi_Danau
http://slidepdf.com/reader/full/teknologi-konservasidanau 51/62
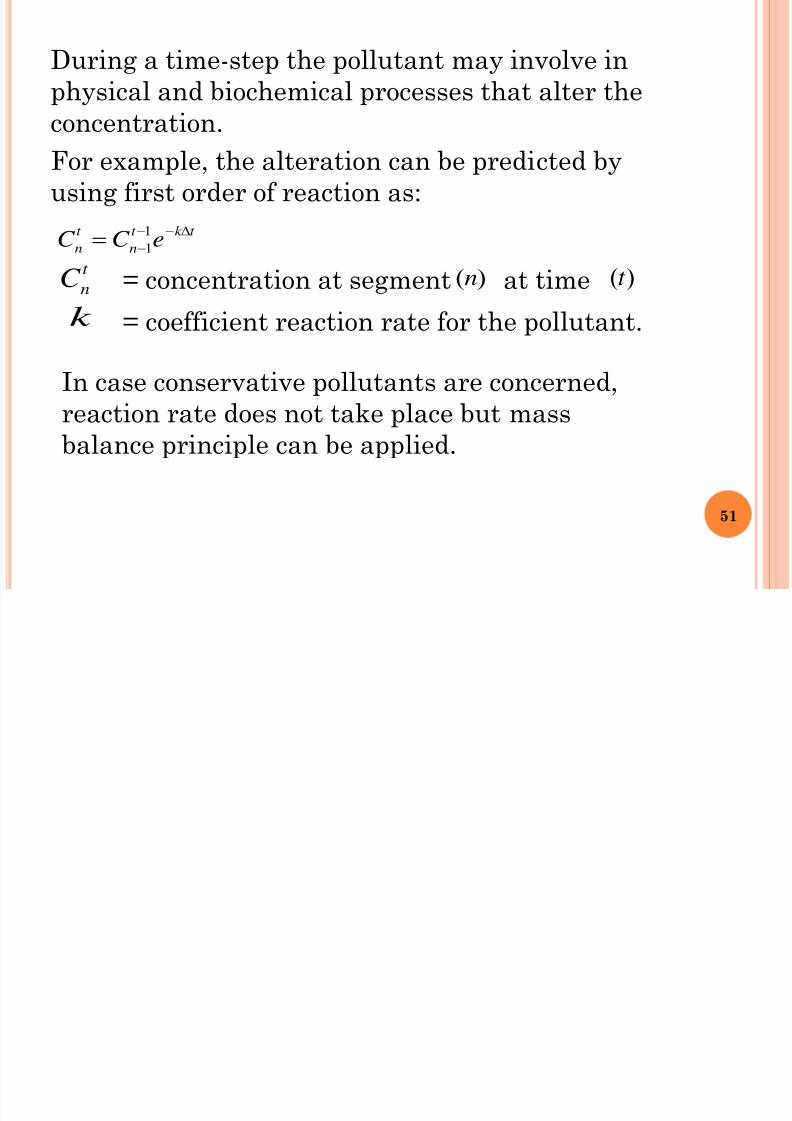
During a time-step the pollutant may involve in
physical and biochemical processes that alter the
concentration.
For example, the alteration can be predicted by
using first order of reaction as:
t k t
n
t
n eC C ∆−−
−=
1
1
t
nC = concentration at segment )(n at time )(t k = coefficient reaction rate for the pollutant.
In case conservative pollutants are concerned,
reaction rate does not take place but massbalance principle can be applied.
51

8/13/2019 Teknologi Konservasi_Danau
http://slidepdf.com/reader/full/teknologi-konservasidanau 52/62
The computer model is applied into Saguling
reservoir that is divided into 12 segments
APPLICATION OF THE MODEL
52
8/13/2019 Teknologi Konservasi_Danau
http://slidepdf.com/reader/full/teknologi-konservasidanau 53/62
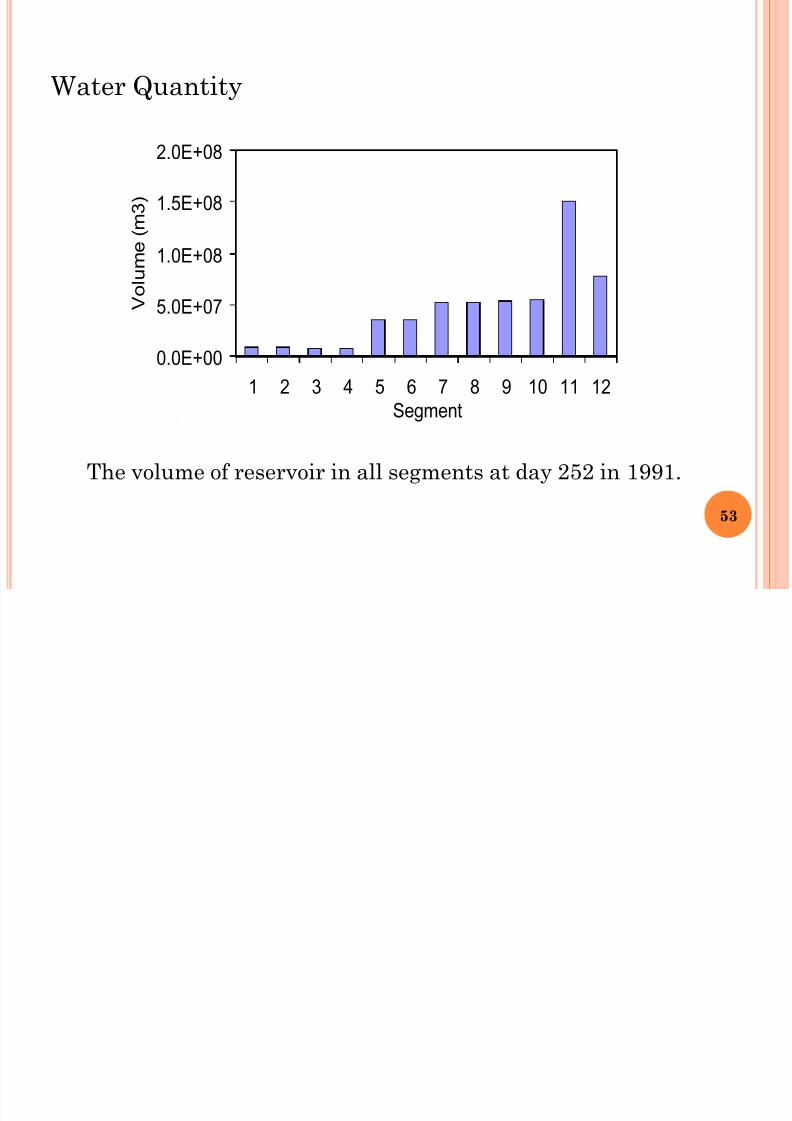
Water Quantity
0.0E+00
5.0E+07
1.0E+08
1.5E+08
2.0E+08
1 2 3 4 5 6 7 8 9 10 11 12
Segment
V o l
u m e ( m 3 )
The volume of reservoir in all segments at day 252 in 1991.
53
8/13/2019 Teknologi Konservasi_Danau
http://slidepdf.com/reader/full/teknologi-konservasidanau 54/62
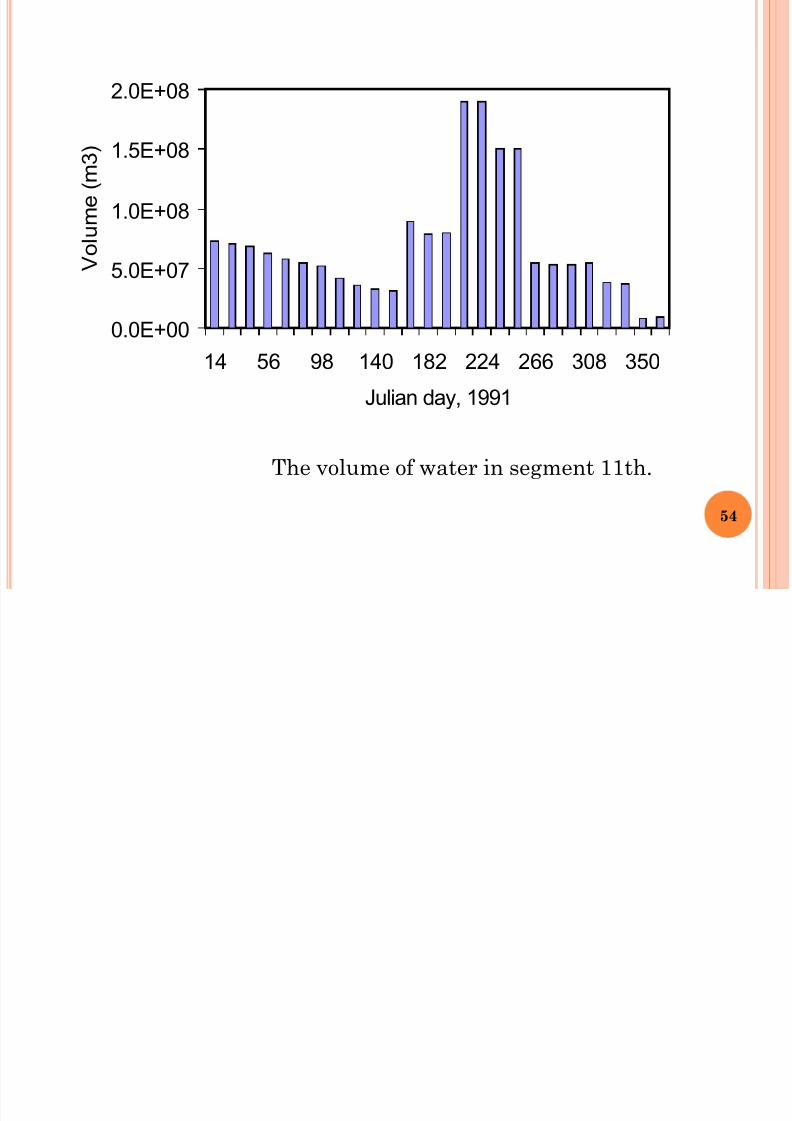
0.0E+00
5.0E+07
1.0E+08
1.5E+08
2.0E+08
14 56 98 140 182 224 266 308 350
Julian day, 1991
V o l u m e ( m 3 )
The volume of water in segment 11th.
54
8/13/2019 Teknologi Konservasi_Danau
http://slidepdf.com/reader/full/teknologi-konservasidanau 55/62
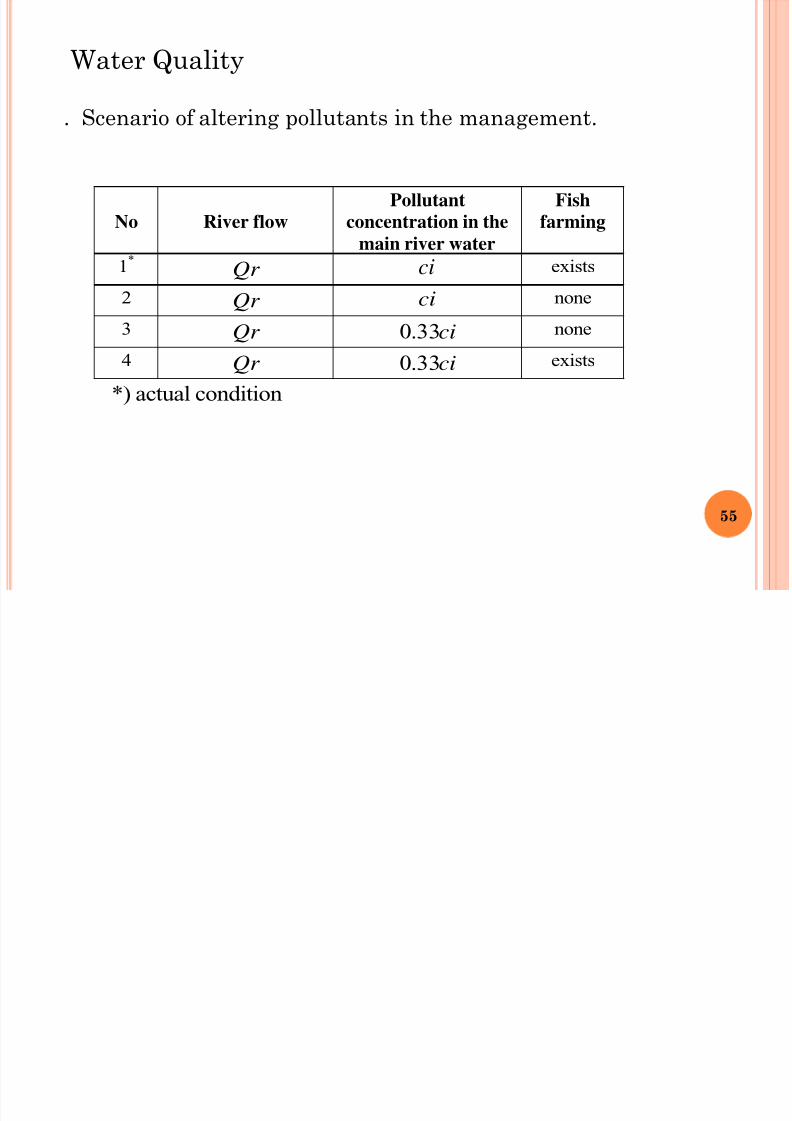
No River flow
Pollutant
concentration in the
main river water
Fish
farming
1*
Qr ci exists
2 Qr ci none
3 Qr ci33.0 none
4 Qr ci33.0 exists
*) actual condition
. Scenario of altering pollutants in the management.
Water Quality
55

8/13/2019 Teknologi Konservasi_Danau
http://slidepdf.com/reader/full/teknologi-konservasidanau 56/62
0
0.2
0.4
0.6
0.8
1
1 2 3 4 5 6 7 8 9 10 11 12
Segment
P h
o s p h o r ( g / m 3 )
Calculated
Measured
Concentration of pollutant along the reservoir at day 252
year 1991 and the calculated results using data of actual
condition (scenario 1). 56

8/13/2019 Teknologi Konservasi_Danau
http://slidepdf.com/reader/full/teknologi-konservasidanau 57/62
0
0.2
0.4
0.6
0.8
1
0 50 100 150 200 250 300 350 400
Julian day, 1991
P h
o s p h o r ( g / m 3 )
Fluctuation of concentration of pollutant at segment
eleven using data of actual condition in 1991 (scenario 1).57

8/13/2019 Teknologi Konservasi_Danau
http://slidepdf.com/reader/full/teknologi-konservasidanau 58/62
0
0.2
0.4
0.6
0.8
1
0 1 2 3 4 5 6 7 8 9 10 11 12
Segment
P H o s p h o r ( g / m 3 )
Concentration of pollutant along the reservoir atday 252 in 1991 given scenario 3.
58
8/13/2019 Teknologi Konservasi_Danau
http://slidepdf.com/reader/full/teknologi-konservasidanau 59/62
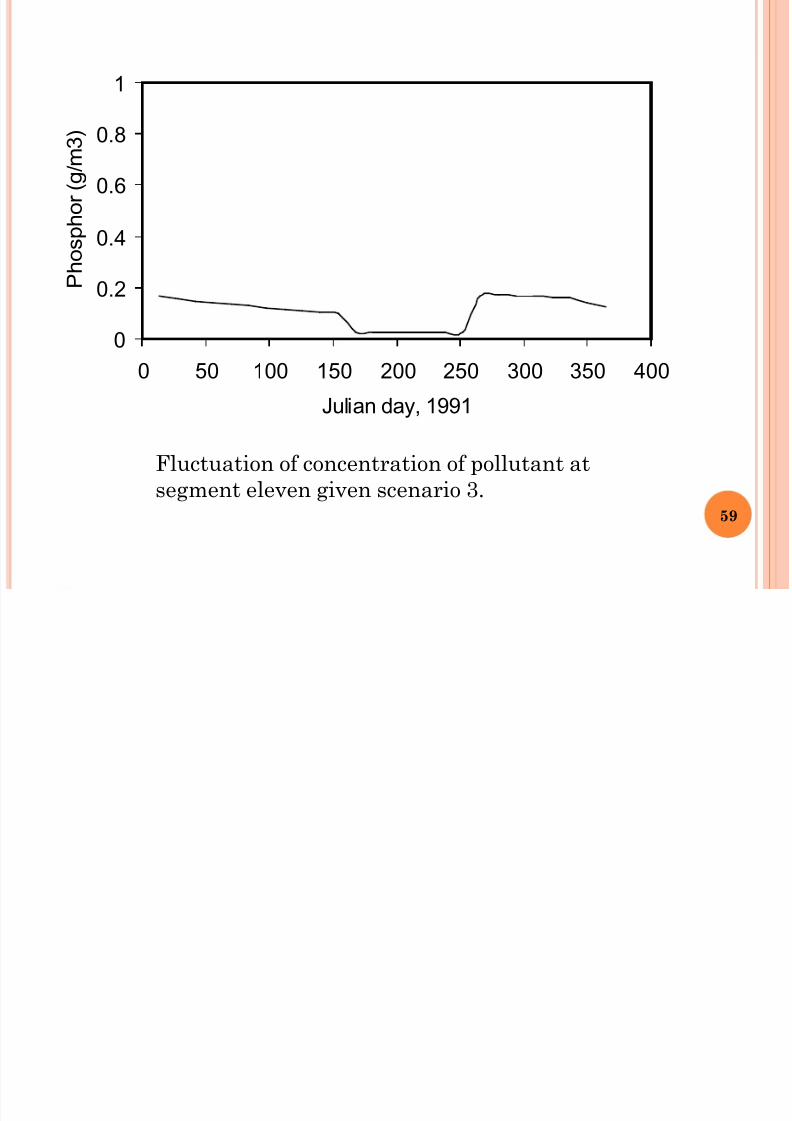
0
0.2
0.4
0.6
0.8
1
0 50 100 150 200 250 300 350 400
Julian day, 1991
P
h o s p h o r ( g / m 3
)
Fluctuation of concentration of pollutant at
segment eleven given scenario 3.59
8/13/2019 Teknologi Konservasi_Danau
http://slidepdf.com/reader/full/teknologi-konservasidanau 60/62
CONCLUSION
Water quality of in a reservoir is under the
influence of point sources and diffuse sources
quality of Main River water
overland flow, andactivities in segments.
The fate of pollutant in a reservoir depends on the
water movement characteristics and biochemicalprocesses that are specific for each segment.
60

8/13/2019 Teknologi Konservasi_Danau
http://slidepdf.com/reader/full/teknologi-konservasidanau 61/62
The reservoir is divided into segments
activities related to pollutant increments and water
consumption could be included in a mathematical
model.
Water in a segment is assumed to move to the nextsegment and at the same time alterations on
pollutant concentrations take place.
61
8/13/2019 Teknologi Konservasi_Danau
http://slidepdf.com/reader/full/teknologi-konservasidanau 62/62