Technology for shaping everyday materials - Biesse Group · Group turnover breakdown December 2010...
53
Technology for shaping everyday materials Milan – March 2011
Transcript of Technology for shaping everyday materials - Biesse Group · Group turnover breakdown December 2010...

Technology for shaping
everyday materials
Milan – March 2011

1
1
glass & stone
mechatronic
service
wood
tooling
Group business structure
2
2
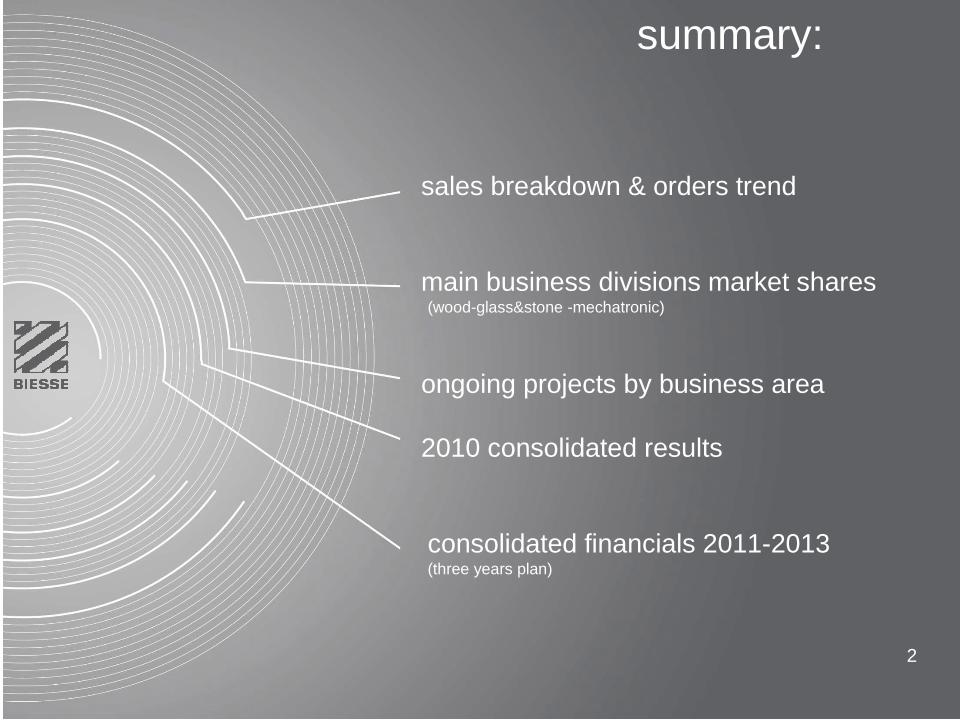
sales breakdown & orders trend
main business divisions market shares(wood-glass&stone -mechatronic)
ongoing projects by business area
2010 consolidated results
consolidated financials 2011-2013 (three years plan)
summary:

Group turnover breakdown December 2010
countries
31,2%
15,6%
16,7%
8,7%
18,5%
9,3%
Italy
Western E.
Eastern E.
U.S.A. - Canada
Asia Pacif ic
Rest of the W.
business division
59,5%15,8%
5,8%
2,3%
16,6%
w ood
glass & stone
mechatronic
tooling
service
end-users
55.0%
20.0%
10.0%
15.0%
housing
office
store f ixture
frames
type
11.0%
16.6%
72.4%
machines
systems
spare parts &billable services
4.7%
China

4
20,0
30,0
40,0
50,0
60,0
70,0
80,0
90,0
100,0
110,0
120,0
130,0
140,0
2008IQ
2008IIQ
2008IIIQ
2008IVQ
2009IQ
2009IIQ
2009IIIQ
2009IVQ
2010IQ
2010IIQ
2010IIIQ
2010IVQ
orders intake backlog
€/mln
Group orders intake & backlog
quarterly trend
orders intakes: FY2010 ags FY2009:
+35%orders intake 2 months 2011:
+24% ags 2010
+95% ags 2009
-55% ags 2008backlog February 2011: € 92.8 mln
5
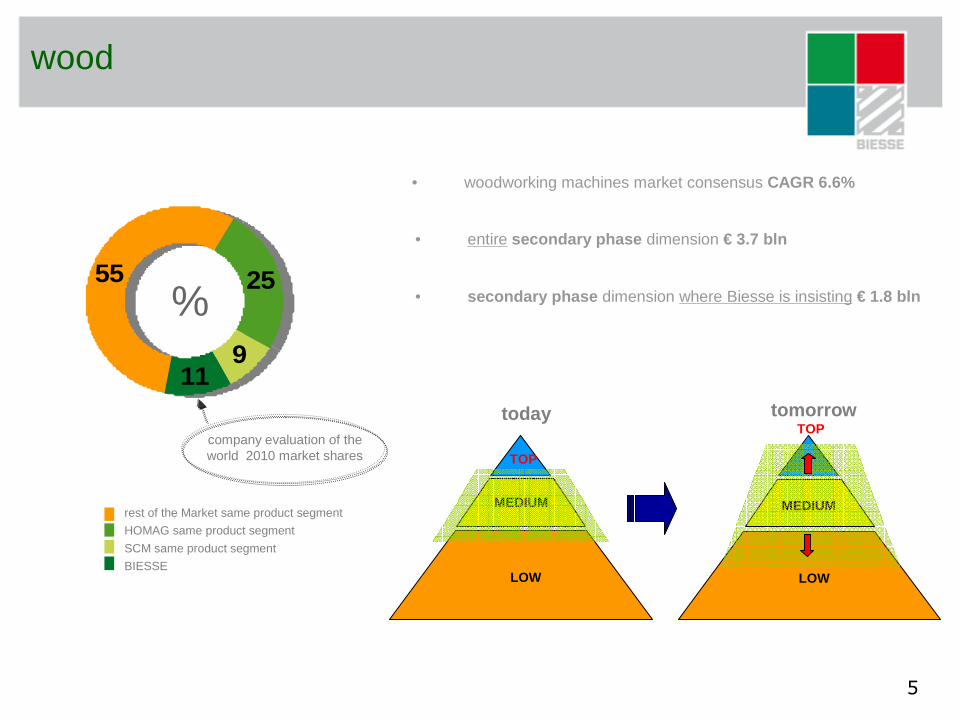
wood
11
25
9
55
11
25
9
55%
rest of the Market same product segment
HOMAG same product segment
SCM same product segment
BIESSE
• woodworking machines market consensus CAGR 6.6%
company evaluation of the world 2010 market shares
• entire secondary phase dimension € 3.7 bln
• secondary phase dimension where Biesse is insisting € 1.8 bln
today tomorrow
LOW
MEDIUM
LOW
MEDIUM
TOP
TOP
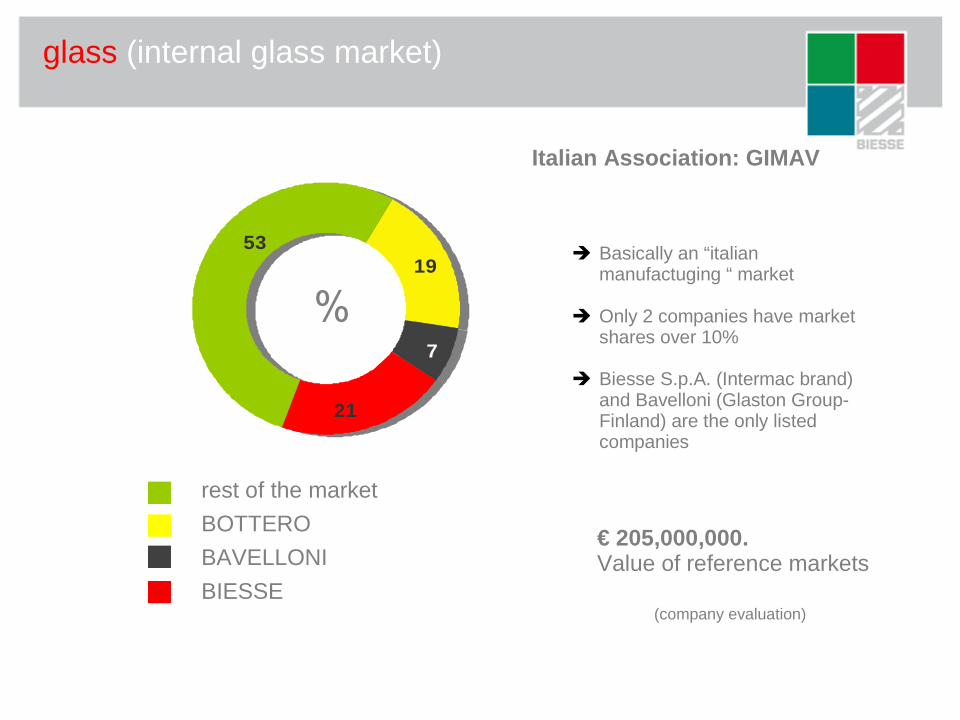
glass (internal glass market)
� Basically an “italianmanufactuging “ market
� Only 2 companies have market shares over 10%
� Biesse S.p.A. (Intermac brand) and Bavelloni (Glaston Group-Finland) are the only listed companies
19
21
7
5319
21
7
53
%
rest of the market
BOTTERO
BAVELLONI
BIESSE
€ 205,000,000.Value of reference markets
Italian Association: GIMAV
(company evaluation)

stone
� Biesse clear worldwide market leader
� Only 1 company (Biesse) has market shares over 10%
� Biesse S.p.A. (Intermacbrand) and Bavelloni(Glaston Co.) are the only listed companies
3
14
4
79
3
14
4
79 %
rest of the market
BOTTERO
BAVELLONI
BIESSE
€ 46,000,000.Value of reference markets
Italian Association: Marmomacchine
(company evaluation)

8
wood: main business projects
R & D increase
time to market reduction
“product & production supply chain”costs reduction
distribution & salesnetwork improvement
widening of the “systems” activities
“windows & doors”sales increase
new productsdevelopment
organicgrowth

9
wood: new products development
new products and gamma fulfilment
10
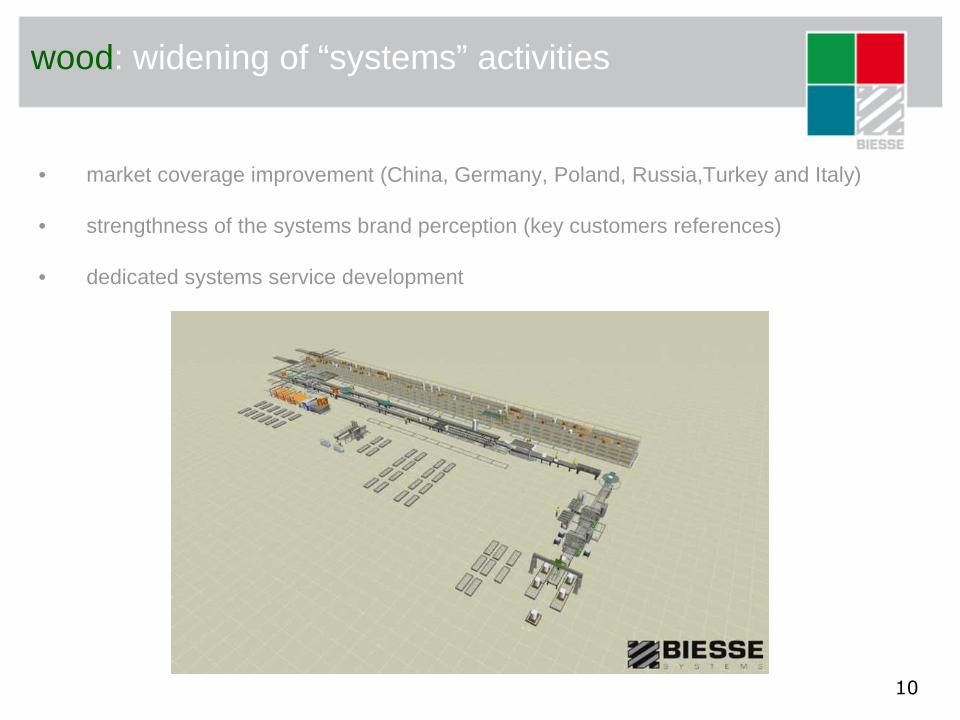
wood: widening of “systems” activities
• market coverage improvement (China, Germany, Poland, Russia,Turkey and Italy)
• strengthness of the systems brand perception (key customers references)
• dedicated systems service development

11
wood: windows and doors frames
� new “product specialist” fully focused on the frames sector
� increase of internal & external resources to support the sales trend
12
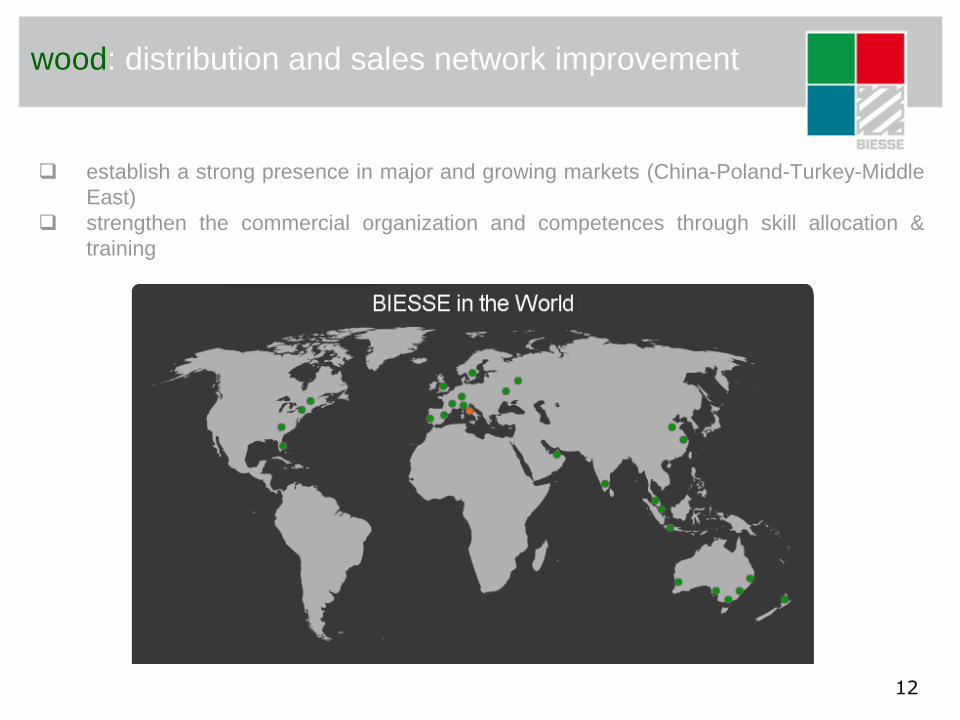
wood: distribution and sales network improvement
� establish a strong presence in major and growing markets (China-Poland-Turkey-MiddleEast)
� strengthen the commercial organization and competences through skill allocation & training

13
wood: product/production supply chain cost reductions
� India:transportation, assembly and components purchase costs reduction
� Italy:layout & wharehouse optimization – product engineering cost reduction
PRODUCT
PROCESS
ORGANIZATION
STRATEGY
BPR
KAIZEN

14
wood: time to market reduction
� 12 months launch time for new products
� structural reaorganization of the engineering, prototipe and pre-serie process
pre-serieconcept business plan progettazione prototipazione
= 12 months
15
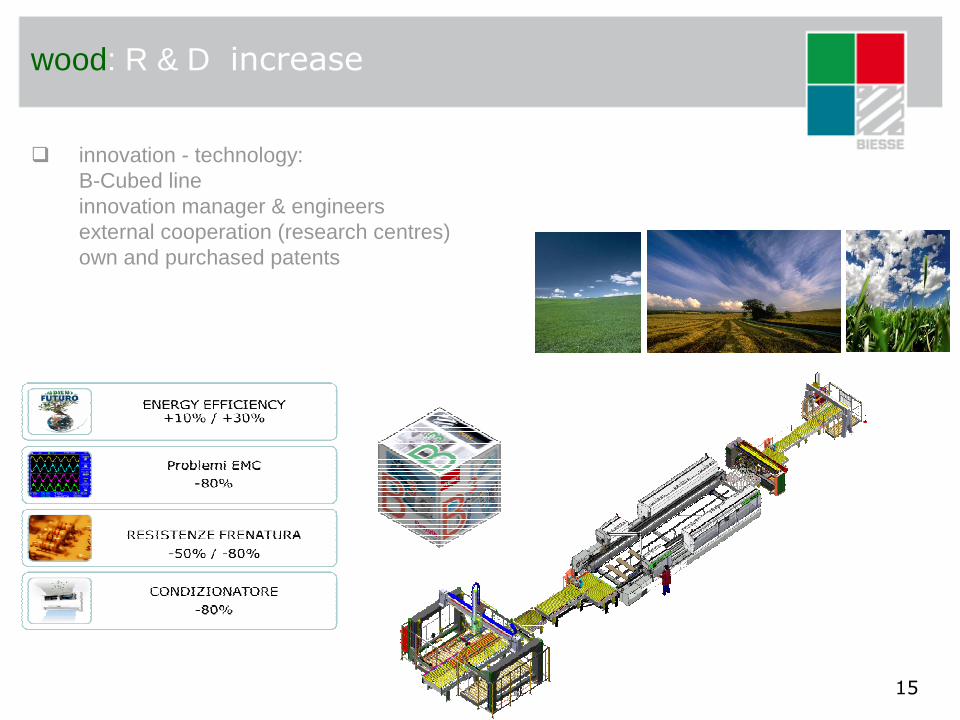
wood: R & D increase
� innovation - technology:B-Cubed lineinnovation manager & engineersexternal cooperation (research centres)own and purchased patents

16
glass & stone: main business projects
products gamma fulfilment
“new” productsdistribution & sales
network improvement
organicgrowth
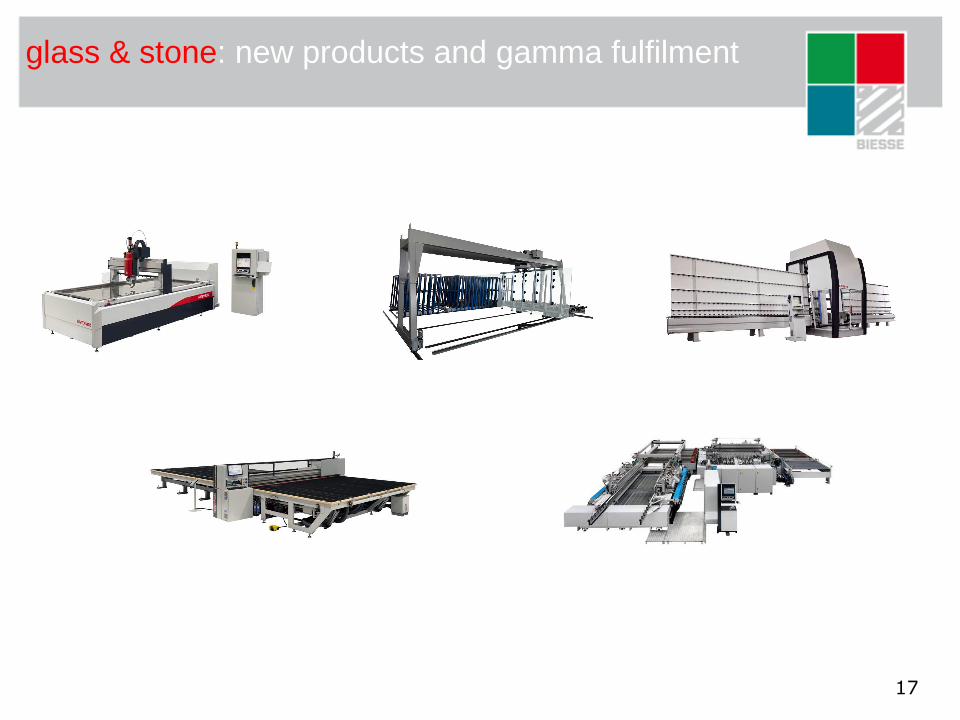
17
glass & stone: new products and gamma fulfilment

18
glass & stone: distribution and sales network improvement
� establish a strong presence in major and growing markets� strengthen the commercial organization and competences through skill allocation &
training especially using the Biesse Group Subsidiaries

19
mechatronic: main business projects
distribution and salesnetwork improvement
product & productionsupply chain cost
reduction
new productsdevelopment
organicgrowth
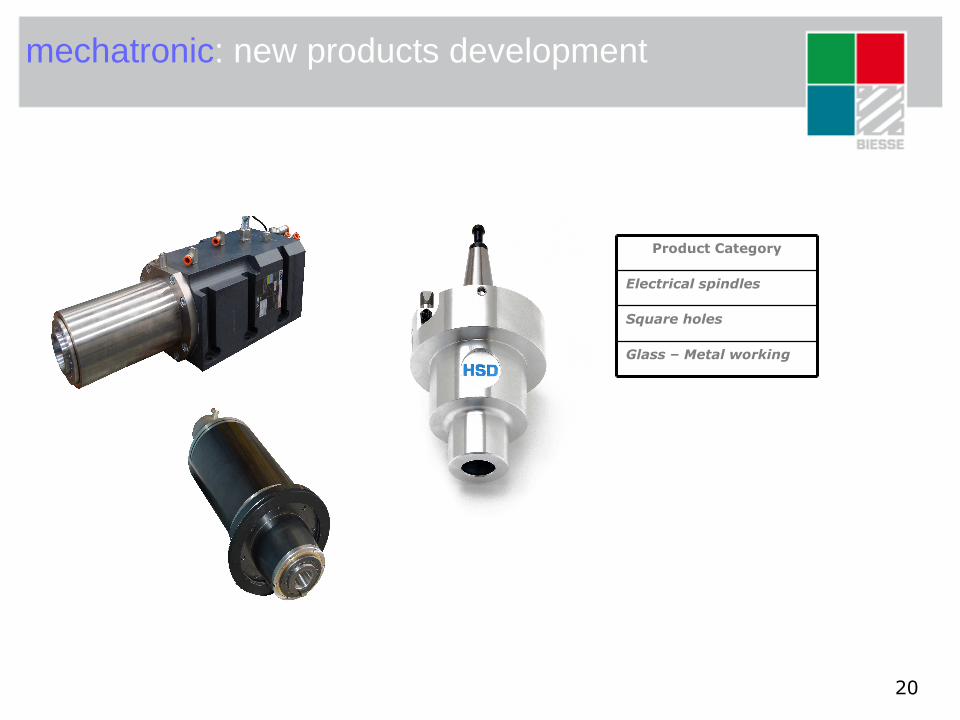
20
mechatronic: new products development
Product Category
Electrical spindles
Square holes
Glass – Metal working

21
mechatronic: distribution and sales network improvement
� establish a strong presence in major and mature markets� strengthen the commercial organization and competences through skill allocation &
training especially
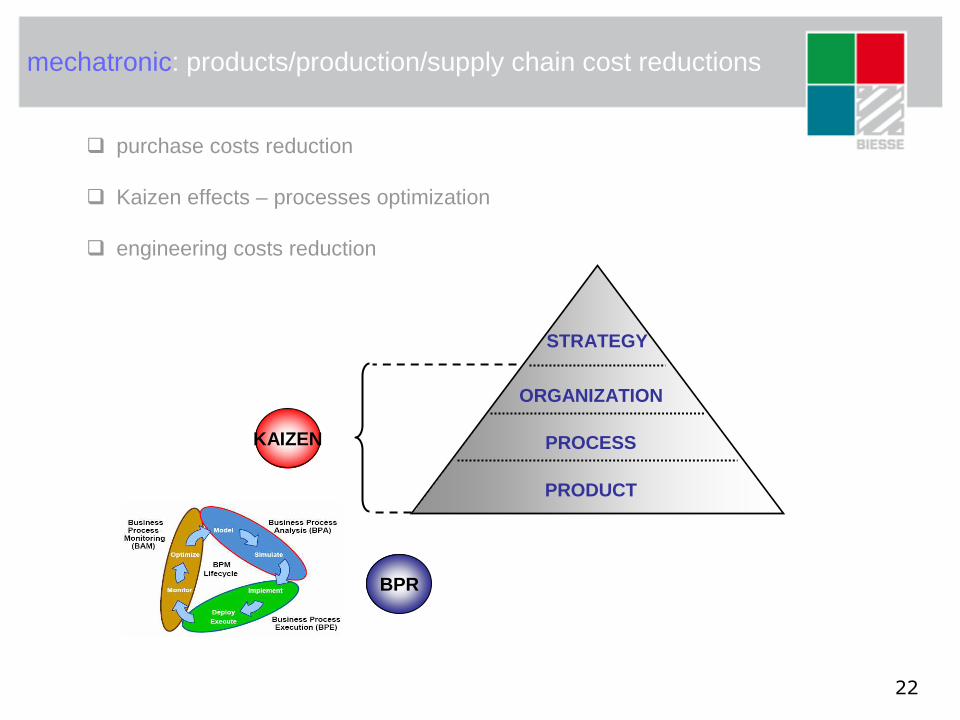
22
mechatronic: products/production/supply chain cost reductions
� purchase costs reduction
� Kaizen effects – processes optimization
� engineering costs reduction
PRODUCT
PROCESS
ORGANIZATION
STRATEGY
BPR
KAIZEN
23
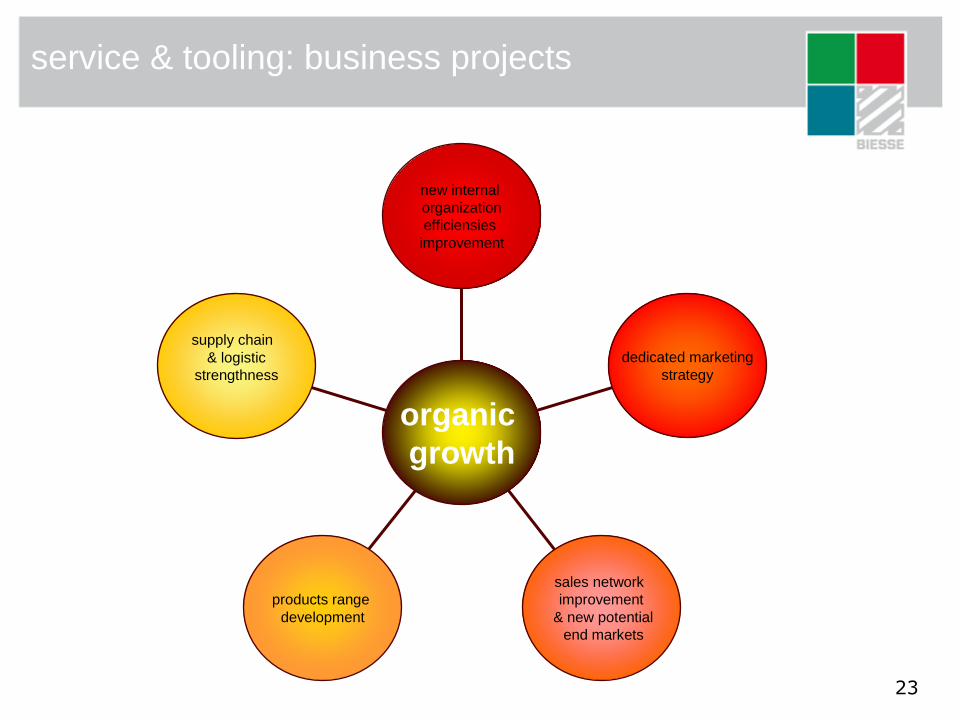
service & tooling: business projects
new internalorganizationefficiensiesimprovement
dedicated marketingstrategy
sales network improvement
& new potentialend markets
products rangedevelopment
supply chain& logistic
strengthness
organicgrowth
24
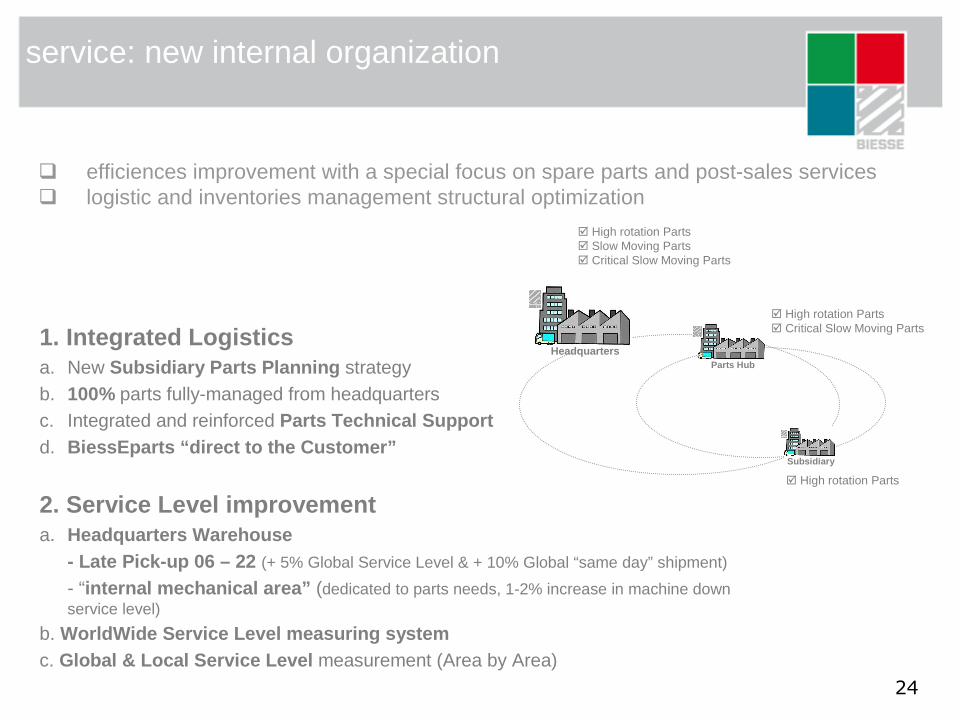
service: new internal organization
� efficiences improvement with a special focus on spare parts and post-sales services� logistic and inventories management structural optimization
1. Integrated Logisticsa. New Subsidiary Parts Planning strategyb. 100% parts fully-managed from headquarters c. Integrated and reinforced Parts Technical Support d. BiessEparts “direct to the Customer”
2. Service Level improvementa. Headquarters Warehouse
- Late Pick-up 06 – 22 (+ 5% Global Service Level & + 10% Global “same day” shipment)
- “internal mechanical area” (dedicated to parts needs, 1-2% increase in machine down service level)
b. WorldWide Service Level measuring systemc. Global & Local Service Level measurement (Area by Area)
� High rotation Parts� Slow Moving Parts� Critical Slow Moving Parts
HeadquartersParts Hub
� High rotation Parts� Critical Slow Moving Parts
Subsidiary
� High rotation Parts

25
service: 24h time & knowledge management
� 24 hours world-wide key customer support� shared web portal with knowledge informations concerning problems solutions
0 2413
7 19
15
Pesaro7 - 19
Bangalore6 - 17
Charlotte9 - 20
2

26
service: dedicated marketing strategy
� market analysis & shares
� create a service dedicated image improving the Biesse customers perception

27
tooling: sales network improvement & potential new markets
� new and more focused sales network composed by dealers and agents
� development of photovoltaic & solar potential end market
� increase of automotive glass sales expectations
� development of the Latin America (trade) – Asia&Middle East (Subsidiaries)

28
tooling: products range development
� high speed wheels for cnc product range (glass)
� new double edger and straight machines (glass)
� new dedicated product range for automotive glass
� high speed routers for engineered stone (stone)
� new rubber polishing wheels (stone)
� new dedicated product range for polisher (stone)
� new dedicated product range for bridge saw (stone)
29
29
P & L details
EBITDA bridge
cashflow & net debt
consolidated sales
net operating working capital
2010 consolidated results:

30
Group P&L details: December 2010
€/mln
Net Sales
Value Added% of net sales
Labour cost% of net sales
EBIT% of net sales
EBITDA% of net sales
Net result% of net sales
52.8
123.437.7%
107.732.9%
0.1---%
15.74.8%
-5.7---%
FY 2010
327.5+22.2%
59.438.1%
54.534.9%
-1.7---%
4.93.2%
-3.7---%
1h 2010
155.952.8
84.431.5%
91.634.2%
-32.9---%
-8.4---%
-27.2---%
FY 2009
268.0
2010 vs 2009
+59.5 €
+39 €
+16.1 €
+24.1 €
+33.0 €
+21.5 €
31
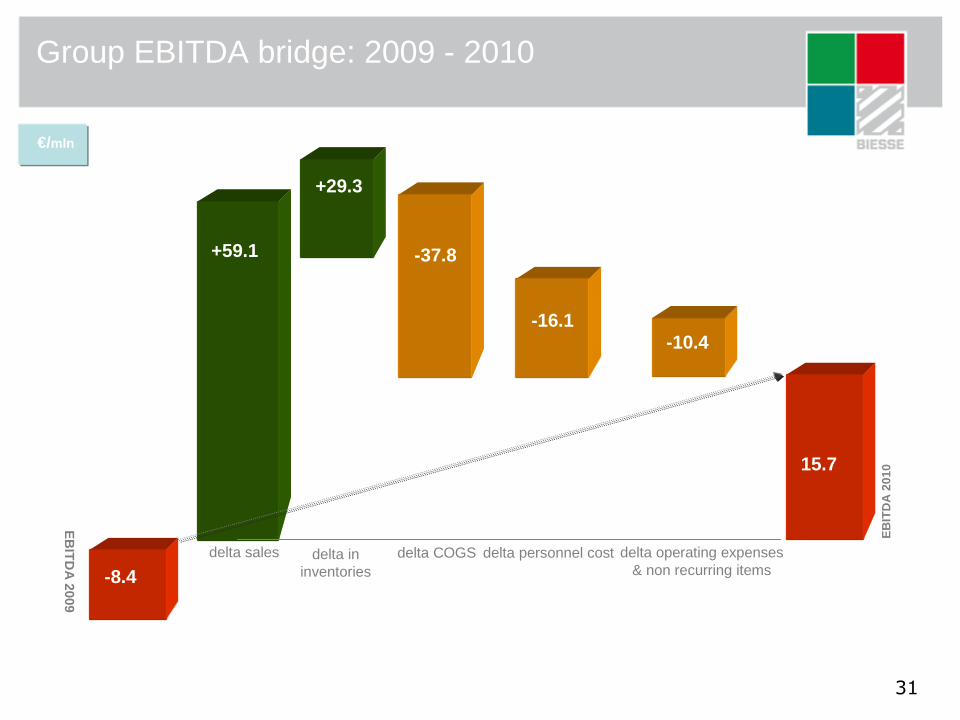
Group EBITDA bridge: 2009 - 2010
EB
ITD
A 2009
delta operating expenses& non recurring items
+59.1
+10.0
-8.4
15.7
EB
ITD
A 2
010
delta sales
-16.1
delta personnel cost
-10.4
€/mln
-37.8
delta COGS
+29.3
delta ininventories

32
Group Cashflow – Net Financial Position
€/mln
GrossCashflow
Net Capex% of net sales
(tangible & intangible)
Free Cashflow% of net sales
N.F.P.% of net sales
2009
-6.0-2.2%
-32.7-12.2%
2010
13.84.2%
-18.9-5.7%
10.13.9%
12.13.8%
2010 vs 2009
4.1 25.9 +21.8 €
+2.0 €
+19.8 €
0.15gearing0.26
33
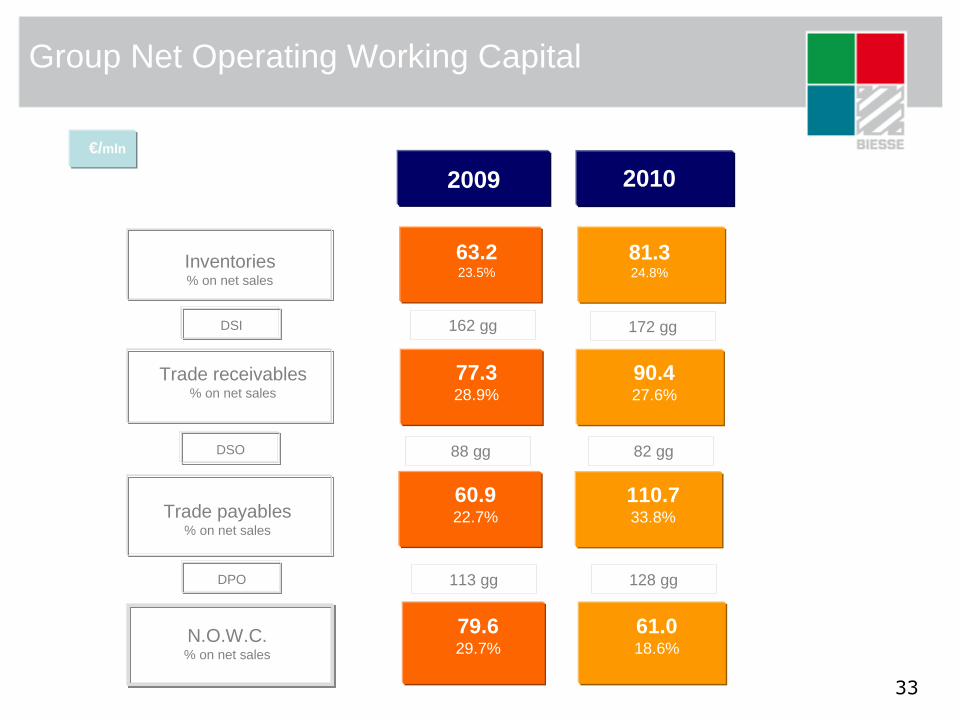
Group Net Operating Working Capital
€/mln
Inventories% on net sales
Trade receivables% on net sales
Trade payables% on net sales
N.O.W.C.% on net sales
DSI
DSO
63.223.5%
77.328.9%
60.922.7%
79.629.7%
81.324.8%
90.427.6%
110.733.8%
61.018.6%
2009 2010
172 gg
82 gg
128 ggDPO
88 gg
113 gg
162 gg
34
34
P & L details
EBITDA & EBIT evolution
cashflow & net debt
consolidated sales
ratios - equity informations
three years plan 2011-2013:

35
Group consolidated revenues
€/mln
net sales
306,6
466,0454,3
268,0
327,5
348,5
402,0
456,4
0
50
100
150
200
250
300
350
400
450
500
2003 2007 2008 2009 2010 2011e 2012e 2013e
CAGR 2010-2013: 11.7%
three years plan

36
Group P&L details
€/mln
Net Sales
Value Added% of net sales
Labour cost% of net sales
EBIT% of net sales
EBITDA% of net sales
Net result% of net sales
52.8
123.437.7%
107.732.9%
0.1---%
15.74.8%
-5.7---%
69.4
137.239.4%
116.533.4%
5.01.4%
20.75.9%
2.30.7%
69.4
164.841.0%
122.230.4%
24.36.0%
42.610.6%
16.94.2%
FY 2010 FY 2011e FY 2012e FY 2013e
456.4+13.5%
194.842.7%
130.028.5%
45.910.1%
64.814.2%
32.07.0%
three years plan
2010 vs 2013
+128.9 €327.5+22.2%
348.5+10.4%
402.0+15.4%
59.438.1%
54.534.9%
-1.7---%
4.93.2%
-3.7---%
1h 2010
155.952.8
84.431.5%
91.634.2%
-32.9---%
-8.4---%
-27.2---%
FY 2009
268.0
+71.4 €
+22.3 €
+49.1 €
+45.8 €
+37.7 €

37
42,7%
41,0%39,4%
37,7%
21,5%
36,9%
32,3%
31,7%
-10,0
40,0
90,0
140,0
190,0
240,0
2003 2007 2008 2009 2010 2011e 2012e 2013e -5,0%
5,0%
15,0%
25,0%
35,0%
45,0%
Value Added Value Added margin
Group Value Added evolution
€/MIL

38
28,5%
30,4%
33,4%32,9%
34,6%
24,4%
22,6%
29,1%
-10,0
40,0
90,0
140,0
190,0
2003 2007 2008 2009 2010 2011e 2012e 2013e 0,0%
10,0%
20,0%
30,0%
40,0%
Labour cost Labour cost on sales
Group Labour cost evolution
€/MIL

39
14,2%
10,6%
5,9%
4,8%
-3,1%
12,5%
17,0%
2,6%
-10,0
0,0
10,0
20,0
30,0
40,0
50,0
60,0
70,0
80,0
90,0
2003 2007 2008 2009 2010 2011e 2012e 2013e
-7,0%
-2,0%
3,0%
8,0%
13,0%
18,0%
EBITDA EBITDA margin
Group EBITDA evolution
€/MIL

40
Group EBIT evolution
€/MIL
10,1%
6,0%
1,4%
0,0%
-12,3%
7,7%
14,0%
-1,9%
0
10
20
30
40
50
60
70
2003 2007 2008 2009 2010 2011e 2012e 2013e
-15,0%
-10,0%
-5,0%
0,0%
5,0%
10,0%
15,0%
EBIT EBIT margin
41
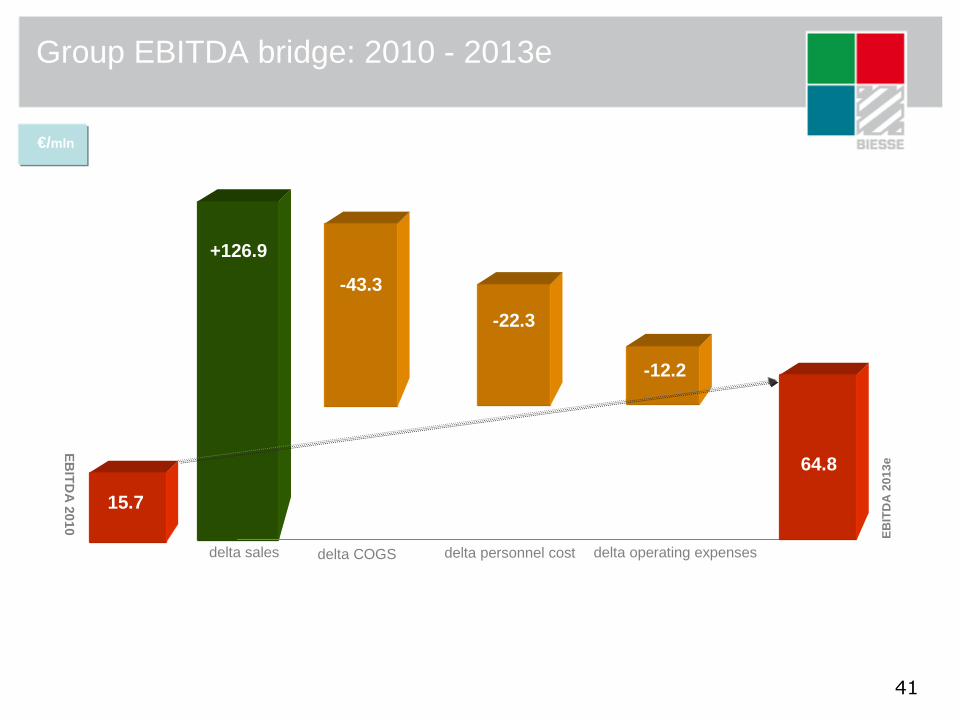
Group EBITDA bridge: 2010 - 2013e
EB
ITD
A 2010
delta operating expenses
+126.9
+10.0
15.7
64.8
EB
ITD
A 2
013e
delta sales
-22.3
delta personnel cost
-12.2
€/mln
-43.3
delta COGS

42
Group Cashflow – Net Financial Position
€/mln
GrossCashflow
Net Capex% of net sales
(tangible & intangible)
Free Cashflow% of net sales
N.F.P.% of net sales
2010
13.84.2%
-18.9-5.7%
2011e
5.01.4%
-13.9-4.0%
2012e
6.71.7%
-7.2-1.8%
2013e
41.5
12.13.8%
13.13.8%
18.74.6%
12.32.7%
31.26.8%
24.0+5.2%
three years plan
2011-2012-2013
25.9 18.1 25.4 +85.0 €
-44.1 €
+42.9 €
43
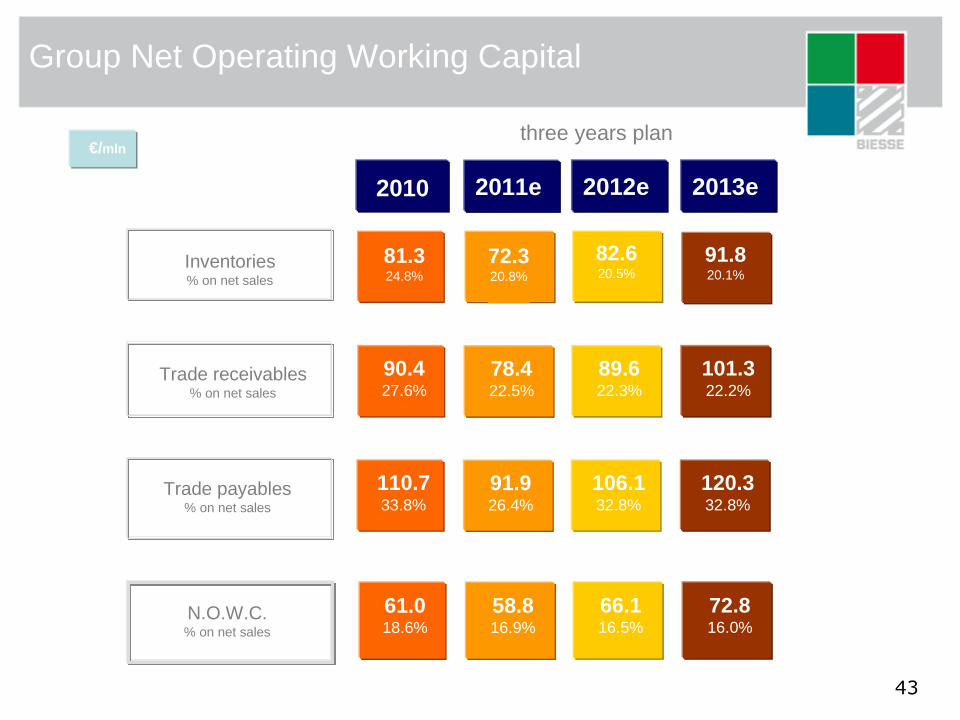
Group Net Operating Working Capital
€/mln
Inventories% on net sales
Trade receivables% on net sales
Trade payables% on net sales
N.O.W.C.% on net sales
81.324.8%
90.427.6%
110.733.8%
61.018.6%
72.320.8%
78.422.5%
91.926.4%
58.816.9%
82.620.5%
89.622.3%
106.132.8%
66.116.5%
91.820.1%
101.322.2%
120.332.8%
72.816.0%
2010 2011e 2012e 2013e
three years plan

44
Group net financial position evolution: 2007-2013e
-40
-30
-20
-10
0
10
20
30
2008
2007
2009
20102011e
2012e
2013e
three years plan

45
Group net debt against EBITDA: 2007-2013e
-40,0
-20,0
0,0
20,0
40,0
60,0
80,0
2007 2008 2009 2010 2011e 2012e 2013e
-2,0
-1,0
0,0
1,0
2,0
3,0
4,0
net debt EBITDA debt/EBITDA
46
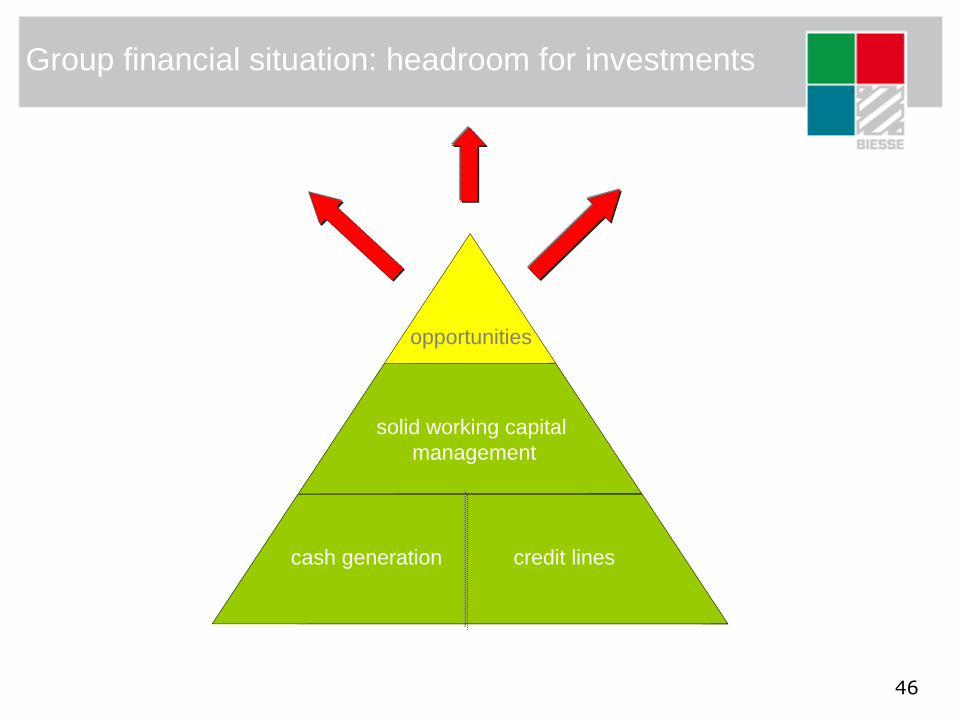
Group financial situation: headroom for investments
cash generation credit lines
solid working capital management
opportunities
47
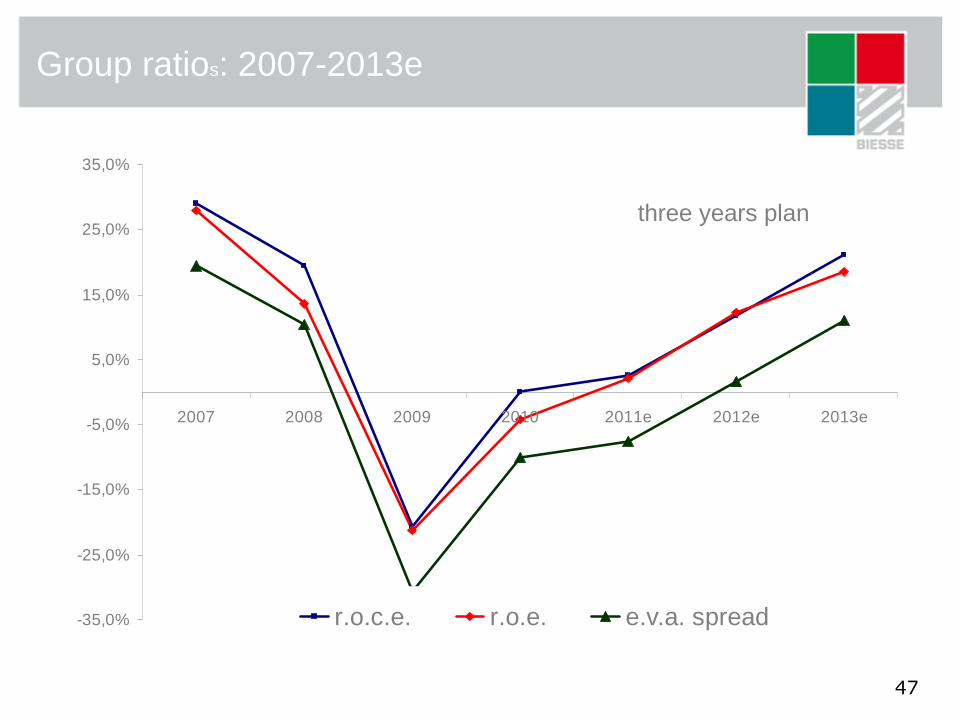
Group ratios: 2007-2013e
three years plan
-35,0%
-25,0%
-15,0%
-5,0%
5,0%
15,0%
25,0%
35,0%
2007 2008 2009 2010 2011e 2012e 2013e
r.o.c.e. r.o.e. e.v.a. spread

48
58.5
28.6
7.15.8
%
Bi.Fin s.r.l (Selci family )
free float*
FCP Echiquier Agenor
Pictet - CIE Banquiers
treasury shares: 1.78%
* Including treasury shares -
shareholders breakdown > 2%

shareholders breakdown “by type”
49
12.4
29.158.5
retail
institutionals
Selci family
%

shareholders breakdown “by country”
50
74.2*
17.6
8.2
Italy
UE
rest of the world
%
* Including Bi.Fin shares -
•Switzerland
•U.S.A.
•Norway
•France
•U.K.
•Luxembourg-the Netherlands

� This presentation has been prepared by Biesse S.p.A. for information purposesonly and for use in presentations of the Group’s results and strategies.
� For further details on the Biesse S.p.A.. reference should be made to publiclyavailable information. including the Quarterly Reports, the Annual Reports and the Three Years Business Plan.
� Statements contained in this presentation, particularly the ones regarding anyBiesse S.p.A. possible or assumed future performance, (business plan) are or maybe forward looking statements and in this respect they involve some risks and uncertainties.
� Any reference to past performance of the Biesse S.p.A. shall not be taken as anindication of future performance.
� This document does not constitute an offer or invitation to purchase or subscribefor any shares and no part of it shall form the basis of or be relied upon in connection with any contract or commitment whatsoever.
� By attending the presentation you agree to be bound by the foregoing terms.
disclaimer

Alberto Amurri
Group Financial Manager&
Head of Investor Relations Dept.Via della Meccanica 16 61122 PesaroITALYhttp://www.biesse.com/Corporate/en/InvestorRelations.cms
Tel: +39 0721 439107 / Mob: +39 335 1219556e-mail: [email protected]