TCEQ Environmental Health Update (GI-450)
28
TCEQ Environmental Health Update FROM 2017 AND 2018 DATA This update is based on the latest available health data (up to 2017 for blood lead data and cancer incidence, and 2018 for overall mortality rates and for asthma endpoints). Also presented are environmental data from 2018 to match the health data. ABOUT THE TEXAS COMMISSION ON ENVIRONMENTAL QUALITY (TCEQ) TOXICOLOGY, RISK ASSESSMENT, AND RESEARCH DIVISION (TD) ■ The TD helps the TCEQ make scientifically sound decisions by applying toxicological principles when evaluating environmental data, issuing authorizations, developing environmental regulations, and making policy decisions. The TD also conducts research to address environmental toxicology questions that are important to the state of Texas. ■ TCEQ toxicologists identify chemical hazards, evaluate potential exposures, assess human health risks, and communicate risk to the general public and stakeholders. TOXICOLOGY, RISK ASSESSMENT, AND RESEARCH DIVISION GI-450 (Rev. 4/21) www.tceq.texas.gov/assets/public/comm_exec/pubs/gi/gi-450.pdf
Transcript of TCEQ Environmental Health Update (GI-450)
TCEQ EnvironmentalHealth Update FROM 2017
AND 2018 DATA
This update is based on the latest available health data (up to 2017 for blood lead data and cancer incidence, and 2018 for overall mortality rates and for asthma endpoints). Also presented are environmental data from 2018 to match the health data.
ABOUT THE TEXAS COMMISSION ON ENVIRONMENTAL QUALITY (TCEQ) TOXICOLOGY, RISK ASSESSMENT, AND RESEARCH DIVISION (TD)
■ The TD helps the TCEQ make scientifically sound decisions by applying toxicological principles when evaluating environmental data, issuing authorizations, developing environmental regulations, and making policy decisions. The TD also conducts research to address environmental toxicology questions that are important to the state of Texas.
■ TCEQ toxicologists identify chemical hazards, evaluate potential exposures, assess human health risks, and communicate risk to the general public and stakeholders.
T O X I C O L O G Y , R I S K A S S E S S M E N T , A N D R E S E A R C H D I V I S I O N
GI-450 (Rev. 4/21) www.tceq.texas.gov/assets/public/comm_exec/pubs/gi/gi-450.pdf
ii
Table of Contents Statewide Environmental Health Updates ......................................2Air Quality ..................................................................................................2 Ambient Air Monitoring ........................................................................2 Programs to Decrease Ambient Air Toxics ..........................................2 Air Pollutant Watch List ........................................................................3Drinking Water Notices ..............................................................................4
Health Indicators ...................................................................................4Lead Data ..................................................................................................4Cancer Data ..............................................................................................5Asthma Data ..............................................................................................6Mortality in Texas .......................................................................................7
Regional Updates .................................................................................8Region 1: Amarillo Area .............................................................................8Region 2: Lubbock Area ............................................................................9Region 3: Abilene Area ............................................................................10Region 4: Dallas-Fort Worth Area ............................................................11Region 5: Tyler Area ................................................................................12Region 6: El Paso Area ...........................................................................13Region 7: Midland Area ...........................................................................14Region 8: San Angelo Area .....................................................................15Region 9: Waco Area ...............................................................................16Region 10: Beaumont Area .....................................................................17Region 11: Austin Area ............................................................................18Region 12: Houston Area ........................................................................19Region 13: San Antonio Area ..................................................................20Region 14: Corpus Christi Area ...............................................................21Region 15: Harlingen Area ......................................................................22Region 16: Laredo Area...........................................................................23

1
TCEQ EnvironmentalHealth Update
Common Terms Air monitoring comparison values (AMCVs) are chemical-specific short- and long-term air concentrations used to evaluate air monitoring data. These values are developed to protect human health and welfare, and are set well below levels where health effects are known to occur. Slight exceedances of AMCVs will not necessarily lead to health effects, but the TCEQ works to keep ambient air concentrations below AMCVs. Air toxics, also known as hazardous air pollutants (HAPs), are pollutants that are known or suspected to cause cancer or other serious health effects. Benzene, arsenic, and mercury are examples of air toxics.Automated gas chromatograph (autoGC) is a sampler that measures volatile organic compounds every hour, continuously, 22 hours per day, and 7 days per week. A canister sampler collects volatile organic compounds during a 24-hour sampling duration once every-sixth-day.Volatile organic compounds (VOCs) are potentially toxic chemicals that readily evaporate into the air and are often used as solvents, degreasers, paint thinners, and fuels (e.g. benzene).
2
FIGURE 1 Average Benzene Concentrations at Monitoring Sites in Texas in 2018
FIGURE 2Three State Programs to Decrease
Ambient Air Toxic Levels
Statewide Environmental Health Updates
Air QualityAmbient Air Monitoring
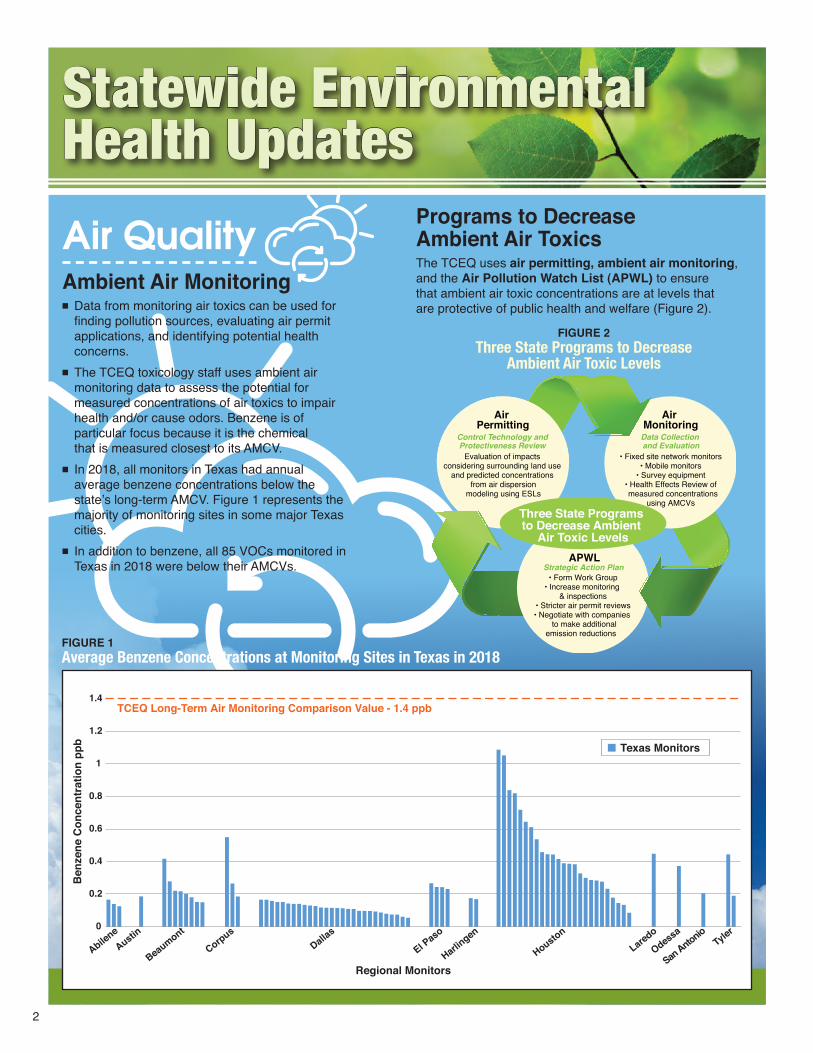
■ Data from monitoring air toxics can be used for finding pollution sources, evaluating air permit applications, and identifying potential health concerns.
■ The TCEQ toxicology staff uses ambient air monitoring data to assess the potential for measured concentrations of air toxics to impair health and/or cause odors. Benzene is of particular focus because it is the chemical that is measured closest to its AMCV.
■ In 2018, all monitors in Texas had annual average benzene concentrations below the state’s long-term AMCV. Figure 1 represents the majority of monitoring sites in some major Texas cities.
■ In addition to benzene, all 85 VOCs monitored in Texas in 2018 were below their AMCVs.
1.4
1
0.8
0.6
0.4
0.2
0
AbileneAustin
CorpusDallas
El Paso
Harlingen
Laredo
OdessaTyler
Regional Monitors
Ben
zene
Con
cent
ratio
n pp
b
1.2
Texas Monitors
TCEQ Long-Term Air Monitoring Comparison Value - 1.4 ppb
San Antonio
Beaumont
Houston
Programs to Decrease Ambient Air ToxicsThe TCEQ uses air permitting, ambient air monitoring, and the Air Pollution Watch List (APWL) to ensure that ambient air toxic concentrations are at levels that are protective of public health and welfare (Figure 2).
APWLStrategic Action Plan
• Form Work Group• Increase monitoring
& inspections• Stricter air permit reviews• Negotiate with companies
to make additional emission reductions
Air Monitoring
Data Collection and Evaluation
• Fixed site network monitors• Mobile monitors
• Survey equipment• Health Effects Review of measured concentrations
using AMCVs
Air Permitting
Control Technology andProtectiveness Review
Evaluation of impacts considering surrounding land use
and predicted concentrations from air dispersion
modeling using ESLs
Three State Programs to Decrease Ambient
Air Toxic Levels

3
FIGURE 3APWL Areas
1 – Amarillo 2 – Lubbock 3 – Abilene 4 – DFW 5 – Tyler 6 – El Paso 7 – Midland
APWL Areas
TCEQ Regions 8 – San Angelo 9 – Waco10 – Beaumont11 – Austin12 – Houston13 – San Antonio14 – Corpus Christi
15 – Harlingen16 – Laredo
Air Pollutant Watch List (APWL) ■ The APWL is a TCEQ program designed to address areas in Texas where data show persistent, elevated concentrations of air toxics.
■ More information regarding the TCEQ APWL program can be accessed at www.tceq.texas.gov/toxicology/apwl
Active Air Pollutant Watch List AreasCurrently there are four active APWL areas (Table 1).
Four Regions:Tyler, El Paso, Beaumont, Houston
Five Pollutants:Hydrogen sulfideMetals: nickel, arsenic, cobalt, vanadium
Air Pollutant Watch List SuccessesThe TCEQ has used the APWL process to address areas of concern and delist pollutants and/or areas from the APWL. The following table shows the pollutants and/or areas where ambient chemical concentrations have been successfully reduced to levels that are no longer of potential concern (Table 2).
TABLE 1Active Air Pollutant Watch List Areas
1
23 4 5
9 10
12
14
1311
87
6
15
16
APWL City County Pollutant(s) Added0501 N/A Bowie and Cass Hydrogen sulfide 19990601 El Paso El Paso Hydrogen sulfide 20041001 Evadale Jasper Hydrogen sulfide 20031201 Freeport Brazoria Arsenic, cobalt, nickel, vanadium 2005
TABLE 2Air Pollutant Watch List Successes
APWL City County Pollutant(s) Added Removed0401 Dallas Dallas Nickel 2004 20160701 Odessa Ector Ethylene 2001 2007
1002 Beaumont JeffersonHydrogen sulfide 2002 2009
Benzene 2004 2010Sulfur Dioxide 2003 2016
1003 Port Arthur Jefferson Benzene 2001 20141004 Port Neches Jefferson 1,3-Butadiene 1996 20091101 Bastrop Bastrop Hydrogen sulfide 2007 2012
1202 Texas City Galveston
Acrolein, butyraldehyde, valeraldehyde 2001 2010Benzene 2003 2014
Hydrogen sulfide 2004 2014Propionaldehyde 2001 2016
1203 Texas City Galveston Benzene 2004 2007
1204 Lynchburg Ferry area Harris
Benzene 2002 2010Styrene 2003 2014
1206 Galena Park Harris Benzene 2000 20171207 Milby Park area Harris 1,3-Butadiene 1999 20091401 Point Comfort Calhoun Ethylene dichloride 2004 20071402 Corpus Christi Nueces Benzene 1998 2010

4
FIGURE 5Number of Children Tested for
Elevated Blood Lead Levels in Texas
FIGURE 4Percent Elevated Blood Lead Levels in Children
(<6 years of age)
Drinking Water NoticesPassage of House Bill 3030, 78th Regular Legislative Session (2003), resulted in the new Texas Water Code, §26.408. The statute requires that when the TCEQ receives notice from another agency, or when the TCEQ independently documents a case of groundwater contamination, the TCEQ must make every effort to provide notice, via first class mail, to each owner of a private drinking water well that may be affected by the contamination. The notice must be provided within 30 days of the determination, or of the receipt of information from another agency.
Eighteen new cases of contamination during calendar year 2018 required notice to private drinking water well owners (Table 3).
TABLE 3Cases of Groundwater Contamination
Requiring Notice to Private Drinking Water Well Owners in 2018
TCEQ Region Number of Cases1 – Amarillo 12 – Lubbock 3
4 – Dallas 27 – Midland 19 – Waco 2
12 – Houston 814 – Corpus Christi 1
Health IndicatorsHealth indicators are quantitative or qualitative measures that can be used to assess the health of a given population. In epidemiology studies, air quality is often linked to prema-ture death, cancer, and damage to the respiratory and cardio-vascular systems. In order to gain a better understanding of the health of Texans in the various regions of the state, the TCEQ Toxicology, Risk Assessment, and Research Division began routinely reviewing health data collected by the Texas Department of State Health Services (DSHS) and the Centers for Disease Control and Prevention (CDC). All data presented on the following pages are estimates, because it may only include a sample of the population. Self-reported and under-reported cases of disease and illness are also limitations of the data sets. Differences in results from various reporting agencies may also occur.
Lead DataIn 1995, the 74th Texas legislature passed a law requiring the reporting of elevated blood lead levels in children under age 15. DSHS maintains the registry of blood lead results.
■ According to the Texas Childhood Lead Poisoning Pre-vention Program (TX CLPPP) statewide elevated blood lead levels (>5 μg/dL) in children have demonstrated a decreasing trend from 2012 to 2017 (Figure 4).
■ The number of children tested for elevated blood lead levels has been consistent from 2012 to 2017 (Figure 5).
1.5
1
0.5
02012 2013 2014 2015 2016 2017
Data Source: Texas Childhood Lead Poisoning Prevention Program, Data Statistics and Prevention, and CDC’s National Surveillance Data
% L
ead
Leve
ls >
5 µg
/dL
Texas (DSHS)U.S. (CDC)
2.5
2
3
3.5 4.5
2.5
2
1.5
1
0.5
02012 2013 2014 2015 2016 2017
Data Source: Texas Department of State Health Services (DSHS), Texas Childhood Lead Poisoning Prevention Program, Data Statistics
# Ch
ildre
n pe
r 100
,000
3.5
3
4 TX (DSHS)
5
FIGURE 8Average Age-Adjusted Cancer Incidence Rates for Leukemias, Lung and Bronchus Cancers, and Non-Hodgkin’s Lymphoma, 2013–2017
FIGURE 7Cancer Incidence Rates in Texas, 2012–2017
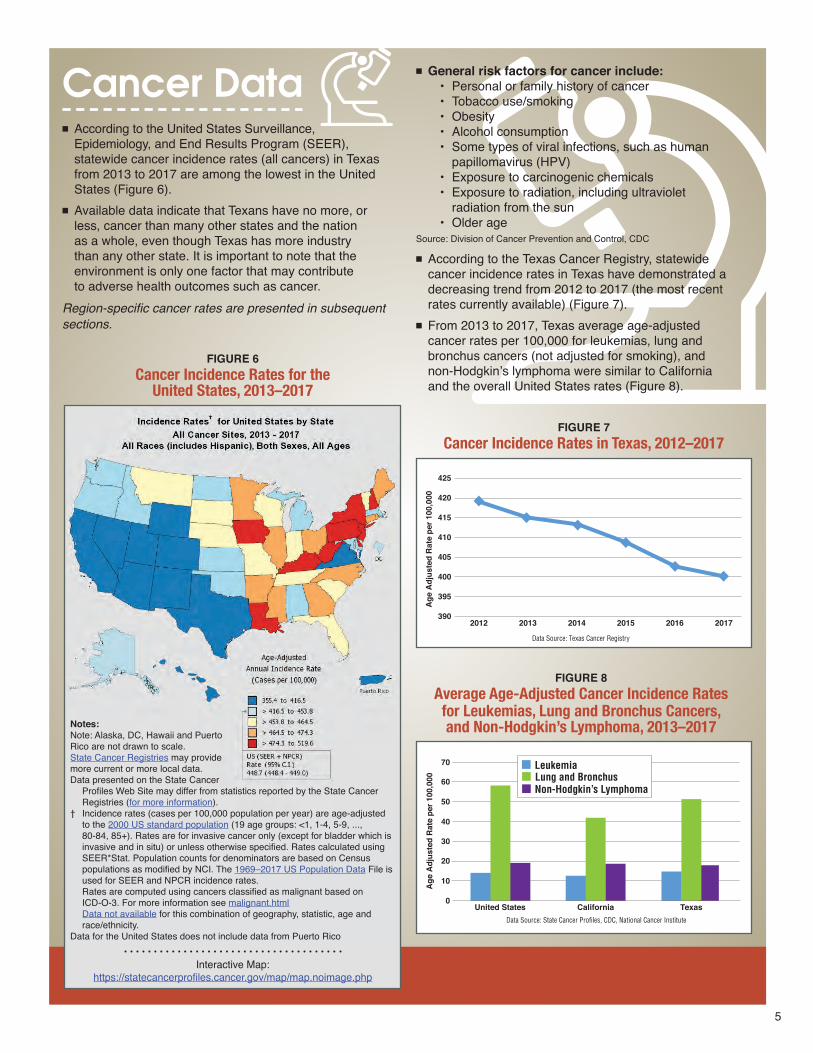
FIGURE 6Cancer Incidence Rates for the
United States, 2013–2017
Cancer Data■ According to the United States Surveillance,
Epidemiology, and End Results Program (SEER),statewide cancer incidence rates (all cancers) in Texasfrom 2013 to 2017 are among the lowest in the UnitedStates (Figure 6).
■ Available data indicate that Texans have no more, orless, cancer than many other states and the nationas a whole, even though Texas has more industrythan any other state. It is important to note that theenvironment is only one factor that may contributeto adverse health outcomes such as cancer.
Region-specific cancer rates are presented in subsequent sections.
Notes:Note: Alaska, DC, Hawaii and Puerto Rico are not drawn to scale.State Cancer Registries may provide more current or more local data.Data presented on the State Cancer
Profiles Web Site may differ from statistics reported by the State Cancer Registries (for more information).
† Incidence rates (cases per 100,000 population per year) are age-adjusted to the 2000 US standard population (19 age groups: <1, 1-4, 5-9, ..., 80-84, 85+). Rates are for invasive cancer only (except for bladder which is invasive and in situ) or unless otherwise specified. Rates calculated using SEER*Stat. Population counts for denominators are based on Census populations as modified by NCI. The 1969–2017 US Population Data File is used for SEER and NPCR incidence rates.Rates are computed using cancers classified as malignant based on ICD-O-3. For more information see malignant.htmlData not available for this combination of geography, statistic, age and race/ethnicity.
Data for the United States does not include data from Puerto Rico
Interactive Map: https://statecancerprofiles.cancer.gov/map/map.noimage.php
■ General risk factors for cancer include:• Personal or family history of cancer• Tobacco use/smoking• Obesity• Alcohol consumption• Some types of viral infections, such as human
papillomavirus (HPV)• Exposure to carcinogenic chemicals• Exposure to radiation, including ultraviolet
radiation from the sun• Older age
Source: Division of Cancer Prevention and Control, CDC
■ According to the Texas Cancer Registry, statewidecancer incidence rates in Texas have demonstrated adecreasing trend from 2012 to 2017 (the most recentrates currently available) (Figure 7).
■ From 2013 to 2017, Texas average age-adjustedcancer rates per 100,000 for leukemias, lung andbronchus cancers (not adjusted for smoking), andnon-Hodgkin’s lymphoma were similar to Californiaand the overall United States rates (Figure 8).
425
420
410
400
3902012 2013 2014 2015 2016
Data Source: Texas Cancer Registry
Age
Adj
uste
d R
ate
per 1
00,0
00
2017
395
405
415
70
40
30
20
10
0United States California Texas
Data Source: State Cancer Profiles, CDC, National Cancer Institute
Age
Adj
uste
d R
ate
per 1
00,0
00
LeukemiaLung and BronchusNon-Hodgkin’s Lymphoma
60
50
6
FIGURE 9AAge-Adjusted Asthma Hospital Discharge Rates
in Texas, 2009–2018
FIGURE 10ATexas Age-Adjusted Asthma Mortality Rates,
All Ages, 2008–2017
FIGURE 10BCrude Asthma Mortality Rates, All Ages, 2008–2017
FIGURE 9BCrude Asthma Hospital Discharge Rates, 2010–2017
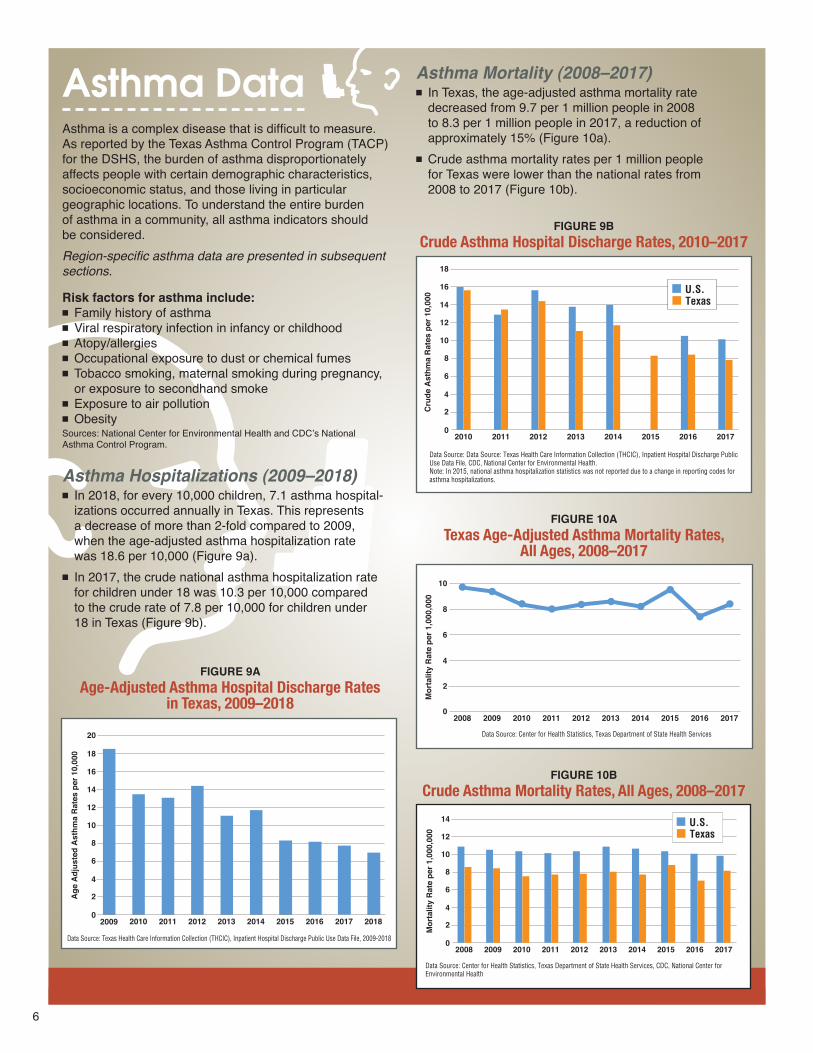
Asthma DataAsthma is a complex disease that is difficult to measure. As reported by the Texas Asthma Control Program (TACP) for the DSHS, the burden of asthma disproportionately affects people with certain demographic characteristics, socioeconomic status, and those living in particular geographic locations. To understand the entire burden of asthma in a community, all asthma indicators should be considered.Region-specific asthma data are presented in subsequent sections.
Risk factors for asthma include:■ Family history of asthma■ Viral respiratory infection in infancy or childhood■ Atopy/allergies■ Occupational exposure to dust or chemical fumes■ Tobacco smoking, maternal smoking during pregnancy,
or exposure to secondhand smoke■ Exposure to air pollution■ ObesitySources: National Center for Environmental Health and CDC’s National Asthma Control Program.
Asthma Hospitalizations (2009–2018)■ In 2018, for every 10,000 children, 7.1 asthma hospital-
izations occurred annually in Texas. This representsa decrease of more than 2-fold compared to 2009,when the age-adjusted asthma hospitalization ratewas 18.6 per 10,000 (Figure 9a).
■ In 2017, the crude national asthma hospitalization ratefor children under 18 was 10.3 per 10,000 comparedto the crude rate of 7.8 per 10,000 for children under18 in Texas (Figure 9b).
20
10
8
6
4
2
02009 2010 2011 2012 2013 2014 2015 2018
Data Source: Texas Health Care Information Collection (THCIC), Inpatient Hospital Discharge Public Use Data File, 2009-2018
Age
Adj
uste
d A
sthm
a R
ates
per
10,
000
14
12
18
16
2016 2017
20
10
8
6
4
2
02010 2011 2012 2013 2014 2015 2017
Data Source: Data Source: Texas Health Care Information Collection (THCIC), Inpatient Hospital Discharge Public Use Data File, CDC, National Center for Environmental Health.Note: In 2015, national asthma hospitalization statistics was not reported due to a change in reporting codes for asthma hospitalizations.
Cru
de A
sthm
a R
ates
per
10,
000
14
12
18
16
2016
U.S.Texas
Asthma Mortality (2008–2017) ■ In Texas, the age-adjusted asthma mortality rate
decreased from 9.7 per 1 million people in 2008to 8.3 per 1 million people in 2017, a reduction ofapproximately 15% (Figure 10a).
■ Crude asthma mortality rates per 1 million peoplefor Texas were lower than the national rates from2008 to 2017 (Figure 10b).
14
10
12
6
8
4
2
02008 2010 2012 2013 2014 2015
Data Source: Center for Health Statistics, Texas Department of State Health Services
Mor
talit
y R
ate
per 1
,000
,000
20172009 2011 2016
10
8
6
4
2
02008 2009 2010 2011 2012 2013 2017
Data Source: Center for Health Statistics, Texas Department of State Health Services, CDC, National Center for Environmental Health
Mor
talit
y R
ate
per 1
,000
,000
14
12
16
2015
U.S.Texas
2014 2016

7
FIGURE 12Mortality from Diseases
of the Circulatory System, 2012–2018
FIGURE 13Mortality from Diseases
of the Respiratory System, 2012–2018
FIGURE 11Mortality Rates for All Causes, 2012–2018
Mortality in Texas■ In 2018, the top 10 leading causes of death in Texas
were: diseases of the heart; malignant neoplasms;cerebrovascular diseases; chronic lower respiratorytract diseases; accidents; Alzheimer’s disease;diabetes mellitus; septicemia; kidney disease; andchronic liver disease.
■ From 2012 to 2018, Texas mortality rates for allcauses (Figure 11), diseases of the circulatorysystem (Figure 12), and diseases of the respiratorysystem per 100,000 (Figure 13) were similar to theoverall United States rates.
800
650
600
5502012 2013 2014 2015 2016 2017
Age
Adj
uste
d R
ate
of M
orta
lity
per 1
00,0
00
2018
TexasU.S.
700
750
260
200
180
160
1402012 2013 2014 2015 2016 2017
Age
Adj
uste
d R
ate
of M
orta
lity
per 1
00,0
00
2018
TexasU.S.
220
240
80
65
60
50
45
55
402012 2013 2014 2015 2016 2017
Age
Adj
uste
d R
ate
of M
orta
lity
per 1
00,0
00
2018
TexasU.S.
70
75
Data Source: Centers for Disease Control and Prevention, National Center for Health Statistics, Underlying Cause of Death

8
FIGURE 14Amarillo Area:
Crude Child Asthma Hospital Discharge Rates (per 10,000), 2010–2018
FIGURE 15Amarillo Area:
2013–2017 Average Cancer Incidence Rates per 100,000
Regional UpdatesRegional Updates ■ Regional updates on asthma hospitalization rates per 10,000 among children under 18 years of age, as well as cancer incidence per 100,000 among people of all ages are reported in subsequent sections. Regional data were compared to those of the state of Texas and the United States. Asthma hospitalization results do not include HIV and drug/alcohol-use patients and are based on hospital records listing ICD-10 code J45-J46 as the principal diagnosis.
■ Asthma hospitalization rate per 10,000 people for the United States are not age-adjusted. Thus, crude (non-age-adjusted) asthma hospitalization rates per 10,000 were used when regional and Texas data were compared to national values. In 2015, national asthma hospitalization statistics were not reported due to a change in reporting codes for asthma hospitalizations.
Region 1: Amarillo Area (Armstrong, Carson, Oldham, Potter, and Randall Counties)
■ In 2018 annual averages for all monitored VOCs were below their respective long-term AMCVs, and short-term concentrations of VOCs were below their respective AMCVs. Measured concentrations of VOCs would not be expected to cause adverse acute or chronic health or vegetation effects.
■ From 2010 to 2018, Amarillo area crude (non-age- adjusted) asthma hospitalization rates per 10,000 (Figure 14) were higher than the overall Texas, and United States (2010–2017) rates for children under 18 years of age.
■ From 2013 to 2017, Amarillo area average cancer incidence rates for all cancers per 100,000 (Figure 15) were slightly above Texas rates for all ages in Potter and Randall counties but were similar for Armstrong, and were lower than Texas rates for Carson and Oldham counties. Cancer incidence rates for all the counties were similar to or lower than United States rates.
40
25
20
15
10
5
0
Amarillo AreaTexasU.S.
35
30
2010 2011 2012 2013 2014 2015 2016 2017 2018
Crud
e Ho
spita
l Dis
char
ge R
ates
per
10,
000
Data Source: DSHS, Texas Health Care Information Collection (THCIC), Inpatient Hospital Discharge Public Use Data File, 2010-2018. CDC, HCUP, Healthcare Cost and Utilization Project. Agency for Healthcare Research and Quality.
Potter Armstrong Randall Oldham Carson Texas U.S.
500
450
400
350
300
250
200
150
100
50
0
Data Source: Texas Cancer Registry and the CDC’s National Program of Cancer Registries Cancer Surveillance System
Age
-Adj
uste
d C
ance
r Inc
iden
ce R
ates
per
100
,000
9
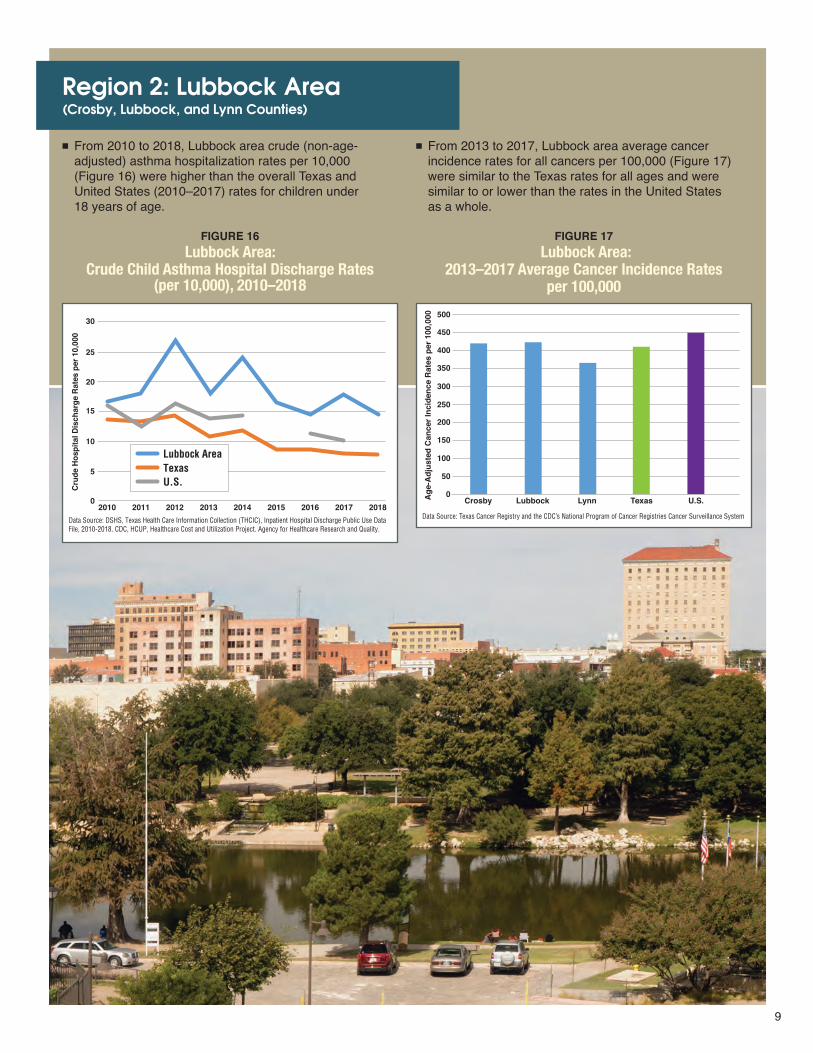
FIGURE 16Lubbock Area:
Crude Child Asthma Hospital Discharge Rates (per 10,000), 2010–2018
FIGURE 17 Lubbock Area:
2013–2017 Average Cancer Incidence Rates per 100,000
Region 2: Lubbock Area (Crosby, Lubbock, and Lynn Counties)
■ From 2010 to 2018, Lubbock area crude (non-age- adjusted) asthma hospitalization rates per 10,000 (Figure 16) were higher than the overall Texas and United States (2010–2017) rates for children under 18 years of age.
■ From 2013 to 2017, Lubbock area average cancer incidence rates for all cancers per 100,000 (Figure 17) were similar to the Texas rates for all ages and were similar to or lower than the rates in the United States as a whole.
30
20
15
10
5
02010 2011 2012 2013 2014 2015 2016 2017 2018
25
Lubbock AreaTexasU.S.Cr
ude
Hosp
ital D
isch
arge
Rat
es p
er 1
0,00
0
Data Source: DSHS, Texas Health Care Information Collection (THCIC), Inpatient Hospital Discharge Public Use Data File, 2010-2018. CDC, HCUP, Healthcare Cost and Utilization Project. Agency for Healthcare Research and Quality.
Crosby Lubbock Lynn Texas U.S.
500
450
400
350
300
250
200
150
100
50
0
Data Source: Texas Cancer Registry and the CDC’s National Program of Cancer Registries Cancer Surveillance System
Age
-Adj
uste
d C
ance
r Inc
iden
ce R
ates
per
100
,000

10
FIGURE 19Abilene Area:
2013–2017 Average Cancer Incidence Rates per 100,000
FIGURE 18Abilene Area:
Crude Child Asthma Hospital Discharge Rates (per 10,000), 2010–2018
Region 3: Abilene Area (Taylor, Callahan, and Jones Counties)
■ In 2018 annual averages for all monitored VOCs were below their respective long-term AMCVs, and short-term concentrations of VOCs were below their respective AMCVs. Measured concentrations of VOCs would not be expected to cause adverse acute or chronic health or vegetation effects.
■ From 2010 to 2018, Abilene area crude (non-age- adjusted) asthma hospitalization rates per 10,000 (Figure 18) were higher than the overall Texas and United States (2010–2017) rates for children under 18 years of age.
■ From 2013 to 2017, Abilene area average cancer incidence rates for all cancers per 100,000 (Figure 19) were similar to the overall Texas rates for all ages and were similar to or lower than the rates in the United States as a whole.
45
25
20
15
10
5
0
35
30
40
2010 2011 2012 2013 2014 2015 2016 2017 2018
Abilene AreaTexasU.S.
Crud
e Ho
spita
l Dis
char
ge R
ates
per
10,
000
Data Source: DSHS, Texas Health Care Information Collection (THCIC), Inpatient Hospital Discharge Public Use Data File, 2010-2018. CDC, HCUP, Healthcare Cost and Utilization Project. Agency for Healthcare Research and Quality.
Taylor Callahan Jones Texas U.S.
500
450
400
350
300
250
200
150
100
50
0
Data Source: Texas Cancer Registry and the CDC’s National Program of Cancer Registries Cancer Surveillance System
Age
-Adj
uste
d C
ance
r Inc
iden
ce R
ates
per
100
,000

11
FIGURE 20Dallas-Fort Worth Area:
Crude Child Asthma Hospital Discharge Rates (per 10,000), 2010–2018
FIGURE 21Dallas-Fort Worth Area:
2013–2017 Average Cancer Incidence Rates per 100,000
Region 4: Dallas-Fort Worth Area (Dallas, Hunt, Parker, Kaufman, Johnson, Tarrant, Ellis, Hood, Denton, Rockwall, Collin, and Wise Counties)
■ In 2018 annual averages for all monitored VOCs were below their respective long-term AMCVs, and short-term concentrations of VOCs were below their respective AMCVs. Measured concentrations of VOCs would not be expected to cause adverse acute or chronic health or vegetation effects.
■ From 2010 to 2018, Dallas-Fort Worth area crude (non-age-adjusted) asthma hospitalization rates per 10,000 (Figure 20) were lower than the overall Texas and United States (2010–2017) rates for children under 18 years of age.
■ From 2013 to 2017, average cancer incidence rates for all cancers per 100,000 (Figure 21) in the majority of the counties in the Dallas-Fort Worth area were similar to the overall Texas and United States rates for all ages.
18
10
6
2
0
14
16
12
8
4
2010 2011 2012 2013 2014 2015 2016 2017 2018
Dallas-Fort Worth AreaTexasU.S.Cr
ude
Hosp
ital D
isch
arge
Rat
es p
er 1
0,00
0
Data Source: DSHS, Texas Health Care Information Collection (THCIC), Inpatient Hospital Discharge Public Use Data File, 2010-2018. CDC, HCUP, Healthcare Cost and Utilization Project. Agency for Healthcare Research and Quality.
Dallas HuntParker
KaufmanJohnson
Tarrant Ellis HoodDenton
RockwallCollin Wise
Texas U.S.
500
450
400
350
300
250
200
150
100
50
0
Data Source: Texas Cancer Registry and the CDC’s National Program of Cancer Registries Cancer Surveillance System
Age
-Adj
uste
d C
ance
r Inc
iden
ce R
ates
per
100
,000
12
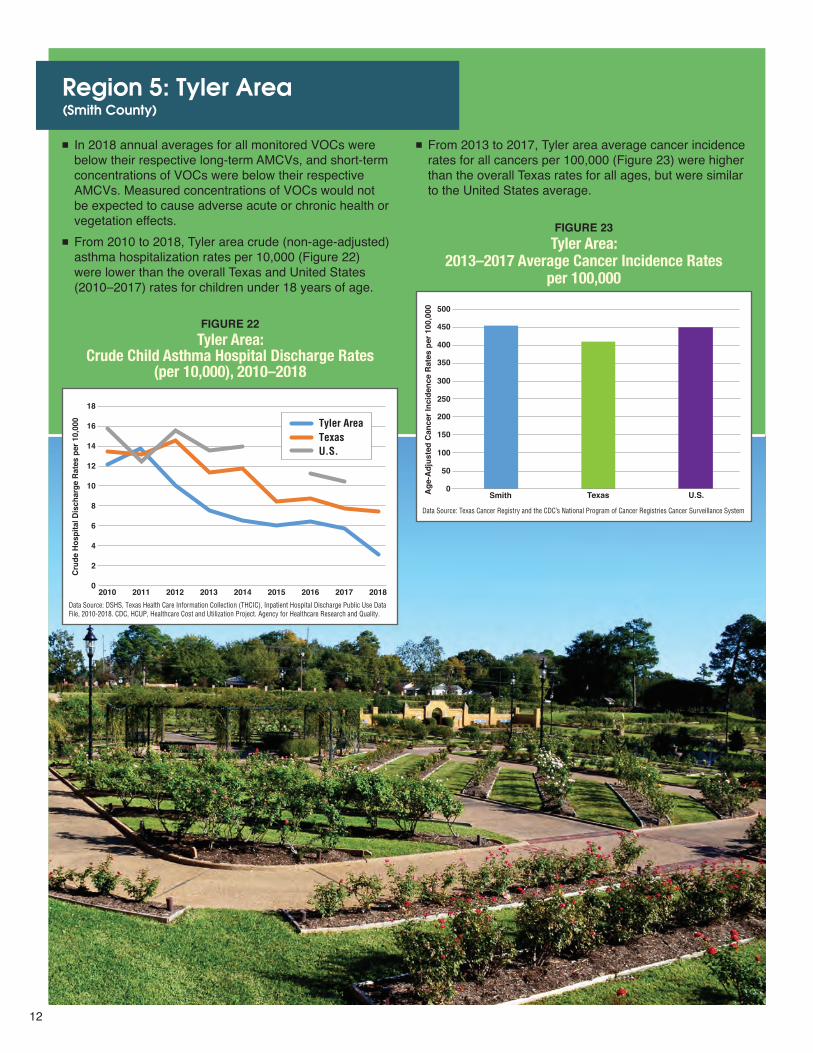
FIGURE 22Tyler Area:
Crude Child Asthma Hospital Discharge Rates (per 10,000), 2010–2018
FIGURE 23Tyler Area:
2013–2017 Average Cancer Incidence Rates per 100,000
Region 5: Tyler Area (Smith County)
■ In 2018 annual averages for all monitored VOCs were below their respective long-term AMCVs, and short-term concentrations of VOCs were below their respective AMCVs. Measured concentrations of VOCs would not be expected to cause adverse acute or chronic health or vegetation effects.
■ From 2010 to 2018, Tyler area crude (non-age-adjusted) asthma hospitalization rates per 10,000 (Figure 22) were lower than the overall Texas and United States (2010–2017) rates for children under 18 years of age.
■ From 2013 to 2017, Tyler area average cancer incidence rates for all cancers per 100,000 (Figure 23) were higher than the overall Texas rates for all ages, but were similar to the United States average.
18
12
8
4
0
16
10
6
2
14
2010 2011 2012 2013 2014 2015 2016 2017 2018
Tyler AreaTexasU.S.
Crud
e Ho
spita
l Dis
char
ge R
ates
per
10,
000
Data Source: DSHS, Texas Health Care Information Collection (THCIC), Inpatient Hospital Discharge Public Use Data File, 2010-2018. CDC, HCUP, Healthcare Cost and Utilization Project. Agency for Healthcare Research and Quality.
Smith Texas U.S.
500
450
400
350
300
250
200
150
100
50
0
Data Source: Texas Cancer Registry and the CDC’s National Program of Cancer Registries Cancer Surveillance System
Age
-Adj
uste
d C
ance
r Inc
iden
ce R
ates
per
100
,000

13
FIGURE 24El Paso Area:
Crude Child Asthma Hospital Discharge Rates (per 10,000), 2010–2018
FIGURE 25El Paso Area:
2013–2017 Average Cancer Incidence Rates per 100,000
Region 6: El Paso Area (El Paso and Hudspeth Counties)
■ In 2018 annual averages for all monitored VOCs were below their respective long-term AMCVs, and short-term concentrations of VOCs were below their respective AMCVs. Measured concentrations of VOCs would not be expected to cause adverse acute or chronic health or vegetation effects.
■ Reported concentrations of hydrogen sulfide (H2S) collected at the El Paso Lower Valley monitor in 2018 exceeded the state 30-min H2S standard 157 times; thus, it is likely that conditions would have been odorous at times, although direct health effects from exposure to H2S are not expected to occur. This area of El Paso is currently on the APWL (APWL0601) for H2S.
■ From 2010 to 2018, El Paso area crude (non-age- adjusted) asthma hospitalization rates per 10,000 (Figure 24) were higher than the overall Texas and United States (2010–2017) rates for children under 18 years of age.
■ From 2013 to 2017, El Paso area average cancer incidence rates for all cancers per 100,000 (Figure 25) were similar to or lower than both the United States and overall Texas rates for all ages.
25
20
15
10
5
02010 2011 2012 2013 2014 2015 2016 2017 2018
El Paso AreaTexasU.S.Cr
ude
Hosp
ital D
isch
arge
Rat
es p
er 1
0,00
0
Data Source: DSHS, Texas Health Care Information Collection (THCIC), Inpatient Hospital Discharge Public Use Data File, 2010-2018. CDC, HCUP, Healthcare Cost and Utilization Project. Agency for Healthcare Research and Quality.
El Paso Hudspeth Texas U.S.
500
450
400
350
300
250
200
150
100
50
0
Data Source: Texas Cancer Registry and the CDC’s National Program of Cancer Registries Cancer Surveillance System
Age
-Adj
uste
d C
ance
r Inc
iden
ce R
ates
per
100
,000
14
FIGURE 26Midland Area:
Crude Child Asthma Hospital Discharge Rates (per 10,000), 2010–2018
FIGURE 27Midland Area:
2013–2017 Average Cancer Incidence Rates per 100,000
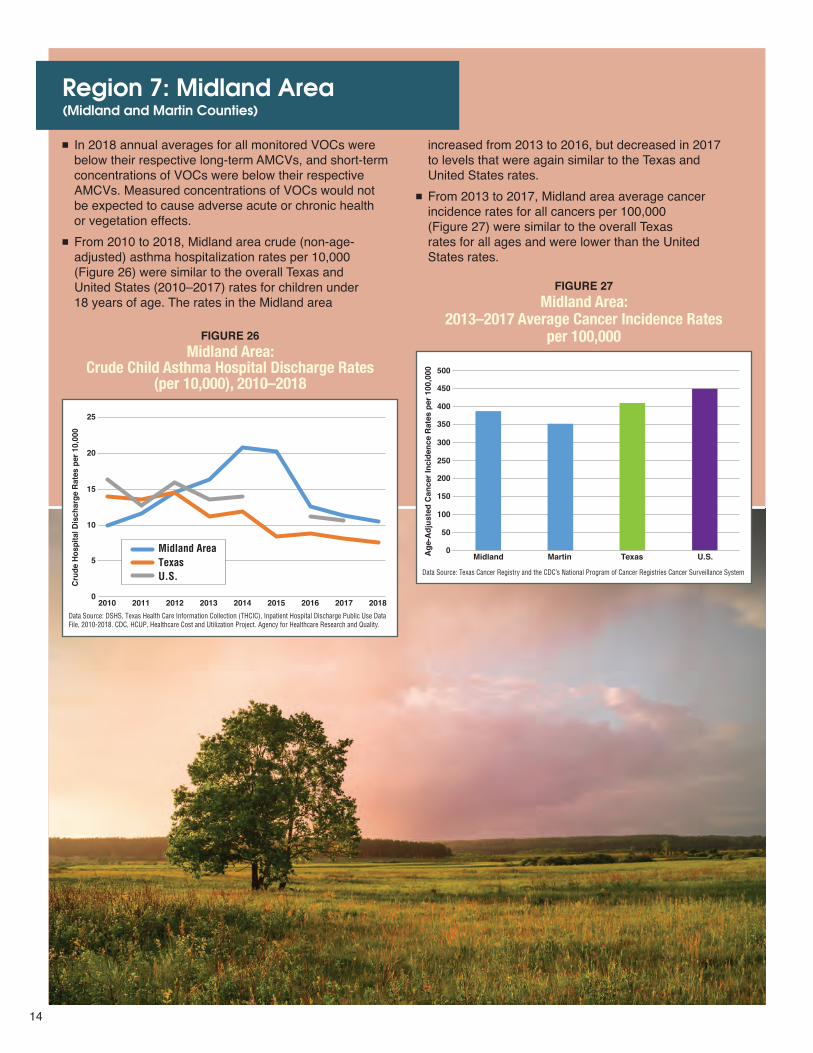
Region 7: Midland Area (Midland and Martin Counties)
■ In 2018 annual averages for all monitored VOCs were below their respective long-term AMCVs, and short-term concentrations of VOCs were below their respective AMCVs. Measured concentrations of VOCs would not be expected to cause adverse acute or chronic health or vegetation effects.
■ From 2010 to 2018, Midland area crude (non-age- adjusted) asthma hospitalization rates per 10,000 (Figure 26) were similar to the overall Texas and United States (2010–2017) rates for children under 18 years of age. The rates in the Midland area
increased from 2013 to 2016, but decreased in 2017 to levels that were again similar to the Texas and United States rates.
■ From 2013 to 2017, Midland area average cancer incidence rates for all cancers per 100,000 (Figure 27) were similar to the overall Texas rates for all ages and were lower than the United States rates.
25
15
10
5
0
20
2010 2011 2012 2013 2014 2015 2016 2017 2018
Midland AreaTexasU.S.
Crud
e Ho
spita
l Dis
char
ge R
ates
per
10,
000
Data Source: DSHS, Texas Health Care Information Collection (THCIC), Inpatient Hospital Discharge Public Use Data File, 2010-2018. CDC, HCUP, Healthcare Cost and Utilization Project. Agency for Healthcare Research and Quality.
Midland Martin Texas U.S.
500
450
400
350
300
250
200
150
100
50
0
Data Source: Texas Cancer Registry and the CDC’s National Program of Cancer Registries Cancer Surveillance System
Age
-Adj
uste
d C
ance
r Inc
iden
ce R
ates
per
100
,000

15
FIGURE 28San Angelo Area:
Crude Child Asthma Hospital Discharge Rates (per 10,000), 2010–2018
FIGURE 29San Angelo Area:
2013–2017 Average Cancer Incidence Rates per 100,000
Region 8: San Angelo Area (Irion and Tom Green Counties)
■ From 2010 to 2018, San Angelo area crude (non-age- adjusted) asthma hospitalization rates per 10,000 (Figure 28) were higher than the overall Texas and United States (2010–2017) rates for children under 18 years of age.
■ From 2013 to 2017, San Angelo area average cancer incidence rates for all cancers per 100,000 (Figure 29) were similar to the overall Texas and United States rates for all ages.
35
25
20
15
10
5
0
30
2010 2011 2012 2013 2014 2015 2016 2017 2018
Crud
e Ho
spita
l Dis
char
ge R
ates
per
10,
000
San Angelo AreaTexasU.S.
Data Source: DSHS, Texas Health Care Information Collection (THCIC), Inpatient Hospital Discharge Public Use Data File, 2010-2018. CDC, HCUP, Healthcare Cost and Utilization Project. Agency for Healthcare Research and Quality.
Irion Tom Green Texas U.S.
500
450
400
350
300
250
200
150
100
50
0
Data Source: Texas Cancer Registry and the CDC’s National Program of Cancer Registries Cancer Surveillance System
Age
-Adj
uste
d C
ance
r Inc
iden
ce R
ates
per
100
,000
16
FIGURE 30Waco Area:
Crude Child Asthma Hospital Discharge Rates (per 10,000), 2010–2018
FIGURE 31Waco Area:
2013–2017 Average Cancer Incidence Rates per 100,000
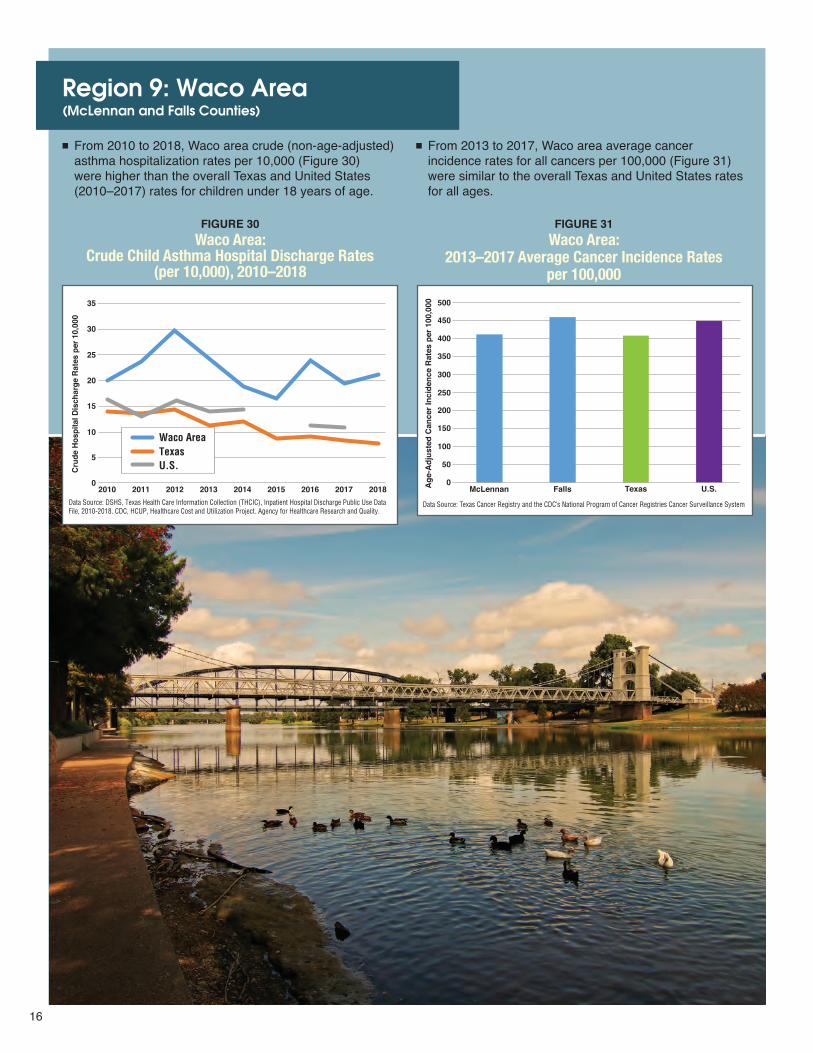
Region 9: Waco Area(McLennan and Falls Counties)
■ From 2010 to 2018, Waco area crude (non-age-adjusted) asthma hospitalization rates per 10,000 (Figure 30) were higher than the overall Texas and United States (2010–2017) rates for children under 18 years of age.
■ From 2013 to 2017, Waco area average cancer incidence rates for all cancers per 100,000 (Figure 31) were similar to the overall Texas and United States rates for all ages.
35
25
20
15
10
5
0
30
2010 2011 2012 2013 2014 2015 2016 2017 2018
Waco AreaTexasU.S.Cr
ude
Hosp
ital D
isch
arge
Rat
es p
er 1
0,00
0
Data Source: DSHS, Texas Health Care Information Collection (THCIC), Inpatient Hospital Discharge Public Use Data File, 2010-2018. CDC, HCUP, Healthcare Cost and Utilization Project. Agency for Healthcare Research and Quality.
McLennan Falls Texas U.S.
500
450
400
350
300
250
200
150
100
50
0
Data Source: Texas Cancer Registry and the CDC’s National Program of Cancer Registries Cancer Surveillance System
Age
-Adj
uste
d C
ance
r Inc
iden
ce R
ates
per
100
,000

17
FIGURE 32Beaumont Area:
Crude Child Asthma Hospital Discharge Rates (per 10,000), 2010–2018
FIGURE 33Beaumont Area:
2013–2017 Average Cancer Incidence Rates per 100,000
Region 10: Beaumont Area (Hardin, Jefferson, Newton, and Orange Counties)
■ In 2018 annual averages for all monitored VOCs were below their respective long-term AMCVs, and short-term concentrations of VOCs were below their respective AMCVs. Measured concentrations of VOCs would not be expected to cause adverse acute or chronic health or vegetation effects.
■ From 2010 to 2018, Beaumont area crude (non-age- adjusted) asthma hospitalization rates per 10,000 (Figure 32) were similar to the overall Texas and United States (2010–2017) rates for children under 18 years of age.
■ From 2013 to 2017, Beaumont area average cancer incidence rates for all cancers per 100,000 (Figure 33) were similar to the overall Texas and United States rates for all ages.
25
15
10
5
0
20
2010 2011 2012 2013 2014 2015 2016 2017 2018
Beaumont AreaTexasU.S.
Crud
e Ho
spita
l Dis
char
ge R
ates
per
10,
000
Data Source: DSHS, Texas Health Care Information Collection (THCIC), Inpatient Hospital Discharge Public Use Data File, 2010-2018. CDC, HCUP, Healthcare Cost and Utilization Project. Agency for Healthcare Research and Quality.
500
450
400
350
300
250
200
150
100
50
0Orange Hardin Jefferson Newton Texas U.S.
Data Source: Texas Cancer Registry and the CDC’s National Program of Cancer Registries Cancer Surveillance System
Age
-Adj
uste
d C
ance
r Inc
iden
ce R
ates
per
100
,000

18
FIGURE 35Austin Area:
2013–2017 Average Cancer Incidence Rates per 100,000
FIGURE 34Austin Area:
Crude Child Asthma Hospital Discharge Rates (per 10,000), 2010–2018
Region 11: Austin Area (Bastrop, Caldwell, Hays, Travis, and Williamson Counties)
■ In 2018 annual averages for all monitored VOCs werebelow their respective long-term AMCVs, and short-termconcentrations of VOCs were below their respectiveAMCVs. Measured concentrations of VOCs would notbe expected to cause adverse acute or chronic health orvegetation effects.
■ From 2010 to 2018, Austin area crude (non-age-adjusted)asthma hospitalization rates per 10,000 (Figure 34) weresimilar to, and for 2014 and 2016 were slightly higherthan, the overall Texas and United States (2010–2017)rates for children under 18 years of age.
■ From 2013 to 2017, Austin area average cancerincidence rates for all cancers per 100,000 (Figure 35)were similar to or lower than the overall Texas and UnitedStates rates for all ages.
20
18
10
6
2
0
14
12
8
4
16
2010 2011 2012 2013 2014 2015 2016 2017 2018
Austin AreaTexasU.S.Cr
ude
Hosp
ital D
isch
arge
Rat
es p
er 1
0,00
0
Data Source: DSHS, Texas Health Care Information Collection (THCIC), Inpatient Hospital Discharge Public Use Data File, 2010-2018. CDC, HCUP, Healthcare Cost and Utilization Project. Agency for Healthcare Research and Quality.
Bastrop Caldwell Hays Travis Williamson Texas U.S.
500
450
400
350
300
250
200
150
100
50
0
Data Source: Texas Cancer Registry and the CDC’s National Program of Cancer Registries Cancer Surveillance System
Age
-Adj
uste
d C
ance
r Inc
iden
ce R
ates
per
100
,000
19
FIGURE 36Houston Area:
Crude Child Asthma Hospital Discharge Rates (per 10,000), 2010–2018
FIGURE 37Houston Area:
2013–2017 Average Cancer Incidence Rates per 100,000
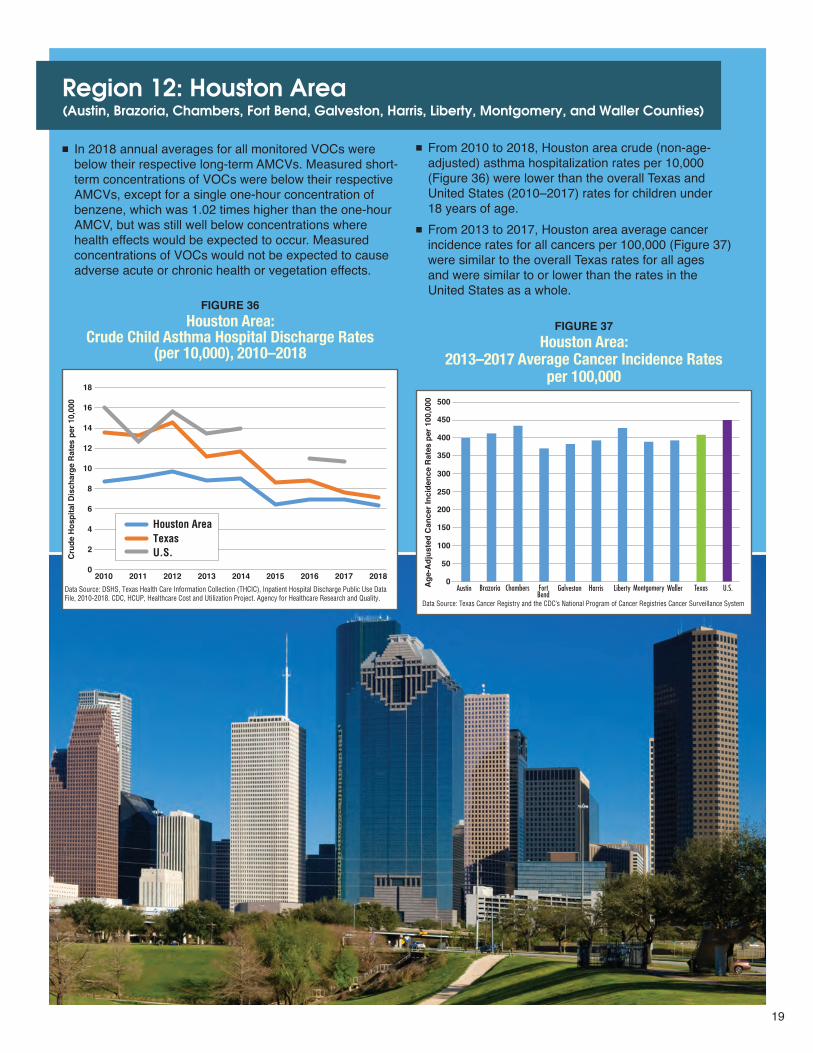
Region 12: Houston Area (Austin, Brazoria, Chambers, Fort Bend, Galveston, Harris, Liberty, Montgomery, and Waller Counties)
■ In 2018 annual averages for all monitored VOCs were below their respective long-term AMCVs. Measured short-term concentrations of VOCs were below their respective AMCVs, except for a single one-hour concentration of benzene, which was 1.02 times higher than the one-hour AMCV, but was still well below concentrations where health effects would be expected to occur. Measured concentrations of VOCs would not be expected to cause adverse acute or chronic health or vegetation effects.
■ From 2010 to 2018, Houston area crude (non-age- adjusted) asthma hospitalization rates per 10,000 (Figure 36) were lower than the overall Texas and United States (2010–2017) rates for children under 18 years of age.
■ From 2013 to 2017, Houston area average cancer incidence rates for all cancers per 100,000 (Figure 37) were similar to the overall Texas rates for all ages and were similar to or lower than the rates in the United States as a whole.
18
10
6
2
0
14
12
8
4
16
2010 2011 2012 2013 2014 2015 2016 2017 2018
Houston AreaTexasU.S.Cr
ude
Hosp
ital D
isch
arge
Rat
es p
er 1
0,00
0
Data Source: DSHS, Texas Health Care Information Collection (THCIC), Inpatient Hospital Discharge Public Use Data File, 2010-2018. CDC, HCUP, Healthcare Cost and Utilization Project. Agency for Healthcare Research and Quality.
Austin Brazoria Chambers FortBend
Galveston Texas U.S.Harris Liberty Montgomery Waller
500
450
400
350
300
250
200
150
100
50
0
Data Source: Texas Cancer Registry and the CDC’s National Program of Cancer Registries Cancer Surveillance System
Age
-Adj
uste
d C
ance
r Inc
iden
ce R
ates
per
100
,000

20
FIGURE 38San Antonio Area:
Crude Child Asthma Hospital Discharge Rates (per 10,000), 2010–2018
FIGURE 39San Antonio Area:
2013–2017 Average Cancer Incidence Rates per 100,000
Region 13: San Antonio Area (Guadalupe, Comal, Kendall, Bexar, Bandera, Atascosa, Wilson, and Medina Counties)
■ In 2018 annual averages for all monitored VOCs were below their respective long-term AMCVs, and short-term concentrations of VOCs were below their respective AMCVs. Measured concentrations of VOCs would not be expected to cause adverse acute or chronic health or vegetation effects.
■ From 2010 to 2018, San Antonio area crude (non-age-adjusted) asthma hospitalization rates per 10,000 (Figure 38) were higher than the overall Texas and United States (2010–2017) rates for children under 18 years of age.
■ From 2013 to 2017, San Antonio area average cancer incidence rates for all cancers per 100,000 (Figure 39) were similar to or lower than the overall Texas and United States rates for all ages.
25
15
10
5
0
20
2010 2011 2012 2013 2014 2015 2016 2017 2018
San Antonio AreaTexasU.S.Cr
ude
Hosp
ital D
isch
arge
Rat
es p
er 1
0,00
0
Data Source: DSHS, Texas Health Care Information Collection (THCIC), Inpatient Hospital Discharge Public Use Data File, 2010-2018. CDC, HCUP, Healthcare Cost and Utilization Project. Agency for Healthcare Research and Quality.
Guadalupe Comal Kendall Bexar Bandera Texas U.S.Atascosa MedinaWilson
500
450
400
350
300
250
200
150
100
50
0
Data Source: Texas Cancer Registry and the CDC’s National Program of Cancer Registries Cancer Surveillance System
Age
-Adj
uste
d C
ance
r Inc
iden
ce R
ates
per
100
,000
21
FIGURE 40Corpus Christi Area:
Crude Child Asthma Hospital Discharge Rates (per 10,000), 2010–2018
FIGURE 41Corpus Christi Area:
2013–2017 Average Cancer Incidence Rates per 100,000
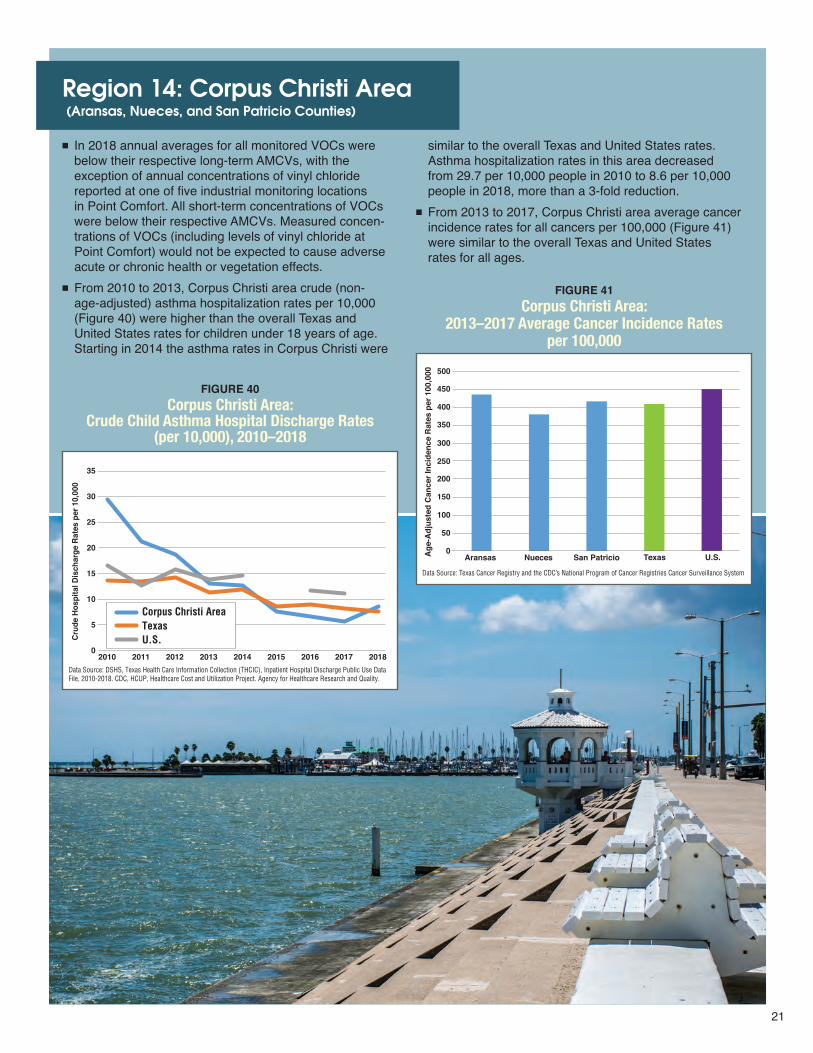
Region 14: Corpus Christi Area (Aransas, Nueces, and San Patricio Counties)
■ In 2018 annual averages for all monitored VOCs were below their respective long-term AMCVs, with the exception of annual concentrations of vinyl chloride reported at one of five industrial monitoring locations in Point Comfort. All short-term concentrations of VOCs were below their respective AMCVs. Measured concen-trations of VOCs (including levels of vinyl chloride at Point Comfort) would not be expected to cause adverse acute or chronic health or vegetation effects.
■ From 2010 to 2013, Corpus Christi area crude (non- age-adjusted) asthma hospitalization rates per 10,000 (Figure 40) were higher than the overall Texas and United States rates for children under 18 years of age. Starting in 2014 the asthma rates in Corpus Christi were
similar to the overall Texas and United States rates. Asthma hospitalization rates in this area decreased from 29.7 per 10,000 people in 2010 to 8.6 per 10,000 people in 2018, more than a 3-fold reduction.
■ From 2013 to 2017, Corpus Christi area average cancer incidence rates for all cancers per 100,000 (Figure 41) were similar to the overall Texas and United States rates for all ages.
35
25
20
15
10
5
0
30
2010 2011 2012 2013 2014 2015 2016 2017 2018
Corpus Christi AreaTexasU.S.Cr
ude
Hosp
ital D
isch
arge
Rat
es p
er 1
0,00
0
Data Source: DSHS, Texas Health Care Information Collection (THCIC), Inpatient Hospital Discharge Public Use Data File, 2010-2018. CDC, HCUP, Healthcare Cost and Utilization Project. Agency for Healthcare Research and Quality.
Aransas Nueces San Patricio Texas U.S.
500
450
400
350
300
250
200
150
100
50
0
Data Source: Texas Cancer Registry and the CDC’s National Program of Cancer Registries Cancer Surveillance System
Age
-Adj
uste
d C
ance
r Inc
iden
ce R
ates
per
100
,000

22
FIGURE 42Harlingen Area:
Crude Child Asthma Hospital Discharge Rates (per 10,000), 2010–2018
FIGURE 43Harlingen Area:
2013–2017 Average Cancer Incidence Rates per 100,000
Region 15: Harlingen Area (Cameron County)
■ In 2018 annual averages for all monitored VOCs were below their respective long-term AMCVs, and short-term concentrations of VOCs were below their respective AMCVs. Measured concentrations of VOCs would not be expected to cause adverse acute or chronic health or vegetation effects.
■ From 2010 to 2018, Harlingen area crude (non-age- adjusted) asthma hospitalization rates per 10,000 (Figure 42) were lower than the overall Texas and United States (2010–2017) rates for children under 18 years of age.
■ From 2013 to 2017, Harlingen area average cancer incidence rates for all cancers per 100,000 (Figure 43) was somewhat lower than the overall Texas and United States rates for all ages.
18
10
6
2
0
14
12
8
4
16
2010 2011 2012 2013 2014 2015 2016 2017 2018
Harlingen AreaTexasU.S.Cr
ude
Hosp
ital D
isch
arge
Rat
es p
er 1
0,00
0
Data Source: DSHS, Texas Health Care Information Collection (THCIC), Inpatient Hospital Discharge Public Use Data File, 2010-2018. CDC, HCUP, Healthcare Cost and Utilization Project. Agency for Healthcare Research and Quality.
Cameron Texas U.S.
500
450
400
350
300
250
200
150
100
50
0
Data Source: Texas Cancer Registry and the CDC’s National Program of Cancer Registries Cancer Surveillance System
Age
-Adj
uste
d C
ance
r Inc
iden
ce R
ates
per
100
,000

23
FIGURE 44Laredo Area:
Crude Child Asthma Hospital Discharge Rates (per 10,000), 2010–2018
FIGURE 45Laredo Area:
2013–2017 Average Cancer Incidence Rates per 100,000
Region 16: Laredo Area (Webb County)
■ In 2018 annual averages for all monitored VOCs were below their respective long-term AMCVs, and short-term concentrations of VOCs were below their respective AMCVs. Measured concentrations of VOCs would not be expected to cause adverse acute or chronic health or vegetation effects.
■ From 2010 to 2018, Laredo area crude (non-age-adjusted) asthma hospitalization rates per 10,000 (Figure 44) were
lower than the overall Texas and United States (2010–2017) rates for children under 18 years of age.
■ From 2013 to 2017, Laredo area average cancer inci-dence rates for all cancers per 100,000 (Figure 45) were lower than the overall Texas and United States rates for all ages.
18
14
10
6
2
16
12
8
4
0
Data Source: DSHS, Texas Health Care Information Collection (THCIC), Inpatient Hospital Discharge Public Use Data File, 2010-2018. CDC, HCUP, Healthcare Cost and Utilization Project. Agency for Healthcare Research and Quality.
2010 2011 2012 2013 2014 2015 2016 2017 2018
Laredo AreaTexasU.S.Cr
ude
Hosp
ital D
isch
arge
Rat
es p
er 1
0,00
0
Webb Texas U.S.
500
450
400
350
300
250
200
150
100
50
0
Data Source: Texas Cancer Registry and the CDC’s National Program of Cancer Registries Cancer Surveillance System
Age
-Adj
uste
d C
ance
r Inc
iden
ce R
ates
per
100
,000

24Printed on recycled paper.
How is our customer service? Fill out our online customer-satisfaction survey at www.tceq.texas.gov/customersurvey
The TCEQ is an equal opportunity employer. The agency does not allow discrimination on the basis of race, color, religion, national origin, sex, disability, age, sexual orientation, or veteran status.

25

26