TASK 27 Performance of Solar Facade Components … · Performance, durability and sustainability...
82
Task 27 Solar Building Facade Components Subtask A: Performance Final report, May 2006 1 Performance, durability and sustainability of advanced windows and solar components for building envelopes Final Report Subtask A: Performance Project A1: Energy performance assessment methodology March 2006 Operating Agent: Michael Köhl Fraunhofer Institute for Solar Energy Systems for PTJ Jülich, Germany TASK 27 Performance of Solar Facade Components
Transcript of TASK 27 Performance of Solar Facade Components … · Performance, durability and sustainability...
Task 27 Solar Building Facade Components Subtask A: Performance
Final report, May 2006 1
Performance, durability and sustainability of advanced windows and solar components for building envelopes
Final Report
Subtask A: Performance
Project A1:
Energy performance assessment methodology March 2006
Operating Agent:
Michael Köhl
Fraunhofer Institute for Solar Energy Systems
for PTJ Jülich, Germany
TASK 27 Performance of Solar Facade Components
Task 27 Solar Building Facade Components Subtask A: Performance
Final report, May 2006 2
Table of content
Table of content .................................................................................................................2
Project A1: Energy performance assessment methodology .........................................5
1 Introduction.....................................................................................................................6
2 Concepts of Energy Performance Assessment of Building Envelopes.....................8
2.1 Objectives.................................................................................................................................. 8
2.2 Status quo ................................................................................................................................. 9
2.3 Performance indicators.......................................................................................................... 11 2.3.1 Building performance indicators BPI .................................................................................................. 11 2.3.2 Component performance indicators CPI ............................................................................................ 11 2.3.3 Building performance criteria BPC ..................................................................................................... 12
2.4 General methodology - Different approaches...................................................................... 12
3 Component Energy Performance................................................................................13
3.1 Specific Research Projects.................................................................................................... 15 3.1.1 Rating and Labeling ........................................................................................................................... 15
3.2 Product selection and comparison ....................................................................................... 26 3.2.1 Fixed guidelines ................................................................................................................................. 26 3.2.2 Computer simulation tools.................................................................................................................. 26 3.2.3 Code Requirements ........................................................................................................................... 27
3.3 Product development and design ......................................................................................... 27
3.4 Integration of the component into the building ................................................................... 27 3.4.1 Wall/fenestration interaction............................................................................................................... 28 3.4.2 HVAC system effects on a façade component .................................................................................. 28 3.4.3 Effects of room geometry and composition on a façade component................................................. 28
Task 27 Solar Building Facade Components Subtask A: Performance
Final report, May 2006 3
3.4.4 Effects of humans on a façade component........................................................................................ 29 3.4.5 Feedback loop from the building ........................................................................................................ 29 3.4.6 Dynamic Effeycts................................................................................................................................ 29
4 Testing requirements ...................................................................................................31
4.1 Standards ................................................................................................................................ 31
4.2 Product families ...................................................................................................................... 33
4.3 General recommendations for angular measurements ...................................................... 36 4.3.1 Definition of angles............................................................................................................................. 36 4.3.2 General recommendations................................................................................................................. 37 4.3.3 Error source divergence of the solar simulator .................................................................................. 37
4.4 Requirements of selected facade types ............................................................................... 42 4.4.1 Chromogenics .................................................................................................................................... 42 4.4.2 Shading devices ................................................................................................................................. 43 4.4.3 Transparent Insulation Material.......................................................................................................... 44
5 Building Energy Performance assessment ................................................................46
5.1 Introduction ............................................................................................................................. 46 5.1.1 Complexity of performance assessment ............................................................................................ 46 5.1.2 Necessary elements........................................................................................................................... 46 5.1.3 Specification of the application........................................................................................................... 48 5.1.4 Evaluation of case studies.................................................................................................................. 50
5.2 Building Performance Indicators BPI ................................................................................... 50 5.2.1 Energy performance........................................................................................................................... 50 5.2.2 Comfort and performance .................................................................................................................. 52 5.2.3 Primary energy and CO2 emissions .................................................................................................. 58
5.3 Simulation................................................................................................................................ 60 5.3.1 Reference office ................................................................................................................................. 60 5.3.2 Reference data and output................................................................................................................. 63 5.3.3 Reference dwelling............................................................................................................................. 67
Task 27 Solar Building Facade Components Subtask A: Performance
Final report, May 2006 4
5.3.4 Case study switchable facade............................................................................................................ 68 5.3.5 Discussion and future needs.............................................................................................................. 71
5.4 Simplified methods................................................................................................................. 71 5.4.1 Variations of monthly energy balance calculations ............................................................................ 71 5.4.2 Definitions and statements................................................................................................................. 73 5.4.3 Determination of the utilisation factor................................................................................................. 74 5.4.4 Comparison of simulation and monthly calculation............................................................................ 75 5.4.5 Summary ............................................................................................................................................ 80
6 Reports ..........................................................................................................................81

Task 27 Solar Building Facade Components Subtask A: Performance
Final report, May 2006 5
Project A1: Energy performance assessment methodology
Prepared by: Werner J. Platzer Fraunhofer Institute for Solar Energy Systems, Germany With input from: Ida Bryn, Erichsen and Horgen, Norway Hans Simmler, Eidegenössische Materialprüfungs- und Forschungsanstalt, Switzerland Partners in the project:
Country Participant B UCL Magali Bodart DE ISE Werner Platzer DK DTU Karsten Duer DK DTU Ole Holck DK DTU Svend Svendson DK DTU Toke-Rammer Nielson DK DTU Jean L.J. Rosenfeld DK SBI Hanne Krogh DK Velux Jan Franson DK Velux Lone Moller Sörensen FR CSTB Francois Olive FR EDF Géraldine Corredera FR EDF Denis Covalet FR EDF Remi Le Berre FR CSTB Francois Olive FIN VTT Ismo Heimonen
Task 27 Solar Building Facade Components Subtask A: Performance
Final report, May 2006 6
IT ENEA Augusto Maccari IT ENEA Michele Zinzi IT USRT Aldo Fanchiotti NL TNO Henk Oversloot NL TNO Dick van Dijk NOR E & H Ida Bryn SWE UU Arne Roos USA ARC James Fairman USA UMASS Dragan Curcija USA LBNL Mike Rubin
1 Introduction The energy performance of buildings are intimately connected to the energy performance of building envelopes. The better we understand the relation between the quality of the envelope and the energy consumption of the building, the better we can improve both. We have to consider not only heating but all service energies related to the human comfort in the building, such as cooling, ventilation, lighting as well.
The complexity coming from this embracing approach is not to be underestimated. It is less and less possible to realted simple characteristic performance indicators of building envelopes (such as the U-value) to the overall energy performance. On the one hand much more paramters (e.g. light transmittance) come into the picture – we have to assess the product quality in a multidimensional world. Secondly buildings more and more have to work on a narrow optimum: For an old, badly insulated building all solar gains are useful – for a high-performance building with very good insulation and heat recovery systems in the ventilation overheating becomes more likely. Thus we have to control the solar gains, and sometimes we need high gains, sometimes low ones.
And thirdly we see that the technology within the building and the user patterns and interactions as well influence the performance of a building envelope.
The aim of this project within IEA Task27 was to improve our knowledge on the complex situation and also to give a principal approach how to assess the performance of the building envelope. The participants have contributed to this aim not pretending that we have reached the end.

Task 27 Solar Building Facade Components Subtask A: Performance
Final report, May 2006 7

Task 27 Solar Building Facade Components Subtask A: Performance
Final report, May 2006 8
2 Concepts of Energy Performance Assessment of Building Envelopes 2.1 Objectives The objective of a general energy performance methodology is the evaluation of the energy performance of a building envelope component, either product or development, in the context of real use. The question is not how to characterize the properties of the component with well-defined component performance figures, for instance with heat resistance or total solar energy transmittance, but to give a well-defined but ”anschaulich” view of the energy-related benefits of this components in a realistic use condition. Obviously the application and use is not a completely fixed frame. Windows and other envelope products may be used in different contexts. Nevertheless the answer can be representative for typical use. Therefore the definition of typical reference cases and conditions is a part of the work on a general EPAM.
As the target value is the benefit of the user related to energy, the changes in energy consumption have to be determined for different component alternatives, if products are to be compared. This quantity, however, is dependent on a number of other factors such as
• building and HVAC-systems
• user patterns, regulations
• climate
• national/local data on energy, building regulations
• building element characterization
In order to allow objective and realistic comparisons there are in principle two alternatives:
• define typical reference cases where the factors above are well-defined
• use the conditions as specified for a specific building project
The first alternative is mainly interesting to the component producer who wants to demonstrate possible clients or customers the specific advantages of the product in a language they can understand, whereas the second alternative is only possible, if a this specific building project exists. This latter case is probably more interesting to the planning profession or the investors and builders themselves.
Task 27 Solar Building Facade Components Subtask A: Performance
Final report, May 2006 9
The energy related quantities to be considered in an overall ernergy performance cannot be restricted to an isolated performance figure e.g. heating energy requirement, but must include other indicators as well:
• energy savings heating and cooling
• energy substitution through daylight
• peak load reduction for systems
• thermal and visual user comfort
• air quality
Other indicators such as
• cost
• environmental benefits
may be interesting to the user, but are not strictly related to energy. Therefore we left them out in our discussions.
2.2 Status quo The status quo of energy performance assessment is characterized by a vast number of different approaches and tools, depending on country, building tradiations, level of detailed analysis, specific interests and objectives.
Component energy performance assessment traditionally has two main objectives: The producers of a product want to show the beneficial performance of a product and demonstrate its competitiveness against other products. The consumer due to their economical interests and also the political governments due to political aims such as CO2-reduction want to certify the quality of products used in the building market. Therefore test procedures for important product specifications exist. The extent, comparability and the quality of these test procedures is guaranteed by the international and national standards organization. And there are several test procedures related to energy aspects. Thermal, optical and electrical tests relate to energy performance. We collected relevant standards during the course of the Task. The situation is characterized by the following trends:
- existing national standards are being harmonized by international standards (ISO, CEN) but this process will certainly continue for quite a while

Task 27 Solar Building Facade Components Subtask A: Performance
Final report, May 2006 10
- the level of detail is increasing in many performance related questions (e.g. the thermal losses of frames and edge-seals of windows are being treated in more detail in standards such as ISO 15099 and EN 10077)
- increasing complexity very often is dealt with by using numerical tools for characterization in order to keep testing costs reasonable; complex tests are often used in order to validate models which is very important
On the other hand the energy performance of buildings is also a well established field with an even larger number of methods and tools for performance assessment. Energy performance of a building is mainly established by simulating or calculating with simplified tools the energy consumption, using informations on building design, constructions, building products and use of the building. There exist public research projects in order to validate new approaches in building technology, where building performance is or has been determined by experimental monitoring of a huge number of parameters (see e.g. www.solarbau.de for German projects). The status quo of simplified calculation tools and simulation tools has been assessed by an overview document at the beginning of the Task. The following aspects can be said for the status quo at the beginning of the task:
- hourly simulation is able to predict heating, cooling, ventilation and lighting energy quite well, but complex building envelopes or envelope components such as double envelope facades, lamella blind systems, daylighting elements, switchable glazings can only be simulated with some simplifications or workarounds
- the coupling of daylighting simulation and thermal simulation (usually using different programs) is feasible and has been done in scientific projects, however it is not a general state of the art; this coupling is necessary when interactions between daylighting situation and dynamical facades (solar protection) has implications on cooling and lighting energy
- simplified algorithms for calculating heating energy on a yearly, seasonal or monthly basis exist and are even partly standardized (e.g. ISO 13790); they need to take into account of solar and internal gains with the help of the utilizabiltiy concept (not all solar gains – especially during the change from heating season to colling season- can be used to reduce heating energy loads)
- simplified algorithms for cooling energy were not established; the need for such a methodology thus initiated activities of the Task participants
- the treatment of dynamical components (like movable solar protection) in a simplified methodology has not been investigated and reasonable recommendations are needed

Task 27 Solar Building Facade Components Subtask A: Performance
Final report, May 2006 11
It is widely accepted that the energy performance of a building component may be intimately connected to the building performance itself and to use patterns and user interactions. Therefore the standardized testing of components gives only a part of the answer. As an example one may discuss the solar gains through a window. This is dependent on climate, season, on the building construction (position of window), on the building insulation level and other facts. A badly unsulated old building may utilize the solar gains much better than a new passive house with a very short effective heating season. Moreover when treating not only heating energy we end up with cases (warm climate, well-insulated building) where solar gains are detrimental with respect to energy performance as cooling may be needed to keep temperatures at a comfortable level. What shoudl we say now? Is a window a good energy performer when having a low or a high total solar energy transmittance or g-value? He answers are different for Finnland and New Mexico, for sure. So how do we assess the energy performance of a specific window?
As a first consequence it can be said that a generally accepted unique general energy performance assessment methodology does not exist. We can only collect at the moment parts of such a methodology. Nevertheless it is a great success of Task27 if we could contribute to the clarification of this problem and to have contributed to the basis of a common methodology based on the building performance approach.
2.3 Performance indicators As there is a whole range of performance indicators being discussed, the following definitions shall serve to categorize these different approaches, which should help avoiding misunderstandings.
2.3.1 Building performance indicators BPI The BPI is a quantity directly connected to energy not only taking into account the well-defined component performance say in a laboratory, but also the use of the product. Examples are the heating energy consumption or lighting energy consumption usually related to heated floor area or per volume.
2.3.2 Component performance indicators CPI The CPI is characterized being very much a quantity directly connected to the product without taking into account the use of the product. Mainly the CPI is a single number

Task 27 Solar Building Facade Components Subtask A: Performance
Final report, May 2006 12
based on physical measurements or calculations, specific to product, which characterize a specific performance related to energy transport or storage. Examples are the U-value, the g-value, the visual transmittance and so on in their various specific forms.
2.3.3 Building performance criteria BPC There are performance related parameters which are not an indicator for energy consumption, but nevertheless influence the energy performance of the component. They describe the comfort for the user, that should be kept in an optimal range.
BPI – building performance indicator
Energy performance of building or building zone
energy consumption, energy peak load, auxiliary energy consumption, total primary energy consumption for heating, cooling, lighting, ventilation etc..
CPI – component performance indicator
Specific performance of building component for well-defined conditions
Component based performance figures for thermal , visual, energy, air transport such as U-value, total solar energy transmittance, light transmittance total or into specific solid angles (upper/lower hemisphere) defined for specific testing conditions (temperatures, incidence angles etc.)
BPC - building performance criteria
Characteristic indicators of building performance which indirectly influence energy consumption
Visual and thermal comfort indices such as Predicted-Mean-Vote PMV, PPD, Glare indices etc.
2.4 General methodology - Different approaches A general methodology should be able to evaluate and describe the energy performance of advanced, but also more simple and more conventional building envelope components. Wherever a simple component is well characterized by a simple approach, that should be possible, as more complexity just increases labour and cost without gaining more insight. However, for complex products, the method should be able to reflect in sufficient detail the specific design properties of the component.
Innovation is a continous process, therefore the methodology shall be open for improvement. Whenever a more detailed description is necessary, it should be able to feed that in. Thus we would like a general approach open to improvements and further developments.

Task 27 Solar Building Facade Components Subtask A: Performance
Final report, May 2006 13
During the work it became evident that two main approaches concerning performance assessment exist, which had to run in parallel during the project, as they have a fundamentally different philosophy. An component performanced assessment method (CPAM) starts from the basic characteristic component data and relates performance to objective physical data. This seems straight forward, but just a few hints may serve to illustrate the problem in this case: The solar gains of a window are characterized by the total solar energy transmittance g in this approach. However, depending on the window area fraction of a building façade, depending on the use and boundary conditions (office with high internal gains or dwelling with low internal gains) the usefulness or better, utilizability, of the solar gains is completely different. Whereas a high g-value may be beneficial for a typical dwelling, the office building would need a low g-value, i.e. solar protection glazing, to reduce the dominant cooling energy consumption.
The other approach, the building performance assessment methodology (BPAM) tries to respond to this problem and considers the building envelope and its energy performance in the context of a building. Therefore a connection between objective characterization of the building envelope and the related benefit depending on the actual application has to be created. The approach here is to consider typical situations and simulate the performance of building elements in the context of their use. It emphasis the fact that a window as such does not need energy (and therefore strictly speaking cannot have an energy performance), but the building with windows needs energy to provide a specified comfort climate for the human users. On the other hand, this approach has the implicated problem of being less objective than a physical measurable quantity. Standard situations and buildings have to be defined as a reference for the performance figure.
3 Component Energy Performance Building façade components can be evaluated as isolated components, or as an integral part of the building façade, building section, or the whole building. Usually, façade components are evaluated as isolated items for the purpose of energy/thermal performance rating of the product, product development, or simply to learn more about the product performance. Alternately, the façade component may be evaluated as an integral part of the building for the purpose of evaluating the effects of that component on the energy use and other indices of the building. The ancillary effect is how the building and building systems affect the component itself (e.g., forced air heating and cooling systems usually increase the rate of heat transfer from the indoor surface of a window, therefore affecting its thermal performance), and how are those effects in turn affecting back the performance of the whole building. Obviously, some of these effects are occurring

Task 27 Solar Building Facade Components Subtask A: Performance
Final report, May 2006 14
simultaneously and cannot be separated, but the analysis of all of them would be prohibitively expensive. This is true now and it is probably true in a near future. Therefore some compromise between accuracy and practicality needs to be achieved.
The rapid development of computer hardware and software technology in recent years has allowed for increased complexity of algorithms and procedures that are used in simulating the performance of building façade components, or thermal performance of whole buildings. Increased complexity until now often meant that user had to deal with complex user interfaces, which are very cumbersome and requiring arduous and time-consuming data preparation process (pre- and post-processing). In addition, various stages of building design and analysis were disconnected, requiring the user to re-enter most of the data necessary to do analysis. However, in recent years there are several initiatives (e.g., Alliance For Interoperability, etc.), which are global initiatives with the goal to reduce disconnect between different stages in building design and to develop standard interfaces between different software modules. With the increased performance of computers, better understanding of the physics of the problem, and utilizing interface standards, it is possible to develop computerized procedures that incorporate very complex algorithms and inner structures, but with very friendly and cost effective user interfaces.
There is a natural tendency to simplify internal operational algorithms along with the overall simplification of user interface. This is unnecessary, however, since we can preserve internal complexities and accurate calculations and even increase them in order to provide for an easy to use program. This new approach has an obvious benefit; we don’t have to sacrifice accuracy of the methodology in order to make things appear simple. Another great benefit, which can have repercussions for the work within Task 27, is that we don’t have to spend (or waste) our time in developing simplified approaches, when we can use our precious time to further enhance existing algorithms, which may or may not be very complex. Even for an expert in the field, it can be prohibitively expensive to run complex programs in order to find what is the effect of a particular component on the overall energy performance of a building, and therefore he or she may decide not to use it or to use some overly simplified approach. By building “smarts” into program, it is possible to preserve internal complexities while maintaining relative simplicity and ease of use from the standpoint of end user.
For these reasons, in this paper the emphasis will be placed on the development of the “best science” within practical limits of the current state-of-the-art within related mathematical and physical sciences. The purpose of the work within Task 27 should be to push the frontiers of knowledge and science in building energy performance field, and to develop viable methodologies that can be programmed into useful tools for use in building technologies.

Task 27 Solar Building Facade Components Subtask A: Performance
Final report, May 2006 15
3.1 Specific Research Projects As mentioned earlier, this paper will focus on the performance of a building façade component and how to improve the methodology of evaluating its energy performance. First the relevant issues and related research areas will be identified, and then the proposed approach in addressing these issues will be recommended.
While the state of the art in evaluating energy performance of solar façade component has steadily advanced over the years, and has resulted in the improvements in standards and performance assessment tools, there are number of issues that remain unresolved or are not in satisfactory state. The issues can be divided according to the intended application of the methodology, and we can identify several areas of application for this purpose:
• Rating and Labeling
• Product selection and comparison
• Product development and design
• Integration of the component into the building
3.1.1 Rating and Labeling Energy rating and labeling of solar façade components is being transformed in recent years from loosely defined system, where few representative products are tested or sometimes simulated according to a national standard, to a comprehensive system, which includes performance assessment of a majority of manufactured products according to strict guidelines and certification procedures (e.g., laboratory accreditation program, both testing and simulation, regular trainings and re-trainings of certified professionals, yearly round robins, etc.). This has been possible largely due to an advancement of computer simulation tools, which were both less expensive and more consistent and traceable. Significant and continuing research investments and international technical cooperation in advanced simulation algorithms and tools, by the United States, Canada and other countries, have lead to new generation of standards (i.e., ISO 15099) and accurate, technically credible computer simulation tools for determining window energy performance, which incorporate these standards. The advancement in computer simulation tools was also substantially due to activities in the past IEA Tasks and Annexes, and it is the expectation that Task 27 will provide significant advancements in algorithms and methodologies that can be incorporated in future computer simulation tools. It is worth emphasizing, however, that the subject of Task 27 in support of energy rating and labeling should be in the development of algorithms and methodologies and not in defining how to

Task 27 Solar Building Facade Components Subtask A: Performance
Final report, May 2006 16
set up successful rating and labeling system. Positive experiences, documented in papers and reports, may however become part of background information that can be used by other countries and organizations in developing their own rating systems. Two papers, presenting extraordinary success of fenestration rating and labeling system in United States, is attached here for reference and background information.
The areas that need further attention due to deficient existing methodologies or lack of data are identified below:
1. Convection heat transfer on fenestration boundaries, 2. Local convection heat transfer in sloped and wide spacing façade cavities, 3. 3-D heat transfer effects including radiation heat transfer exchange between self-
viewing fenestration surfaces and/or between fenestration surfaces and fenestration attachments, corner effects, thermal bridging, solar effects, etc.
4. Thermal and solar performance of solar facades with attachments, 5. Air infiltration, 6. Use of computational fluid dynamics (CFD) in fenestration computer programs, 7. Precision, Bias and Uncertainty in measuring local temperatures and heat fluxes, 8. Development of additional indices, 9. Emerging technologies
The following is more detailed description of each particular area and identification of potential research projects to address it.
3.1.1.1 Convection heat transfer on fenestration boundaries: Currently, simple average convective heat transfer coefficient is used for thermal performance simulations. While this is true on both sides of façade component, the effect of this simplification is much more pronounced on indoor side, where convective portion of surface heat transfer coefficient represents more significant portion of thermal resistance (i.e., about 50%). This average value is currently either fixed and based on some average reference case (ISO/EN 10077), or it is based on algorithms for natural convection over the constant temperature/heat flux flat plate, which is based on temperature difference/heat flux between glazing surface and surrounding air (ISO 15099). This second approach is more accurate and appropriate for use in computer tools, but it has a deficiency when dealing with projecting products, which have significant projections perpendicular to the plane of glazing surface (e.g., skylights, green house windows, curtain walls, etc.), due to framing or other components. Also, there is a question of fenestration attachments and their effect on convection heat transfer (i.e., shading devices, etc.). ISO

Task 27 Solar Building Facade Components Subtask A: Performance
Final report, May 2006 17
15099 suggests some correlations for venetian blinds, but work needs to be done to extend these correlations for generalized attachment system and possibly improve existing ones.
Both testing and simulation have uncertainties in convection heat transfer and further research should be done in both areas to resolve these uncertainties.
Measurements of temperature and velocity in a hot box are done at the mid point both vertically and horizontally, with the claim that this represents “free stream condition”. This is not likely to be the case because of mixing that occurs as the air flows over the surround panel and fenestration surface, especially when having geometrically projecting products. Further research needs to be done involving measurements of air flow parameters (i.e., temperatures, velocities, turbulence intensities, flow visualization parameters, etc.), and validating and comparing them with computer simulation for those same geometries. Additional requirements could be developed as for the limits in size of projections in fenestration products and hot box configurations that are appropriate for these systems. Validation of computer models can also be done using IR thermography, interferometry, laser-dopler velocimetry, etc.
Computer modeling of convection heat transfer over the boundaries of projecting products, over the attachments, and in the space between fenestration products and attachments, along with measurements can provide necessary data to develop better heat transfer correlations for modeling these products using practical computer tools. Validation of these modeling works is very important, so it is imperative to develop guidelines for validating computer modeling. The use of emerging techniques in modeling turbulent convection heat transfer should be investigated, especially in the light of emerging computer technology (i.e., utilization of massively parallel computer systems and the development of computer codes to take advantage of this technology, etc.). In addition to average convection heat transfer, it is desirable to investigate local variations in convective heat transfer, as it relates to geometry, presence of attachments and temperature distributions. As a part of research work correlations for local convective heat transfer could be developed, as it will affect comfort related indices, like condensation resistance.
Many fenestration products are installed at angles other than vertical, and there is strong inclination to provide rating indices at the angle that the product is mostly used at. Examples of these systems are roof windows, or skylights, commercial fenestration systems, etc. Both experimental and computer modeling research work needs to be done to determine suitable methodology of performance assessment for these products. From the existing experience, it is apparent that commercial level measurements of sloped products is very difficult and expensive and most of the current efforts are going into the
Task 27 Solar Building Facade Components Subtask A: Performance
Final report, May 2006 18
development of suitable computer modeling methodology for handling these products. While some algorithms exist for predicting convective heat transfer on boundaries of sloped products, there is much less information than for vertical surfaces. It is also imperative to develop appropriate methodology for validating computer-modeling results in much the same way as for vertical systems.
Finally, there are many fenestration products with very irregular shapes and geometries (e.g., pyramid skylights, barrel vaults, garden house windows, double facades, etc.). While it is impossible to develop correlations that would include all possible products, in the case of irregularly shaped products, it is desirable to develop some approximate guidelines about which models to use to represent convection heat transfer on fenestration boundaries of such products. Also, further research should be initiated to cover as many of these products as possible.
Correlations for average and local convective heat transfer on fenestration boundaries can be developed in the form of a library for use by computer modeling tools. This library of standard convection heat transfer correlations could be developed using latest interoperability guidelines by utilizing standard interface format.
3.1.1.2 Local convection heat transfer in sloped and wide spacing façade cavities: Local convection heat transfer in enclosures is important to assess condensation resistance potential of solar façades. Condensation resistance is the important emerging index that is related to durability, comfort, and health issues. Condensed moisture on the façade component can accumulate and over time cause degradation and failure. The best example of a façade component that is especially vulnerable to moisture condensation, are fenestration systems. Mold that accumulates because of excess moisture on surfaces that are subject to condensation and freezing can create adverse health environment in the occupied area. Not only can moisture accumulate on the surface, but also it can penetrate cavities and cracks, which are less visible and more likely to cause long term problems.
Local convection heat transfer in glazing and other façade cavities has been investigated in only selected cases, and there are only couple of research papers that deal with this subject in a manner that can be useful for fenestration systems and solar façade components. Since it is still not practically possible to run full CFD computer models every time we want to find condensation resistance potential in a particular fenestration system, especially at high Ra or at an angle other than vertical, it is necessary to develop models that can be used in fenestration computer tools for this purpose.
The research work could produce heat transfer correlations that are dependent on the position in the glazing cavity, in addition to Raleigh number, Ra, and aspect ratio, A.

Task 27 Solar Building Facade Components Subtask A: Performance
Final report, May 2006 19
Curcija (2001) has developed a model that is successfully used for vertical glazing cavities being in laminar flow regime. This model or its variants could be extended to turbulent regime (i.e., wide spaced cavities, or large temperature differences or both), and sloped cavities.
Suitable experimental technique needs to be devised to validate computer modeling and future set of correlations. The library model, mentioned under 0 can be utilized for these correlations as well.
Vertically oriented frame cavities (e.g., jamb sections) are not modeled correctly in current computational models. This is especially true for large and tall cavities. Current correlations need to be updated to more correctly account for vertical convective loop in tall but narrow (in both x and y directions) cavity, 3-D heat transfer effects including radiation heat transfer exchange between self viewing fenestration surfaces and/or between fenestration surfaces and fenestration attachments, corner effects, thermal bridging, solar-optical effects, etc.
It is not completely known what are the extents of 3-D heat transfer effects in façade components. Generally, it is believed that the effect is not that large, because the validation between testing results and 2-D computer modeling results, which are transformed into 3-D results through the use of area weighting and/or linear thermal bridging factors, gives fairly good agreement for most fenestration products. However, the problem is more pronounced in products that are traditionally considered to be projecting products (e.g., roof windows, commercial skylights, etc.)
Full 3-D computer tools that are user-friendly and inexpensive to use, are perhaps several decades away. Issues like user-friendly 3-D geometry creation and automated 3-D meshing, are the most complex tasks. Simulation of conduction and radiation heat transfer in 3-D are relatively straightforward, and represent least problematic areas. CFD modeling, especially in 3-D is big challenge and in addition to the lack of automated error estimation techniques, it poses a challenge to develop a computer tool that would be able to be run by a non-expert user.
Interim solution would be to run selected fenestration system configurations in 3-D using research class computer programs and to develop correlations that can be used in current 2-D computer models. The list of areas for which corrections and/or correlations can be developed in this manner are:
Corner effects: 3-D effects are usually most pronounced at corners, and so it is reasonable to develop corrections and correlations for these regions. In addition to corrections for U-factors, which are allowed to be average quantities, since U-factors are average indicators of the overall window performance, corrections for condensation

Task 27 Solar Building Facade Components Subtask A: Performance
Final report, May 2006 20
resistance indicators (CRI) can be developed as well. Because CRI depends on local quantities, like local temperature distribution and relative humidity on indoor fenestration surface, local corrections would need to be developed.
Protruding Hardware: Development of corrections/correlations for 3-D heat transfer effects of protruding hardware in fenestration systems can be done in a similar manner as for corners effects. The form of correlations may be different because of point thermal bridging, that is typical of such elements. Again, average corrections need to be developed for U-factors, while local corrections would need to be developed for CRI.
Radiation heat transfer: Most of the existing procedures and standards use simple "black body" radiation model on the fenestration boundaries for calculation of U-factors or other energy performance indices. On the room (indoor) side, this model assumes that all fenestration surfaces "see" a surface at uniform temperature, equal to the air temperature and emissivity of 1.0. In reality, and especially for projecting (e.g., roof windows, commercial windows) or highly conducting products (e.g., Aluminum profile windows), fenestration surfaces will have significant self viewing, which means that one surface may see portion of the room, but also portion of other frame surfaces. In the corner, where two surfaces are perpendicular to each other their mutual view factor will be actually larger than the view factor to the room surroundings.
The method employing 2-D view factor calculation and radiation calculation between segments on the boundary has been developed and implemented in ISO 15099, as well as in computer codes (THERM). This method makes an important assumption that the surfaces are gray and perfectly diffuse, where each grid segment on the boundary represents isothermal surface. It is not clear what are the implications of this assumption and how large are 3-D radiation effects (i.e., in corners and from other projecting surfaces that are invisible in 2-D models. This method could also be extended to analyze fenestration attachments, like venetian blinds, vertical blinds, drapes, insect screens, etc. Coupled with improved convection heat transfer correlations from the section 3.1.1, the new procedure could provide significantly improved analysis tool for fenestration attachments as well.
Also, it is important to note that this method and associated assumptions are developed only in far IR range (i.e., “thermal range”). It is intriguing if this same idea could be used in solar range, where the radiation balance would be calculated for each wavelength band and extended to include both diffuse and specular effects. The product of this type of analysis could be solar heat gain performance for complex fenestration systems, which could provide alternative to very expensive and notoriously unreliable testing of such systems in solar calorimeters.

Task 27 Solar Building Facade Components Subtask A: Performance
Final report, May 2006 21
3-D solar heat gain effects are currently completely ignored in computer tools. As a matter of fact, even 2-D solar heat gain effects are currently ignored in computer models. By using sophisticated ray-tracing technique and coupling it with 3-D thermal analysis, it can potentially provide full performance model of a complex fenestration product. However, as indicated earlier, even 3-D user-friendly and inexpensive thermal model alone is several decades away, and so is the coupled solar-thermal model even farther away.
SHGC of frames is currently determined using overly simplistic formula that couples U-factor and outdoor film coefficient with absorptance and solar irradiance to produce SHGCf. More accurate formula is given in ISO 15099. This formula correctly accounts for solar heat gain of frames in 2-D, by solving 2-D energy balance on the frame/edge of glass assembly. Extension of this model in 3-D would produce more accurate frame SHGC.
3.1.1.3 Performance of solar façade components with attachments Performance of components with different attachments is the area with relatively little existing knowledge. The following is a partial list of different types of fenestration attachments:
− Venetian blinds, − In-between glazing screens/venetian blinds − Draperies, − Curtains, − Bug screens, − Complex overhangs/fins, − Light redirecting devices, − Attachments like in double facades, − etc.
Recently, some work in both thermal and solar aspects was done for venetian blinds and the method was incorporated into ISO 15099 standard. These models use some approximations and assumptions, and limited amount of validation was done. Further work should concentrate on extending methodology to generalized attachment. Thermal behavior of a space between the component and attachment need to be modeled using CFD and correlations for both average and local heat transfer needs to be developed. Also, additional research needs to be done in the area of solar effects. Existing model for venetian blinds uses assumption that all reflections are diffuse, which appears to be reasonable assumption up to certain angles of incidence. Extension of this model to account for specular and diffuse reflections, would allow for more generalized methodology which would always be applicable. The use of generalized ray-tracing
Task 27 Solar Building Facade Components Subtask A: Performance
Final report, May 2006 22
technique is one of the solutions to this problem. The advantage of using this approach is that it can be extended to any type of attachments, with the geometry of arbitrary complexity.
Further advancement in this area can be accomplished by coupling ray-tracing analysis with thermal analysis. Current thermal analysis tools utilize numerical modeling methods (i.e., finite element method, finite volume method, etc.) and the coupling with solar-optical analysis can be done through the absorbed portion of solar radiation in glazing layers and attachment layers. Good thing is that solar-optical properties are very weakly coupled with thermal behavior of the system, so that it is not necessary to iterate on final solution. It is enough to perform ray-tracing and determine the absorbed quantities in system layers along with directly transmitted and reflected portions, and use those absorbed quantities in thermal analysis. This methodology would provide very accurate results for solar heat gain of the complex system.
In addition to the need for significant improvements in simulation methodologies and development of effective computer tools that can accomplish these simulations, it is also necessary to develop bi-directional property data. This is not a trivial task and further investigation needs to be done to determine the most cost-effective means of developing this data for variety of attachments. Both measurement and computer simulation methods could be utilized in obtaining this data.
The presence of shading devices and other attachments near the edges of will only amplify this problem.
3.1.1.4 Air infiltration Air infiltration is currently measured for façade components using laboratory and field conditions and exposing a façade component to a pressure differential and measuring the amount of air that passes through the façade component in a given interval of time. There is no accepted methodology for modeling air infiltration in façade components. This issue is very complex and seemingly un-attainable, because the infiltration will depend on the status of frame components and seals, which often cannot be known in advance. Some idealizations will be necessary in order to accomplish even modest advances in the development of such computer models.
On the other hand, air infiltration plays very important role in component performance assessment, not only in terms of effects on annual energy performance of a building, but also on comfort, condensation resistance and relative humidity of indoor air. For example, the infiltration of cold winter air through cracks in a window will significantly affect surface temperatures on the indoor side of window, in a near vicinity of the crack. However, this air is usually very dry, thereby reducing the moisture content of air in the vicinity of that

Task 27 Solar Building Facade Components Subtask A: Performance
Final report, May 2006 23
crack. Therefore, on one hand this infiltrated air will increase the potential of a window for condensation (i.e., by reducing surface temperatures) while the dryer air near that surface will decrease potential for condensation. These two effects work in opposite direction, and better knowledge about their magnitudes would help us quantify total effect. It is important to realize localized nature of condensation and the need to determine these effects as a function of location on window surface.
In addition to the daunting task of the development of viable computer modeling methodologies for the prediction of air infiltration, novel methods of measuring air infiltration in hot boxes, taking condensation resistance and other local effects into account can be developed, to provide solution until viable computer modeling methodologies are developed.
Sometimes, air is unable to pass through the system from one side to another (i.e., from the exterior to interior side), but it enters for example frame cavities, significantly changing their thermal performance. This effect is sometimes called “wind washing” and affects both U-factor and condensation resistance of façade components. Currently, there are models that account for this effect but they are overly simplistic and there does not appear to be literature supporting their use (e.g., well ventilated and slightly ventilated frame cavity models in ISO 15099). These effects are especially pronounced in commercial framing systems, which incorporate larger frame cavities and with more openings to the exterior.
3.1.1.5 Use of computational fluid dynamics (CFD) in building façade computer programs Currently, CFD modeling is primarily used in detailed analysis by experts in that field. The results of such analysis are often converted into correlations for use in simplified tools for analyzing thermal performance of façade components. There are only few notable exceptions where CFD is used directly in the model of façade component (i.e., future room CFD analysis in EnergyPlus, model of laminar natural convection in VISION program, etc.).
The use of CFD modeling in user-friendly tools, which are intended for general user, is very questionable. The reason for this is that CFD modeling still requires high level of expertise in order to get meaningful results. There are several areas that represent problem:
a) Uniqness of the solution: Very often, the solution of CFD modeling is not unique, and the user can get widely different results depending on the initial conditions, solution technique, etc. and other details that are independent on the physics of the problem.
b) Execution time and storage requirements: Most of CFD models in natural convection require long execution time and fairly fine grid, or mesh. It still takes several days to perform a detailed modeling of a certain modestly complicated system, which is too long for
Task 27 Solar Building Facade Components Subtask A: Performance
Final report, May 2006 24
practical use in everyday practice. In addition, it often requires large memory space (ROM), which is typically not available on a computer of an average user.
c) Automated determination of flow regime: Determination of the flow regime at the time of simulation should be automated. There is no suitable automated method to switch between laminar and turbulent regimes and to apply appropriate turbulent model.
d) Automated Error Estimation: Lack of reliable automated error estimation methodologies, makes necessary to have an expert who knows how to prepare good mesh, which is very complex task. Automated error estimation and adaptive mesh refinement is needed , in much the same fashion that some conduction/radiation heat transfer programs work (e.g., THERM).
e) 3.1.1.6 Precision, bias and uncertainty in measurement methods Measurement of local quantities: surface temperatures, surface heat fluxes. Large scatter of data between different laboratories. Temperatures at the same location can differ by as much as 10C between different laboratories.
Calibration problems: for projecting products, calibration specimen does not correspond in geometry to roof windows and other projecting products. Other question is environmental temperature for such products.
Investigate effects of the design of test equipment on variations in measured variables.
Flanking energy flow of the fenestration product is ignored in current computational models. Computational models need to be extended to include section of surround panel in order to capture this flanking loss,
Field measurement of actual installation within building. How to do field measurements, and what kind of data to collect. This data should provide answers at how component perform as a part of integrated environment (room, building, etc.)
Use of IR thermography in thermal measurements. Recently, efforts had been made to develop quantitative methodology to measure surface temperature of fenestration products. The claimed accuracy is 0.5C, but further work is needed to uniformly prescribe how measurements and corrections should be done to provide repeatable results.
3.1.1.7 Development of additional indices Additional performance indices, like condensation resistance, UV fading, annual energy performance for different climates, etc, help improve both direct and non-direct energy performance and improve durability of fenestration products. Additional, long term research work should yield several more indices that can provide useful information about

Task 27 Solar Building Facade Components Subtask A: Performance
Final report, May 2006 25
the product performance. Even though none of them are directly energy related, they have energy implications.
Condensation Resistance: This index has been already developed in United States, but there are still remaining unresolved issues. Most notably, sloped systems and wide glazing cavity IGU systems can not be modeled at this time. The methodology for vertical systems would need further validation and refinement
UV Fading: Currently ?-Krochmann function is used to quantify UV related damage. This function is somewhat controversial and further work is needed to either confirm its validity or new function needs to be developed.
Annual Energy Performance: This is perhaps one of the most controversial indices, because of the inability to develop simple number that would capture performance of a product with respect to annual energy use. The problem is that component energy use or gain will depend on variety of variables, like building it is installed to, climate, orientation, pattern of use, etc. The number of these variables inherently complicate the development of an index.
Daylighting index: This index depends on one of existing indices, visible transmittance, VT. It could either supplant it or replace it??.
Thermal-structural interaction. This interaction can result in glazing deflection and/or stress accumulation in glazing layers, leading to potential failure (i.e., breakage). This effect is currently estimated using relatively crude approximations. Some manufacturers and architects perform expensive computer simulation, using commercially available numerical tools. Current fenestration computer models don’t incorporate detailed analysis of this kind. Especially big problem is deflection in commercial glazing systems, where due to the presence of advanced absorptive coatings, large glass areas, and the use of rigid framing systems (i.e., Aluminum, thermally-broken, or not) large deflections lead to significant degradation of thermal performance as well as breakage, accelerated seal failure, and other failures. Deflection can be predicted by utilizing algorithms for thermal-stress interaction and moving boundary numerical models, and can be built into existing 2-D numerical models of heat transfer in fenestration systems.
Moisture migration and premature seal and IGU failures. Collection of moisture in frame cross sections, coming either from rain, or frost/condensation accumulation, as well as humid climates, can cause moisture penetration inside the sealed IGU, causing the failure of the seal structure and low-e coating on one of glazing layers. Possibility to predict this behavior with easy to use and accessible computer tools, can lead to the development of a rating system that would enable consumers to select appropriate product for a given climate and exposures.

Task 27 Solar Building Facade Components Subtask A: Performance
Final report, May 2006 26
Acoustical performance. Acoustical performance is presently done exclusively through expensive testing in life size sound chambers. The cost of such measurement prevents this performance indicator of becoming standard rating index. By developing accurate and easy to use computer tool, which is tied to the existing thermal performance tool, can significantly reduce the cost of the prediction of acoustical performance and enable it to be developed into the rating.
Thermal and Visual Comfort. This is perhaps one of the most important indices, as it relates to human behavior. Question if this is one or two indices.
3.1.1.8 Emerging technologies Several emerging technologies are being developed and commercialized in recent years. Examples of these technologies are: Vacuum glazing, integrated wall/window systems, tubular daylighting devices, double facades, etc. In most of the cases, existing measurement and simulation procedures can not deal with these products, and so they have to be left un-rated and excepted in energy codes. In addition, it is difficult for architects and engineers to predict their performance and their effects on the size of HVAC system, effects on comfort, condensation resistance, etc.
In order to address this problem, it is necessary to identify research areas that would be undertaken, either during the duration of this Task, or during one of follow-up Tasks.
3.2 Product selection and comparison One of first questions in product selection and comparison is whether this should be done based on isolated component indices of performance or the performance of a product as a part of in integrated environment (i.e., room, zone, or building).
Product selection can be done in one of several ways. 1. By following fixed guidelines and using component performance indices, like U-
factor, g, VT, and other emerging indices 2. By using computer simulation tools and utilizing detailed component data,
calculated using methodologies developed in A1. 3. Code requirements
3.2.1 Fixed guidelines This method is most appropriate for smaller buildings where it would be expensive to run computer models, or for projects where it is not quite clear how the building looks like..
3.2.2 Computer simulation tools
Task 27 Solar Building Facade Components Subtask A: Performance
Final report, May 2006 27
This method gives best results, because it takes into account all aspects of a component and building it is installed to.
3.2.3 Code Requirements Building codes and regulations often have both prescriptive and performance based criteria. Typically, for performance based-criteria, the specific computer tools are recommended.
3.3 Product development and design Product development relies on the availability of methodologies for performance assessment. The availability of reliable computer simulation methodologies reduces product development cycle and reduces development cost. Typically with measurements, it is necessary to produce physical model in order to measure its performance, and then based on measurements, refine design and produce another iteration of the product. This process is repeated until some optimal performance is achieved. This is usually expensive and time-consuming process, which can be significantly reduced if computer simulation is employed. Iterative design refinements are done in a computer, without the need to build expensive prototypes and tools for producing prototypes (i.e., dies for PVC or Aluminum profiles, etc.)
3.4 Integration of the component into the building Not only the energy use from a product depends on the building and space it is installed to, but also the performance of the product itself gets affected by the integration of a component into the rest of building façade. For example, the performance of a fenestration component is determined under the idealized configuration, where the surrounding panel is constructed out of highly insulating material, so that interface between window and that surround panel can be approximated by adiabatic boundary condition. When that product is installed in a building façade, that interface is no loner adiabatic, and it can be safely assumed that there are significant 2-D and 3-D heat transfer effects which affect performance of both façade component (e.g., window) and the remaining façade. The following is an attempt to formulate a list of issues that result from the integration of a component into a space and building.
1. Wall/fenestration interaction, 2. HVAC system effects on a façade component, 3. Effects of room geometry and composition on a façade component,
Task 27 Solar Building Facade Components Subtask A: Performance
Final report, May 2006 28
4. Effects of humans on a façade component, 5. Feedback loop from the building, 6. Dynamic Effects, 7. Effects of façade component on the other building systems
3.4.1 Wall/fenestration interaction So far fenestration systems were considered separately from the wall systems in which they are potentially installed. Since fenestration systems are tightly integrated into walls, thermal interaction between a fenestration system and a façade becomes an important issue. There are several effects that can be analyzed at this interface.
• Heat transfer effects of framing on energy flow through interface area (e.g., area immediately around rough opening where fenestration system is installed).
• Heat transfer effects of filling materials (e.g., material inserted between rough wall opening and fenestration system intended to reduce air infiltration and to provide insulation to heat transfer), as well as presence of air pockets and cracks. Effect of trimming techniques and materials, as well as sealing techniques,
• Air infiltration through the interface area,
• Effects of different installation techniques.
3.4.2 HVAC system effects on a façade component Very often, the layout and usage of a HVAC system affects the performance of a façade component. Whether the HVAC terminals are water or air based, they will always cause air movement in the room, which will affect the thermal performance of the component due to the change of thermal boundary conditions on the room side. Inter-zone air flow , which is often the result from the use of HVAC system, will also affect performance of a façade component.
To asses these effects, it is necessary to define some common HVAC layouts and to investigate their effects on the performance of a façade component.
3.4.3 Effects of room geometry and composition on a façade component Geometry and construction of the room will have effects on the component performance. The temperature, emissivity, and distribution of surfaces in the room will have strong effect on radiation heat transfer field and convection currents in the room.
Task 27 Solar Building Facade Components Subtask A: Performance
Final report, May 2006 29
This situation can be handled if the whole room, including the fenestration system, is modeled with its true geometry. However, this approach is not currently practical for everyday use. In order to account for full radiation effects, it would be necessary to perform true 3-D modeling, which is very complex task. Alternative is to perform 2-D analysis of true geometry and then combine results into 3-D. This methodology for converting from 2-D into 3-D results does not exist currently, and could be developed. In addition, CFD modeling can be performed to asses the convection heat transfer in room and building. Different room configurations (i.e., different percentages and locations of exterior walls, different framing systems, different sizes, etc.) could be considered and some correlations developed from this.
Future whole building energy simulation tools could include real geometry of the building and solve full heat balance in a building. Because of tremendous complexities in modeling 3-D geometries, it may be more appropriate for now to model 2-D cross sections, in which some of these realistic effects would be directly considered (i.e., radiation heat transfer with view factors calculation, solution of dynamic 2-D heat transfer equations in real time, therefore capturing effects of thermal bridges and geometric details.
3.4.4 Effects of humans on a façade component Human interaction with buildings and building facades is quite significant and active. We set temperatures of spaces, we operate windows, draw curtains, we emit moisture, turn on and off lighting, etc. From these activities we affect to some extent performance of a façade component. However, it is not easy to always quantify these interactions, because it is hard to predict some typical behavior and consequences of that behavior.
Start by categorizing and defining typical patterns of human behavior, and then proceed to identify which of these patterns are significantly affecting performance of a façade component. One example is morning showering, which increases the moisture content of the space, therefore increasing the risk of condensation.
3.4.5 Feedback loop from the building In addition to building and space affecting performance of a façade component, the opposite also can be true. The question is how significant this effect is and if it is worth spending time on it.
3.4.6 Dynamic Effeycts We usually look at the performance of façade component as a steady state element, which does not exhibit significant inertia and does not have significant transients. However, this component is a part of dynamic building envelope and Dynamic performance of walls as affected by fenestration systems. Heat transfer resulting from temperature difference of outdoor and indoor air and solar heat gain through fenestration systems significantly affect

Task 27 Solar Building Facade Components Subtask A: Performance
Final report, May 2006 30
dynamic performance of building structures. Current computer models for predicting energy use of buildings use simplified correlations that account for dynamic.
Expansion of scope of the existing fenestration computer models to include transient capability (addition of time variable), and ability to handle large structures would potentially provide tool that would enable more accurate prediction of energy use in buildings.

Task 27 Solar Building Facade Components Subtask A: Performance
Final report, May 2006 31
4 Testing requirements 4.1 Standards At the beginning of the project an overview of standards for testing and calculation of product categories has been produced and details were listed there. The following two illustrations give an overview of the standards (and established quasi-standards) covered. The order is more or less from ‘most general’ (window) to ‘most specific’ (frame profile, multiple glazing).
Although a test or calculation procedure for windows may also be applicable to glazings, it is evident that the more specific the method, the more precise the results. Moreover, specific product or component types often usually require specific conditions for testing or calculating.
Note:
HFM, GHP: heat flow meter, guarded hot plate apparatus
HB, GHB: calibrated, guarded hot box
HP, IHB: illuminated hot plate/hot box
TC: outdoor test cell NFRC National Fenestration Rating Council, USA ALTSET European project on Angular Light Transmittance and Solar Energy Transmittance test procedures
PASLINK European project on Outdoor test cells ADOPT European project on angular properties of coated glass
Note2: The graphs are not up-to-date (e.g. PrEN 13363 has now reached the final state and is named EN 13363)

Task 27 Solar Building Facade Components Subtask A: Performance
Final report, May 2006 32
OTC Paslink(IHP/B Altset)
Net heat gain
Measurements:
G/CHB EN-ISO 12567-1
U-value g-value
IHP/B Altset
MULTIPLEGLAZING
TRANSPARENTSYSTEMe.g. incl.Blinds
FRAME
WINDOW
U-value
G/CHB EN 12412-2
U-value
Optical properties
(EN410 )(ISO 9050 )NFRC 300Adopt
G/CHB EN 1098HFM EN6752)
/ISO10293GHP EN6742)
/ISO10291
EN 12898Optical properties
Task 27 Solar Building Facade Components Subtask A: Performance
Final report, May 2006 33
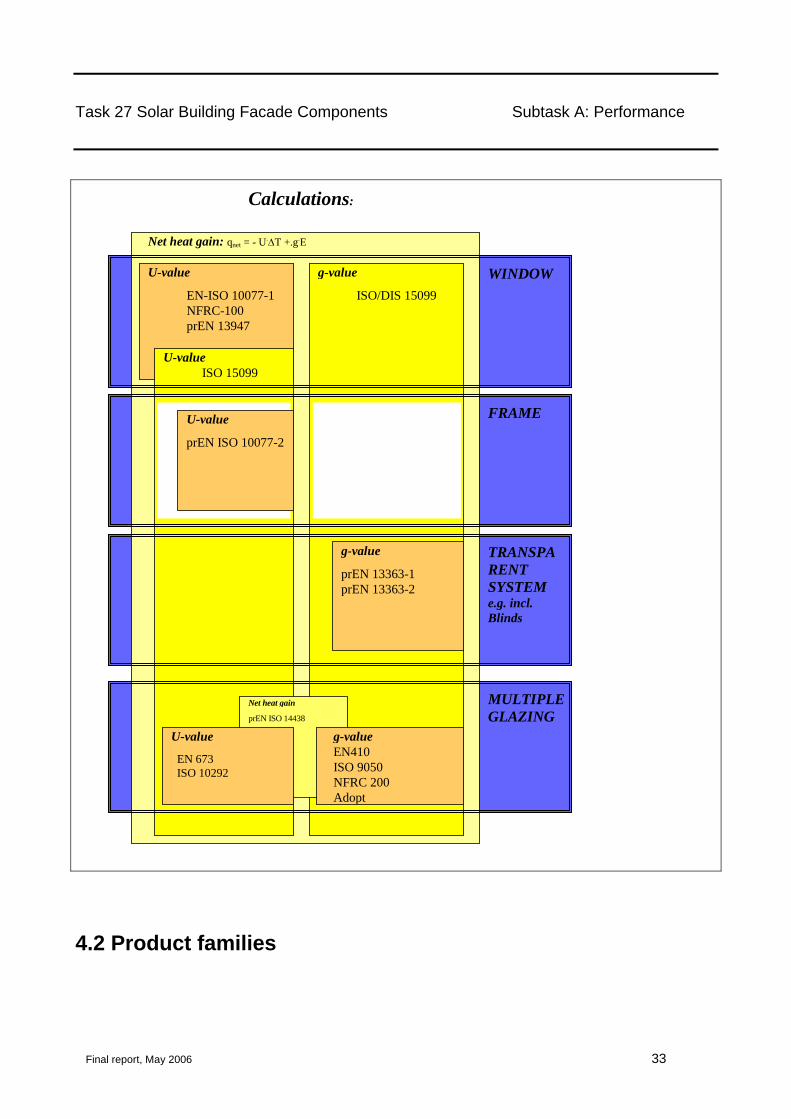
Net heat gain: qnet = - U.ΔT +.g.E
Calculations:
EN-ISO 10077-1NFRC-100prEN 13947
U-value g-value
ISO/DIS 15099
MULTIPLEGLAZING
TRANSPARENTSYSTEMe.g. incl.Blinds
FRAME
WINDOW
R-valueHFM EN67513,14)
/ISO1029314)
GHP EN67415,16)
/ISO1029215)
prEN ISO 10077-2
U-value
g-value
prEN 13363-1prEN 13363-2
ISO 15099U-value
g-valueEN410ISO 9050NFRC 200Adopt
Net heat gain
EN 673 ISO 10292
U-valueprEN ISO 14438
4.2 Product families

Task 27 Solar Building Facade Components Subtask A: Performance
Final report, May 2006 34
Characterization in the laboratory has to differentiate between the various complexities of fenestration types or product families. The following matrix has been developed in order to categorize these questions.

Task 27 Solar Building Facade Components Subtask A: Performance
Final report, May 2006 35
Product family Information
Transparent Layer
Uncoated or coated, clear view
Clear and tinted glass, polymer films, coated glass and films, laminated glass
Light scattering, homogeneous
diffusing tinted glass, diffusing polymer, aerogel, diffusing coated glass or laminated glass
Low thickness Heterogeneous materials
Closed structure: dense solar protection screen, printed glass
Open structure: Open solar protection screen
Flat or non-flat surface
Geometrically structured media
Closed structure: multi ribbed plates
Open structure: Lamella-type solare protection, honeycombs, special daylighting structures (e.g. prismatic panes)
Switchable or adaptable optical properties
electrochrome, gaschrome, photochrome and thermochrome/thermotropic glazings
Transparent System
Uncoated or coated clear glazing
clear or specular coated glazing with or without plastic film inside
System with diffusing or low thickness Heterogeneous materials
system with diffusing or printed pattern
system with static laminated shading blinds or metall grids
aerogel glazing
system with
fixed or moving blinds
system with static lamella-type shading blinds or profiles
system with venetian blinds
System mit geometrischen Strukturen
system with transparent insulation material (capillary or honeycomb structures)
System variabel optical properties
system with electrochrome, photochrome and thermochrome composants
Frame, Integration
Edge seal spacer aluminium, steel or polymeric with diffusion barrier
Frame profile Wood, plastic, metal with thermal break, combi, …
Wall integration Wärmebrücke des in die Wand integrierten Fensterrahmens
Other z.B. Punkthalter

Task 27 Solar Building Facade Components Subtask A: Performance
Final report, May 2006 36
mixed opaque-transparent constructions
Curtain wall facades, double skin facades, complete facade elements (e.g. with transparent insulation)
NB:
Grey shaded
“Conventional” products
For the characterization of the energetically relevant properties three areas should be mentioned: a) thermal properties (heat conductivity, thermal resistance, U-value) b) optical properties (transmission, reflection, absorption) c) mixed properties (total solar energy transmittance)
Grey shaded areas within the matrix correspond to conventional standard products, where the characterization with staste-of-the-art methods causes no major problems and is well-known. Other product families require more sophisticated methods or an adaptation of existing testing methods to the relevant properties of the family. Within IEA we looked into several areas in detail:
a) testing of systems with lamella-type solar protection (e.g. Venetian blinds) b) testing of systems with switchable glazings
The testing of systems with light-scattering or inhomogeneous materials has been dealt with already in previous international projects (e.g. IEA Task 18, European project ALTSET). We did not investigate pure material or layer properties but looked into the properties of the complete system or product. The level of an experimental study of a complete facade unit including frame and integration aspects was not reached in systematic studies. Instead we emphasized on integration properties using calculational tools. This is advantageous as too many aspects and variations (size, combination of products, ..) are possible and consequently experimental work is extremely costly. The possibilities for calculation for frame profiles, edge seal and wall integration are advanced to the level of international standardization already (EN ISO 10077 and 10211). Within the realm of integration and double facades simplified calculational methods have been developed and applied to case stiudies within IEA Task 27.
4.3 General recommendations for angular measurements 4.3.1 Definition of angles For the discussion of angular measurements, which are necessary to characterize completely the major part of solar protection devices ( Venetian blinds, external blinds),
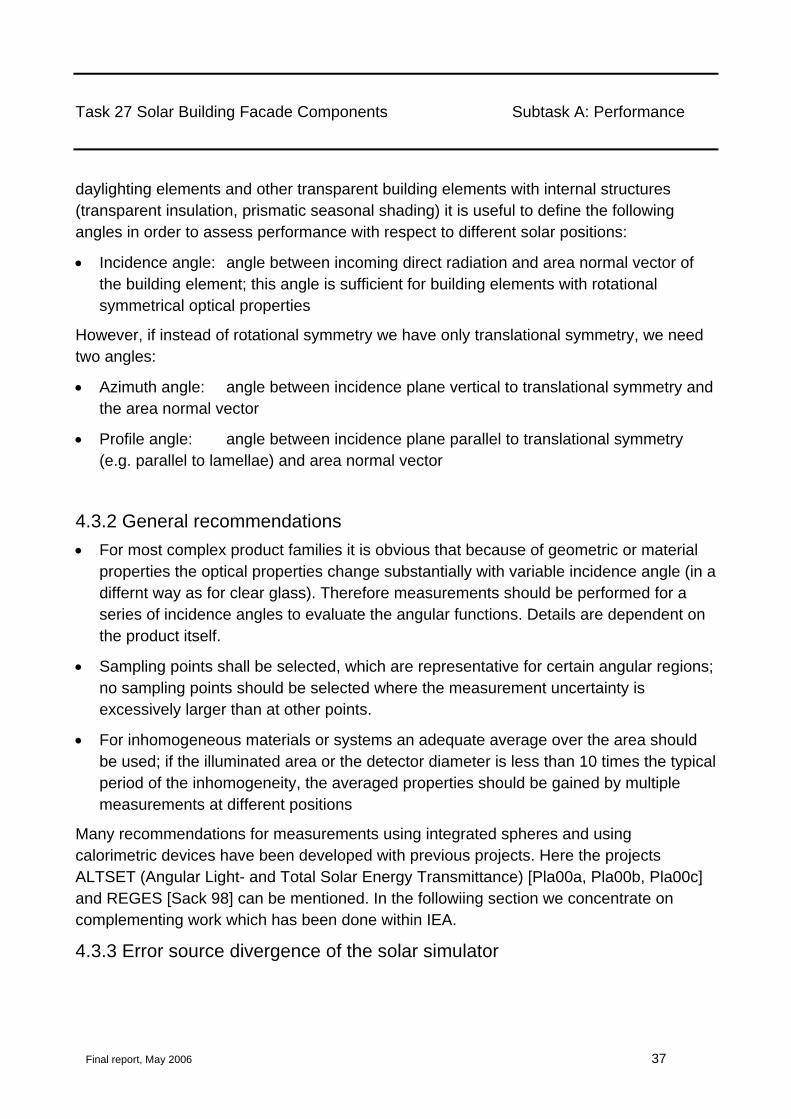
Task 27 Solar Building Facade Components Subtask A: Performance
Final report, May 2006 37
daylighting elements and other transparent building elements with internal structures (transparent insulation, prismatic seasonal shading) it is useful to define the following angles in order to assess performance with respect to different solar positions:
• Incidence angle: angle between incoming direct radiation and area normal vector of the building element; this angle is sufficient for building elements with rotational symmetrical optical properties
However, if instead of rotational symmetry we have only translational symmetry, we need two angles:
• Azimuth angle: angle between incidence plane vertical to translational symmetry and the area normal vector
• Profile angle: angle between incidence plane parallel to translational symmetry (e.g. parallel to lamellae) and area normal vector
4.3.2 General recommendations • For most complex product families it is obvious that because of geometric or material
properties the optical properties change substantially with variable incidence angle (in a differnt way as for clear glass). Therefore measurements should be performed for a series of incidence angles to evaluate the angular functions. Details are dependent on the product itself.
• Sampling points shall be selected, which are representative for certain angular regions; no sampling points should be selected where the measurement uncertainty is excessively larger than at other points.
• For inhomogeneous materials or systems an adequate average over the area should be used; if the illuminated area or the detector diameter is less than 10 times the typical period of the inhomogeneity, the averaged properties should be gained by multiple measurements at different positions
Many recommendations for measurements using integrated spheres and using calorimetric devices have been developed with previous projects. Here the projects ALTSET (Angular Light- and Total Solar Energy Transmittance) [Pla00a, Pla00b, Pla00c] and REGES [Sack 98] can be mentioned. In the followiing section we concentrate on complementing work which has been done within IEA.
4.3.3 Error source divergence of the solar simulator
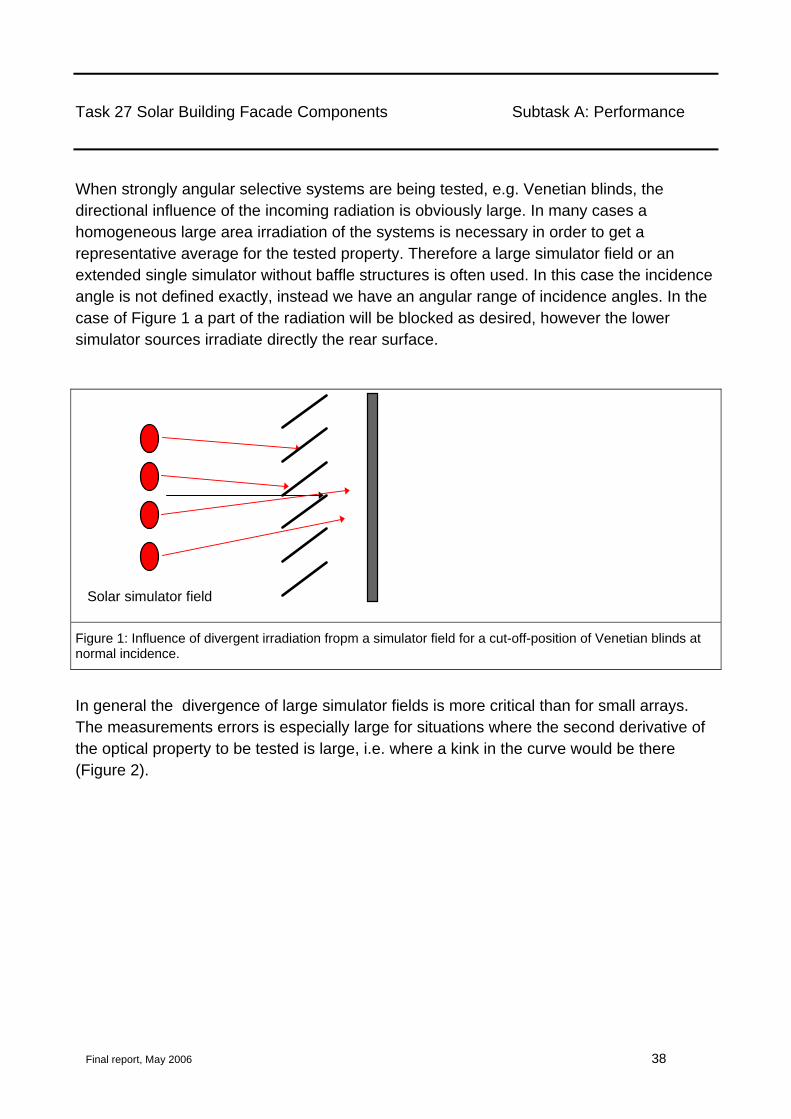
Task 27 Solar Building Facade Components Subtask A: Performance
Final report, May 2006 38
When strongly angular selective systems are being tested, e.g. Venetian blinds, the directional influence of the incoming radiation is obviously large. In many cases a homogeneous large area irradiation of the systems is necessary in order to get a representative average for the tested property. Therefore a large simulator field or an extended single simulator without baffle structures is often used. In this case the incidence angle is not defined exactly, instead we have an angular range of incidence angles. In the case of Figure 1 a part of the radiation will be blocked as desired, however the lower simulator sources irradiate directly the rear surface.
Solar simulator field
Figure 1: Influence of divergent irradiation fropm a simulator field for a cut-off-position of Venetian blinds at normal incidence.
In general the divergence of large simulator fields is more critical than for small arrays. The measurements errors is especially large for situations where the second derivative of the optical property to be tested is large, i.e. where a kink in the curve would be there (Figure 2).

Task 27 Solar Building Facade Components Subtask A: Performance
Final report, May 2006 39
θ θ+Δθθ−Δθ θ θ+Δθθ−Δθ θ θ+Δθθ−Δθ
a) b) c)
UNDERESTIMATION OVERESTIMATION
Figure 2: Situations where divergent light may cause critical errors in measurements
Fraunhofer ISE and ift Rosenheim have tried different ways to cope with the situation. ift Rosenheim did build a calibration panel with geometrical grid patterns on two baffles one behind the other. For ideal parallel radiation 50% of the light can be transmitted. Then the simulator was characterized by comparing the measured g-value with the calculated ideal value. The relative difference is a measure for the angular diverence of the simulator field.
Fraunhofer ISE did measure the luminance distribution of a simulator with an luminance measuring camera. A field then may be characterized by superposition of several distributions at different lamp positions. Using these two approaches the error for the calorimetric testing of solar protection device has been investigated.
0
0.05
0.1
0.15
0.2
0.25
0.3
0.35
-10 -5 0 5 10Profilwinkel [Grad]
norm
iert
e In
tens
ität [
-]
Figure 3: Measured normalized intensity of a simulator unit in the plane vertical to the light arc. (maximum due to arc, side maxima due to reflectors, distance of simulator to measurement plane as in experiment)

Task 27 Solar Building Facade Components Subtask A: Performance
Final report, May 2006 40
This figure shows the distribution in a plane which is relevant for horizontal lamellae systems. If the distance would be larger, the peaks would come closer together, but also intensity would decrease. Thus this is always a compromise. We now have to distinnguish between local and global measurements. For example at Fraunhofer ISE a solar calorimeter based on local heat flux plates exist whereas at ift Rosenheim the complete energy trasnmitted through the device is collected in a fluid calorimeter. Divergence is determined by the extension of source and detector area (only 12cm for a heat flux plate). Thus for the local measurement the divergence may be minimized more easily.
To assess the theoretical error the theoretical transmittance of lamellar blind systems has been calculated for ideal parallel light and solar simulator setups. As foreseen the effect of divergence is most detectable for angular intervalls where kinks are present (profile angle 0° and 40° in the example). The cut-off-angle of 42° is critical and should not be used for testing.
0.0
0.1
0.2
0.3
0.4
0.5
0.6
0.7
0.8
0 10 20 30 40 50 60
Profilwinkel [Grad]
g_to
tal [
-]
IdealSimulatorreihe2 Simulatorreihen
Figure 4: Ideal and real transmittance of white blind system (horizontal lamellae) for a solar simulator row (distance to sample 2.5m) and twoi simulator rows above each other (distance 4.5m)

Task 27 Solar Building Facade Components Subtask A: Performance
Final report, May 2006 41
-10%
-5%
0%
5%
10%
15%
20%
25%
30%
35%
40%
0 10 20 30 40 50 60
Profilwinkel [Grad]
Div
erge
nzfe
hler
[%]
weißer Raffstore mit WSV
grauer Raffstore mit WSV
Figure 5: Relative error of gtotal-for a heat mirror glazing plus exterior blind systems (different colours)
Measuring dark lamellae is more critical than white ones, also external lamellae systems have more pronounced kinks. One should say however, that the absolute errors are small in the cut-off region as the resulting transmittance usually is very low. For internal lamellar systems the errors are smaller because of the smoothing effect of the glazing. It should be emphasized that our results show already optimized simulator setups. For non-optimized simulator geometry the errors might exceed 100%.
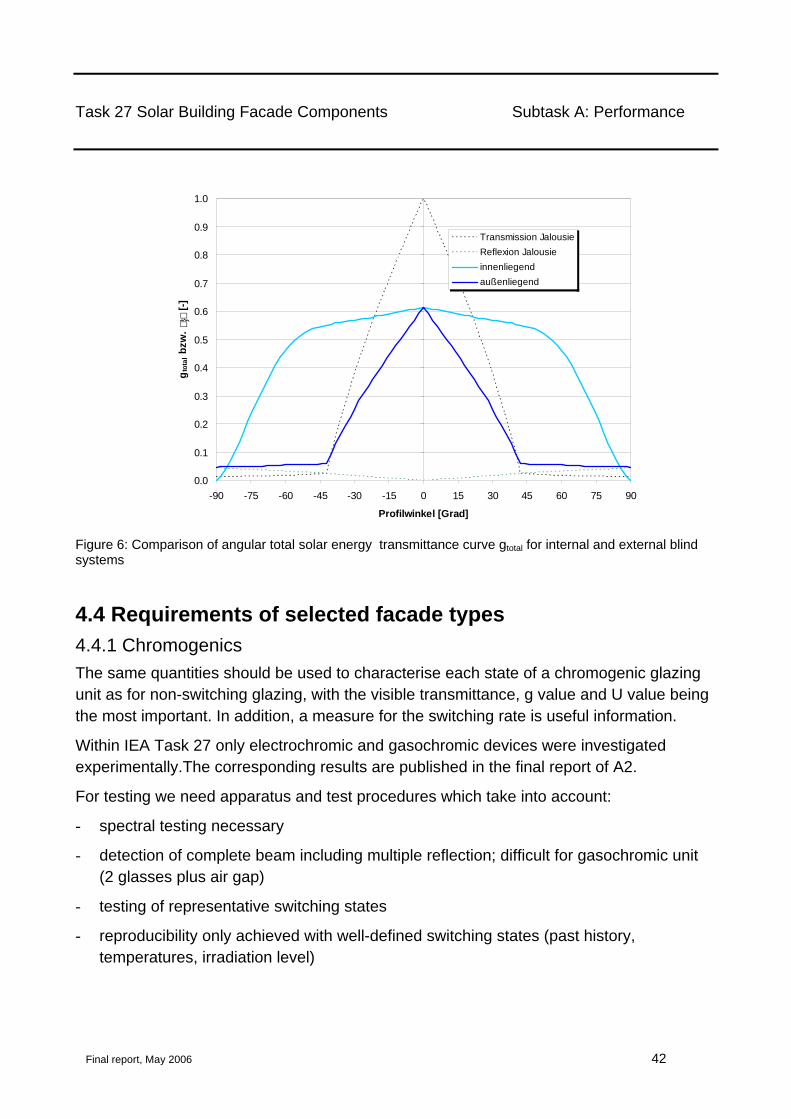
Task 27 Solar Building Facade Components Subtask A: Performance
Final report, May 2006 42
0.0
0.1
0.2
0.3
0.4
0.5
0.6
0.7
0.8
0.9
1.0
-90 -75 -60 -45 -30 -15 0 15 30 45 60 75 90
Profilwinkel [Grad]
g tot
al b
zw.
}[-]
Transmission JalousieReflexion Jalousieinnenliegendaußenliegend
Figure 6: Comparison of angular total solar energy transmittance curve gtotal for internal and external blind systems
4.4 Requirements of selected facade types 4.4.1 Chromogenics The same quantities should be used to characterise each state of a chromogenic glazing unit as for non-switching glazing, with the visible transmittance, g value and U value being the most important. In addition, a measure for the switching rate is useful information.
Within IEA Task 27 only electrochromic and gasochromic devices were investigated experimentally.The corresponding results are published in the final report of A2.
For testing we need apparatus and test procedures which take into account:
- spectral testing necessary
- detection of complete beam including multiple reflection; difficult for gasochromic unit (2 glasses plus air gap)
- testing of representative switching states
- reproducibility only achieved with well-defined switching states (past history, temperatures, irradiation level)

Task 27 Solar Building Facade Components Subtask A: Performance
Final report, May 2006 43
- precise control of switching parameter (e.g. temperature for thermotropic / thermochromic device, gas flow for gasochromic device)
- for phototropic or photochromic devices the testing itself may change the sampe state, therefore for spectral testing a white background illumination with high intensity compared to the probing light beam is recommended
- for scattering devices (e.g. thermotropic devices) internal lateral losses have to be considered (one solution is to use a broadarea illumination for testing with integrating spheres)
4.4.2 Shading devices Within the frame of IEA Task 27 several measurement campaigns were started using different types of solar protection systems in cooperation with industry. The following gives an overview of investigated devices:
4.4.2.1 External lamella-type solar protection • Three external blinds with identical complex lamella shape
• White, perforated white and dark brown lamellae
• 90 mm width, distance between lamellae 80mm
• combination with heat mirror glazing (coating Pos. 2, 16mm Argon), g=48%, U=1.3 W/(m2K)
Figure 7: Geometry of the external blind lamella
4.4.2.2 Interior solar and glare protection • White Venetian blind using 25mm wide lamellae, distance 22mm
• Light redirecting Venetian blind with mirror lamella

Task 27 Solar Building Facade Components Subtask A: Performance
Final report, May 2006 44
• textile roller-blind silver (exterior side) and white (interior side)
• combination with heat mirror glazing (16mm Argon), g=48%, U=1.3 W/(m2K)
• combination with heat mirror glazing (16mm Argon), g=35%, U=1.1 W/(m2K)
4.4.2.3 Integrated blind systems • White Venetian blind using 15mm wide lamellae, distance 13mm
• textile roller-blind light grey (both sides)
• integrated in heat mirror glazing (pos. 2, 27mm air), g=47%, U=1.5 W/(m2K)
• integrated in heat mirror glazing (pos. 2, 27mm air), g=32%, U=1.4 W/(m2K)
The corresponding results are published in the final report of A3.
For testing we need apparatus and test procedures which take into account:
- homogeneity of irradiation
- sufficiently large detector apertures for averaging over inhomogenous sample areas (for lamellae/slat devices at least over complete period of slats)
- divergence of solar simulator: a) minimization of divergence by linear arrangement of lamp field b) testing at save angles of incidence
- characterization of varying properties over product (e.g. tilt angle of slats)
- characterization of representative operating conditions (e.g. open, horizontal slats, cut-off-postion, maximally closed)
4.4.3 Transparent Insulation Material Transparent inuslation products generally incorporate rather thick light-diffusing or light-guiding structures within a glazing. Therefore for optical and thermal characterization the edge effects seemed to be important. Especially for the optical part the different approach was investigated.
No systematic testing of TI-structures was done within IEA Task 27, only some selected experiments were performed by EMPA/Switzerland in a case study. The corresponding results are published in the final report of A3.

Task 27 Solar Building Facade Components Subtask A: Performance
Final report, May 2006 45
Figure 8: Laterial transport of radiation in a TI-structure (honeycomb-type)
For testing we need apparatus and test procedures which take into account:
- lateral light transport through scattering or light-guiding structures ((one solution is to use a broadarea illumination for testing with integrating spheres)
- testing in central area
- reduction of transmittance at edges dependent on side case (reflecting vs. Absorbing, diffuse vs. specular)
- strong angular optical selectivity
- divergance of solar simulator may cause problems (e.g. honeycomb devices will concentrate divergent light to some extent)
- for themal tests (hot plate apparatus) the high infrared transmittance of some samples has to be considered (edge effects)
- thermal conductivity is not constant with material thickness (reason is semitransparent structure to thermal radiation)
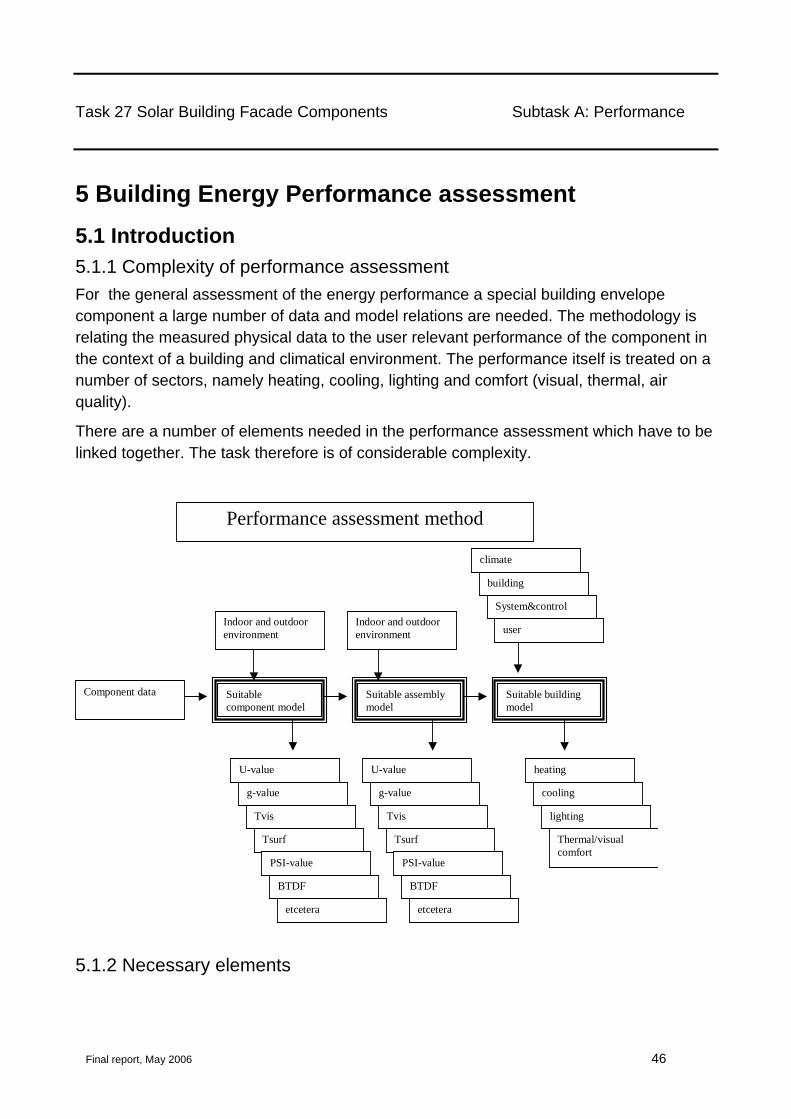
Task 27 Solar Building Facade Components Subtask A: Performance
Final report, May 2006 46
5 Building Energy Performance assessment 5.1 Introduction 5.1.1 Complexity of performance assessment For the general assessment of the energy performance a special building envelope component a large number of data and model relations are needed. The methodology is relating the measured physical data to the user relevant performance of the component in the context of a building and climatical environment. The performance itself is treated on a number of sectors, namely heating, cooling, lighting and comfort (visual, thermal, air quality).
There are a number of elements needed in the performance assessment which have to be linked together. The task therefore is of considerable complexity.
Component data Suitablecomponent model
Suitable assemblymodel
Suitable buildingmodel
Performance assessment method
heating
cooling
lighting
Thermal/visualcomfort
Indoor and outdoorenvironment user
building
climate
System&controlIndoor and outdoorenvironment
U-value
g-value
Tvis
Tsurf
PSI-value
BTDF
etcetera
U-value
g-value
Tvis
Tsurf
PSI-value
BTDF
etcetera
5.1.2 Necessary elements
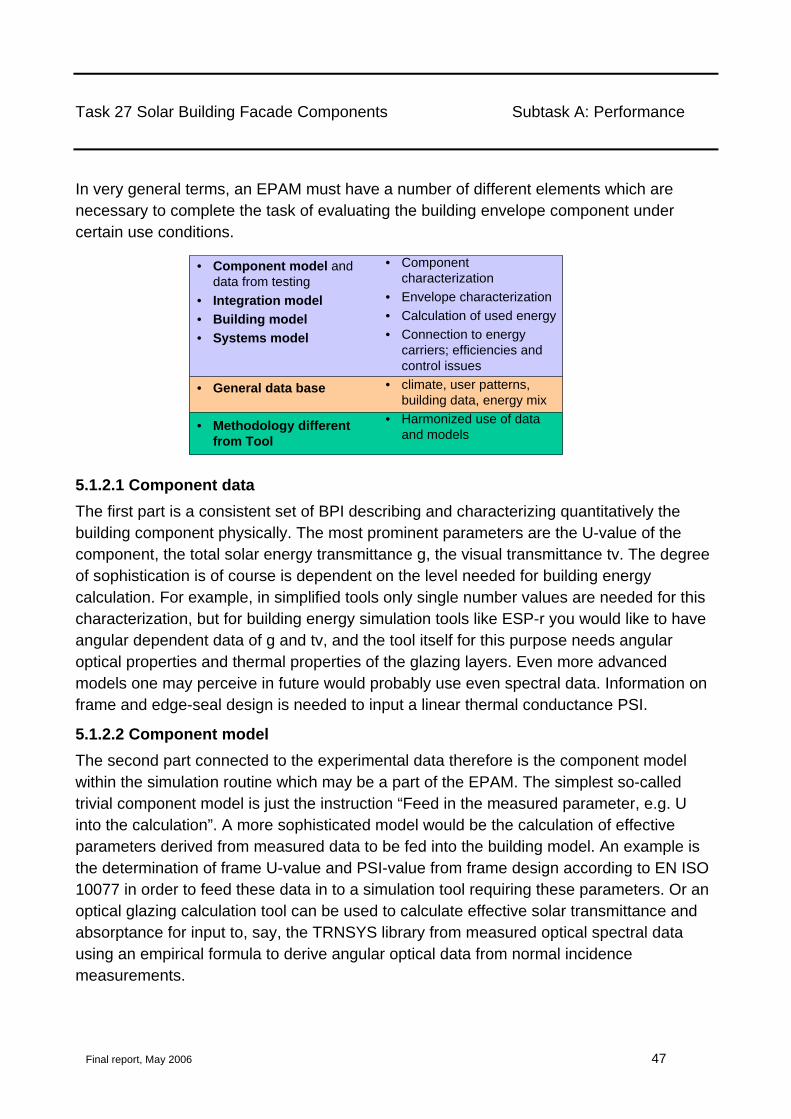
Task 27 Solar Building Facade Components Subtask A: Performance
Final report, May 2006 47
In very general terms, an EPAM must have a number of different elements which are necessary to complete the task of evaluating the building envelope component under certain use conditions.
• Componentcharacterization
• Envelope characterization• Calculation of used energy• Connection to energy
carriers; efficiencies andcontrol issues
• climate, user patterns,building data, energy mix
• Harmonized use of dataand models
• Component model anddata from testing
• Integration model• Building model• Systems model
• General data base
• Methodology differentfrom Tool
5.1.2.1 Component data The first part is a consistent set of BPI describing and characterizing quantitatively the building component physically. The most prominent parameters are the U-value of the component, the total solar energy transmittance g, the visual transmittance tv. The degree of sophistication is of course is dependent on the level needed for building energy calculation. For example, in simplified tools only single number values are needed for this characterization, but for building energy simulation tools like ESP-r you would like to have angular dependent data of g and tv, and the tool itself for this purpose needs angular optical properties and thermal properties of the glazing layers. Even more advanced models one may perceive in future would probably use even spectral data. Information on frame and edge-seal design is needed to input a linear thermal conductance PSI.
5.1.2.2 Component model The second part connected to the experimental data therefore is the component model within the simulation routine which may be a part of the EPAM. The simplest so-called trivial component model is just the instruction “Feed in the measured parameter, e.g. U into the calculation”. A more sophisticated model would be the calculation of effective parameters derived from measured data to be fed into the building model. An example is the determination of frame U-value and PSI-value from frame design according to EN ISO 10077 in order to feed these data in to a simulation tool requiring these parameters. Or an optical glazing calculation tool can be used to calculate effective solar transmittance and absorptance for input to, say, the TRNSYS library from measured optical spectral data using an empirical formula to derive angular optical data from normal incidence measurements.

Task 27 Solar Building Facade Components Subtask A: Performance
Final report, May 2006 48
5.1.2.3 Integration model The third part would be the integration and description of components like windows integrated into the building model. Questions of window-wall connections and shading by window apertures will be treated here. Even if in many cases a so-called trivial model again is employed here in many current energy performance calculations, one should be aware that even in very simplified tools empirical coefficients (e.g. relating TSET g and solar irradiation for solar gain calculation) are an implicit integration model.
5.1.2.4 Building model For calculation of the energy consumption we have to define the building including all the information about users, thermal zones, internal gains etc. This part is called the building model.
5.1.2.5 System model If we want to relate different energy use, e.g. heating by gas or oil and lighting by electricity, we have to introduce the system models. Here energy transport and conversion losses are detailed, and primary energy consumption is linked through this to the different end energy use.
5.1.2.6 General database For these different levels of models a general database is necessary, where data not related to the specific component under evaluation have to exist. Climatic data, building data, user patterns, system data, but even the energy-mix in a country relating electricity to primary energy consumption is needed. These data will be used the same for all assessments of building component energy performance assessment.
5.1.3 Specification of the application The performance assessment of a certain building envelope component needs a specification of a well-defined application. A component can be used in different kind of buildings, from single family houses to offices to industrial buildings. As the building envelope usually has a large number of functionalities, for example visual contact, energy conservation, wind protection, solar gain optimization, solar control etc., the importance of the individual component performance indicators can be very different from one application to another. But even for similar building types there exist cases where the optimum component are different for different design: For example the optimum choice of a glazing is dependent whether the building has a hole facade with small window fraction or whether the facade is completely glazed. In the first case the solar gain may be very importanct and positive, in the second it is likely that the excessive gains should be minimized. Therefore one has to specify the system context, the application for consideration.

Task 27 Solar Building Facade Components Subtask A: Performance
Final report, May 2006 49
The best choice of the owner or designer of a building is, of course, that the energy performance assessment will be worked out for the specific building considered. This evaluation is typically done during a building design process, under a number of time restrictions and other considerations. It needs the guide of an experienced design engineer supporting the architect very closely in order not to loose oversight over the many design options.
On the other hand, there is a need for a second kind of evaluation which necessariyl is less project specific. For a manufacturer designing or marketing a product it is important that the potential clients, the market can be convinced that the component is beneficial for many applications. A solution to this is to define in a way “typical cases” which are close enough to many potential clients. Although not all expectations can be met with one case, a very limited number may possibly cover a large part of the market.
A second use of such a typical case is the calculation of an energy performance for simpler building types such as one-family houses or row-houses. The energy performance might not be exactly the same for all such houses, but given a certain building standard and design not varying to much from the reference case, the energy gains and losses would not differ too much. In this market category it is believed that a kind of energy rating system is feasible. A proper chosen basic case could serve as the basis for this rating assessment.
A third aspect of the approach using typical cases is the teaching effect: Typical designs with proven energy benefits may be copied in similar houses. Also in such cases similar energy performance is expected, but of course one has to be cautious whether the important assumptions of the reference case are met.
5.1.3.1 Definition of “typical” buildings Within a general EPAM for building envelope components a definition of a “typical” building has to be given. As within the Task 27 mainly innovative components related to the use in office type buildings are considered, it was decided that a reference office should be defined within the project. The description of the office plus a number of so-called base case variations is the topic of a separate report.
The so-called base case variations have been defined in order to cover in a controlled manner the number of variations. Thus new office building with a large glazing fraction can be similarly treated as the renovation of an old building with small window area.
5.1.3.2 User patterns - control strategies In the same document is a number of assumptions listed connected to user patterns and control schemes, influencing the momentary gain and comfort situation, e.g. lighting needs
Task 27 Solar Building Facade Components Subtask A: Performance
Final report, May 2006 50
and ventilation of fresh air. This time schedules are taken from empirical investigations. It has to be born in mind that such patterns may differ to some extent from country to country. The Northern European office use does not include a Spanish siesta, for example.
5.1.4 Evaluation of case studies In the following short paragraph only a general idea of the evaluation of case studies using the reference office is given. The participant group did not try to standardise the approach here. Every participant did investigate different cases and also components, therefore the relevant questions and details were not identical. Nevertheless it is obvious that one may add more complexity and generality to results when coming from a simple comparison of cases (level 1) to a systematic study with many variations of relevant parameters (level2). Level 2 is not defined in a strict sense, as there are obviously several ways to increase complexity.
5.1.4.1 Level 1 evaluation Level 1 evaluation just considers a comparison of two nearly identical cases. The evaluation of a case study treating the energy performance of certain component should start with the simulation of the completely defined reference case. Then the building energy performance figures (e.g. heating energy) should be simulated in a second step when for the relevant building parts the typical component defined in the reference case is exchanged with the special component considered. For the reference office the performance in relation to a reference component is evaluated.
5.1.4.2 Level 2 evaluation A level 2 evaluation consists not only in a comparison of two cases with just the components exchange but in a complete series of such comparisons for all base case variations (e.g. several climates, building orientations). In some base case variations the ” innovative” component might give a worse performance than the “conventional” one, and in others the performance could be better.
5.2 Building Performance Indicators BPI 5.2.1 Energy performance The building energy performance is related to the following topics:
- Heating
- Cooling
- Lighting
Task 27 Solar Building Facade Components Subtask A: Performance
Final report, May 2006 51
- Visual comfort
- Thermal comfort
- Indoor air quality and ventilation
Whereas for the first three items building performance indicators BPI can be defined which are directly related to energy, the visual and thermal comfort may also be described by many indicators, however these do not directly relate to energy, they are called building performance criteria BPC. When we talk about heating and cooling, ventilation systems are typically included as systems to provide cooling or heating energy via air flow. Ventilation is however listed under indoor air quality, because this is the primary objective of an ventilation system to provide sufficient fresh air to the building.
As an example for BPC influencing the energy performance, daylight glare indicators may show us, that a certain building envelope is critical for visual comfort, and therefore glare or solar protection devices will be used to counteract that. This change in the building envelope then is reflected in a different energy performance for cooling and heating. One may say that comfort is the aim, and the energy performance indicators for heating, cooling and lighting show us, how energy-efficient the building envelope and the building technology is.
Concerning energy we distinguish between the following performance indicators, which generally can be defined for heating, cooling, ventilation (HVAC) and lighting. Therefore we generalize that with the term "service energy":
Table 1: Typical building performance indicators for a energy service with relation to the building envelope (heating, cooling, ventilation, lighting, hot water)
Description Symbol Unit
Yearly service energy per m2 floor area q’h MJ/m2a
Maximum service energy power per m2 floor area Q’max,h W/m2
Yearly primary energy needed for service E’p,h MJ/m2a
Yearly service energy per volume q’’h MJ/m3a
Maximum service energy power per volume Q’’max,h W/m3
Yearly primary energy needed for service E’’p,h MJ/m3a
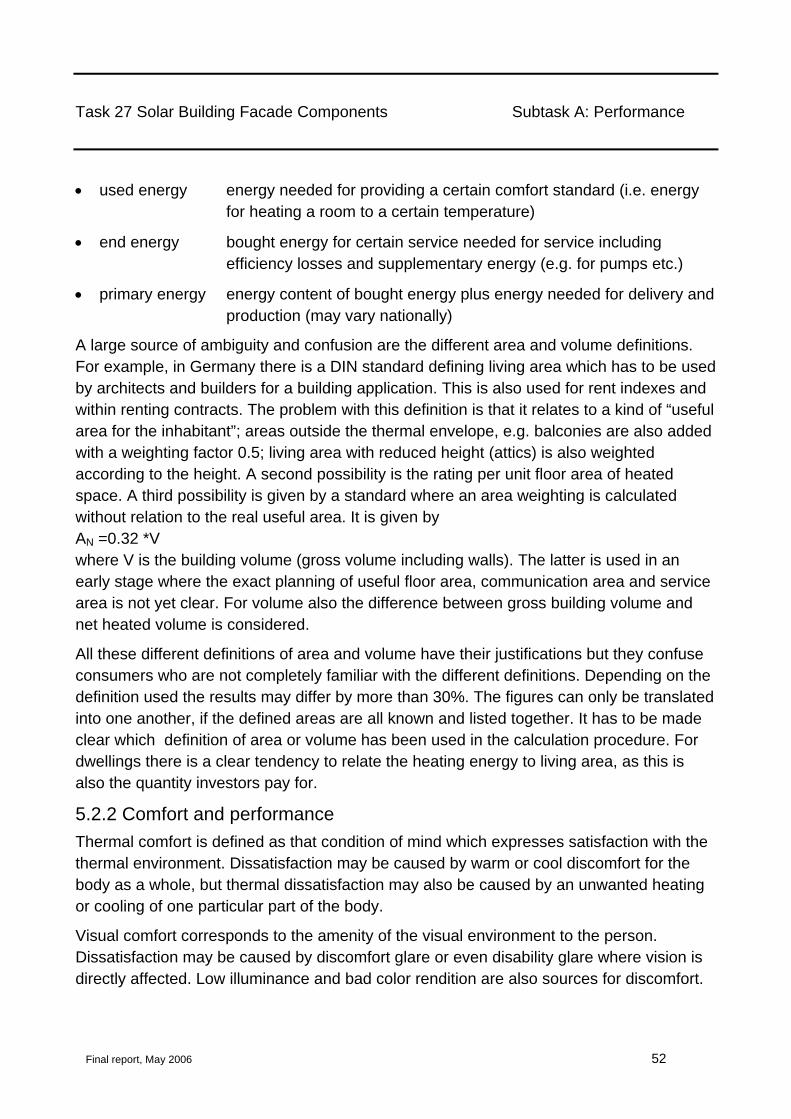
Task 27 Solar Building Facade Components Subtask A: Performance
Final report, May 2006 52
• used energy energy needed for providing a certain comfort standard (i.e. energy for heating a room to a certain temperature)
• end energy bought energy for certain service needed for service including efficiency losses and supplementary energy (e.g. for pumps etc.)
• primary energy energy content of bought energy plus energy needed for delivery and production (may vary nationally)
A large source of ambiguity and confusion are the different area and volume definitions. For example, in Germany there is a DIN standard defining living area which has to be used by architects and builders for a building application. This is also used for rent indexes and within renting contracts. The problem with this definition is that it relates to a kind of “useful area for the inhabitant”; areas outside the thermal envelope, e.g. balconies are also added with a weighting factor 0.5; living area with reduced height (attics) is also weighted according to the height. A second possibility is the rating per unit floor area of heated space. A third possibility is given by a standard where an area weighting is calculated without relation to the real useful area. It is given by AN =0.32 *V where V is the building volume (gross volume including walls). The latter is used in an early stage where the exact planning of useful floor area, communication area and service area is not yet clear. For volume also the difference between gross building volume and net heated volume is considered.
All these different definitions of area and volume have their justifications but they confuse consumers who are not completely familiar with the different definitions. Depending on the definition used the results may differ by more than 30%. The figures can only be translated into one another, if the defined areas are all known and listed together. It has to be made clear which definition of area or volume has been used in the calculation procedure. For dwellings there is a clear tendency to relate the heating energy to living area, as this is also the quantity investors pay for.
5.2.2 Comfort and performance Thermal comfort is defined as that condition of mind which expresses satisfaction with the thermal environment. Dissatisfaction may be caused by warm or cool discomfort for the body as a whole, but thermal dissatisfaction may also be caused by an unwanted heating or cooling of one particular part of the body.
Visual comfort corresponds to the amenity of the visual environment to the person. Dissatisfaction may be caused by discomfort glare or even disability glare where vision is directly affected. Low illuminance and bad color rendition are also sources for discomfort.

Task 27 Solar Building Facade Components Subtask A: Performance
Final report, May 2006 53
5.2.2.1 Thermal comfort All indicators are based on the assumption that thermal comfort can be predicted by considering 4 physical parameters : air temperature, air speed, mean radiant temperature, partial water vapour pressure, and 2 « personal » parameters : activity and clothing. Then considering that human body is a thermodynamic system, in thermal comfort conditions, the heat loss must be compensate by the metabolism heat production (without sweating or shivering)..
As indicators we distinguish gloabl indicators (effective temperature, operative temperatur, equivalent temperature, skin wettedness, predicted mean vote PMV, predicted percentage of dissatisfied PPD) and local indicators (radiant temperature asymmetry, air temperature differences between head and feet, ground temperature, draft (depending on the mean air speed, the turbulence intensity and the temperature of the air).
There are standards for themal comfort: ISO 7730 (1995), ASHRAE 55 (1992), DIN 1946 (1994).
We did see some possibilities to improve existing indicators, mainly by working on improved satisfaction tests, however, there was no specific problem associated with the complex building envelope components of our Task except one. This aspect, the thermal comfort under irradiation, was dealt with in some detail.
5.2.2.2 Thermal comfort temperature under irradiation Thermal comfort is an important issue in the indoor environment. The operative temperature is one of the main parameters that describe thermal comfort. The operative temperature is normally calculated as described Thermal comfort Analysis and applications in environmental engineering, P.O Fanger. In common practice today the operative temperature is measured and calculated for a location in the shade. Short wave radiation on the body due to the sun is not included. This paper proposes a method to include direct solar radiation in the evaluation of thermal comfort.
A south facing office located in Oslo was chosen for measurement of thermal comfort with different shading devices. The office was equipped for one person and a 100 W heater simulated the person. The work place in the office is shown in Figure 9. An operative temperature sensor is located at the desk in front of the PC. This location is close to where the person is located. In the back of the room where there is no sun we both measure the air and the operative temperature.
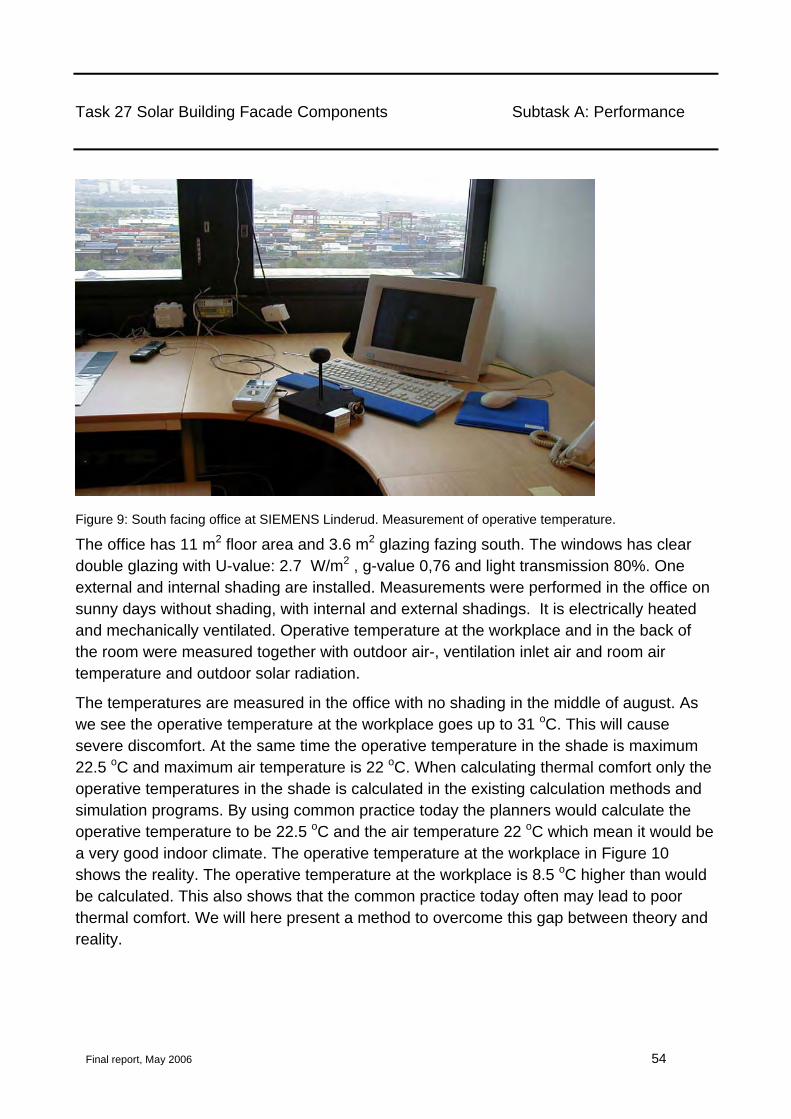
Task 27 Solar Building Facade Components Subtask A: Performance
Final report, May 2006 54
Figure 9: South facing office at SIEMENS Linderud. Measurement of operative temperature.
The office has 11 m2 floor area and 3.6 m2 glazing fazing south. The windows has clear double glazing with U-value: 2.7 W/m2 , g-value 0,76 and light transmission 80%. One external and internal shading are installed. Measurements were performed in the office on sunny days without shading, with internal and external shadings. It is electrically heated and mechanically ventilated. Operative temperature at the workplace and in the back of the room were measured together with outdoor air-, ventilation inlet air and room air temperature and outdoor solar radiation.
The temperatures are measured in the office with no shading in the middle of august. As we see the operative temperature at the workplace goes up to 31 oC. This will cause severe discomfort. At the same time the operative temperature in the shade is maximum 22.5 oC and maximum air temperature is 22 oC. When calculating thermal comfort only the operative temperatures in the shade is calculated in the existing calculation methods and simulation programs. By using common practice today the planners would calculate the operative temperature to be 22.5 oC and the air temperature 22 oC which mean it would be a very good indoor climate. The operative temperature at the workplace in Figure 10 shows the reality. The operative temperature at the workplace is 8.5 oC higher than would be calculated. This also shows that the common practice today often may lead to poor thermal comfort. We will here present a method to overcome this gap between theory and reality.

Task 27 Solar Building Facade Components Subtask A: Performance
Final report, May 2006 55
Tem perature in south facing office at SIEMENS Linderud 12.08.00, Sun, No shading
0,00
5,00
10,00
15,00
20,00
25,00
30,00
35,00
0 1 2 3 4 5 6 7 8 9 10 11 12 13 14 15 16 17 18 19 20 21 22 23 24Time,h
Room tem peratureSupply air tem peratureOutdoor air tem peratureOperative tem perature in the sunOperative tem perature in the shade
Figure 10: Temperatures in the office with no shading.
Temperatures in south facing office at SIEMENS Linderud 09.09.00Sun, Outdoor blinds lamellae 45 o
0,00
5,00
10,00
15,00
20,00
25,00
30,00
35,00
0 5 10 15 20
Time, h
Room temperatureSupply air temperatureOutdoor air temperatureOperative temperature in the sunOperative temperature in the shade
Figure 11: Temperatures in the office with outdoor shading with slats at 45 o
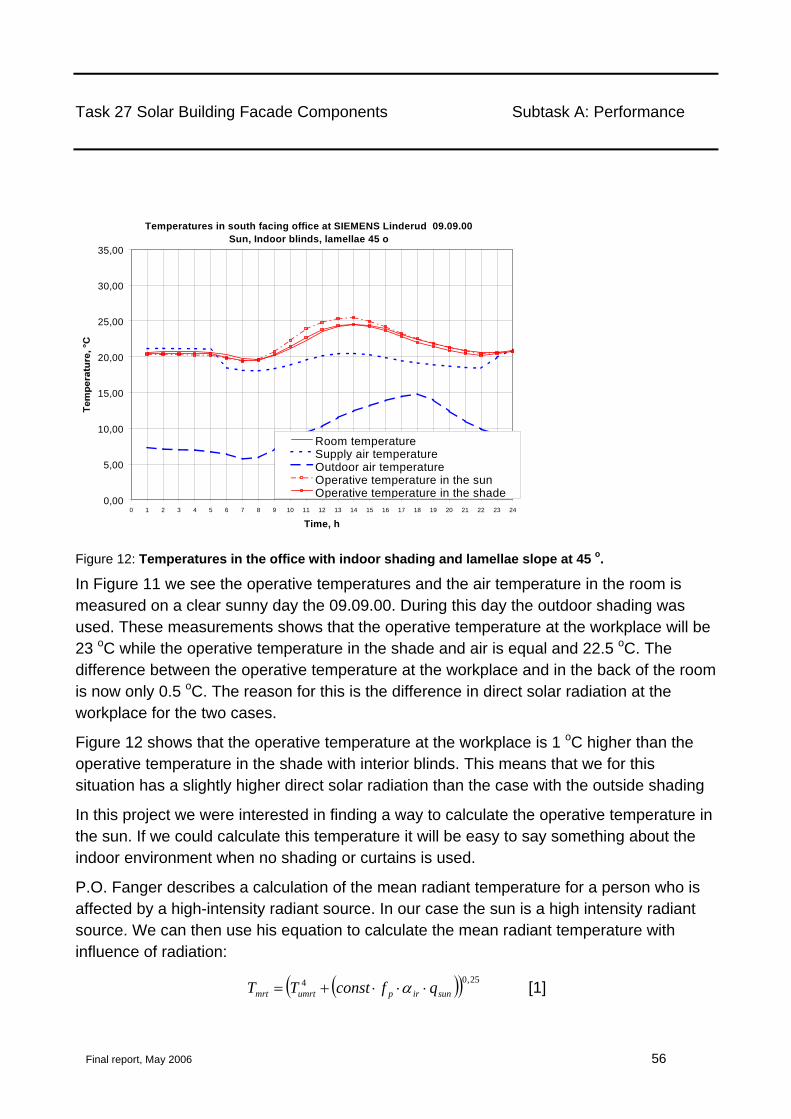
Task 27 Solar Building Facade Components Subtask A: Performance
Final report, May 2006 56
Temperatures in south facing office at SIEMENS Linderud 09.09.00Sun, Indoor blinds, lamellae 45 o
0,00
5,00
10,00
15,00
20,00
25,00
30,00
35,00
0 1 2 3 4 5 6 7 8 9 10 11 12 13 14 15 16 17 18 19 20 21 22 23 24
Time, h
Room temperatureSupply air temperatureOutdoor air temperatureOperative temperature in the sunOperative temperature in the shade
Figure 12: Temperatures in the office with indoor shading and lamellae slope at 45 o.
In Figure 11 we see the operative temperatures and the air temperature in the room is measured on a clear sunny day the 09.09.00. During this day the outdoor shading was used. These measurements shows that the operative temperature at the workplace will be 23 oC while the operative temperature in the shade and air is equal and 22.5 oC. The difference between the operative temperature at the workplace and in the back of the room is now only 0.5 oC. The reason for this is the difference in direct solar radiation at the workplace for the two cases.
Figure 12 shows that the operative temperature at the workplace is 1 oC higher than the operative temperature in the shade with interior blinds. This means that we for this situation has a slightly higher direct solar radiation than the case with the outside shading
In this project we were interested in finding a way to calculate the operative temperature in the sun. If we could calculate this temperature it will be easy to say something about the indoor environment when no shading or curtains is used.
P.O. Fanger describes a calculation of the mean radiant temperature for a person who is affected by a high-intensity radiant source. In our case the sun is a high intensity radiant source. We can then use his equation to calculate the mean radiant temperature with influence of radiation:
( )( ) 25,04sunirpumrtmrt qfconstTT ⋅⋅⋅+= α [1]

Task 27 Solar Building Facade Components Subtask A: Performance
Final report, May 2006 57
where,
Tmrt – total mean radiation temperature included sun radiation [K]
Tumrt – radiation temperature without sun contribution [K]
const – 1/(0,97*σ)
σ – 5.67*10-8, Stephan Boltzmans constant [W/m²°C4]
fp – projected area factor
α – Absorption factor
qsun can be found like this:
kh
sunIq αθsin
= [2]
where
Ih – Global horizontal radiation [W/m²]
θ – Angel of incidence [°]
αi – shade factor or direct solar transmittance
When the mean radiation temperature is found, tmrt is used to calculate the operative temperature in the sun, by using this relation:
2mrta
optsunttt +
= [3]
where,
ta – ambient air temperature [°C]
Equation [3] is valid when the air velocity is below 0,4 m/s and when the mean radiation temperature is below 50°C.
5.2.2.3 Visual comfort Visual comfort designates the lighting quality regarding e.g. illuminance, eliminating glare and colour rendition.

Task 27 Solar Building Facade Components Subtask A: Performance
Final report, May 2006 58
Glare indices (e.g. DGI daylight glare index1, CGI CIE glare index2) are common numbers to qualify glare situations, however the well known indices are in discussion. Most of the existing glare indices use a so-called „standard observer“. However large variations are found when assessing different individuals. In addition the majority of these equations are developed for the evaluation of discomfort glare from small artificial light sources, whereas windows and facades are usually rather large glare sources. Non-uniform sources such as sunlit venetian blinds also cannot be correctly characterized.
Direct glare from the facade (-> discomfort glare) may be considered by using the daylight glare probability DGP. This is a new approach. The DGP does not take into account reflection glare on computer screens, only the discomfort glare caused by the facade. It is derived from user assessments doing a visual task using computer screens. 3
5.2.3 Primary energy and CO2 emissions The energy performance of buildings is actually dependent on the energy system of the country in which the building is operated. Different countries utilize different energy sources for producing electricity. For example in Norway or Austria most electricity is produced by water power stations whereas in many other countries thermal power generation from gas, coal or nuclear is used. In the thermal generation the losses of the process are appreciable. Therefore for one kWh electricity several kWh of primary energy have to be used. Distribution losses, transport and mining, are additional factors which add a energy backpack on top of the final energy delivered by the grid to the producer. Radioactive fuel, as, oil and coal produced also different amounts of CO2 due to the chemical compositions (C- and H-atoms in the fuel) and the energy needed for mining and refining them. Furtheron the power stations have, depending on type and age, different efficiencies and CO2 emissions. In the German software GEMIS 4.1 factors for energy productions are given on a national basis as well as CO2 and other emissions produced. We give in the following table these numbers a selection of countries. As a basis year the year 2000 was chosen because there was a common data basis for all countries available. In some countries the energy mix of electricity production has changed since then appreciably.
1 Hopkinson R.G., „Glare from faylighting in buildings“, Applied Ergonomics Vol. 3 No. 4 (1972) 2 CIE, Discomfort Glare of the Interior Lighting, CIE Technical committee TC-3, Vienna (1992) 3 J. Wienold, J. Christioffersen, „Towards a new daylighting glare rating“, Proceedings Lux Europe 2005, Berlin (2005)

Task 27 Solar Building Facade Components Subtask A: Performance
Final report, May 2006 59
Table 2: Primary energy factors and CO2-emissions for national electricity (year 2000)4
Country Primary energy factor
[kWh/kWhel]
CO2-emissions [g/kWhel]
SO2-emissions [g/kWhel]
NOx-emissions [g/kWhel]
AT 1.69 239.8 0.279 0.656
CH 2.06 40.5 0.053 0.146
D 2.90 626.9 0.381 0.629
DK 2.56 681.1 0.588 0.946
ES 2.59 492.4 3.488 1.796
FIN 3.36 403.4 0.762 1.146
FR 3.32 108.3 0.282 0.347
I 2.31 564.5 3.282 1.702
NL 2.69 618.5 0.529 1.413
NOR 1.04 14.5 0.012 0.041
PL 2.70 1020.2 8.835 3.019
SWE 2.17 75.9 0.378 0.242
UK 2.66 558.4 1.853 1.821
CAN 1.80 265.9 0.303 0.703
US 2.94 718.9 0.744 2.265
EU-25 2.81 485.9 1.914 1.199 What is the consequence for the building? Depending on the primary energy factor of the electricity production and the effencies of building systems, other technologies might be favourable in different countries. For example, electrical heat pumps very often are favoured in Switzerland or Sweden, which is reasonable even for average COPs. In a country like Germany (D) where a lot of coal, gas and also nuclear is used for the production of electricity, it is often more environmentally useful and moreover more economical to use gas and oil directly for heating in a highly efficient heating system. These arguments may be checked in detail for energyl performance of buildings, usually it is of minor importance when the energy performance of building envelope elements has to be assessed. However some influence is easily visible. Building facades influencing daylight, cooling and heating demands of the building may be optimized in a different way, 4 Global Emission Model for Integrated Systems, version 4.3, www.gemis.de

Task 27 Solar Building Facade Components Subtask A: Performance
Final report, May 2006 60
when in one country due to a high primary energy factor of electricity the use of electricity is more prohibitive than in others. Then the elements will be optimized more with respect to daylight and cooling than with respect to heating. Of course, these variations are overruled by climatical factors, but still they exist and should be listed in an complete general performance methodology.
5.3 Simulation 5.3.1 Reference office To get representative data for heating, cooling and lighting energy, a so called reference office has been defined in cooperation with the European project SWIFT (see www.eu-swift.de). In a series of documents all relevant information was specified. Building geometry, construction and building materials, HVAC-system and user schedules were given. Also meteorological data (temperature and irradiation) have been selected and distributed.This reference office is developed to represent a typical central European office with average technical equipment (internal loads), and describes two cell offices separated by a corridor cut out of a larger building. The base case considered here describes a hole in the wall façade. Well-defined variants allow also the investigation of other façades, e.g. completely glazed offices. Figure 13 to Figure 16 show schematically the office configuration.
Figure 13: Reference office building

Task 27 Solar Building Facade Components Subtask A: Performance
Final report, May 2006 61
Office modules
Corridor
staircase& ser-vice spaces
Corridor
Figure 14: Plan of one storey
Usually it is sufficient to simulate a representative office slice taken from the center of the building (if no extreme situations like building corners are to be investigated). Then a double office with a corridor in between can be used. The walls to neighbouring zones are considered as adiabatic.
5.40 m
0.10 m
2.70 m
0.434 m
0.23 m
0.02 m
0.65 m
3.60 m
Plenum withsuspended ceiling
corridorOffice room
Figure 15: Cross section of office

Task 27 Solar Building Facade Components Subtask A: Performance
Final report, May 2006 62
1.10 m
0.10 m
0.80 m
3.50 m
0.10 m
0.40 m1.20 m 1.20 m
0.50 m
0.15 m 0.15 m
2.70 m
Figure 16: Front view of office façade
There is one reference case consisting of specifications for:
- Location
- Orientation
- Building geometry
- Zoning
- Material
- Thermal insulation
- HVAC and control
- Facade
- Occupants
However, one reference case would only satisfy the need of sensitivity studies. Therefore to avoid a wild-growth in variations on the reference case a number of base case variations are (or have to be) defined as well.
Task 27 Solar Building Facade Components Subtask A: Performance
Final report, May 2006 63
Base case variations refer to (underlined = reference case):
- Location (cold, moderate and warm climate)
- Orientation (East-West, North-South)
- Zoning (separate office modules, open office space)
- Material (heavy weight, lightweight)
- Thermal insulation (badly insulated, moderately insulated, heavily insulated, superinsulated)
- HVAC and control (reference, open for other systems)
- Façade (window hole façade with glazing fraction 30%, 50%, 70%; climate façade glazing fraction 85%, double skin facade)
- Occupants (ref.. occupation profile, may be extended to other profile)
- Internal gains (constant base+occupancy dependent profile)
- Solar protection (none, internal light grey blinds, external dark blinds)
- Glazing/windows (wooden frame, double glazing, double low e glazing, double solar control glazing)
Using this set of data in combination with material, construction and weather data we could define simuilations studies where participants worked with the same cases.
5.3.2 Reference data and output 5.3.2.1 Construction data For all building elements such as walls, windows, doors, floors material data and construction details have been defined. For the construction layer the following data have been used:
Layer thickness d (m),
Thermal conductivity λ (W/(m.K)) Thermal resistance R (m2K/W)
Specific mass ρm (kg/m3) Specific heat capacity Cp (J/(kg.K))

Task 27 Solar Building Facade Components Subtask A: Performance
Final report, May 2006 64
A typical example is given in the next paragraph for an opaque part of facade (insulated wall):
d λ R ρm Cp
Outside
Exterior finish 0.010 1.000 0.010 2500 720
Mineral wool 0.120 0.040 3.000 50 1030
Limestone 0.210 2.500 0.084 2000 870
Interior finish 0.015 0.25 0.060 900 1050
Inside
Total 0.355 3.154
5.3.2.2 Use profile data But also schedules of lighting, ventilation, heating and cooling set points were chosen according to typical use pattern.
0
20
40
60
80
100
120
140
160
180
200
0 24 48 72 96 120 144
Wochenstunde [h]
Inne
re W
ärm
eque
llen
[W]
Geräte permanentGeräte ArbeitszeitBeleuchtungPersonen
Figure 17: Internal heat gains for an office room (weekend : hour 96-143)

Task 27 Solar Building Facade Components Subtask A: Performance
Final report, May 2006 65
10
15
20
25
30
35
0 24 48 72 96 120 144
Wochenstunde [h]
Sollw
erte
[°C
]
Sollwert Heizung
Sollwert Kühlung
Figure 18: Change of setpoint temperature during a week
10
20
30
40
50
60
70
80
0 24 48 72 96 120 144
Wochenstunde [h]
Lüftu
ngsr
aten
[m3/
h]
Lüftungsanlage
Fugenlüftung
Figure 19: Change of ventilation rate due to infiltration and ventilation equipment during a week

Task 27 Solar Building Facade Components Subtask A: Performance
Final report, May 2006 66
The simulation with a building simulation tool such as TRNSYS uses the variable boundary conditions and schedules and simulates dynamically the temperature evolvement and energy flows on a hourly basis. The simulation starts in the year with day 1, a monday. This should be taken into account when monthly sums are considered.
5.3.2.3 Climatic data Simulations were proposed for three different climates Rome (cooling dominated), Stockholm (heating dominated) and Brussels (intermediate). The hourly data for irradiation and temperature were generated using the METEONORM 3.0 program. Depending on the sky distribution model one might get from the same horizontal data different results for vertical irradiation. As a reference and also for further use in monthly simplified calculation tools we generated vertical irradiance data for the main orientations using the TRNSYS tool with the Perez sky model option. The data are shown in the next figures.
0
10
20
30
40
50
60
70
80
90
100
1 2 3 4 5 6 7 8 9 10 11 12
Eins
trahl
ungs
sum
me
[kW
h/m
2]
0
2
4
6
8
10
12
14
16
18
20
Auß
ente
mpe
ratu
r [°C
]
OstSüdWestNordTa °C
Figure 20: Data Brussels
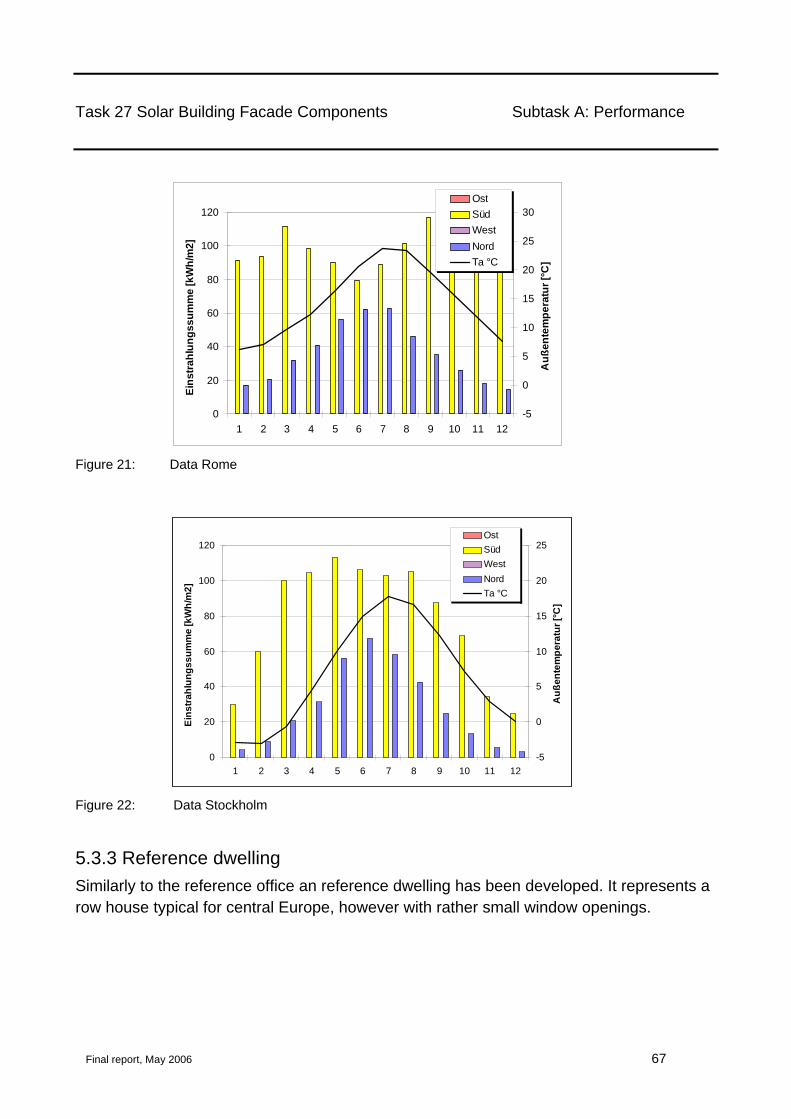
Task 27 Solar Building Facade Components Subtask A: Performance
Final report, May 2006 67
0
20
40
60
80
100
120
1 2 3 4 5 6 7 8 9 10 11 12
Eins
trah
lung
ssum
me
[kW
h/m
2]
-5
0
5
10
15
20
25
30
Auß
ente
mpe
ratu
r [°C
]
OstSüdWestNordTa °C
Figure 21: Data Rome
0
20
40
60
80
100
120
1 2 3 4 5 6 7 8 9 10 11 12
Eins
trahl
ungs
sum
me
[kW
h/m
2]
-5
0
5
10
15
20
25A
ußen
tem
pera
tur [
°C]
OstSüdWestNordTa °C
Figure 22: Data Stockholm
5.3.3 Reference dwelling Similarly to the reference office an reference dwelling has been developed. It represents a row house typical for central Europe, however with rather small window openings.
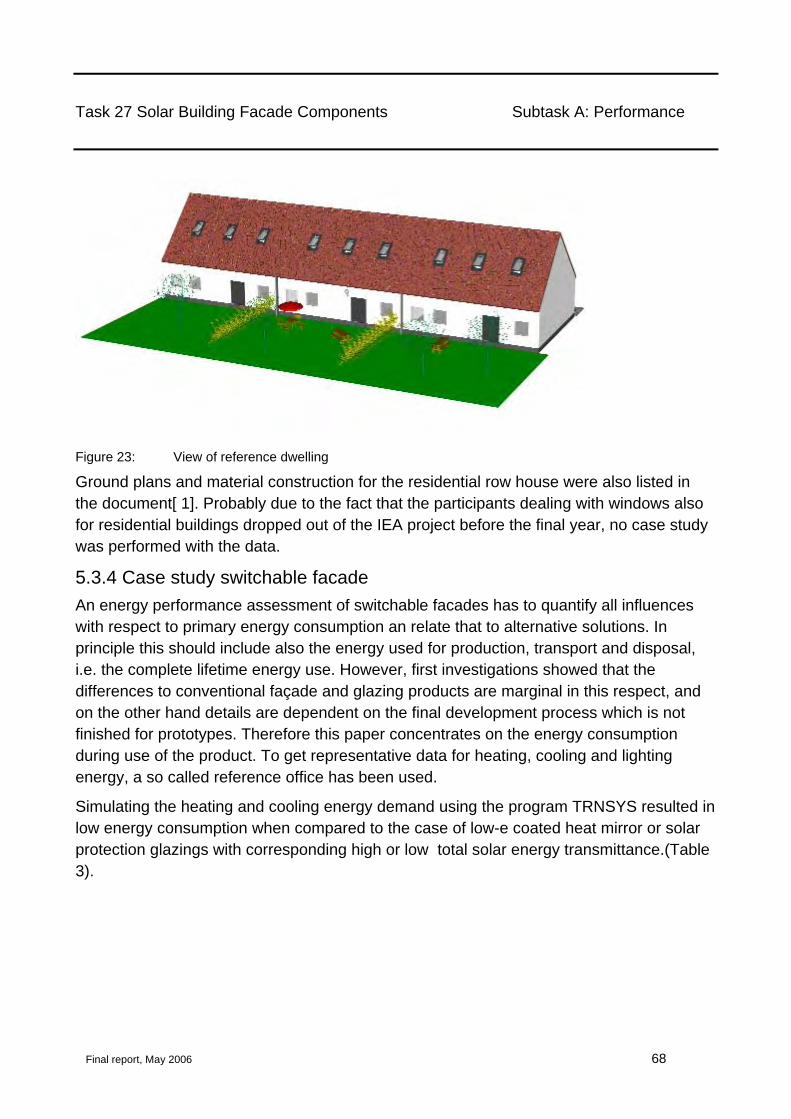
Task 27 Solar Building Facade Components Subtask A: Performance
Final report, May 2006 68
Figure 23: View of reference dwelling
Ground plans and material construction for the residential row house were also listed in the document[ 1]. Probably due to the fact that the participants dealing with windows also for residential buildings dropped out of the IEA project before the final year, no case study was performed with the data.
5.3.4 Case study switchable facade An energy performance assessment of switchable facades has to quantify all influences with respect to primary energy consumption an relate that to alternative solutions. In principle this should include also the energy used for production, transport and disposal, i.e. the complete lifetime energy use. However, first investigations showed that the differences to conventional façade and glazing products are marginal in this respect, and on the other hand details are dependent on the final development process which is not finished for prototypes. Therefore this paper concentrates on the energy consumption during use of the product. To get representative data for heating, cooling and lighting energy, a so called reference office has been used.
Simulating the heating and cooling energy demand using the program TRNSYS resulted in low energy consumption when compared to the case of low-e coated heat mirror or solar protection glazings with corresponding high or low total solar energy transmittance.(Table 3).
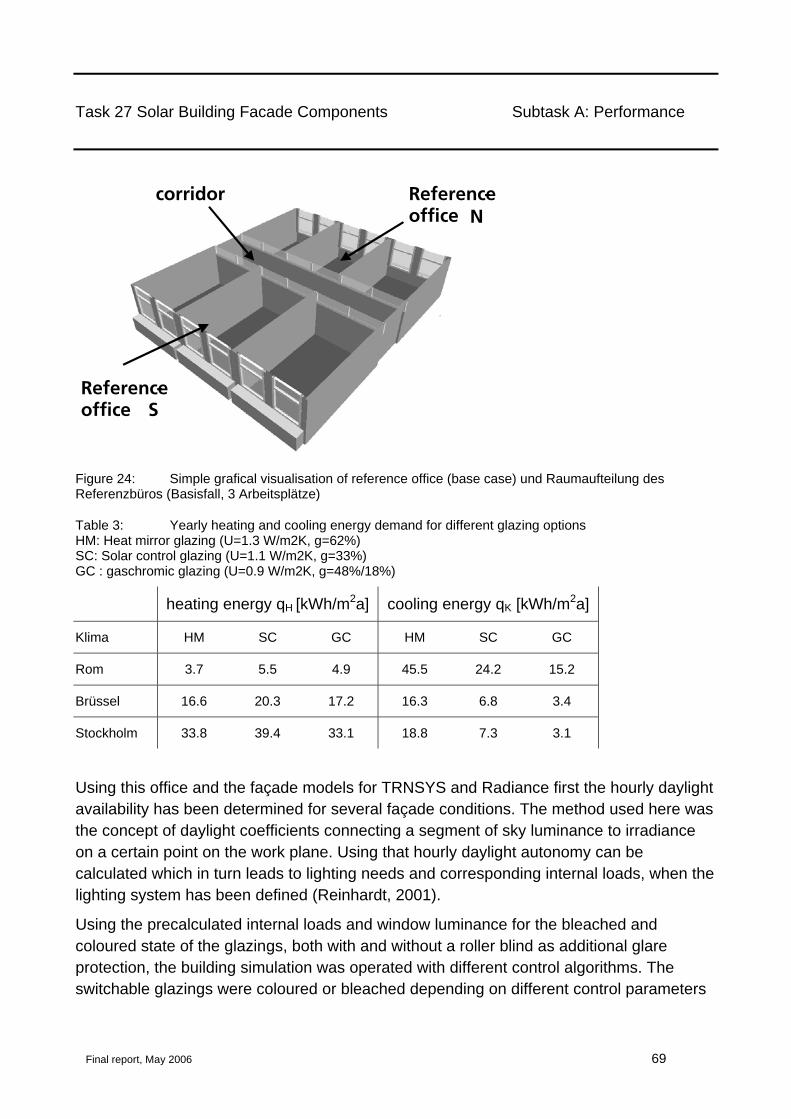
Task 27 Solar Building Facade Components Subtask A: Performance
Final report, May 2006 69
corridor
Reference-office S
Reference-office N
Figure 24: Simple grafical visualisation of reference office (base case) und Raumaufteilung des Referenzbüros (Basisfall, 3 Arbeitsplätze)
Table 3: Yearly heating and cooling energy demand for different glazing options HM: Heat mirror glazing (U=1.3 W/m2K, g=62%) SC: Solar control glazing (U=1.1 W/m2K, g=33%) GC : gaschromic glazing (U=0.9 W/m2K, g=48%/18%)
heating energy qH [kWh/m2a] cooling energy qK [kWh/m2a]
Klima HM SC GC HM SC GC
Rom 3.7 5.5 4.9 45.5 24.2 15.2
Brüssel 16.6 20.3 17.2 16.3 6.8 3.4
Stockholm 33.8 39.4 33.1 18.8 7.3 3.1
Using this office and the façade models for TRNSYS and Radiance first the hourly daylight availability has been determined for several façade conditions. The method used here was the concept of daylight coefficients connecting a segment of sky luminance to irradiance on a certain point on the work plane. Using that hourly daylight autonomy can be calculated which in turn leads to lighting needs and corresponding internal loads, when the lighting system has been defined (Reinhardt, 2001).
Using the precalculated internal loads and window luminance for the bleached and coloured state of the glazings, both with and without a roller blind as additional glare protection, the building simulation was operated with different control algorithms. The switchable glazings were coloured or bleached depending on different control parameters

Task 27 Solar Building Facade Components Subtask A: Performance
Final report, May 2006 70
like room temperature, irradiance on the vertical façade or window luminance. Depending on the glare conditions, in addition the internal roller blind was operated assuming that it had no influence on solar gains. Reading optionally internal loads from four different files thus guaranteed that the actual loads corresponding to the daylight and lighting conditions were used. This coupling of daylighting and energy simulations seems to be necessary to optimize control strategies for switchable systems.
0
10
20
30
40
50
60
70
20 21 22 23 24 25 26
critical room temperature [°C]
spec
ific
prim
ary
ener
gy d
eman
d [k
Wh/
(m2a
)]
heating coolinglighting total
Figure 25: Primary energy consumption for the case of a gasochromic facade, reference office, Brussels, South-North orientation, switching according to room temperature set point (minimum consumption for 24°C set point)
When the control strategies were optimized it could be shown that the switching according to room temperature would be the most energy efficient (Figure 8). Switching should occur about 2 degrees below the cooling set point Figure 7). However, because we assume that a user would manually operate a system according to visual comfort, i.e. glare, and glare from the direct sun cannot be reduced sufficiently, manually operable blinds are recommended for that case.
However, if automatically the façade would be operated using vertical irradiance or glare as switching criterium, only 10% increase in primary energy consumption (due to higher cooling loads) would result.
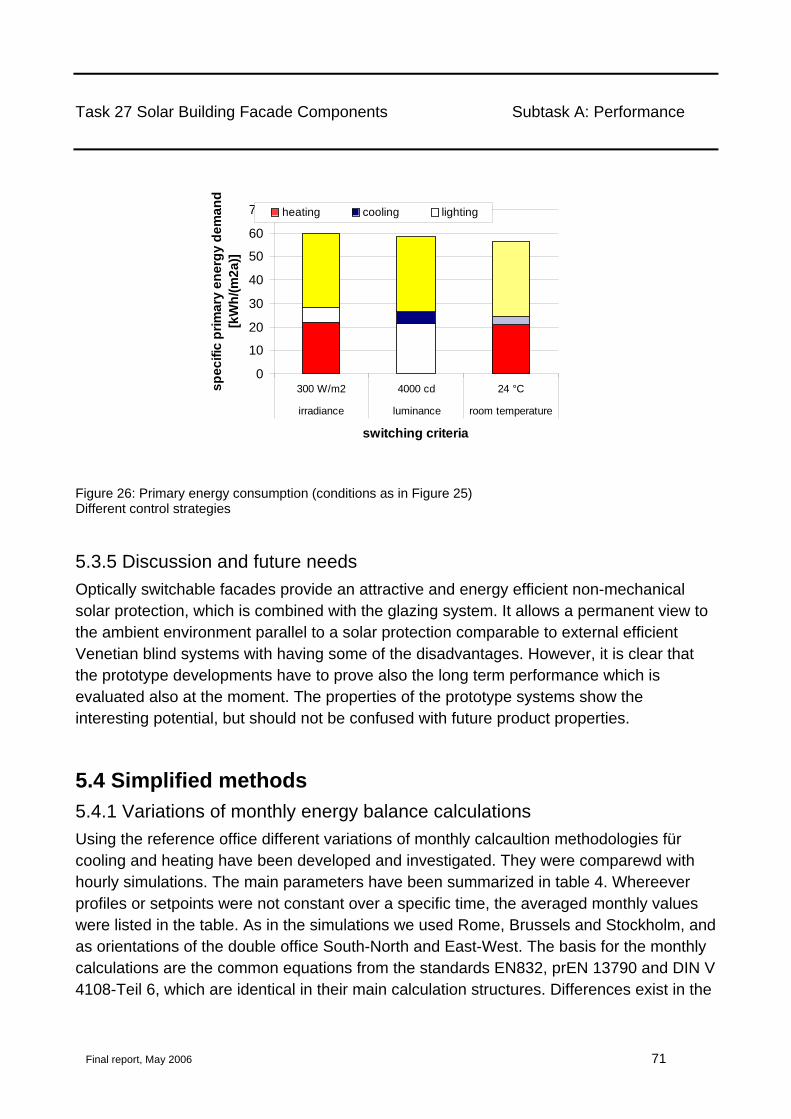
Task 27 Solar Building Facade Components Subtask A: Performance
Final report, May 2006 71
0
10
20
30
40
50
60
70
300 W/m2 4000 cd 24 °C
irradiance luminance room temperature
switching criteria
spec
ific
prim
ary
ener
gy d
eman
d [k
Wh/
(m2a
)]heating cooling lighting
Figure 26: Primary energy consumption (conditions as in Figure 25) Different control strategies
5.3.5 Discussion and future needs Optically switchable facades provide an attractive and energy efficient non-mechanical solar protection, which is combined with the glazing system. It allows a permanent view to the ambient environment parallel to a solar protection comparable to external efficient Venetian blind systems with having some of the disadvantages. However, it is clear that the prototype developments have to prove also the long term performance which is evaluated also at the moment. The properties of the prototype systems show the interesting potential, but should not be confused with future product properties.
5.4 Simplified methods 5.4.1 Variations of monthly energy balance calculations Using the reference office different variations of monthly calcaultion methodologies für cooling and heating have been developed and investigated. They were comparewd with hourly simulations. The main parameters have been summarized in table 4. Whereever profiles or setpoints were not constant over a specific time, the averaged monthly values were listed in the table. As in the simulations we used Rome, Brussels and Stockholm, and as orientations of the double office South-North and East-West. The basis for the monthly calculations are the common equations from the standards EN832, prEN 13790 and DIN V 4108-Teil 6, which are identical in their main calculation structures. Differences exist in the

Task 27 Solar Building Facade Components Subtask A: Performance
Final report, May 2006 72
treatment of utilizable gains (see below) and special topics not relevant here (e.g. losses via ground).
Table 4: Physical parameters of the reference office
Parameters Office
Standard HM-glazing
Component Area U [W/m2K] U*A [W/K] g-value [-] fRed
Außenwand 15.28 0.301 4.60 0.00 1.00
Fenster S 5.32 1.634 8.69 0.62 0.65
Fenster N 5.32 1.634 8.69 0.62 0.65
Volume 139.6 m3 Air change 0.549 h-1
Internal gains 5.368 W/m2 Floor area EBF 48.96 m²
H_Transmission 21.98 W/K
H_Ventilation 26.03 W/K
g*A 6.60 m2
Table 5: Time-averages of parameter over different periods
Working time Mo-Fr
Nighttime Mo-Fr
Average Mo-Fr
Average Sa+So
Average Week
Vol.str. [m³/h] 173 23 98.0 23.0 76.57
Air change [h-1] 1.240 0.165 0.702 0.165 0.549
H_T [W/K] 21.98 21.98 21.98 21.98 21.98
H_L [W/K] 58.82 7.82 33.32 7.82 26.03
H_T+H_L [W/K] 80.80 29.80 55.30 29.80 48.02
Q_intern [W/m2] 13.67 0.735 7.22 0.74 5.37
Setpoint heating 20 16 18 16 17.43
Setpoint cooling 26 30 28 30 28.57
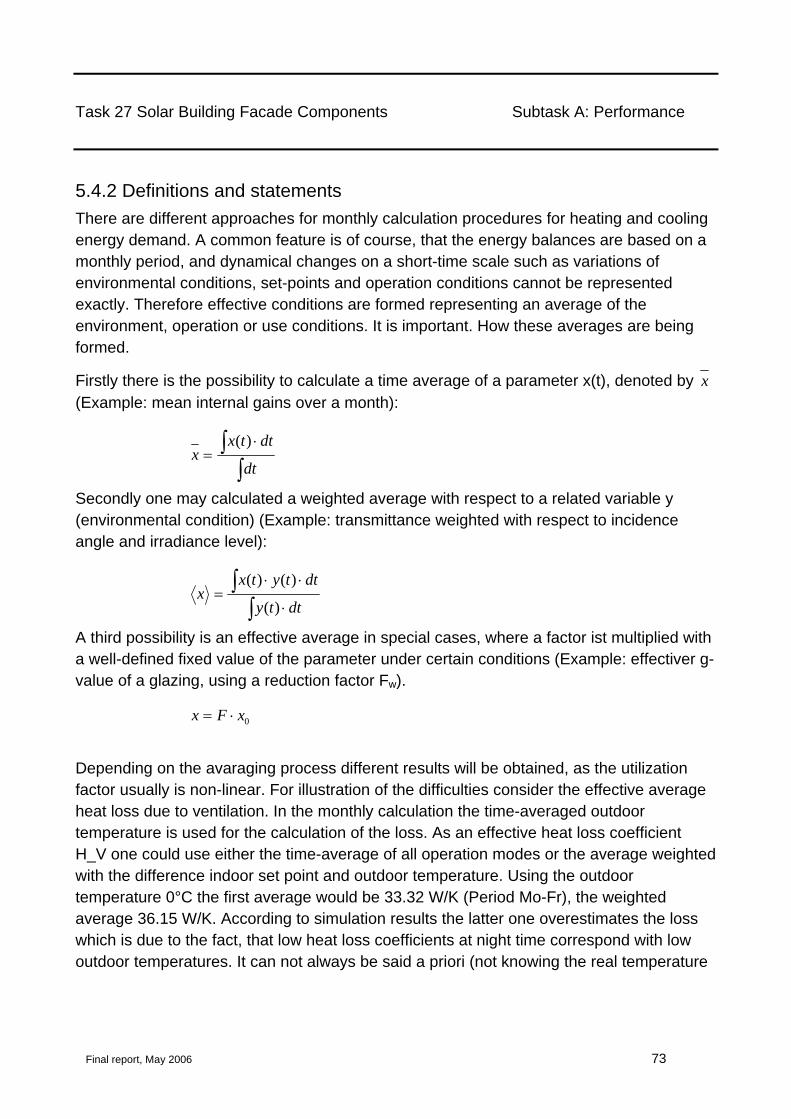
Task 27 Solar Building Facade Components Subtask A: Performance
Final report, May 2006 73
5.4.2 Definitions and statements There are different approaches for monthly calculation procedures for heating and cooling energy demand. A common feature is of course, that the energy balances are based on a monthly period, and dynamical changes on a short-time scale such as variations of environmental conditions, set-points and operation conditions cannot be represented exactly. Therefore effective conditions are formed representing an average of the environment, operation or use conditions. It is important. How these averages are being formed.
Firstly there is the possibility to calculate a time average of a parameter x(t), denoted by x (Example: mean internal gains over a month):
∫∫ ⋅
=dt
dttxx
)(
Secondly one may calculated a weighted average with respect to a related variable y (environmental condition) (Example: transmittance weighted with respect to incidence angle and irradiance level):
∫∫
⋅
⋅⋅=
dtty
dttytxx
)(
)()(
A third possibility is an effective average in special cases, where a factor ist multiplied with a well-defined fixed value of the parameter under certain conditions (Example: effectiver g-value of a glazing, using a reduction factor Fw).
0xFx ⋅=
Depending on the avaraging process different results will be obtained, as the utilization factor usually is non-linear. For illustration of the difficulties consider the effective average heat loss due to ventilation. In the monthly calculation the time-averaged outdoor temperature is used for the calculation of the loss. As an effective heat loss coefficient H_V one could use either the time-average of all operation modes or the average weighted with the difference indoor set point and outdoor temperature. Using the outdoor temperature 0°C the first average would be 33.32 W/K (Period Mo-Fr), the weighted average 36.15 W/K. According to simulation results the latter one overestimates the loss which is due to the fact, that low heat loss coefficients at night time correspond with low outdoor temperatures. It can not always be said a priori (not knowing the real temperature

Task 27 Solar Building Facade Components Subtask A: Performance
Final report, May 2006 74
change during the day and also heat storage effects) which average represents yields the best approximation to the simulated result.
It is assumed in the following that time-averages of operation modes are the best approximations for day-night changes, whereas the weekend operation (Sa, So) should be treated as a separate calculation period with respect to utilisation. There will be effects of heat storage, but the extent has to be investigated.
5.4.3 Determination of the utilisation factor The determination of the utilisation factors of internal gaisn for heating is different in the standards EN832, prEN 13790 and DIN V 4108-Teil 6. The utilisable gains are always determind by mutiplying the gains with the so-called utilisation factor η. Heating energy demand Qh then is calculated in all cases as the difference of heat losses and utilised gains:
Qh = Ql - η Qg
Cooling energy demand Qc results in principle always from non-utilised gains, which would lead to a temperature above set-point when no cooling is present. As in practice a certain temperature comfort band is allowed for operation, say between heating set point 20°C and colling setpoint 26°C, a different balance temperature has to be used for determination of the „non-utilisable“ gains which have to be cooled away. The utilisation factor ηc for cooling therefore is not identical with the heating utilisation factor ηh in general:
Qc =- ηc Qg
Typically the utilisation factor is determined as a function of the gain-loss-ratio
l
gQQ
γ =
and the storage time constant of the building
τ =CH
One way to calculate the time constant is the approach dividing an effective heat capacity C according to DIN EN 13768 and the total heat loss coefficient H. The utilisation factor η is written as
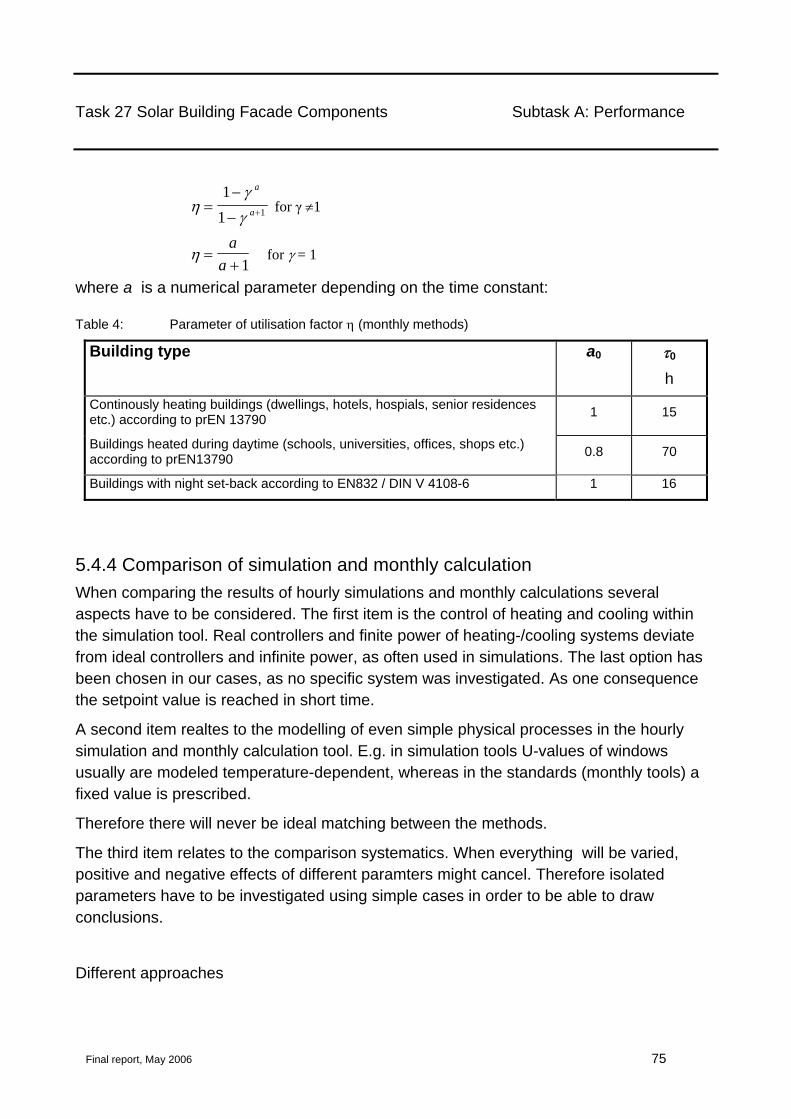
Task 27 Solar Building Facade Components Subtask A: Performance
Final report, May 2006 75
ηγγ
=−
− +
11 1
a
a for γ ≠1
η =+a
a 1 for γ = 1
where a is a numerical parameter depending on the time constant:
Table 4: Parameter of utilisation factor η (monthly methods)
Building type a0 τ0
h Continously heating buildings (dwellings, hotels, hospials, senior residences etc.) according to prEN 13790 1 15
Buildings heated during daytime (schools, universities, offices, shops etc.) according to prEN13790 0.8 70
Buildings with night set-back according to EN832 / DIN V 4108-6 1 16
5.4.4 Comparison of simulation and monthly calculation When comparing the results of hourly simulations and monthly calculations several aspects have to be considered. The first item is the control of heating and cooling within the simulation tool. Real controllers and finite power of heating-/cooling systems deviate from ideal controllers and infinite power, as often used in simulations. The last option has been chosen in our cases, as no specific system was investigated. As one consequence the setpoint value is reached in short time.
A second item realtes to the modelling of even simple physical processes in the hourly simulation and monthly calculation tool. E.g. in simulation tools U-values of windows usually are modeled temperature-dependent, whereas in the standards (monthly tools) a fixed value is prescribed.
Therefore there will never be ideal matching between the methods.
The third item relates to the comparison systematics. When everything will be varied, positive and negative effects of different paramters might cancel. Therefore isolated parameters have to be investigated using simple cases in order to be able to draw conclusions.
Different approaches
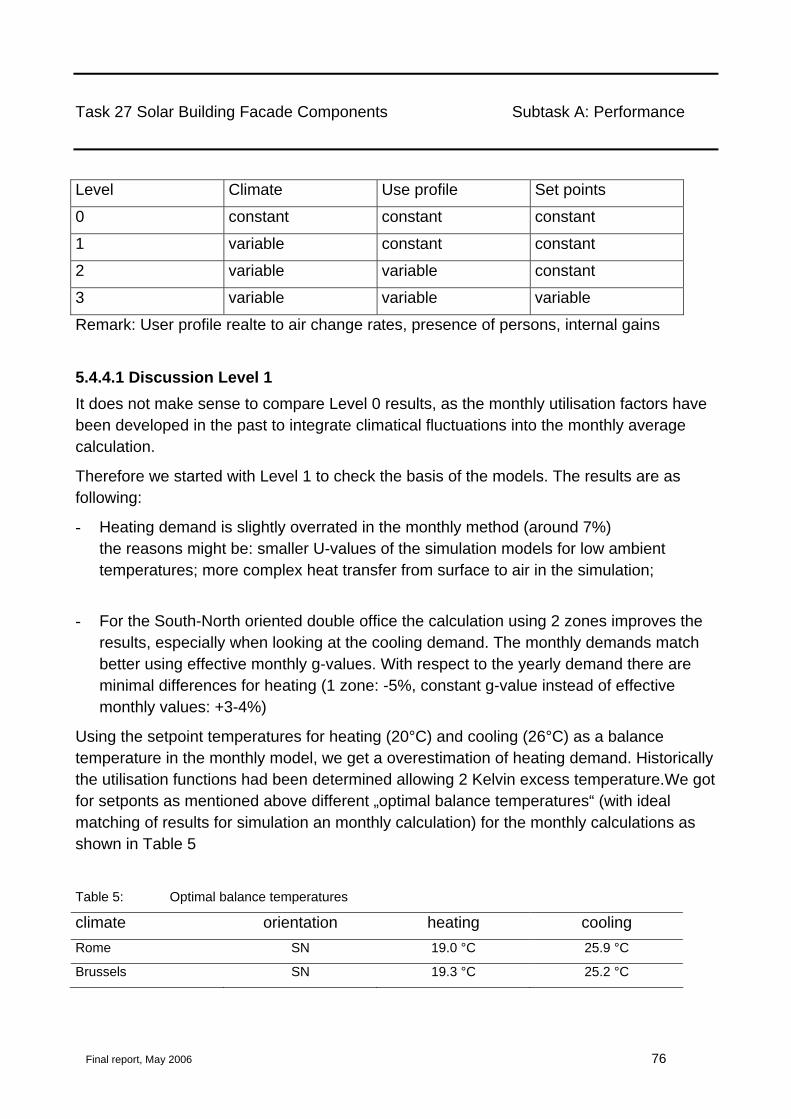
Task 27 Solar Building Facade Components Subtask A: Performance
Final report, May 2006 76
Level Climate Use profile Set points
0 constant constant constant
1 variable constant constant
2 variable variable constant
3 variable variable variable
Remark: User profile realte to air change rates, presence of persons, internal gains 5.4.4.1 Discussion Level 1 It does not make sense to compare Level 0 results, as the monthly utilisation factors have been developed in the past to integrate climatical fluctuations into the monthly average calculation.
Therefore we started with Level 1 to check the basis of the models. The results are as following:
- Heating demand is slightly overrated in the monthly method (around 7%) the reasons might be: smaller U-values of the simulation models for low ambient temperatures; more complex heat transfer from surface to air in the simulation;
- For the South-North oriented double office the calculation using 2 zones improves the results, especially when looking at the cooling demand. The monthly demands match better using effective monthly g-values. With respect to the yearly demand there are minimal differences for heating (1 zone: -5%, constant g-value instead of effective monthly values: +3-4%)
Using the setpoint temperatures for heating (20°C) and cooling (26°C) as a balance temperature in the monthly model, we get a overestimation of heating demand. Historically the utilisation functions had been determined allowing 2 Kelvin excess temperature.We got for setponts as mentioned above different „optimal balance temperatures“ (with ideal matching of results for simulation an monthly calculation) for the monthly calculations as shown in Table 5
Table 5: Optimal balance temperatures
climate orientation heating cooling Rome SN 19.0 °C 25.9 °C
Brussels SN 19.3 °C 25.2 °C
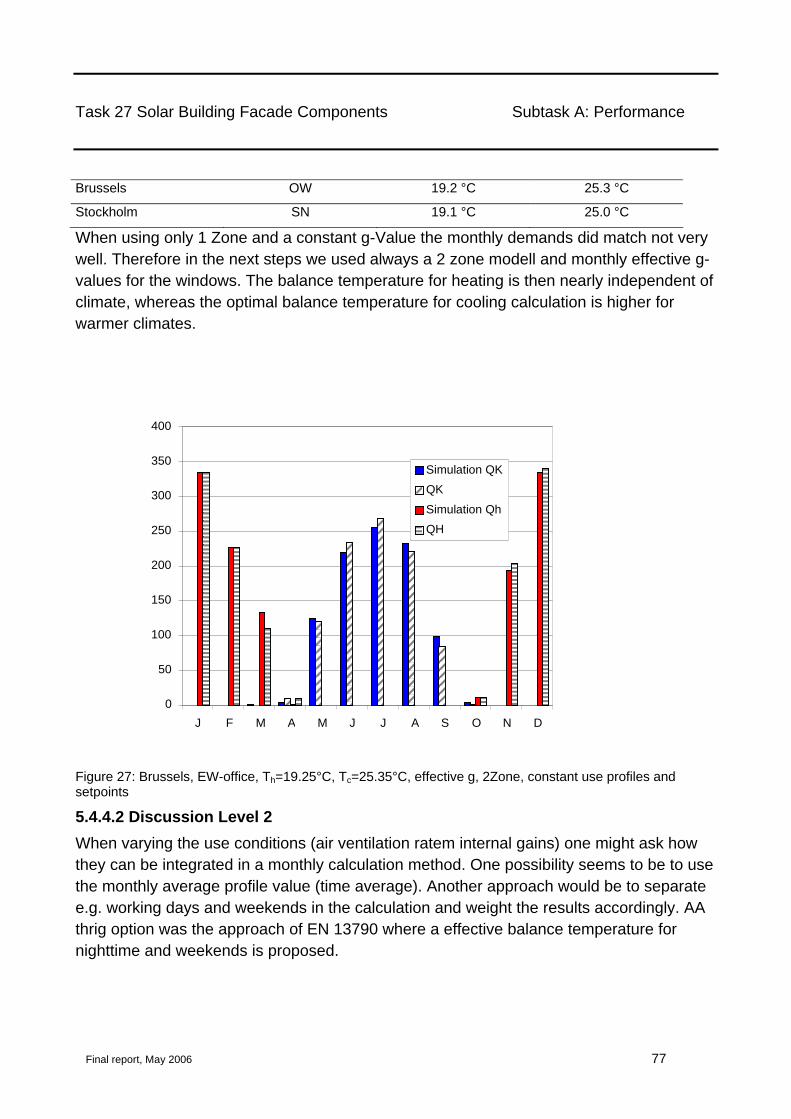
Task 27 Solar Building Facade Components Subtask A: Performance
Final report, May 2006 77
Brussels OW 19.2 °C 25.3 °C
Stockholm SN 19.1 °C 25.0 °C
When using only 1 Zone and a constant g-Value the monthly demands did match not very well. Therefore in the next steps we used always a 2 zone modell and monthly effective g-values for the windows. The balance temperature for heating is then nearly independent of climate, whereas the optimal balance temperature for cooling calculation is higher for warmer climates.
0
50
100
150
200
250
300
350
400
J F M A M J J A S O N D
Simulation QKQK
Simulation QhQH
Figure 27: Brussels, EW-office, Th=19.25°C, Tc=25.35°C, effective g, 2Zone, constant use profiles and setpoints
5.4.4.2 Discussion Level 2 When varying the use conditions (air ventilation ratem internal gains) one might ask how they can be integrated in a monthly calculation method. One possibility seems to be to use the monthly average profile value (time average). Another approach would be to separate e.g. working days and weekends in the calculation and weight the results accordingly. AA thrig option was the approach of EN 13790 where a effective balance temperature for nighttime and weekends is proposed.

Task 27 Solar Building Facade Components Subtask A: Performance
Final report, May 2006 78
When separating working days and weekends in the calculation, for heating the difference was small, however the cooling demand increased by 10%. This is obvious if one takes into account that for a working days usually the internal gains are much higher and therefore overheating is more frequent then when using an weekly average situation.
Table 6: Optimal balance temperature working time for cooling
Climate Orinetation Time average Work/weekend
Eff. Balance temperature
Rome SN 25.1 °C 25.2 °C 25.0 °C
Brussels SN 24.6 °C 24.7 °C 24.5 °C
Brussels OW 24.8 °C 24.9 °C 24.7 °C
Stockholm SN 24.3°C 24.4°C 24.2 °C
5.4.4.3 Discussion Level 3 It is interesting to investigate the cases of variable setpoint temperatures (weekends and nighttime). In simulation we investigated the case of lower heating setpoint 16°C and no cooling outside the working hours (i.e. Tc=90°C).
The simulated heating demand was reduced for the high thermal capacity office by about 15%. The difference for cooling was actually smaller – even with a fixed setpoint due to reduced internal gains there is nearly no cooling demand during weekends.
The case „time average“ is not useful any more, as the „setpoint“ outside working hours is undefined: Tc=40°C and Tc=90°C both yield no colling demand for the weekend but result in totally different averages. During the weekend several effects influence the results: On the one hand cooling is swithed off and on the other hand internal gains are low. This may lead to an increase OR decrease of the balance temperature of the office. In principle a East-West oriented office in a warm climate might heat up during the weekend and has to be cooled down in the Monday morning hours. However in most cases the balance temperatures seems to decrease and no carry over effect from the weekend is observed.
Therfore it seems sufficent to calculate week and weekends separately and average the results (by weighting using 2/7 for the weekend and 5/7 for the week). Special cases considering passive cooling (nighttime cooling, storing low temperatures in the building structure) certainly need a more complex approach.

Task 27 Solar Building Facade Components Subtask A: Performance
Final report, May 2006 79
0
50
100
150
200
250
300
350
J F M A M J J A S O N D
Hei
z-/K
ühle
nerg
ie Q
H /
QK
[kW
h]
Simulation QK
QK
Simulation QhQH
Figure 28: Brussels, EW-office, Th=19.6/16.0 °C, Tc=24.1 °, effective balance temperature
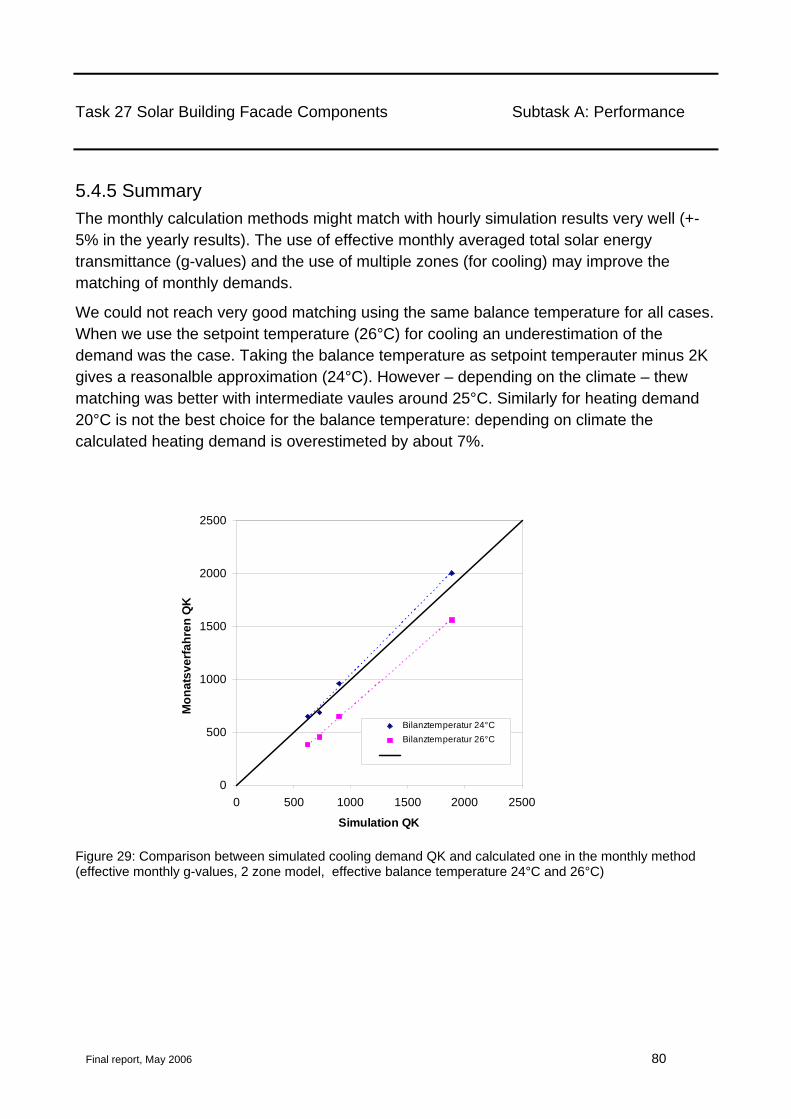
Task 27 Solar Building Facade Components Subtask A: Performance
Final report, May 2006 80
5.4.5 Summary The monthly calculation methods might match with hourly simulation results very well (+-5% in the yearly results). The use of effective monthly averaged total solar energy transmittance (g-values) and the use of multiple zones (for cooling) may improve the matching of monthly demands.
We could not reach very good matching using the same balance temperature for all cases. When we use the setpoint temperature (26°C) for cooling an underestimation of the demand was the case. Taking the balance temperature as setpoint temperauter minus 2K gives a reasonalble approximation (24°C). However – depending on the climate – thew matching was better with intermediate vaules around 25°C. Similarly for heating demand 20°C is not the best choice for the balance temperature: depending on climate the calculated heating demand is overestimeted by about 7%.
0
500
1000
1500
2000
2500
0 500 1000 1500 2000 2500
Simulation QK
Mon
atsv
erfa
hren
QK
Bilanztemperatur 24°CBilanztemperatur 26°C
Figure 29: Comparison between simulated cooling demand QK and calculated one in the monthly method (effective monthly g-values, 2 zone model, effective balance temperature 24°C and 26°C)
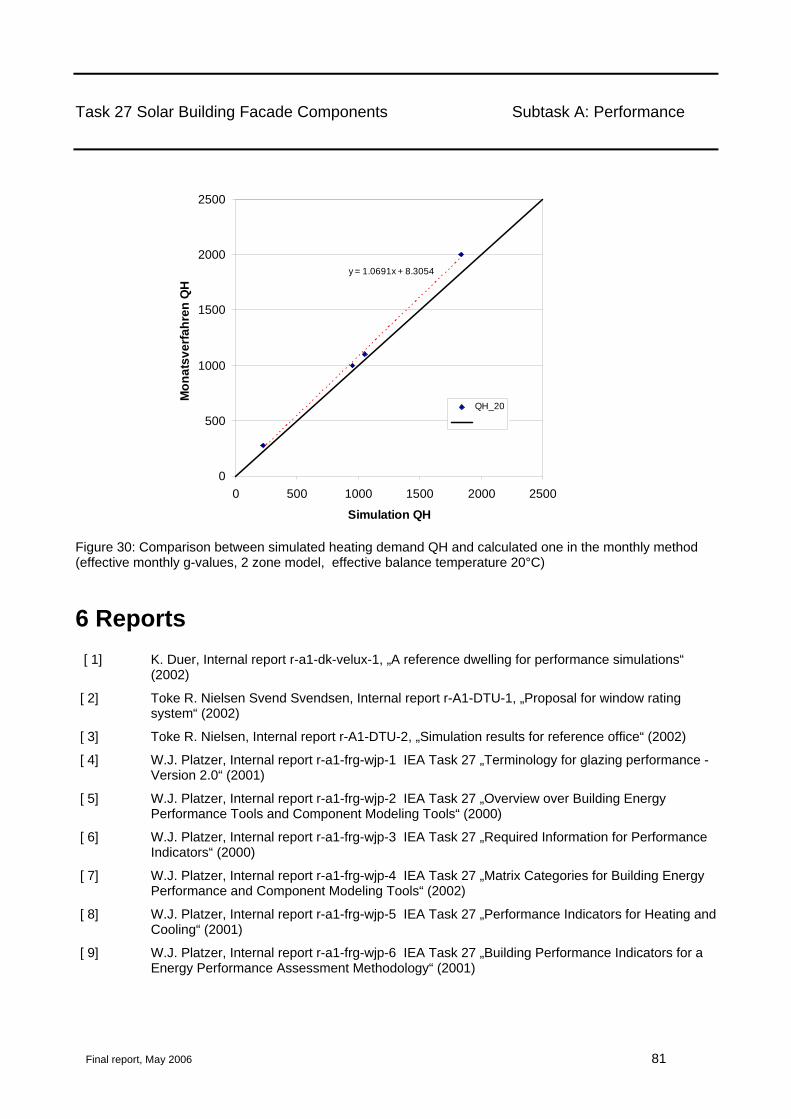
Task 27 Solar Building Facade Components Subtask A: Performance
Final report, May 2006 81
y = 1.0691x + 8.3054
0
500
1000
1500
2000
2500
0 500 1000 1500 2000 2500
Simulation QH
Mon
atsv
erfa
hren
QH
QH_20
Figure 30: Comparison between simulated heating demand QH and calculated one in the monthly method (effective monthly g-values, 2 zone model, effective balance temperature 20°C)
6 Reports [ 1] K. Duer, Internal report r-a1-dk-velux-1, „A reference dwelling for performance simulations“
(2002)
[ 2] Toke R. Nielsen Svend Svendsen, Internal report r-A1-DTU-1, „Proposal for window rating system“ (2002)
[ 3] Toke R. Nielsen, Internal report r-A1-DTU-2, „Simulation results for reference office“ (2002)
[ 4] W.J. Platzer, Internal report r-a1-frg-wjp-1 IEA Task 27 „Terminology for glazing performance - Version 2.0“ (2001)
[ 5] W.J. Platzer, Internal report r-a1-frg-wjp-2 IEA Task 27 „Overview over Building Energy Performance Tools and Component Modeling Tools“ (2000)
[ 6] W.J. Platzer, Internal report r-a1-frg-wjp-3 IEA Task 27 „Required Information for Performance Indicators“ (2000)
[ 7] W.J. Platzer, Internal report r-a1-frg-wjp-4 IEA Task 27 „Matrix Categories for Building Energy Performance and Component Modeling Tools“ (2002)
[ 8] W.J. Platzer, Internal report r-a1-frg-wjp-5 IEA Task 27 „Performance Indicators for Heating and Cooling“ (2001)
[ 9] W.J. Platzer, Internal report r-a1-frg-wjp-6 IEA Task 27 „Building Performance Indicators for a Energy Performance Assessment Methodology“ (2001)
Task 27 Solar Building Facade Components Subtask A: Performance
Final report, May 2006 82
[ 10] W.J. Platzer, Internal report r-a1-frg-wjp-7 IEA Task 27 „General Energy Performance Assessment Methodology“ (2001)
[ 11] W.J. Platzer, Internal report r-a1-frg-wjp-8 IEA Task 27 „Basic definitions and equations for integral heating and cooling energy assessment including equipment (German Draft)“ (2004)
[ 12] W.J. Platzer, Internal report r-a1-frg-wjp-9 IEA Task 27 „Simplified cooling energy calculation methodology and results“ (2004)
[ 13] W.J. Platzer, Internal report r-a1-frg-wjp-10 IEA Task 27 „Recommendations for testing conditions" (2004)
[ 14] W.J. Platzer, Internal report r-a1-frg-wjp-11 IEA Task 27 „Case Study of Building Simulation using the Reference Office“ (2004)
[ 15] W.J. Platzer, Internal report r-a1-frg-wjp-12 IEA Task 27 „Simplified Calculation of Double Envelope Facades (German Draft)“ (2004)
[ 16] W.J. Platzer, Internal report r-a1-frg-wjp-13 IEA Task 27 „Simplified characterisation of facades with slat-type solar shading for energy performance assessment of buildings“ (2004)
[ 17] W.J. Platzer, Internal report r-a3-cs5-frg-wjp-1 IEA Task 27 "Thermal calculations for a window frame“ (2002)
[ 18] D. van Dijk, Internal report r-a1-nl-dvd-1, „Survey of Standards“ (2001)
[ 19] D. van Dijk, Internal report r-a1-nl-dvd-2, „Reference office for thermal, solar and lighting calculations“ (2001)
[ 20] D. van Dijk, Internal report r-a1-nl-dvd-3, „Matrix of products and thermal and solar properties“ (2001)
[ 21] I. Bryn, Internal report r-a1-nor-eh-1, „Comfort and Operative Temperature in the Sun“ (2002)
[ 22] I. Bryn, Internal report r-a1-nor-eh-2, „Sun Shading As Energy And Environmental Efficiency Measure“ (2003)
[ 23] I. Bryn, Internal report r-a1-nor-eh-3, „Glass facades -Case Study“ (2003)
[ 24] C. Curcija, Internal report r-a1-us-cc-1, „Computer Tools for Building Performance Simulation – List“ (2001)
[ 25] C. Curcija, Internal report r-a1-us-cc-2, „Fenestration Terminology and Glossary“ (2003)
[ 26] C. Curcija, Internal report r-a1-us-cc-3, „Component Performance Assessment Methodology CPAM“ (2002)
Internal documentes have been ciriclated also in draft versions. The year in brackets shows the year where the first draft has been issued.