Capstone 60 sprmkt TP - FINAL for web.doc | US EPA … · 4.4.3 Performance Evaluation Audit ......
113
Transcript of Capstone 60 sprmkt TP - FINAL for web.doc | US EPA … · 4.4.3 Performance Evaluation Audit ......


SRI/USEPA-GHG-QAP-27 November 2002
Test and Quality Assurance Plan Combined Heat and Power at a Commercial Supermarket Capstone 60 kW MicroTurbineTM
Prepared by:
Greenhouse Gas Technology Center Southern Research Institute
Under a Cooperative Agreement With U.S. Environmental Protection Agency
and
Under Agreement With New York State Energy Research and Development Authority

EPA REVIEW NOTICE
This report has been peer and administratively reviewed by the U.S. Environmental Protection Agency, and approved for publication. Mention of trade names or commercial products does not constitute endorsement or recommendation for use.

SRI/USEPA-GHG-QAP-27 November 2002
Greenhouse Gas Technology Center A U.S. EPA Sponsored Environmental Technology Verification ( ) Organization
Test and Quality Assurance Plan
Combined Heat and Power at a Commercial SupermarketCapstone 60 kW MicroTurbineTM
Prepared by: Greenhouse Gas Technology Center
Southern Research Institute PO Box 13825
Research Triangle Park, NC 27709 USA Telephone: 919/806-3456
Reviewed by:New York State Energy Research and Development Authority
CDH Energy CorporationNational Renewable Energy Laboratory
U.S. EPA Office of Research and Development QA Team
indicates comments are integrated into Test Plan


Greenhouse Gas Technology Center A U.S. EPA Sponsored Environmental Technology Verification ( ) Organization
Test and Quality Assurance Plan Combined Heat and Power at a Commercial Supermarket
Capstone 60 MicroTurbineTM
This Test and Quality Assurance Plan has been reviewed and approved by the Greenhouse Gas Technology Center Project Manager and Center Director, the U.S. EPA APPCD Project Officer, and the U.S. EPA APPCD Quality Assurance Manager.
Original signed by: Original signed by:
Stephen Piccot Date David Kirchgessner Date Director APPCD Project Officer Greenhouse Gas Technology Center U.S. EPA Southern Research Institute
Original signed by: Original signed by:
William Chatterton Project Manager Greenhouse Gas Technology Center Southern Research Institute
Date Shirley Wasson Date APPCD Quality Assurance Manager U.S. EPA
Test Plan Final: November 2002


TABLE OF CONTENTS Page
APPENDICES ................................................................................................................................................ iiiLIST OF FIGURES ........................................................................................................................................ iiiLIST OF TABLES .......................................................................................................................................... iiiDISTRIBUTION LIST ................................................................................................................................... iv
1.0 INTRODUCTION .................................................................................................................................1-11.1 BACKGROUND ..........................................................................................................................1-11.2 CAPSTONE MICROTURBINE TECHNOLOGY DESCRIPTION............................................1-21.3 UNIFIN HEAT EXCHANGER TECHNOLOGY DESCRIPTION.............................................1-51.4 TEST FACILITY DESCRIPTION ...............................................................................................1-6
1.4.1 Integration of CHP System with Facility Operations ......................................................1-71.4.2 Description of the Munters HVAC Air Handling Unit ....................................................1-7
1.5 PERFORMANCE VERIFICATION PARAMETERS .................................................................1-81.5.1 Power and Heat Production Performance ......................................................................1-101.5.2 Power Quality Performance ...........................................................................................1-111.5.3 Air Pollutant Emission Performance..............................................................................1-111.5.4 Emission Reductions......................................................................................................1-11
1.6 ORGANIZATION ......................................................................................................................1-121.7 SCHEDULE................................................................................................................................1-13
2.0 VERIFICATION APPROACH............................................................................................................2-12.1 OVERVIEW .................................................................................................................................2-12.2 POWER AND HEAT PRODUCTION PERFORMANCE ..........................................................2-4
2.2.1 Electrical Power Output and Efficiency Determinations .................................................2-52.2.2 Heat Recovery Rate and Thermal Efficiency Measurements ..........................................2-9
2.3 POWER QUALITY PERFORMANCE .....................................................................................2-122.3.1 Electrical Frequency ......................................................................................................2-132.3.2 Generator Line Voltage..................................................................................................2-132.3.3 Voltage Total Harmonic Distortion ...............................................................................2-132.3.4 Current Total Harmonic Distortion ................................................................................2-142.3.5 Power Factor ..................................................................................................................2-15
2.4 EMISSIONS PERFORMANCE .................................................................................................2-152.4.1 Stack Emission Rate Determination...............................................................................2-15
2.5 ELECTRICITY OFFSETS AND ESTIMATION OF EMISSION REDUCTIONS ..................2-202.5.1 Microturbine Annual CO2 and NOX Emissions Estimation ...........................................2-222.5.2 Estimation of Electric Grid Emissions ...........................................................................2-232.5.3 Estimation of Gas Burner Emission Reductions ............................................................2-25
3.0 DATA QUALITY ..................................................................................................................................3-13.1 BACKGROUND ..........................................................................................................................3-13.2 ELECTRICAL POWER AND HEAT OUTPUT QA/QC PROCEDURES .................................3-2
3.2.1 Electrical Power Output Quality Assurance ....................................................................3-23.2.2 Fuel Flow Rate Quality Assurance ..................................................................................3-23.2.3 Ambient Temperature and Barometric Pressure Quality Assurance................................3-33.2.4 Fuel Analyses Quality Assurance ....................................................................................3-73.2.5 Heat Recovery Rate Quality Assurance ...........................................................................3-9
(continued)
i

TABLE OF CONTENTS (continued)
Page
3.3 EMISSION MEASUREMENTS QA/QC PROCEDURES ........................................................3-103.3.1 NOx Emissions Quality Assurance.................................................................................3-113.3.2 CO, CO2, and O2 Emissions Quality Assurance ............................................................3-133.3.3 CH4 Emissions Quality Assurance.................................................................................3-14
3.4 DETERMINATION OF COMPOSITE ERROR ESTIMATES.................................................3-143.5 INSTRUMENT TESTING, INSPECTION, AND MAINTENANCE .......................................3-163.6 INSPECTION/ACCEPTANCE OF SUPPLIES AND CONSUMABLES.................................3-17
4.0 DATA ACQUISITION, VALIDATION, AND REPORTING ..........................................................4-14.1 DATA ACQUISITION AND STORAGE....................................................................................4-1
4.1.1 Continuous Measurements Data Acquisition...................................................................4-14.1.2 Fuel Flow Rate Measurement ..........................................................................................4-44.1.3 Emission Measurements ..................................................................................................4-44.1.4 Fuel Gas Sampling ...........................................................................................................4-5
4.2 DATA REVIEW, VALIDATION, AND VERIFICATION.........................................................4-54.3 RECONCILIATION OF DATA QUALITY OBJECTIVES........................................................4-64.4 ASSESSMENTS AND RESPONSE ACTIONS ..........................................................................4-6
4.4.1 Project Reviews................................................................................................................4-64.4.2 Inspections .......................................................................................................................4-74.4.3 Performance Evaluation Audit.........................................................................................4-74.4.4 Technical Systems Audit .................................................................................................4-74.4.5 Audit of Data Quality.......................................................................................................4-8
4.5 DOCUMENTATION AND REPORTS .......................................................................................4-84.5.1 Field Test Documentation ................................................................................................4-84.5.2 QC Documentation ..........................................................................................................4-84.5.3 Corrective Action and Assessment Reports .....................................................................4-84.5.4 Verification Report and Verification Statement ..............................................................4-9
4.6 TRAINING AND QUALIFICATIONS .....................................................................................4-104.7 HEALTH AND SAFETY REQUIREMENTS ...........................................................................4-10
5.0 REFERENCES ......................................................................................................................................5-1
ii

APPENDICES Page
APPENDIX A Test Procedures and Field Log Forms ............................................................. A-1APPENDIX B Quality Assurance/Quality Control Checks and Log Forms.............................B-1APPENDIX C Example Test and Calibration Data ..................................................................C-1
LIST OF FIGURES Page
Figure 1-1 Capstone 60 Microturbine System .................................................................... 1-3Figure 1-2 Capstone Microturbine System Process Diagram............................................. 1-4Figure 1-3 Waldbaums Supermarket in Hauppage, NY ..................................................... 1-6Figure 1-4 Schematic of the Munters HVAC Air Handling Unit ....................................... 1-8Figure 1-5 Project Organization ....................................................................................... 1-12Figure 2-1 Schematic of Measurement System .................................................................. 2-2Figure 2-2 Gas Sampling and Analysis System ............................................................... 2-18Figure 2-3 Capstone 60 Microturbine CHP Emission Reduction
Estimation Methodology................................................................................. 2-21Figure 4-1 DAS Schematic ................................................................................................. 4-2
LIST OF TABLES Page
Table 1-1 Capstone 60 Microturbine Specifications ......................................................... 1-5Table 1-2 Unifin MG2 Heat Exchanger Specifications..................................................... 1-6Table 1-3 Overview of Munters HVAC Unit Specifications ............................................ 1-7Table 1-4 Verification Test Matrix.................................................................................... 1-9Table 2-1 Permissible Variations in Power, Fuel, and Atmospheric Conditions .............. 2-5Table 2-2 Summary of Emission Testing Methods ......................................................... 2-17Table 2-3 CO2 and NOX Emission Rates for Two Geographical Regions ...................... 2-24Table 2-4 Summary of Projected Annual Het Offsets..................................................... 2-27Table 3-1 Verification Parameter DQOs ........................................................................... 3-1Table 3-2 Measurement Instrument Specifications and DQI Goals .................................. 3-4Table 3-3 Summary of QA/QC Checks............................................................................. 3-6Table 3-4 ASTM D1945 Repeatability Specifications (ASTM 2001b) ............................ 3-8Table 3-5 DQIs for Anticipated Component Concentrations ............................................ 3-8Table 3-6 Glycol Solution Density and Specific Heat Analytical Error ........................... 3-9Table 3-7 Instrument Specifications and DQI Goals for Stack Emissions Testing......... 3-12Table 3-8 Summary of Emissions Testing Calibrations and QC Checks ........................ 3-13Table 3-9 Combined Thermal Energy and Electrical Efficiency
Error Propagation and DQOs .......................................................................... 3-16Table 4-1 Continuous Data to be Collected for Microturbine Evaluation......................... 4-3
iii

DISTRIBUTION LIST
New York State Energy Research and Development Authority Richard Drake Dana Levy
CDH Energy Corporation Hugh Henderson
National Renewable Energy Laboratory Ali Jalelzadeh
U.S. EPA – Office of Research and Development David KirchgessnerShirley Wasson
Southern Research Institute (GHG Center) Stephen Piccot Sushma Masemore William Chatterton Ashley Williamson
iv

1.0 INTRODUCTION
1.1 BACKGROUND
The U.S. Environmental Protection Agency’s Office of Research and Development (EPA-ORD) operates the Environmental Technology Verification (ETV) program to facilitate the deployment of innovative technologies through performance verification and information dissemination. The goal of the ETV program is to further environmental protection by substantially accelerating the acceptance and use of improved and innovative environmental technologies. Congress funds ETV in response to the belief that there are many viable environmental technologies that are not being used for the lack of credible thirdparty performance data. With performance data developed under this program, technology buyers, financiers, and permitters in the United States and abroad will be better equipped to make informed decisions regarding environmental technology purchase and use.
The Greenhouse Gas Technology Center (GHG Center) is one of six verification organizations operating under the ETV program. The GHG Center is managed by EPA’s partner verification organization, Southern Research Institute (SRI), which conducts verification testing of promising GHG mitigation and monitoring technologies. The GHG Center’s verification process consists of developing verification protocols, conducting field tests, collecting and interpreting field and other data, obtaining independent peer-review input, and reporting findings. Performance evaluations are conducted according to externally reviewed verification Test and Quality Assurance Plans (Test Plan) and established protocols for quality assurance (QA).
The GHG Center is guided by volunteer groups of stakeholders. These stakeholders offer advice on specific technologies most appropriate for testing, help disseminate results, and review Test Plans and Technology Verification Reports (Report). The GHG Center’s Executive Stakeholder Group consists of national and international experts in the areas of climate science and environmental policy, technology, and regulation. It also includes industry trade organizations, environmental technology finance groups, governmental organizations, and other interested groups. The GHG Center’s activities are also guided by industry specific stakeholders who provide guidance on the verification testing strategy related to their area of expertise and peer-review key documents prepared by the GHG Center.
One technology of interest to some GHG Center’s stakeholders is distributed electrical power generation systems. Distributed generation (DG) refers to equipment, typically ranging from 5 to 1,000 kilowatts (kW) that provide electric power at a site closer to customers than central station generation. A distributed power unit can be connected directly to the customer or to a utility’s transmission and distribution system. Examples of technologies available for DG includes gas turbine generators, internal combustion engine generators (gas, diesel, other), photovoltaics, wind turbines, fuel cells, and microturbines. DG technologies provide customers one or more of the following main services: standby generation (i.e., emergency backup power), peak shaving generation (during high demand periods), baseload generation (constant generation), or cogeneration (combined heat and power generation).
Recently, the GHG Center and the New York State Energy Research and Development Authority (NYSERDA) agreed to collaborate and share the cost of verifying several new DG technologies throughout the state of New York under NYSERDA-sponsored programs. The verification described in this document will evaluate Capstone Turbine Corporation’s 60 kW microturbine system currently in use at the Waldbaums Supermarket in Hauppauge, New York. The electricity produced by the microturbine is used to offset electricity purchases from Long Island Power Association (LIPA). This natural gas-fired
1-1

Capstone 60 kW microturbine is integrated with a 20,000 cfm Munters air handling unit that is currently part of A&P’s standard supermarket store design (Waldbaums is a subsidiary of A&P). The Munters unit provides cooling and heating to the main sales areas of the store and includes a desiccant section to provide dehumidification. A Unifin heat exchanger installed to recover heat from the microturbine exhaust can be used to provide both space heating and desiccant regeneration. Much of the heat generated by the microturbine is captured by the Unifn heat exchanger and transferred to the Munters unit, therby displacing some natural gas purchases from Keyspan Gas. The propylene glycol/water mixture (PG fluid) piping from the Unifin is directly connected to hot PG fluid coils in the Munters unit (supplying heating and regenerating desiccant). The Munters unit is capable of using recovered heat when available or reverting back to the conventional natural gas-fired burners otherwise. The microturbine skid, which includes the Capstone turbine, Unifin heat exchanger, and natural gas compressor module, is installed on the roof adjacent to the Munters air handling unit. PG fluid piping connects the heat exchanger and desiccant units.
The GHG Center will be evaluating the performance of the Capstone 60 kW microturbine system in collaboration with NYSERDA. Field tests will be performed over a two- to four-week verification period to independently verify the electricity generation and use rate, thermal energy recovery and use rate, electrical power quality, energy efficiency, emissions, and GHG emission reductions for the Waldbaums Supermarket.
This document is the Test Plan for this performance verification. It contains the rationale for the selection of verification parameters, the verification approach, data quality objectives (DQOs), and Quality Assurance/Quality Control (QA/QC). This Test Plan has been reviewed by NYSERDA and associates, selected members of the GHG Center’s DG Stakeholder Panel, and the U.S. EPA QA team. Once approved, as evidenced by the signature sheet at the front of this document, it will meet the requirements of the GHG Center’s Quality Management Plan (QMP) and thereby satisfy the ETV QMP requirements and conform with U.S. EPA’s standard for environmental testing. This Test Plan has been prepared to guide implementation of the test and to document planned test operations. Once testing is completed, the GHG Center will prepare a Technology Verification Report (Report) and Verification Statement, which will first be reviewed by NYSERDA. Once all comments are addressed, the Report will be peer-reviewed by the stakeholders, the host facility, and the U.S. EPA QA team. Once completed, the GHG Center Director and the U.S. EPA Laboratory Director will sign the Verification Statement, and the final Report will be posted on the Web sites maintained by the GHG Center (www.sri-rtp.com) and ETV program (www.epa.gov/etv).
The remaining discussion in this section provides a description of the Capstone 60 microturbine technology and the Waldbaums Supermarket. This is followed by a list of performance verification parameters that will be quantified through independent testing at the site. A discussion of key organizations participating in this verification, their roles, and the verification test schedule is provided at the end of this section. Section 2.0 describes the technical approach for verifying each parameter, including the sampling procedures, analytical procedures, and QA/QC procedures that will be followed to assess data quality. Section 3.0 identifies the DQOs for critical measurements, and states the accuracy, precision, and completeness goals for each measurement. Section 4.0 discusses data acquisition, validation, reporting, and auditing procedures.
1.2 CAPSTONE MICROTURBINE TECHNOLOGY DESCRIPTION
Natural gas-fired turbines have been used to generate electricity since the 1950s. Technical and manufacturing developments in the last decade have enabled the introduction of microturbines, with generation capacity ranging from 30 to 200 kW. Microturbines have evolved from automotive and truck
1-2

turbocharger technology and small jet engine technology. A microturbine consists of a compressor, combustor, power turbine, and generator. They have a small number of moving parts, and their compact size enables them to be located on sites with limited space. For sites with thermal demands, a waste heat recovery system can be integrated with a microturbine to achieve higher efficiencies.
The microturbine system to be verified at Waldbaums Supermarket is shown in Figure 1-1. It consists of a Capstone 60 MicroTurbine (developed by Capstone Turbine Corporation) and a heat recovery system (developed by Unifin International). Figure 1-1 also shows the location of the Copeland Scroll natural gas compressor. The compressor is needed to boost the delivered gas pressure from approximately 5 to 90 psig. The compressed gas is then regulated at 60 psig as required by the Capstone. Figure 1-2 illustrates a simplified process flow diagram of the microturbine combined heat and power (CHP) system at this site, and a discussion of each component is provided below.
Figure 1-1. Capstone 60 Microturbine System
1-3

Figure 1-2. Capstone Microturbine System Process Diagram
Heat Exchanger Exhaust
Microturbine Exhaust
PG Supply
Copeland-Scroll Gas Compressor
(to 90 psig)
Capstone 60 Microturbine Unifin Heat
Exchanger
Main 480 Volt Pane Natural Gas
Input (5 psig)
PG Return
To Desiccant Regeneration Coil
To Space Heating Coil
60 psig Regulator
Electric power is generated from a high-speed, single shaft, recuperated, air-cooled turbine generator with a nominal power output of 60 kW net (59 oF, sea level). Table 1-2 summarizes the physical and electrical specifications for a Capstone Model 60 microturbine, which is designed to operate on natural gas, and consists of an air compressor, recuperator, combustor, turbine, and a permanent magnet generator. (For the CHP system installed for this verification, the natural gas is compressed prior to firing in the microturbine.) The recuperator is a heat exchanger that recovers some of the heat from the exhaust stream and transfers it to the incoming compressed air stream. The preheated air is then mixed with the fuel, and this compressed fuel/air mixture is burned in the combustor under constant pressure conditions. The resulting hot gas is allowed to expand through the turbine section to perform work, rotating the turbine blades to turn a generator, which produces electricity. Because of the inverter-based electronics that enable the generator to operate at high speeds and frequencies, the need for a gearbox and associated moving parts is eliminated. The rotating components are mounted on a single shaft, supported by patented air bearings that rotate at over 96,000 revolutions per minute (rpm) at full load. The exhaust gas exits the turbine and enters the recuperator, which pre-heats the air entering the combustor, to improve the efficiency of the system. The exhaust gas then exits the recuperator into a Unifin heat recovery unit.
The permanent magnet generator produces high frequency alternating current, which is rectified, inverted, and filtered by the line power unit into conditioned 480 volts alternating current (VAC). The unit supplies a variable electrical frequency of 50 or 60 hertz (Hz), and is supplied with a control system, which allows for automatic and unattended operation. An active filter in the generator is reported by the turbine manufacturer to provide cleaner power, free of spikes and unwanted harmonics. All operations, including startup, setting of programmable interlocks, grid synchronization, operational setting, dispatch, and shutdown, can be performed manually or remotely using an internal power controller system.
The gas booster compressor is a Copeland-Scroll Model SZN22C1A, with a nominal volume capacity of 29 standard cubit feet per minute (scfm) and the capability of compressing natural gas from 0.25 to 15
1-4

pounds per square inch guage (psig) in to 60 to 100 psig out. In this application, the compressor is boosting gas pressure from approximately 5 to 90 psig. This compressor imposes a parasitic load of approximately 3.9 kW on the overall CHP system generating capacity.
Table 1-1. Capstone 60 Microturbine Specifications (Source: Capstone Turbine Corporation)
Width 30 in. Dimensions Depth 77 in.
Height 83 in. Weight Microturbine only 1,671 lb
Electrical Inputs Power (startup) Communications
Utility Grid or Black Start Battery Ethernet IP or Modem
Electrical Outputs Power at ISO Conditions 60 oF @ sea level) 60 kW, 400-480 VAC, 50/60 Hz, 3-phase
Noise Level Typical reported by Capstone 70 dBA at 33 ft Fuel Pressure w/o Natural Gas Compressor 60 psig Required w/ Natural Gas Compressor 0.5 to 15 psig Fuel Heat Content Higher Heating Value 970 to 2615 Btu/scf
Electrical Performance at Full Load (natural gas)
Heat Input Power Output Efficiency - w/ Natural Gas Compressor Heat Rate
811,000 Btu/hr, Natural gas-HHV 60 kW ±1 kW 28 % ± 2 %, ISO conditions, LHV basis 12,200 Btu/kWh, LHV basis
Heat Recovery Potential at Full Load
Exhaust Gas Temperature Exhaust Energy Available for Heat Recovery
580 oF 541,000 Btu/hr, LHV basis
Emissions (full load)
Nitrogen oxides (NOX) Carbon monoxide (CO) Total hydrocarbon (THCs)
< 9 ppmv @ 15 % O2 < 40 ppmv @ 15 % O2 < 9 ppmv @ 15 % O2
1.3 UNIFIN HEAT EXCHANGER TECHNOLOGY DESCRIPTION
As shown in Figure 1-2, waste heat from the microturbine exhaust, at approximately 580 °F, is recovered using a heat recovery and control system developed by Unifin International, and integrated by Capstone. It is an aluminum fin and tube heat exchanger (Model MG2) suitable for up to 700 °F exhaust gas. A 50 percent mixture of PG in water (designated as "PG fluid" for the remainder of this document) is used at the verification site as the heat transfer media to recover energy from the microturbine exhaust gas stream. The PG fluid is circulated at a rate of up to 40 gallons per minute (gpm). A digital controller monitors the PG fluid outlet temperature, and when the temperature exceeds user set point, an “exhaust gas divertor” automatically closes and allows the hot exhaust gas to bypass the heat exchanger and release the heat through the stack. When heat recovery is required (i.e., the PG fluid outlet temperature is less than user setpoint), the flap allows hot gas to circulate through the heat exchanger. This design allows the system to protect the heat recovery components from the full heat of the turbine exhaust, while still maintaining full electrical generation from the microturbine. The microturbine is the primary source of heat to the exchanger.
1-5

Table 1-2. Unifin MG2 Heat Exchanger Specifications (Source: Unifin International, Inc.)
Weight 820 lb Dimensions 34.75”(W) x 48.5”(D) x 70.1875”(H) Heat Exchanger Efficiency > 90 % (at full load at water inlet temperature = 120 °F) Exhaust Design Temperature 700 °F for C60 Tubeside Design Temperature 220 or 275 °F, closed loop Tubeside Design Pressure 150 psig Design Heat Input 541,000 Btu/hr Output 375,000 Btu/hr at 180 oF return fluid temperature
1.4 TEST FACILITY DESCRIPTION
The verification of the Capstone 60 Microturbine System will take place at the Waldbaums Supermarket constructed in 2002 and pictured in Figure 1-3. This new supermarket was originally a 35,000 sq ft retail facility. It was gutted to the block walls, expanded, and totally rebuilt into a 57,000 sq ft supermarket. It recently opened in July 2002. The store will be open 24 hours per day for all days of the week except Sunday. The store uses energy-efficient T4 light fixtures, so the load in the sales area is about 1.2 Watts per square foot. The facility electric demand is never expected to drop below 100 kW in this store. The 480 volt power generated by the microturbine will be wired directly into the store's 480 volt main panel. In order to use the available heat from the Capstone 60 kW microturbine CHP system, this unit was integrated in July 2002 with a 20,000 cfm Munters Drycool air handling unit previously installed at the Waldbaums. The Munters unit provides cooling and heating to the main sales areas of the store. The unit also includes a desiccant section to provide dehumidification. The Munters air handling unit was configured to be capable of using recovered heat when it is available or reverting back to the conventional natural gas-fired burners otherwise.
Figure 1-3. Waldbaums Supermarket in Hauppage, NY
1-6

1.4.1 Integration of CHP System with Facility Operations
As described above, the facility electric load is projected to remain above the 60 kW microturbine generating capacity at all times, and the unit is intended to operate "base-loaded" at full generating capacity. To prevent operation in islanding mode, the unit is designed to shut down during power outages. Currently, the local utility does not require any interconnect protections other than those integrated into the Capstone 60 system. The heat demands of the facility will vary on a daily and seasonal basis, and although well matched on the average to the heat generated and recoverable from the unit, will not generally represent a constant load or use the maximum available heat from the microturbine. The specific design of the CHP system in this application is somewhat unique in using two different heat recovery pathways to optimize overall annual heat utilization at the facility.
In this application, the single large 20,000 cfm central air handler for the facility (i.e., the Munters unit) makes it easier to use waste heat from the turbine to meet the space heating loads. The space heating loads are expected to be significant in this application due to the year-round space cooling load imposed by the refrigerated display cases. The need for heat to provide desiccant regeneration also adds significant heating loads in the summer.
At this site, therefore, PG fluid from the Capstone Unifin heat recovery unit will provide heat to two hot coils that have been added to the Munters air handling unit: (1) A PG coil in the supply air stream that provides space heating in the winter, and (2) A PG coil that preheats the air entering the direct-fire burner that regenerates the desiccant wheel. This arrangement with the Unifin heat exchanger was selected because it provides the greatest amount of year-round heat recovery, primarily due to the large space heating loads that can be met in this climate. The Unifin heat exchanger recovers heat from the microturbine exhaust that is used by the Munters unit to provide either space heating or desiccant regeneration. The PG fluid piping from the Unifin is directly connected to hot PG fluid coils in the Munters unit. The microturbine skid, which includes the Capstone turbine, Unifin heat exchanger, and natural gas compressor module, is installed on the roof adjacent to the Munters air handling unit (approximately 35 feet apart).
1.4.2 Description of the Munters HVAC Air Handling Unit
Table 1-3 provides an overview of the Munters HVAC Air Handling Unit installed at the site. A schematic of the unit is provided in Figure 1-5.
Table 1-3. Overview of Munters HVAC Unit Specifications
Cooling Capacity (tons) 57 Dehumid. (lb/hr) 263 Supply Airflow (cfm) 20,000 Vent Airflow (cfm) 5,500 Gas Heating (MBtu/hr) 1,208 Regeneration Inlet Temperature (°F) 250
1-7

Figure 1-4. Schematic of the Munters HVAC Air Handling Unit
The dark arrows in Figure 1-5 show the air path through the Munters unit. Return air from the space and makeup air from outdoors mix at the center plenum of the unit as shown. If dehumidification is required – as indicated by a humidistat located in the space – some mixed air (mostly outdoor air) is pulled through the desiccant unit by the process fan. This dry process air is then returned over top of the desiccant module back into the top of the center plenum. The supply fan pulls air from the center plenum through a cooling coil (DX Coil in Figure 1-4) and then through the heating section of the unit. When dehumidification is not required, all the mixed air bypasses the desiccant wheel and is pulled through the cooling coil directly.
1.5 PERFORMANCE VERIFICATION PARAMETERS
The verification test is scheduled to take place during the Fall of 2002. The primary objective of the test is to verify the CHP system’s power and heat production performance, electrical power quality, and emissions performance. The approach selected for testing is intended to evaluate the performance of the CHP system only, and not the specific operational or management strategy of the host supermarket or its installed Munters air handling unit.
Performance testing will be conducted at the electrical loads summarized in Table 1-4. The base load testing will be performed under conditions of maximum available heat use. At the request of collaborating partners, two tests will be added without heat recovery, that is, with the heat bypass damper open. The tests with the damper open are intended to investigate the effect of the heat exchanger back-pressure on the microturbine performance.
Potential users are likely to be interested in the maximum heat recovery potential such that full benefits of the cogeneration systems can be utilized. To verify maximum heat recovery potential at the four loads, heat use will be maximized. If the space heating demand is low during the test period, the hot PG fluid
1-8

will be routed to the dessicant wheel even though the dehumidification load is not expected to require its operation. The gas burner will be left off in this event.
Table 1-4. Verification Test Matrix
Load Testing – Microturbine CHP System
Test Condition (Percent of Rated
Power Output)
Microturbine Power Setting
(kW)
No of Replicate Test
Runs Executed
Duration of Each Test Run Power, Heat,
and Efficiency Determination
CO, NOX, THC, CO2, and CH4 Emissions
Unifin Heat Recovery
Mode 100 60 3 30 mins 30 mins Maximum 75 45 3 30 mins 30 mins Maximum 50 30 3 30 mins 30 mins Maximum 25 15 3 30 mins 30 mins Maximum
100 60 3 30 mins 30 mins damper open 50 30 3 30 mins 30 mins damper open
Testing at Normal Site Operating Conditions Microturbine Power Setting
(kW) Duration of Testing
Total Energy Generated and Power Quality Performance Evaluation 60 2 - 4 weeks
As shown in the verification test matrix (Table 1-4), three test runs, each lasting about 0.5-hour, will be executed at the four electrical loads. The entire load testing for the system will take about 2 days to complete. The microturbine CHP system will be allowed to stabilize at each load for 15 to 30 minutes before changing the loads. During each load test, simultaneous monitoring for power output, heat recovery rate, fuel consumption, ambient meteorological conditions, exhaust stack emission rate, and pollutant concentrations in the exhaust stack will be performed. Average electrical power output, heat recovery rate, energy conversion efficiency (electrical, thermal, and net), and exhaust stack concentration and emission rates will be reported for each load factor. Emission results for the following pollutants will be reported: CO2, CH4, NOX, CO, and total hydrocarbons (THCs). Annual emission reductions for CO2 and NOX will be estimated by using the full load emission rates and annual electricity offsets from the power grid.
In addition to the load testing, verification data will be collected during normal site operations, during which the microturbine will be operated at maximum electrical power output (60 kW nominal). The verification approach has been designed with this operating schedule in mind, and consists of extended monitoring of electric power generated, heat recovered, fuel consumed, ambient meteorological conditions, and power quality for a test period of at least two weeks. The extended monitoring results will be used to report total electrical energy generated, total thermal energy recovered, and average power quality data.
The parameters to be verified are listed below, followed by a brief description of each. Detailed descriptions of measurement and analysis methods are presented in Section 2.0, and data quality assessment procedures for each verification parameter are presented in Section 3.0.
1-9

Verification Parameters
Power and Heat Production Performance Electrical power output at selected loads, kWHeat recovery rate at selected loads, Btu/hr, kWElectrical efficiency at selected loads, %Thermal energy efficiency at selected loads, %Combined heat and power production efficiency at selected loads, %Parasitic consumption of gas booster compressor, kW
Electrical Power Quality Performance Electrical frequency, HzPower factor, %Voltage total harmonic distortion (THD), %Current THD, %
Air Pollutant Emission Performance CO, NOX, THCs, CO2, and CH4 concentrations at selected loads, ppmv, % CO, NOX, THCs, CO2, and CH4 emission rates at selected loads, lb/hr, lb/Btu,
lb/kWh Changes in CO, NOX, THCs, CO2, and CH4 emission rates at selected loads due to Unifin
damper position
Emission Reductions
Estimated annual NOX emission reductions, lb NOX/yrEstimated annual GHG emission reductions, lb CO2/yr
1.5.1 Power and Heat Production Performance
Power production performance represents a key operating characteristic that is of great interest to purchasers, operators, and users of these systems. The GHG Center will install a wattmeter to measure the electrical power generated by the microturbine. Fuel input will be determined using flow meters that will monitor the natural gas flow rate. Fuel gas sampling and energy content analysis (via gas chromatography) will be conducted to determine the LHV of the fuel.
Thermal energy recovery rate is defined as the amount of heat recovered by the microturbine/heat exchanger system. Heat recovery rates will be verified by metering the flow rate, hot (supply) and cold (return) temperatures of the PG fluid. The heat recovery rate measured at full load will represent maximum heat recovery potential of the microturbine system.
Fuel energy-to-electricity conversion efficiency will be determined by dividing the average electrical power output by the heat input. Similarly, thermal energy conversion efficiency will be determined by dividing the average heat recovered by the heat input. CHP production efficiency, or net system efficiency, will be reported as the sum of electrical and thermal efficiencies at each operating load. The net efficiency reported will include the parasitic load introduced by the gas booster compressor. For informational purposes, the GHG Center will measure and report the power drawn by the compressor during the verification. This information will be useful to potential users having high-pressure fuel gas on
1-10

site. Ambient temperature, relative humidity (RH), and pressure will be measured throughout the verification period to support determination of electrical conversion efficiency.
A detailed discussion of sampling procedures, analytical procedures, and measurement instruments related to heat and power production performance parameters is provided in Section 2.2.
1.5.2 Power Quality Performance
The monitoring and determination of power quality performance is required to insure compatibility with the electrical grid, and to demonstrate that the electricity will not interfere with or harm microelectronics and other sensitive electronic equipment within the supermarket. Power quality data is used to report exceptions, which describe the number and magnitude of incidents that fail to meet or exceed a power quality standard chosen. The Institute of Electrical and Electronics Engineers’ Recommended Practices and Requirements for Harmonic Control in Electrical Power Systems (IEEE 1993) contains standards for power quality measurements that will be followed. Power quality parameters will be determined over the two to four weeks of normal operation test conditions. The same wattmeter used to measure electric power output will be used to measure the power quality parameters listed earlier. The technical approach for verifying these parameters is described in Section 2.3.
1.5.3 Air Pollutant Emission Performance
The measurement of the emissions performance of the microturbine are critical to any assessment of the environmental impact of the technology. Emissions testing for all pollutants will be conducted simultaneously with the efficiency determinations. Emission tests at each load will be repeated three times. This triplicate measurement design is based on U.S. EPA New Source Performance Standards (NSPS) guidelines for measuring emissions from stationary gas turbines (EPA 1999). In addition to the emission rate determinations during the load testing, a test will be conducted to develop an emissions profile of the microturbine throughout its useful range of operation (approximately 15 to 60 kW). During this emissions profile test, smaller segments of emissions data will be obtained at more closely spaced operating set points. This test will develop a comprehensive emissions profile as a function of power output, and identify any peaks in emissions that would otherwise have been missed during the four load points identified for efficiency determinations. Concentration and emission rate measurements for CO, NOX, THCs, CO2, and CH4 will be conducted in the heat exchanger exhaust stack at the selected operating loads. Exhaust stack emission testing procedures, described in U.S. EPA’s NSPS for stationary gas turbines, will be adapted to verify the verification parameters listed earlier. Concentration measurements will be reported in units of parts per million volume, dry basis (ppmvd) and corrected for 15 percent O2 at the microturbine. Emission rates will be reported in units of mass/hour, mass/heat input, and mass/power output. A detailed discussion of sampling procedures, analytical procedures, and measurement instruments is provided in Section 2.4.
1.5.4 Emission Reductions
For CO2 and NOX, annual emission reductions will be estimated and reported by subtracting emissions of the on-site CHP unit from emissions associated with a baseline electrical power generation technology. It will be assumed that on-site CHP electrical power will reduce the need for the same amount of electricity from the local grid, after adjusting grid power needs upward to account for transmission line losses. The subtraction of the annual estimated emissions from the on-site unit from the annual estimated emissions associated with the mix of power stations serving the grid, will yield an estimate of the annual CO2 and NOX emission reduction. Annual estimates of emissions will be determined based on measured emission rates at full load, and on-site electrical energy demand provided by Waulbaums. The procedures for
1-11

estimating emission reduction from utility grid electricity production are provided in Section 2.5. Similarly, emission reductions will also be computed based on the reduction in the natural gas consumption of the Munters unit that is realized as a result of the unit’s utilization of excess heat generated by the microturbine and transferred to it by the Unifin heat exchanger. In this case offsets will be calculated both for the projected heat use of the system installed at the existing site, and for the maximum heat recoverable from the system in a projected space- heating application.
1.6 ORGANIZATION
Figure 1-5 presents the project organization chart. The following section discusses functions, responsibilities, and lines of communications for the verification test participants.
Figure 1-5. Project Organization
SRI’s GHG Center has overall responsibility for planning and ensuring the successful implementation of this verification test. The GHG Center will ensure that effective coordination occurs, schedules are developed and adhered to, effective planning occurs, and high-quality independent testing and reporting occur.
Mr. Stephen Piccot is the GHG Center Director. He will ensure the staff and resources are available to complete this verification as defined in this Test Plan. He will review the Test Plan and Report to ensure they are consistent with ETV operating principles. He will oversee the activities of the GHG Center staff,
1-12

and provide management support where needed. Mr. Piccot will sign the Verification Statement, along with the EPA-ORD Laboratory Director.
The GHG Center’s Ms. Sushma Masemore will have the overall responsibility as the Project Manager. She will be responsible for overseeing field data collection activities of the GHG Center’s Field Team Leader, including assessment of DQOs prior to completion of testing. Ms. Masemore will follow the procedures outlined in Sections 2.0 and 3.0 to make this determination, and she will have the authority to repeat tests as determined necessary to ensure that data quality goals are met. Should a situation arise during testing that could affect the health or safety of any personnel, Ms. Masemore will have full authority to suspend testing. She will also have the authority to suspend testing if quality problems occur. In both cases, she may resume testing when problems are resolved. Ms. Masemore will be responsible for maintaining communication with the OEMC team, EPA, the GHG Center, and stakeholders.
Mr. William Chatterton will serve as the Field Team Leader, and will support Ms. Masemore’s data quality determination activities. Mr. Chatterton will provide field support for activities related to all measurements and data collected. He will install and operate the measurement instruments, supervise and document activities conducted by the emissions testing contractor, collect gas samples and coordinate sample analysis with the laboratory, and ensure that QA/QC procedures outlined in Section 2.0 are followed. He will submit all results to the Project Manager, such that it can be determined that the DQOs are met. He will be responsible for ensuring that performance data collected by continuously monitored instruments and manual sampling techniques are based on procedures described in Section 4.0.
SRI’s Quality Assurance Manager, Dr. Ashley Williamson, will review this Test Plan. He will also review the results from the verification test, and conduct an Audit of Data Quality (ADQ), described in Section 4.4.4. Dr. Williamson will report the results of the internal audits and corrective actions to the GHG Center Director. The results will be used to prepare the final Report.
Mr. Dana Levy of NYSERDA and Mr. Hugh Henderson CDH Energy Corporation will serve as the primary contact persons for the NYSERDA verification team. They will provide technical assistance, assist in the installation of measurement instruments, and coordinate operation of the microturbine at the test site. They will ensure the units are available and accessible to the GHG Center for the duration of the test. They will also review the Test Plan and Reports and provide written comments.
EPA-ORD will provide oversight and QA support for this verification. The APPCD Project Officer, Dr. David Kirchgessner, is responsible for obtaining final approval of the Test Plan and Report. The APPCD QA Manager reviews and approves the Test Plan and the final Report to ensure they meet the GHG Center QMP requirements and represent sound scientific practices.
1.7 SCHEDULE
The tentative schedule of activities for testing is:
VERIFICATION TEST PLAN DEVELOPMENT GHG Center Internal Draft Development July 22 - August 16, 2002 NYSERDA, Vendor and Host Site Review/Revision August 18 - October 3, 2002 EPA and Industry Peer-Review/Revision October 7 – November 29, 2002 Final Test Plan Posted November 29, 2002
1-13

VERIFICATION TESTING AND ANALYSIS Measurement Instrument Installation/Shakedown Field Testing Data Validation and Analysis
VERIFICATION REPORT DEVELOPMENT GHG Center Internal Draft Development Vendor and Host Site Review/Revision EPA and Industry Peer-Review/Revision Final Report Posted
January 2003 January 2003 February 3 – February 14, 2003
February 3 – March 7, 2003 March 10 – March 21, 2003 March 31 – April 18, 2003 May 2, 2003
1-14

2.0 VERIFICATION APPROACH
2.1 OVERVIEW
Microturbine CHP systems are a relatively new technology, and the availability of performance data is limited and in great demand. The GHG Center’s Stakeholder groups and other organizations concerned with DG have a specific interest in obtaining verified field data on the emissions, and technical and operational performance of microturbine systems. Performance parameters of greatest interest include electrical power output and quality, thermal-to-electrical energy conversion efficiency, thermal energy recovery efficiency, exhaust emissions of conventional pollutants and GHGs, GHG emission reductions, operational availability, maintenance requirements, and economic performance. The test approach described here focuses on assessing those performance parameters of significant interest to potential future customers of Capstone 60 Microturbine systems. Long-term evaluations cannot be performed with available resources so economic performance and maintenance requirements will not be evaluated.
In developing the verification strategy, the GHG Center has applied existing standards for large gas-fired turbines, engineering judgement, and technical input from the verification team. Electrical power output and efficiency determination guidelines in the American Society of Mechanical Engineers Performance Test Code for Gas Turbines, PTC-22-1997 (ASME 1997) have been adopted to evaluate electric power production and energy conversion efficiency performance. Some variations in the PTC-22 requirements were made to reflect the small scale of the microturbine. The strategy for determining thermal energy recovery was adopted from guidelines described in American National Standards Institute/American Society of Heating, Refrigeration and Air-Conditioning Engineers Method of Testing Thermal Energy Meters for Liquid Streams in HVAC Systems (ANSI/ASHRAE, 1992). Exhaust stack emissions testing procedures, described in U.S. EPA’s New Source Performance Standards (NSPS), Standards of Performance for Stationary Gas Turbines, 40CFR60, Subpart GG (EPA 1999) have been adopted for GHG and criteria pollutant emissions testing. Power quality standards used in this verification are based on the Institute of Electrical and Electronics Engineers Recommended Practices and Requirements for Harmonic Control in Electrical Power Systems (IEEE, 1993).
Tests at four operating loads (25, 50, 75, and 100 percent) and continuous monitoring during the twoweek test period will be performed to address the following verification factors:
• Power and Thermal Energy Production Performance • Electrical Power Quality Performance • GHG and Conventional Air Pollutant Emission Performance
Figure 2-1 illustrates the measurement system to be employed. Following is a brief discussion of each verification factor and their method of determination. Detailed descriptions of testing and analytical methods are provided sequentially in Sections 2.2 through 2.5.
2-1

Figure 2-1 Schematic of Measurement System
Gas Temperature T
Gas Rosemount Orifice Fuel CompressorGas Flow Meter Power Meter Compressor Gas In
Power Meas. 7500 ION Gas Sampling
Port
Ambient Sensors CapstoneTemperature Air 60 kWPressure Microturbine Unifin HeatRelative Humidity Exchanger Stack
Turbine Exhaust Exhaust to Emissions Atmosphere Testing
T1 T2
Energy Meter Controlotron
Power Meas. Turbine Power7600 ION Meter
PG Fluid Sampling Port
PG Fluid Supply PG Fluid Return
Utility Heat and Power To FacilityGrid
Power and Heat Production Performance
Power production performance represents a class of microturbine/CHP system operating characteristics that are of great interest to purchasers, operators, and users of these systems. Parameters that will be characterized on the test unit include:
• Electrical power output at selected loads, kW • Electrical efficiency at selected loads, % • Heat recovery rate at selected loads, MMBtu/hr • Thermal energy efficiency at selected loads, % • CHP production efficiency, % • Parasitic power losses from gas booster compressor, kW
Each of the power production, heat production, and efficiency parameters listed above represent the net performance of the overall Capstone 60 power and heat production system and are calculated using the net power and heat delivered to the facility. Parasitic losses due to the gas booster compressor, the PG circulation pump, and other internal electronics will be included in the power output, heat production, and efficiency performance results reported as a result of this verification.
2-2

The GHG Center will install a watt meter to measure the electrical power generated by the turbine. Fuel input will be determined using a gas flow meter which will monitor the natural gas flow rate. Fuel gas sampling and energy content analysis (via gas chromatography) will be conducted to determine the LHV of the fuel.
The heat recovery rate of the Capstone 60 Microturbine is defined as the amount of heat recovered from the turbine exhaust, and the Munters air handling unit will have or create sufficient demand to use all of the heat recovered. Actual maximum performance of the Capstone 60 system may be higher or lower at different installations and under various ambient conditions. In addition, a detailed system optimization would be required during the Center's testing activities to determine the maximum heat recovery at this site. However, the thermal demands from this facility (demand associated with space heating and/or desiccant regeneration) are expected to exceed the design specifications of the CHP system for heat recovery. The verification is scheduled for winter months when the space heating demand is highest and therefore, the it is highly likely that the heat recovery rate measured during the full load tests will be at or at least near the maximum for this facility. This rate will be used to compute GHG and NOX emission reductions for sites that are able to fully utilize all energy recoverable with the Capstone 60 Microturbine system (Section 2.5).
Heat recovery rates will be verified by metering the flow, differential temperatures, and physical properties of the heat transfer fluid. The heat transfer fluid is a 50 percent mixture of PG and water. The PG fluid flow rate and temperatures will be measured with an energy meter provided by the GHG Center (Figure 2-1). Manual samples of the PG fluid will be collected and analyzed to determine PG concentration. These results will be used to assign fluid density and specific heats, such that heat recovery and use rate can be calculated at actual conditions.
Fuel energy-to-electricity conversion efficiency will be determined by dividing the average electrical power output by the heat input. Similarly, thermal energy conversion efficiency will be determined by dividing the average heat recovered by the heat input. CHP production efficiency or net system efficiency will be reported as the sum of electrical and thermal efficiencies at each operating load. The net efficiency reported will include the parasitic load introduced by the gas booster compressor, the PG fluid circulation pump, control electronics, and any other parasitic loads within the Capstone 60 system, from the point of low-pressure gas delivery to the store’s main switch panel. For informational purposes, the GHG Center will measure and report the power drawn by the compressor intermittently during the verification. Ambient temperature, relative humidity, and pressure will be measured throughout the verification period to support determination of electrical conversion efficiency as required in PTC-22.
A detailed discussion of sampling procedures, analytical procedures, and QA/QC procedures related to heat and power production performance parameters is provided in Section 2.2.
Power Quality Performance
The monitoring and determination of power quality performance is required to ensure compatibility with the electrical grid, and to demonstrate that the electricity will not interfere with, or harm microelectronics and other sensitive electronic equipment within the facility. Power quality data is used to report exceptions, which describe the number and magnitude of incidents that fail to meet or exceed a power quality standard chosen. The IEEE Recommended Practices and Requirements for Harmonic Control in Electrical Power Systems (IEEE, 1993) contains standards for power quality measurements that will be followed here. Power quality parameters will be determined over the 2 to 4 week extended test period using the electric power meter installed by the GHG Center. The approach for verifying these parameters is described in Section 2.3. Power quality variables to be examined include:
2-3

• Electrical frequency, Hz • Voltage, volts • Power factor , % • Voltage and current total harmonic distortion (THD), %
Emissions Performance
The measurement of the emissions performance of the microturbine system is critical to the determination of the environmental impact of the technology. Emission rate measurements for CO, carbon dioxide (CO2), methane (CH4), NOX, and THCs will be conducted in the Unifin heat exchanger exhaust stack during controlled test periods at various operating loads. These tests will be conducted while maximizing heat recovery potential, and repeated at full load and 50 percent load with the Unifin heat exchanger dampers open. Exhaust stack emission testing procedures, described in U.S. EPA’s NSPS for stationary gas turbines (EPA 1999), will be adapted to verify the following verification parameters at the selected loads:
• CO Concentration (ppmv) and Emission Rates, (lb/hr, lb/Btu, lb/kWh) • CO2 and CH4 Emission Rates (lb/hr, lb/Btu, lb/kWh) • NOX Concentration (ppmv) and Emission Rates (lb/hr, lb/Btu, lb/kWh) • THCs Concentration (ppmv) and Emission Rates (lb/hr, lb/Btu, lb/kWh) • Estimated NOX emission reductions for Waldbaums Supermarket (lb NOx/yr) • Estimated GHG emission reductions for Waldbaums Supermarket (lb CO2/yr)
For the conventional pollutants listed above, emission rates (e.g., mass/hour, mass/heat input, mass/power output) will be measured and reported. CO2 and CH4 emission rates will also be measured. CO2 emissions from the system will be calculated for the verification period using measured GHG emission rates, operating hours, and thermal/electrical generation and use data.
The verification will report GHG and NOX emission reduction estimates based on actual emissions and reductions for Waldbaums Supermarket. The Capstone 60 Microturbine emissions will be compared to emissions from a baseline system. The baseline system is that which would have been installed to meet the site’s energy needs in the absence of the Capstone 60 Microturbine system. For this application, the baseline system defined for Waldbaums Supermarket consists of electricity supplied by the New York state utility grid and thermal energy supplied by the natural gas-fired burners in the Munters air handling unit. Subtraction of the annual Capstone 60 Microturbine’s emissions from the baseline emissions yield an estimate of the emission reduction for the facility.
The procedures for estimating emission reduction from utility grid electricity production are provided in Section 2.5.2. GHG emissions for the standard gas-fired boiler will be determined by estimating fuel needed to generate equivalent amounts of heat with the Munters’ natural gas-fired burners. Detailed procedures for estimating annual emission reduction from thermal energy production is provided in Section 2.5.3.
2.2 POWER AND HEAT PRODUCTION PERFORMANCE
The Capstone 60 Microturbine system will be evaluated for the performance factors listed above at the four specified operating loads. The loads selected bound the range expected to occur at the Waldbaums Supermarket. A step-by-step procedure for conducting the test is provided in Appendix A-1, and a log
2-4

form associated with this activity is provided in Appendix A-2. The test period at each load is expected to be 30 minutes in duration, and will be repeated three times. The triplicate measurement design is based on U.S. EPA NSPS guidelines for measuring emissions from stationary gas turbines (EPA 1999). The following sections discuss the measurements, calculations, and associated determinations in detail.
2.2.1 Electrical Power Output and Efficiency Determinations
Simultaneous measurements of electric power output, heat recovery rate, heat use rate, fuel consumption, ambient meteorological conditions, and exhaust emissions will be performed during testing at each load to determine electrical power output and efficiency. These determinations will reflect the net power and efficiency and will include the parasitic losses from the booster compressor. The time-synchronized measurements data will be used to compute electrical efficiency as specified in PTC-22. PTC-22 mandates using electric power data collected over time intervals of not less than 4 minutes and not greater than 30 minutes (PTC-22, Section 3.4.3 and 4.12.3) to compute electrical efficiency. This restriction minimizes electrical efficiency determination uncertainty due to changes in operating conditions (e.g., turbine speed, ambient conditions). Within this time period, PTC-22 specifies the maximum permissible limits in power output, power factor, fuel input, and atmospheric conditions to be less than the values shown in Table 2-1. The GHG Center will use only those time periods that meet these requirements to compute performance parameters. Should the variation in power output, power factor, fuel flow, or ambient conditions exceed the levels, the load test will be considered invalid and the test will be repeated.
Table 2-1. Permissible Variations in Power, Fuel, and Atmospheric Conditions
Measured Parameter Maximum Permissible Variation Ambient air temperature ± 4 oF Barometric pressure ± 0.5 % Fuel flow ± 2 % Power factor ± 2 % Power output ± 2 %
Electrical efficiency at the selected loads will be computed as shown in Equation 1 (per ASME PTC-22, Section 5.3).
14. 3412 kWη = (Eqn. 1)HI
Where:η = efficiency (%)kW = average electrical power output (kW), Equation 2HI = average heat input using LHV (Btu/hr), Equation 33412.14 = convert kW to Btu/hr
Average electrical power output will be computed as the mathematical average of the 1-minute instantaneous readings over the sampling duration specified in PTC-22 (4 to 30 minutes), as shown in Equation 2.
2-5

nr
∑ kWi
kW = i=1 (Eqn. 2) nr
Where: kW = average electrical power output (kW) kWi = instantaneous reading of the kW sensor at each minute (kW) nr = number of 1-minute readings logged by the kW sensor
The average heat input will be determined using data collected with a mass flow meter and a gas chromatograph. The flow meter will be installed in the fuel supply line of the Capstone 60 Microturbine, and will be programmed to continuously monitor and record 1-minute flow readings. Fuel gas samples will be collected by the GHG Center at a frequency of at least two per day during the load testing. Based on the GHG Center's experience during similar verifications, the heating value of the natural gas is not expected to vary greatly at the site and therefore, this sampling frequency is considered to be adequate for determining efficiency. The gas samples will be shipped to a certified laboratory for compositional analysis in accordance with ASTM Specification D1945, and LHV determination using ASTM Specification D3588. Using the fuel flow rate data and the LHV results, average heat input will be computed as shown in Equation 3.
HI = 60 Fm LHV (Eqn. 3)
Where:HI = average heat input using LHV (Btu/hr)Fm = average volumetric flow rate of natural gas to turbine (scfm)LHV = average LHV of natural gas (Btu/scf)
Power Output Corrections for Standard Conditions
The above calculations reflect power output and efficiency results at actual site conditions (i.e., temperature, pressure, and relative humidity observed during testing). For assessing the performance of this technology in different geographic regions, it is useful to correct the actual test data to standard conditions. A standard temperature of 60 oF, barometric pressure of 14.7 pounds per square inch absolute (psia), and a relative humidity of 60 percent, as defined by the International Organization of Standards (ISO 2314: 1989), is often used to correct for standard conditions.
Because it is unlikely ISO conditions will be encountered during the verification, directly verified performance results will not be obtainable at standard conditions. For readers interested in such data, the GHG Center will obtain from Capstone derated performance curves which allow conversion of the verified data to standard conditions. This data will be presented in a separate section of the final Report, and because the charts were not developed by the GHG Center readers of this section will be informed that the results have not been verified by the GHG Center.
2-6

7600 ION Electrical Meter
The electric power output to the system will be measured by a digital power meter, manufactured by Power Measurements Ltd. (Model 7600 ION). The 7600 ION will continuously monitor the kW of real power at a rate of one reading per second, averaged at 1-minute intervals. It will be installed such that the electricity measured is the electricity that is ultimately used by the site or supplied to the utility grid. The power output measured with the 7600 ION will be slightly less than actual power generated by the turbine, and will account for losses in the transformer. The GHG Center’s data acquisition system (DAS) will download and store the 7600 ION data. Further discussion of the communication and data acquisition is provided in Section 4.0. After installation the meter will continuously operate unattended, and will not require further adjustments. QA/QC procedures associated with instrument setup, calibration, and sensor function checks are discussed below. The meter will be factory calibrated to IEC687 SO.2 and ANSI C12.20 CAO.2 standards for accuracy. Details regarding this calibration and additional QA/QC checks on this instrument are provided in Section 3.2.
Rosemount Gas Flow Meter
A Rosemount gas flow meter consisting of a mass flow transmitter (Model 3095), and an integral orifice plate (Model 1195) will determine the fuel flow rate. The meter will contain an orifice plate which will enable flow measurements to be conducted at the ranges expected during testing (7 to 15 scfm natural gas). The meter will be temperature- and pressure-compensated, providing volumetric flow in units of scfm at standard conditions (60 oF, 14.7 psia). The meter will continuously monitor gas flow, and will be capable of providing an accuracy of ± 1 percent of reading. The meter will be fitted with a transmitter providing a 4 to 20 mA output over the meter’s range. The GHG Center’s DAS will convert the analog signals to digital format and then store the data as 1-minute averages. The meter will be factory calibrated to IEC687 SO.2 and ANSI C12.20 CAO.2 standards for accuracy. Details regarding this calibration and additional QA/QC checks on this instrument are provided in Section 3.2.2.
Fuel Heating Value Measurements
Fuel heating value measurements will be conducted to determine the actual LHV of natural gas, such that electrical and thermal efficiency calculations can be performed. Samples will be collected at an access port in the fuel line located prior to the flow meter (Figure 2-1). The port is downstream of a ball valve and consists of 0.25-inch NPT union. Gas samples will be manually collected in stainless steel canisters provided by the analytical laboratory. The canisters are 600-ml vessels with valves on the inlet and outlet sides. Prior to sample collection, canister pressure will be checked using a vacuum gauge to document that the canisters are leak free. Canisters that are not fully evacuated upon receipt from the laboratory will not be used for testing. During testing, the connections between the canisters and the fuel sampling port will be screened with a hand-held hydrocarbon analyzer to check for leaks in the system. In addition, the canisters will be purged with fuel for 15 to 30 seconds to ensure that a pure fuel sample is collected. Appendix A-3 contains detailed procedures that will be followed, and Appendices A-4 and A-5 contains sampling log and chain-of-custody forms.
Two preliminary gas analyses will be obtained from the gas supplier prior to the test period to characterize gas composition. The average value of these analyses will be used to program the mass flow meter during instrument installation. (Section 3.2.2) During verification testing, a minimum of two gas samples will be collected each day during the load tests, and two per week during the extended monitoring period. This sampling frequency is expected to be sufficient because during previous verifications conducted by the GHG Center, daily variation in pipeline quality gas composition has been less than one percent. The collected samples will be returned to the laboratory for compositional analysis
2-7

in accordance with ASTM Specification D1945 for quantification of methane (C1) to hexanes plus (C6+), nitrogen (N2), oxygen (O2), and CO2.
During analysis, sample gas will be injected into a Hewlett Packard 589011 gas chromatograph (GC) equipped with a silicon and molecular sieve column. Components will be physically separated on the columns and their concentrations measured with a flame ionization detector (FID). The resultant areas under each peak will be compared to the corresponding calibration data. Data will be acquired and recorded by a Hewlett Packard 339611 integrator. The useful range of the detectable concentrations (mole percent) is specified in Table 1 of the method (D1945). Appendix C-1 presents an example analytical report for gas composition. The GC is calibrated weekly as a continuing calibration verification check using a certified natural gas standard. Details regarding this calibration and additional QA/QC checks on gas sampling and analysis are provided in Section 3.2.4.
Ambient Conditions Measurements
Meteorological data will be collected to determine if the maximum permissible limits for determination of electrical efficiency are satisfied (Table 2-1). The ambient meteorological conditions (temperature, relative humidity, and barometric pressure) will be monitored using a Setra pressure sensor and a Vaisala Model HMD 60YO integrated temperature/humidity unit located in close proximity to the air intake of the turbine. The integrated temperature/humidity unit uses a platinum 100 Ohm, 1/3 DIN resistance temperature detector (RTD) for temperature measurement. As the temperature changes, the resistance of the RTD changes. This change in resistance is detected and converted by associated electronic circuitry that provides a linear DC (4 to 20mA) output signal.
The integrated unit uses a thin film capacitive sensor for humidity measurement. The dielectric polymer capacitive element varies in capacitance as the relative humidity varies, and this change in capacitance is detected and converted by internal electronic circuitry that provides a linear DC (4 to 20mA) output signal. This sensor features electronic compensation to maintain accuracy over a broad range of temperature conditions.
The barometric pressure is measured by a variable capacitance sensor. As pressure increases, the capacitance decreases. This change in capacitance is detected and converted by internal electronic circuitry that provides a linear DC (4 to 20 mA) output signal. The range and accuracy of each sensor are given in Table 3-2. The response time of the temperature and humidity sensors is 0.25 seconds and the response time of the pressure sensor is under two seconds. The GHG Center’s DAS will convert the analog signals to digital format and then store the data as 1-minute averages.
Electrical efficiency determinations require variability in ambient temperature and barometric pressure to be less than ± 4 oF and ± 0.5 percent, respectively. The instruments selected for the verification are capable of providing ± 0.2 oF for temperature and ± 0.06 percent for barometric pressure, which exceed the PTC-22 requirements for meteorological data. The temperature and humidity measurement equipment will be factory calibrated to National Institute for Standards and Technology (NIST)-traceable standards for accuracy. Details regarding this calibration and additional QA/QC checks on these instruments are provided in Table 3-3 in Section 3.2.
Parasitic Losses from Booster Compressor
The Capstone 60 microturbine requires a gas supply at a minimum pressure of 60 psig. For installations where gas supply is at lower pressures such as this test facility, a booster compressor is needed to pressurize the supplied gas to an acceptable level. This is accomplished here using the Copeland-Scroll
2-8

gas booster compressor which is powered using electricity generated by the microturbine and therefore creating a parasitic load.
The efficiency determinations described for this verification account for energy consumed by the booster compressor. To make the results of a verification test applicable to installations where high-pressure gas may be available (e.g., gas transmission compressor stations), it is necessary to measure the power consumed by the electrical booster compressor. This will enable readers to compute electrical efficiency based on the gross power output of the microturbine, independent of the gas compressor. In addition, it enables readers to examine the microturbine efficiency ratings on the same basis as the ratings that are reported for similar technologies.
To measure the power requirements of the compressor, a separate power meter will be placed where the electrical motor powering the compressor is located. The power meter will be a Power Measurements 7500 ION, a meter that has the same power output measurement capabilities as the 7600 ION previously described. During each of the load test periods, the power consumed (kW) by the compressor will be monitored at the same sampling rate as the power delivered by the unit (one reading per second with oneminute averaging). The sum of the readings from the two power meters represent the gross power output without the booster compressor.
2.2.2 Heat Recovery Rate and Thermal Efficiency Measurements
An energy meter will be used to monitor and record the thermal energy generated by the Capstone 60 Microturbine system. The GHG Center will use a portable Controlotron Model 1010EP1 to measure the volume of working fluid circulated through the heat exchanger and its supply and return temperatures. As shown in Figure 2-1, the temperature readings at T1 and T2 will be used to compute heat recovered by the Capstone 60 Microturbine system. System heat recovery rates are computed according to ANSI/ASHRAE Standard 125 (ANSI/ASHRAE 1992), as follows:
Qavg (Btu/min) = V ρ Cp (T1-T2) (Eqn. 4)
Where:Qavg = average heat recovered (Btu/min)V = total volume of PG fluid passing through the system during a minute (ft3)ρ = density of PG fluid (lb/ft3), for the avg. fluid temp. (T2+T1)/2Cp = specific heat of liquid (Btu/lb °F), evaluated at the avg. fluid temp. (T2+T1)/2T1 = temperature of heated PG fluid exiting heat exchanger, (oF)T2 = temperature of cooled PG fluid entering heat exchanger (oF), Figure 2-1
The heat recovery performance of the Capstone 60 Microturbine system will be a function of the return PG fluid temperature and the overall heat demand associated with the system. With the verification being conducted during winter months, the heat demand of the store will exceed the Capstone 60 system's heat recovery capability. Therefore, the maximum average heat recovery rate measured during the full load testing will represent the heat recovery rate that is at or near the maximum heat recovery potential of the system at this site. The reader is cautioned that many variables exist that may impact the reported maximum heat recovery rate at other locations. These factors include heat demand profiles, changes in environmental conditions, system integration, and system engineering and maintenance.
2-9

The heat recovery rate determination requires physical properties of the heat transfer fluid at actual operating temperatures to be defined. To specify these properties, it is necessary to accurately characterize the composition of the PG fluid, and select published density and specific heat data from reliable sources (ASHRAE publications). The fluid used in the heat recovery unit is a 50 percent mixture of PG in water. Samples of this fluid will be collected during the verification and analyzed for PG content. Appendices A-7 and A-8 provide an example of mixture density and specific heat data as a function of temperature for systems that use a mixture of PG and water. The GHG Center will use ASHRAE published data to interpolate working fluid properties at the conditions encountered during testing, and to compute heat recovery rates.
The time intervals for reporting average heat recovered and thermal efficiency at the selected loads will correspond to those used in computing electrical efficiency. The following equation will be used to compute thermal efficiency:
ηT = 60 * Qavg / HI (Eqn. 5)
Where:ηT = thermal efficiency (%)Qavg = average heat recovered (Btu/min)HI = average heat input using LHV (Btu/hr), Equation 3
Controlotron Energy Meter
The Controlotron (Model 1010EP1) energy meter is a digitally integrated system that includes a portable computer, ultrasonic fluid flow transmitters, and 1,000 ohm platinum RTDs. The system has an overall rated accuracy of ± 1 to 2 percent of reading depending on the application characteristics described below. The system can be used on pipe sizes ranging from 0.25 to 360 inches in diameter with fluid flow rates ranging from 0 to 60 feet per second (fps) (bi-directional).
The flow transducers are surface mounted units that operate on an ultrasonic transit-time principle. They have a rated sensitivity of 0.001 fps and repeatability of 0.25 percent. Transit-time signals are reported to the flow computer at intervals in the millisecond range and converted in the computer to fluid velocity. The RTDs provide continuous supply and return line temperature signals to the computer to record ∆T. Depending on pipe size and configuration, the RTDs can be surface mounted or inserted into thermowells. For this verification the insulated clamp-on RTDs will be used on the 2-inch diameter copper tubing used to route the supply and return fluid.
To operate the energy metering system, several critical parameters must be programmed into the computer including:
• pipe or tubing diameter • pipe or tubing wall material and thickness • distances between ultrasonic transducers • working fluid density and specific heat
The accuracy of these parameters will directly impact the overall accuracy of the meter. Tubing material and exact diameter and wall thickness will be obtained from manufacturer specifications. The transducer mounting system is designed to provide precise measurement of the distance between transducers.
2-10

The energy meter software contains lookup tables that provide the ASHRAE working fluid density and specific heat values corrected to the average fluid temperature measured by the RTDs. In order for these values to be correct, the fluid composition must be known or determined, and programmed into the computer. Fluid composition testing will be conducted by the GHG Center before and during testing as described below to ensure proper system programming. During the verification period, the GHG Center will document that no water or PG are added to the PG fluid loop to “top off” the system and potentially change the fluid composition.
The ultrasonic transducers are mounted on the tubing at a location with at least ten diameters of undisturbed flow upstream and five diameters of undisturbed flow downstream. The RTDs are installed as close to the heat recovery unit as configuration allows. For this test, the flow transducers will be mounted on the hot (supply) line. Prior to the start of testing, two procedures are conducted to ensure that the flow computer is accurate. First, the fluid density at standard conditions will be programmed into the flow computer based on results of the preliminary PG fluid sample analysis. The flow computer will then be programmed to track fluid density (and subsequently sonic velocity) using the hot side RTD signal. Then, actual sonic velocity of the PG fluid will be determined by stopping the PG fluid flow for a short period, allowing the computer to measure the sonic velocity at site conditions. Using an RS-232 serial port connection to the GHG Center’s DAS, the following measurements will be logged as 1-minute averages throughout all test periods.
Measurement Units Fluid flow rate gal/min Return temperature oF Supply temperature oF
Several QA/QC procedures will be conducted prior to and during the verification testing to evaluate the accuracy of the meter. These procedures, which include factory calibration of sensors and performance checks conducted in the field, are detailed in Section 3.2.5.
PG Fluid Sampling and Analysis
Samples will be collected from a fluid discharge spout located on the hot side of the heat recovery unit using pre-cleaned polyethylene bottles of 100 to 500 ml capacity. One sample will be collected during each day of load testing, and twice per week during the extended monitoring period. Preliminary samples will also be collected prior to testing for use in programming the Controlotron energy meter. Each sample collection event will be recorded on field logs (Appendix A-6) and shipped to an analytical laboratory along with completed chain-of-custody forms (Appendix A-5).
Samples will be analyzed for PG concentration (percent) at the laboratory using a gas chromatography/flame ionization detector (GC/FID). The GC/FID is calibrated with standards ranging from 10 to 1,000 ppm PG to establish instrument linearity and a calibration curve. Because the instrument is calibrated to 1,000 ppm and sample concentrations of PG are expected to be around 50 percent (500,000 ppm), appropriate sample dilution will be performed prior to direct injection into the instrument. PG reactions in the GC column typically exhibit significant variability, and therefore the accuracy of the PG content analyses is limited to approximately ± 10 percent of measurement (or ± 5.0 volume percent for a mixture of approximately 50 percent PG).
As a QA check on the PG fluid sampling and analyses, a blind audit sample will be submitted to the laboratory along with the samples. The GHG Center will procure pure ACS reagent grade PG from a qualified reagent manufacturer (J.T. Baker or equivalent). ACS reagent grade PG is minimum 99.5 percent pure, with actual purity reported per lot manufactured. A mixture of PG in distilled water (in the
2-11

range of 40 to 50 percent) will be prepared by GHG Center personnel, recorded at the GHG Center’s laboratory, and submitted to the analytical laboratory for analysis. The analytical laboratory will be requested to conduct duplicate analyses on the audit sample, and the reported values will be compared to the mixture recorded by the GHG Center to evaluate analytical accuracy.
2.3 POWER QUALITY PERFORMANCE
When an electrical generator is connected in parallel and operated simultaneously with the utility grid, there are a number of issues of concern. The voltage and frequency generated by the power system must be aligned with the power grid. While in grid parallel mode, the units must detect grid voltage and frequency to ensure proper synchronization before actual grid connection occurs. The microturbine accomplishes this by converting high-frequency electrical output or adjusting revolutions per minute (rpm) to match the grid frequency and voltage. The microturbine power electronics contain circuitry to detect and react to abnormal conditions that, if exceeded, cause the unit to automatically disconnect from the grid. These out-of-tolerance operating conditions include overvoltages, undervoltages, and over/under frequency. For previous verifications, the GHG Center has defined grid voltage tolerance as the nominal voltage ± 10 percent. Frequency tolerance is 60 ± 0.6 Hz (1.0 percent).
The power factor delivered by each system must be close to unity (100 percent) to avoid billing surcharges. Harmonic distortions in voltage and current must also be minimized to reduce damage or disruption to electrical equipment (e.g., lights, motors, office equipment). Industry standards for harmonic distortion have been established within which power generation equipment must operate.
The generator’s effects on electrical frequency, power factor, and total harmonic distortion (THD) cannot be completely isolated from the grid. The quality of power delivered actually represents an aggregate of disturbances already present in the utility grid. For example, local CHP power with low THD will tend to dampen grid power with high THD in the test facility’s wiring network. This effect will drop off with distance from the CHP generator.
Synchronous generators usually operate at or near unity (100 percent) power factor. Induction generators, however, always require reactive power from the grid and operate at less than unity power factor. In either case, the generator’s power factor effects will also change with distance from the CHP generator as the aggregate grid power factor begins to predominate.
The GHG Center and its stakeholders developed the following power quality evaluation approach to account for these issues. Two documents (IEEE 1992, ANSI/IEEE 1999) form the basis for selecting the power quality parameters of interest and the measurement methods to be used. The GHG Center will measure and record the following power quality parameters for 7 days of operation at normal site conditions:
• Electrical frequency • Voltage • Voltage total harmonic distortion • Power factor
The ION power meter (7600 ION or 7500 ION) used for power output determinations will perform these measurements as described in the following subsections. Prior to field installation, the factory will calibrate the ION power meter to IEC 687 SO.2 and ANSI C12.20 CAO.2 standards. Section 3.2 provides further details about additional QA/QC checks.
2-12

2.3.1 Electrical Frequency
Electricity supplied in the U.S. and Canada is typically 60 Hz AC. The ION power meter will continuously measure electrical frequency at the generator’s distribution panel. The DAS will record 1minute averages throughout all test periods. The mean frequency is the average of all the recorded 1minute data over the test period; standard deviation is a measure of dispersion about the mean as follows:
n n
∑ Fi ∑ (F − Fi )2
1 1F = (Eqn.6) σ F = (Eqn. 7)n n −1
Where: F = mean frequency for baseline and turbine operating periods, Hz Fi = average frequency for the ith minute, Hz n = number of 1-minute readings logged σF = sample standard deviation in frequency for baseline and turbine operating periods
2.3.2 Generator Line Voltage
The CHP unit generates power at 480 Volts (AC). The electric power industry accepts that voltage output can vary within ± 10 percent of the standard voltage (480 volts) without causing significant disturbances to the operation of most end-use equipment. Deviations from this range are often used to quantify voltage sags and surges.
The ION power meter will continuously measure true root mean square (RMS) line-to-line voltage at the generator’s distribution panel for each phase pair. True RMS voltage readings provide the most accurate representation of AC voltages. The DAS will record 1-minute averages for each phase pair throughout all test periods. The GHG Center will report voltage data averaged over all three phase pairs for each test period, consisting of the following output:
• Total number of voltage disturbances exceeding ± 10 percent • Maximum, minimum, average, and standard deviation of voltage exceeding ± 10
percent • Maximum and minimum duration of incidents exceeding ± 10 percent
Equations 6 and 7 will be used to compute the mean and standard deviation of the voltage output by substituting the voltage data for the frequency data.
2.3.3 Voltage Total Harmonic Distortion
Harmonic distortion results from the operation of non-linear loads. Harmonic distortion can damage or disrupt many kinds of industrial and commercial equipment. Voltage harmonic distortion is any deviation from the pure AC voltage sine waveform.
The ION power meter applies Fourier analysis algorithms to quantify total harmonic distortion (THD). Fourier showed that any wave form can be analyzed as one sum of pure sine waves with different frequencies. He also showed that each contributing sine wave is an integer multiple (or harmonic) or the
2-13

lowest (or fundamental) frequency. For electrical power in the US, the fundamental is 60 Hz. The 2nd
harmonic is 120 Hz, the 3rd is 180 Hz, and so on. Certain harmonics, such as the 5th or 12th, can be strongly affected by the types of devices (i.e., capacitors, motor control thyristors, inverters) connected to the distribution network.
For each harmonic, the magnitude of the distortion can vary. Typically, each harmonic’s magnitude is represented as a percentage of the RMS voltage of the fundamental. The aggregate effect of all harmonics is called total harmonic distortion (THD). THD amounts to the sum of the RMS voltage of all harmonics divided by the RMS voltage of the fundamental, converted to a percentage. THD gives a useful summary view of the generator’s overall voltage quality.
Based on “recommended practices for individual customers” in the IEEE 519 Standard (IEEE 1992), the specified value for total voltage harmonic is a maximum THD of 5.0 percent.
The ION meter will continuously measure voltage THD up to the 63rd harmonic for each phase. The meter’s output value is the result of the following calculation:
63 ∑volti
2THDvolt = 100 * (Eqn.8)volt1
Where:THDvolt = Voltage total harmonic distortion, %volti = RMS voltage reading for the ith harmonic, voltsvolt1 = RMS voltage reading for the fundamental, volts (e.g., 220, 480)
The DAS will record 1-minute voltage THD averages for each phase throughout all test periods. The GHG Center will report periods for which overall voltage THD exceeded 5.0 percent, mean, and standard deviation averaged over all three phases for each test period, per the methods outlined in Equations 6 and 7 above.
2.3.4 Current Total Harmonic Distortion
Current THD is any distortion of the pure current AC sine waveform and, similar to voltage THD, can be quantified by Fourier analysis. The current THD limits recommended in the IEEE 519 Standard (IEEE 1992) range from 5.0 percent to 20.0 percent, depending on the size of the CHP generator, the test facility’s demand, and its distribution network design as compared to the capacity of the local utility grid. For example, the standard’s recommendations for a small CHP unit connected to a large capacity grid are more forgiving than those for a large CHP unit connected to a small capacity grid.
Detailed analysis of the facility’s distribution network and the local grid are beyond the scope of this verification. The GHG Center will, therefore, report current THD data without reference to a particular recommendation. As with voltage THD, the ION power meter will continuously measure current THD for each phase. The DAS will record 1-minute current THD averages for each phase throughout all test periods. The GHG Center will report mean, and standard deviation of current THD averaged over all three phases for each test period, per the methods outlined in Equations 6 and 7 above.
2-14

2.3.5 Power Factor
Power factor is the phase relationship of current and voltage in AC electrical distribution systems. Under ideal conditions, current and voltage are in phase, which results in a unity (100 percent) power factor. If reactive loads are present, power factors are less than this optimum value. Although it is desirable to maintain unity power factor, the actual power factor of the electricity supplied by the utility may be much lower because of load demands of different end users. Typical values ranging between 70 and 90 percent are common. Low power factor causes heavier current to flow in power distribution lines for a given number of real kW delivered to an electrical load.
Mathematically, electricity consists of three components, which can be mapped as vectors to form a power triangle: real power (kW), reactive power (kVAr), and apparent power (kVA). Real power is the part of the triangle that results in actual work being performed, in the form of heat and energy. Reactive power, which accounts for electric and magnetic fields produced by equipment, always acts at right angles, or 90o, to real power.
Real power and reactive power create a right triangle where the hypotenuse is the apparent power, measured in kilovolt-amperes (kVA). The phase angle between real power and apparent power in the power triangle determines the size of the reactive power leg of the triangle. The cosine of the phase angle is called power factor, and is inversely proportional to the amount of reactive power that is being generated. In summary, the larger the amount of reactive power, the lower the power factor will be. Reactive power does not contribute to the system’s mechanical or resistive (heat) work, but the conductors still must carry the reactive current. Low power factors require larger capacity equipment and conductors. Low power factors can also exacerbate problems with THD, resonances, and other power quality parameters.
The ION power meter will continuously measure average power factor across each generator phase. The DAS will record one-minute averages for each phase during all test periods. The GHG Center will report maximum, minimum, mean, and standard deviation averaged over all three phases per the methods outlined in Equations 6 and 7 above.
2.4 EMISSIONS PERFORMANCE
2.4.1 Stack Emission Rate Determination
Exhaust stack emissions testing will be conducted to determine emission rates for criteria pollutants (CO, NOX, and THCs) and greenhouse gases (CH4 and CO2). Stack emission measurements will be conducted at the same time as electrical power output measurements in the controlled test periods.
Following NSPS guidelines for evaluation of emissions from stationary gas turbines, Capstone 60 Microturbine system exhaust stack emissions testing will be conducted at four loads within the normal operating range of the turbine, including the minimum load in the range and the peak load. As discussed earlier, the loads selected are 25, 50, 75, and 100 percent of the normal full load capacity (60 kW) with the Unifin set to recover maximum heat, and 50 and 100 percent of load with the Unifin damper fully opened. The turbine will be allowed to stabilize at each load for 15 to 30 minutes before starting the tests. To verify testing precision, three replicate test runs, each approximately 30 minutes long, will be conducted for each parameter at each load selected. The average results of three valid replicates will be reported.
2-15

Following the load tests, the emissions profile test will be conducted to document emissions throughout the entire range of operation to further understand the Capstone 60 Microturbine system performance. The additional test run will be conducted at loads ranging between 25 and 100 percent of rated capacity. The test will be conducted by collecting stable emission concentration readings (approximately 10 minutes of data) at power commands starting at full power and incrementally decreasing by 3 to 5 kW to a low of around 15 kW. The only deviations from the standard test methods during this test are that three replicates will not be conducted, and the duration of sampling at each power command will be shorter. Power command changes between successive load changes will occur relatively rapidly, and the system will be allowed to stabilize for approximately 5 minutes at each point before data recording begins.
The sampling procedures and analytical instruments used during these tests will be the same as those used during the official verification tests. The same analyzers, sampling system, calibration gases, and calibration procedures will be followed to ensure that accurate emissions concentrations are recorded (results will be presented only as concentrations for this test.
The average emission rate measured during each load test run will be reported in units of parts per million volume dry (ppmvd) for CH4, CO, NOX, and THCs, percent for CO2 and O2 pounds per hour (lb/hr), and pounds per kilowatt hour energy produced (lb/kWh). Using an appropriate DAS, analyzer outputs will be compiled as 1-minute averages throughout each test and averaged over the entire test period. Concentrations of NOX, CO, and THCs will then be reported as ppmvd corrected to 15 percent O2 (ppmvd @ 15 % O2) using Equation 9.
ppmvd @ 15 % O2 = ppmvd * [(20.9 – 15.0) / (20.9 – exhaust gas O2)] (Eqn. 9)
Where:ppmvd = average of 1-minute measurements for each pollutantexhaust gas O2 = average of 1-minute O2 concentrations
Appendix C-3 illustrates an example of the emissions test results. As with the power production and efficiency performance testing, local operators, designated by CDH, will maintain steady unit operation and load for the duration of each emissions test. Variability in unit operation is not specified in the testing methods, but the variability criteria presented in Table 2-1 will be used as a guideline to verify that the tests were conducted during steady operation. An organization specializing in air emissions testing will be contracted to perform all stack testing. The testing contractor will provide all equipment, sampling media, and labor needed to complete the testing and will operate under the supervision of a GHG Center representative.
All of the emission test procedures to be utilized in this verification are U.S. EPA Federal Reference Methods. The Reference Methods are well documented in the Code of Federal Regulations, most often applied to determine pollutant levels, and include procedures for selecting measurement system performance specifications and test procedures, quality control procedures, and emission calculations (40CFR60, Appendix A). Table 2-2 summarizes the standard Test Methods that will be followed.
Each of the selected methods utilizing an instrumental measurement technique includes performancebased specifications for the gas analyzer used. These performance criteria cover span, calibration error, sampling system bias, zero drift, response time, interference response, and calibration drift requirements. Each test method is discussed in more detail in the following sections. The entire Reference Method will not be repeated here, but will be available to site personnel during testing.
2-16

Table 2-2. Summary of Emission Testing Methods
Air Pollutant
U.S. EPA Reference Method
Principle of Detection Proposed Analytical Range a
Accuracy
Loads Tested
(% nominal capacity 60kW)
No. of Test Replicates
CH4 18 GC/FID 0 to 25 ppm ± 5 %
25, 50, 75, and 100
3 per load (30 minutes)
CO 10 NDIR-Gas Filter Correlation 0 to 25 ppm ± 5 %
CO2 3A NDIR 0 to 20 % ± 5 % NOx 20b Chemiluminescence 0 to 25 ppm ± 2 % O2 3A Paramagnetic 0 to 25 % ± 5 %
THCsa 25A Flame ionization 0 to 25 ppm ± 5 % Moisture 4 Gravimetric 0 to 25 % ± 5 % 1 per load
a Actual ranges will be determined prior to testing, and may change with changes in operating loads. b Due to the small stack diameter (10-in.), Method 20 will be modified to incorporate single point sampling.
Gaseous Sample Conditioning and Handling
A schematic of the sampling system to be used to measure concentrations of CO2, CO, NOx, O2, and THCs is presented in Figure 2-2. In order for the CO2, CO, NOx, and O2, instruments used to operate properly and reliably, the flue gas must be conditioned prior to introduction into the analyzer. The gas conditioning system is designed to remove water vapor from the sample. All interior surfaces of the gas conditioning system are made of stainless steel, Teflon™, or glass to avoid or minimize any reactions with the sample gas components. Gas is extracted from the turbine exhaust through a stainless steel probe and Teflon sample line. The gas is then transported using a sample pump to a gas conditioning system that removes moisture. After moisture removal, the dry sample gas is transported to a flow distribution manifold where sample flow to each analyzer is controlled. A separate Teflon line routes calibration gases through this manifold to the sample probe. This allows calibration and bias checks to include all components of the sampling system. The distribution manifold also routes calibration gases directly to the analyzers, when linearity checks are made on each analyzer.
The THC analyzer is equipped with a FID as the method of detection. This detector analyzes gases on a wet, unconditioned basis. Therefore, a second heated sample line is used to deliver unconditioned exhaust gases from the probe to the THC analyzer.
2-17

Figure 2-2. Gas Sampling and Analysis System
Bag Sample for methane Rate Meter
3-way Valve
l
THC
CO2
CO
O2
Data
i
Moisture Removal System
Condensate
Heated Sampling Probe
System Calibration Gas Sample and Calibration Gas Control Manifold
Calibration Gases
Samp ing Pump
System Exhaust
Analyzer
NOx Analyzer
Analyzer
Analyzer
Analyzer
Acquisition System
Heated Sample Lines
Unheated Sample Lines
Heated Sampling Probe
Sampl ng Pump
Gaseous Pollutant Sampling Procedures
For CO and CO2 determinations, a continuous sample will be extracted from the emission source and passed through a nondispersive infrared (NDIR) analyzer (California Analytical Model CA-300P or equivalent). For each pollutant, the NDIR analyzer compares the amount of infrared light that passes through the sample gas to that which passes through the gas reference cells. Because CO and CO2 absorb light in the infrared region, light attenuation is proportional to the CO/CO2 concentrations in the sample. The CO/CO2 analyzer ranges will be set at or near 0 to 20 percent for CO2 and 0 to 25 ppm for CO at full load (0 to 50 ppm at reduced loads).
O2 content will be analyzed using a paramagnetic reaction cell analyzer. This type of analyzer uses a measuring cell that consists of a mass of diamagnetic material (dumbbell), which is temperature controlled electronically at 50 °C. The higher the sample O2 concentration, the greater the dumbbell is deflected from its rest position. This deflection is detected by an optical system connected to an amplifier. Surrounding the dumbbell is a coil of wire; a current passes through the wire to return the dumbbell to its original position. The current applied is linearly proportional to the O2 concentration in the sample. The O2 analyzer range will be set at or near 0 to 25 percent.
2-18

NOX will be determined on a continuous basis using a chemilumenescence analyzer (Monitor Labs Model 8840 or equivalent). This analyzer catalytically reduces NOX in the sample gas to NO. The gas is then converted to excited NO2 molecules by oxidation with O3 (normally generated by ultraviolet light). The resulting NO2 luminesces in the infrared region. The emitted light is measured by an infrared detector and reported as NOX. The intensity of the emitted energy from the excited NO2 is proportional to the concentration of NO2 in the sample. The efficiency of the catalytic converter in making the changes in chemical state for the various NOX is checked as an element of instrument set up and checkout (Section 2.4.1.3). The NOX analyzer range will be operated on a range of 0 to 25 ppm at full load and 0 to 50 ppm at reduced loads, if necessary.
Total hydrocarbons in the exhaust gas will be measured using a FID which passes the sample through a hydrogen flame (California Analytical Model 300 AD or equivalent). The intensity of the resulting ionization is amplified, measured, and then converted to a signal proportional to the concentration of hydrocarbons in the sample. Unlike the other methods, this sample stream which could be scavenged by moisture removal does not pass through the condenser system; it is kept heated until analyzed. This is necessary to avoid loss of the less volatile hydrocarbons in the gas sample. Because many types of hydrocarbons are being analyzed, THC results will be normalized and reported as CH4 equivalent. The calibration gas for THC will be propane. Concentrations of CH4 will be determined by collecting integrated gas samples in Tedlar bags and shipping samples to a qualified laboratory for analysis. In the laboratory, samples will be directed to a Hewlett Packard 5890 GC/FID. Similar to the fuel sampling, the GC/FID will be calibrated with appropriate certified calibration gases. Sample collection bags will be leak checked prior to testing. In addition, one replicate sample will be collected and one duplicate analysis will be conducted for each turbine load tested.
Determination of Emission Rates
The instrumental testing for CH4, CO, CO2, NOX, O2, and THCs provides results of exhaust gas concentrations in units of percent for CO2 and O2 and ppmvd corrected to 15 percent O2 for CH4, CO, NOX, and THCs. The THC and CH4 results are as ppmv on a wet basis, but will be corrected to ppmvd based on measured exhaust gas moisture measurements made in conjunction with the testing. No less than once at each load tested, an EPA Reference Method 4 test will be conducted to determine the moisture content of the exhaust gases.
Since turbine exhausts tend to be turbulent, EPA Method 19 will be used for calculating emission rates instead of measuring the gas flow rate using EPA Method 2 procedures. Method 19 employs fuel factors (i.e., F-factors) and the turbine heat input rate (MMBtu/hr) to convert the pollutant ppmvd concentrations to emission rates in pounds per hour (lb/hr).
F-factors are the ratio of combustion gas volume to the heat content of the fuel, and are calculated as a volume/HI value, (e.g., standard cubic feet per million Btu). This method applies only to combustion sources for which the heating value for the fuel can be determined. The F-factor can be calculated from CO2 or O2 values, on a wet or dry basis, as dictated by the measurement conditions for the gas concentration determinations. Method 19 includes all calculations required to compute the F-factors and guidelines on their use. The F-factor for natural gas can be calculated from the fuel compositional analyses, or Method 19 allows the use of the published F-factor for natural gas [8,710 dry standard cubic feet per million British thermal units (dscf/MMBtu)].
Measured pollutant concentrations (ppmvd) will first be converted to pounds per dry standard cubic foot (lb/dscf) using the following unit conversion factors:
2-19

CH4: 1 ppmvd = 4.15E-08 lb/dscf CO: 1 ppmvd = 7.264E-08 lb/dscf CO2: 1 ppmvd = 1.142E-07 lb/dscf NOX: 1 ppmvd = 1.194E-07 lb/dscf THC: 1 ppmvd = 4.15E-08 lb/dscf (THC emissions are quantified as CH4)
Emission rates for each pollutant can then be calculated using Equation 10.
Emission rate (lb/kWh) = [Ci * HI * F-factor * (20.9/(20.9-O2))] / kW (Eqn. 10)
Where:Ci = pollutant concentration (lb/dscf)HI = average microturbine fuel HHV based heat input during test (MMBtu/hr)F-factor = calculated fuel F-factor (dscf/MMBtu), approx. 8,710 dscf/MMBtuO2 = average measured exhaust gas O2 concentration (%)kW = average microturbine power output during test (kW)
2.5 ELECTRICITY OFFSETS AND ESTIMATION OF EMISSION REDUCTIONS
Sections 2.5.1 and 2.5.2 present the approach for estimating emission reductions from on-site electrical power generation. Emission reductions associated with heat recovery are discussed in Section 2.5.3. Figure 2-3 is a schematic of the emission reduction estimation methodology.
2-20

Figure 2-3. Capstone 60 Microturbine CHP Emission Reduction Estimation Methodology
emissions from thermal energy production)
energy produced
Electric power generated (plus
electricity offset from utility grid
thermal energy
(boilers)
Estimate poten
grid emissions
Estimate potential emission reductions from
production
Estimate potential
Estimate total
Measure net CHP electricity generated
Measure emissions from CHP electricity production (includes Measure CHP thermal
line losses) equals
Thermal energy produced equals
offset from standard heating equipment
tial offset utility
electric power
thermal energy emission reductions
potential emission reductions
The GHG Center will first determine system emission rates through direct measurements as described earlier. Those actual emission rates at full load, compared with baseline emissions that would occur if the power generation systems were not in place, form the basis of the emission reduction estimation. Electrical power supplied by the microturbine will reduce the need for the same amount of electricity from the local grid, after adjusting grid power generation upward to account for transmission line losses. The subtraction of the annual estimated CHP emissions from the annual estimated emissions associated with the mix of power stations serving the grid, yields an estimate of the annual CO2 and NOX emission reduction due to grid electricity offsets, as shown below.
Reduction (lb/yr) = ECHP - (EGRID + EBurners) (Eqn. 11)
Reduction (%) = [(EGRID + EBurners) -ECHP]/(EGRID+ EBurners) * 100
2-21

Where:Reduction = estimated annual emission reductions from on-site electricity generation, lb/yr
or % ECHP = estimated annual emissions from microturbine at full load, lb/yr (Section 2.5.1) EGRID = estimated annual emissions from utility grid, lb/yr (Section 2.5.2) EBurners = estimated annual emissions from burners, lb/yr (Section 2.5.3)
This verification will estimate emission reductions for CO2 and NOX because CO2 is the primary greenhouse gas emitted from combustion processes and NOX is a primary pollutant of regulatory interest. Reliable emission factors for electric utility grid are available for both gases. These pollutants will be measured for the Capstone 60 Microturbine, which will produce both electric power and excess heat (as captured by the Unifin heat exchanger and subsequently utilized by the Munters unit). Therefore, it will be necessary to quantify the efficiency with which this excess heat is able to be utilized. The utilization of this heat will reduce the amount of natural gas that will be consumed by the Munters unit. The resultant reduction in CO2 and NOX emissions will be calculated based on measurements of the heat transferred to the Munters unit through the PG heat exchanger loop.
The following subsections describe the approach for estimating annual emissions for the CHP system, and the baseline utility grid.
2.5.1 Microturbine Annual CO2 and NOX Emissions Estimation
The first step in calculating emission reductions is to estimate the emissions associated with generating electricity on site over a given period of time (e.g., 1-year). Section 2.4 provided procedures for verifying the Capstone 60 Microturbine emission rates at four operating loads. This unit is projected to operate only at full load, so the full load emission rate, along with projected annual operating hours (provided by the host facility), allows the calculation of annual emissions pounds per year (lb/yr), as shown in Equation 12.
ECHP = ER %100, CHP kWh * CHP (Eqn. 12)
Where:ECHP = total microturbine CO2 or NOX emissions (lb/yr)ERCHP,100% = microturbine CO2 or NOX emission rate at full load (lb/kWh)kWhCHP = projected (or proven) power generated (kWh/yr)
The maximum projected annual electricity generation is the unit's measured full load power output multiplied by the projected annual operating hours. This verification will assume that operational availability for the CHP each system is 95 percent or 8,322 hours per year. For example, if the average power output at full load is verified to be 55 kW for the microturbine, annual power generated will be 457,710 kWh/yr (55 kW times 8,322 hr/yr). This estimate does not account for electricity derating due to ambient conditions.
2-22

2.5.2 Estimation of Electric Grid Emissions
The microturbine's generated electric energy will offset electricity supplied by the grid. Consequently, the reduction in electricity demand from the grid caused by this offset will result in changes in CO2 and NOX emissions associated with producing an equivalent amount of electricity at central power plants.
Utility power systems and regional grids consist of aggregated power typically provided by a wide variety of generating unit (GU) types. Each type of GU emits differing amounts of GHG (and other pollutants) per kWh generated. In the simplest case, for a single GU, total CO2 emissions (lb) divided by the total power generated by that GU (kWh) yields the CO2 emission rate for the selected GU (lb/kWh).
More complex analyses require determination of an aggregated baseline emission rate derived from multiple grid-connected GUs. The method to develop an aggregate emission rate is to divide the total emission by the total power generated from the GUs under consideration, as shown for CO2 in Equation 13.
n
∑CO2 n
ERgrid = 1 (Eqn. 13)
∑ n
kWhn1
Where: ERgrid = aggregated baseline grid CO2 emission rate, lb/kWh CO2n = individual GUn CO2 emissions for the period, lb kWhn = individual GUn power generated for the period, kWh n = number of GU in the baseline selection set
The particular grid-connected GUs chosen for the baseline emission rate calculation have a strong effect on the potential emissions reductions. The microturbine power may offset generation from an individual grid-connected GU or from many GU on a utility-wide, regional, or national basis. Depending on the control system operator, the combination of connected GU can change hourly or less. Some considerations, which may confound the choice of GUs to be offset, are:
The GU inventory in the geographic region, how they are connected to the grid, local utility fuel mix, and the local dispatch protocol can affect whether or not a particular GU is offset. Microturbine/operating schedules (i.e., in a baseload, peak shaving, or other mode) should be comparable to the offset GU. Transmission and distribution (T&D) line losses should be considered for the offset GU and for the microturbine if it exports power to the grid. Several different databases provide emission factor, power generation, cost, and other data in varying formats. In most cases, utility-specific real-time electrical production data is not publicly available.
If the analyst proposes that GUs that operate on the margin (i.e., those dispatched last and offset first) are to be offset, then marginal fuel prices, dispatchability, and economics at the local and regional level may also need to be considered.
Because of such complex issues, the GHG Center undertook a review of regulatory guidance and industrial community practice on how to choose the grid-connected emissions that would be offset by DG installations. The review included procedures used by the EPA, U.S. Department of Energy (DOE),
2-23
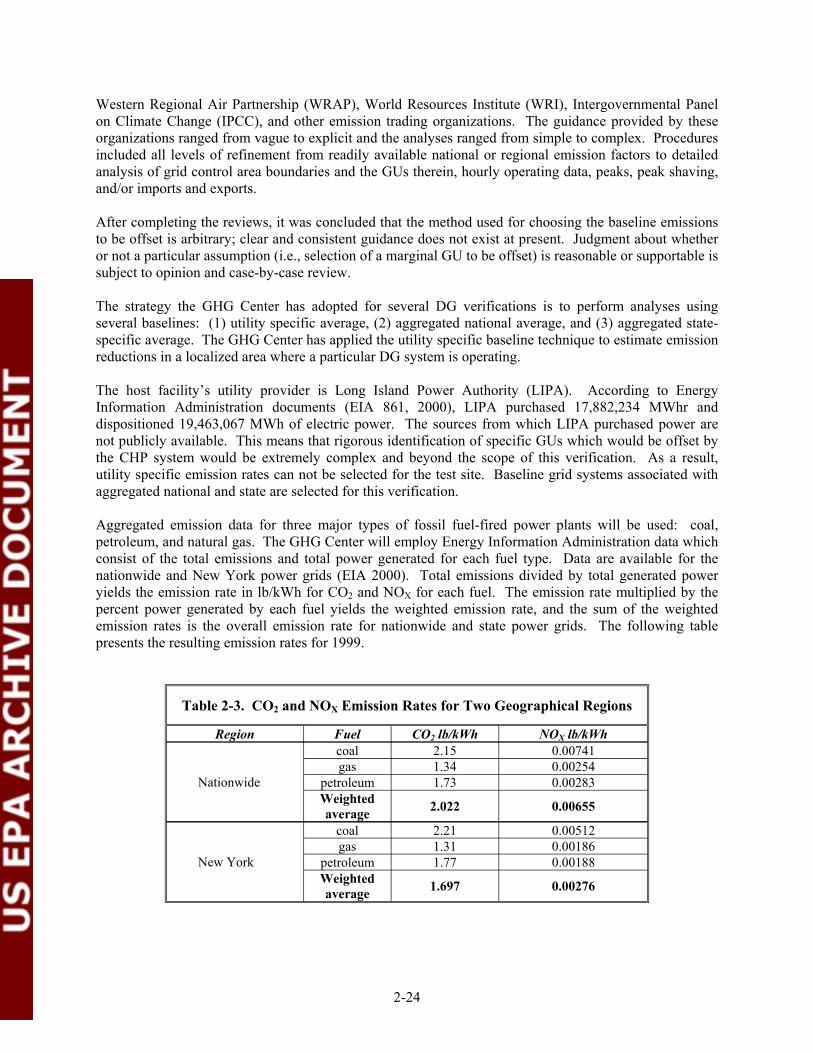
Western Regional Air Partnership (WRAP), World Resources Institute (WRI), Intergovernmental Panel on Climate Change (IPCC), and other emission trading organizations. The guidance provided by these organizations ranged from vague to explicit and the analyses ranged from simple to complex. Procedures included all levels of refinement from readily available national or regional emission factors to detailed analysis of grid control area boundaries and the GUs therein, hourly operating data, peaks, peak shaving, and/or imports and exports.
After completing the reviews, it was concluded that the method used for choosing the baseline emissions to be offset is arbitrary; clear and consistent guidance does not exist at present. Judgment about whether or not a particular assumption (i.e., selection of a marginal GU to be offset) is reasonable or supportable is subject to opinion and case-by-case review.
The strategy the GHG Center has adopted for several DG verifications is to perform analyses using several baselines: (1) utility specific average, (2) aggregated national average, and (3) aggregated statespecific average. The GHG Center has applied the utility specific baseline technique to estimate emission reductions in a localized area where a particular DG system is operating.
The host facility’s utility provider is Long Island Power Authority (LIPA). According to Energy Information Administration documents (EIA 861, 2000), LIPA purchased 17,882,234 MWhr and dispositioned 19,463,067 MWh of electric power. The sources from which LIPA purchased power are not publicly available. This means that rigorous identification of specific GUs which would be offset by the CHP system would be extremely complex and beyond the scope of this verification. As a result, utility specific emission rates can not be selected for the test site. Baseline grid systems associated with aggregated national and state are selected for this verification.
Aggregated emission data for three major types of fossil fuel-fired power plants will be used: coal, petroleum, and natural gas. The GHG Center will employ Energy Information Administration data which consist of the total emissions and total power generated for each fuel type. Data are available for the nationwide and New York power grids (EIA 2000). Total emissions divided by total generated power yields the emission rate in lb/kWh for CO2 and NOX for each fuel. The emission rate multiplied by the percent power generated by each fuel yields the weighted emission rate, and the sum of the weighted emission rates is the overall emission rate for nationwide and state power grids. The following table presents the resulting emission rates for 1999.
Table 2-3. CO2 and NOX Emission Rates for Two Geographical Regions
Region Fuel CO2 lb/kWh NOX lb/kWh
Nationwide
coal 2.15 0.00741 gas 1.34 0.00254
petroleum 1.73 0.00283 Weighted average 2.022 0.00655
New York
coal 2.21 0.00512 gas 1.31 0.00186
petroleum 1.77 0.00188 Weighted average 1.697 0.00276
2-24

The T&D system delivers electricity from the power station to the customer. Power transformers increase the voltage of the produced power to the transmission voltage (generally 115 to 765 kV) and, in turn, reduce it for distribution (25 to 69 kV). Additional transformers reduce the voltage further (to 220 V, 440 V, etc.) at the host facility. This means that for each kWh used at the host facility, the grid’s GU must provide additional power to overcome the transformer, powerline, and other losses. EIA data indicate that LIPA’s sources of power in 1999 totaled 19,463,067 MWh while losses amounted to 1,217,861 MWh. This equates to a 6.3 percent T&D loss and means that for every kWh generated by the CHP and used at the host facility, grid GU would have had to provide 1.063 kWh.
Power grid emission offsets, therefore, are based on the number of kWh generated by the on-site CHP, line losses, and the grid emission rate for CO2 or NOX as shown in Equation 14.
EGRID = kWhCHP ER * GRID * 063.1 (Eqn. 14)
Where: EGRID = Grid CO2 or NOX emissions offset by the CHP, lb/year kWhCHP = CHP (projected or proven) power generated, kWh/yr ERGRID = CO2 or NOX emission rates from Table 2-3, lb/kWh 1.063 = Total T&D losses
The resulting EGRID value will be used to estimate annual CO2 and NOX emission reductions according to Equation 11.
2.5.3 Estimation of Gas Burner Emission Reductions
For each Btu of thermal energy recovered by the Capstone 60 CHP (and used by the host facility), an equivalent amount of energy is no longer needed from the baseline gas-fired burners in the Munters unit. At many CHP applications, estimation of emission reductions resulting from CHP systems is fairly straightforward provided all of the recovered heat can be utilized throughout the year. When this is the case, the first step then in estimating the burners’ avoided emissions is to measure the maximum CHP heat recovery rate at 100 percent load as described in Section 2.2.2. These heat rates (MMBtu/hr) combined with the projected annual operating hours at this load factor allows the calculation of maximum annual heat recovered. This maximum heat recovery from the unit (assuming constant full heat demand) will be calculated as shown in Equation 15 and reported as a reference value.
Q Ann CHP = QCHP * h 60 * (Eqn. 15),
Where:QCHP,Ann = maximum total CHP heat recovered (MMBtu/yr)QCHP = CHP heat recovery rate at 100 percent load factor (MMBtu/min)h = projected (or proven) operating hours at 100 percent
This value will not be obtainable at the Waldbaums site, but would be possible at a site with greater heat demand. For this verification, CHP emissions offsets associated with use of CHP thermal energy will be estimated based on the heat delivered to the Munters unit through the PG recirculation loop. These calculations are complicated by the existence of two heat recovery pathways, and the variable heat demand on each. As shown in Equation 16 and described below, projected heat use at the Waldbaums site will be used to estimate emissions reductions specific to the installed application. The CO2 and NOX
2-25

emission rates, combined with the avoided heat input to the burners yields the potential burner emissions eliminated by use of the CHP system:
EBURNERS = QBURNERS ER * Burners (Eqn. 16)
Where: EBURNERS = potential annual burner emissions offset, lb/yr QBURNERS = avoided heat input to the burners, approx. 2,125 MMBtu/yr ERBurners = published burner emission rates; approx. 116.4 lb/MMBtu CO2 and 0.1053
lb/MMBtu NOX
As was discussed in Section 2.5, the GHG Center will use the EBURNERS estimate, along with emission offsets from the electrical grid, to calculate the overall potential annual GHG emission reductions according to Equation 11. Using the projected annual heat input offset (QBURNERS above), calculation of emission offsets due to heat use is as follows. The carbon in the natural gas, when combusted, forms CO2. The resulting CO2 emission rate is:
44ER 2 BurnersCO = * ( CC )* ( FO ) (Eqn. 17)12
Where:ERBurnersCO2 = burners CO2 emission rate, (lb/MMBtu)44 = molecular weight of CO2 (lb/lb.mol)12 = molecular weight of carbon (lb/lb.mol)CC = measured fuel carbon content
(Section 2.2.1; approx. 31.9 lb/MMBtu) (EPA 2001)FO = 0.995; Fraction of natural gas carbon content oxidized
during combustion (EPA 2001)
The EPA has compiled emission factors for natural gas burners in AP-42 (EPA 1998). Burners such as those used in the Munters unit are categorized as similar to commercial boilers under 100 MMBtu/hr heat input. The NOX emission factor for such units is listed as 100 lb/106 scf of natural gas. The GHG Center will measure the LHV for the natural gas used at the host facility as described in Section 2.2.1. It is expected to be approximately 950 Btu/scf. This means that 106 scf of natural gas will supply approximately 950 MMBtu of heat to the burners. The resulting NOX emission rate is expected to be approximately 100/950 or 0.1053 lb/MMBtu.
Estimation of Avoided Heat Input to the Burners (QBURNERS)
As part of the demonstration project, CDH Energy Corp. analyzed the site’s annual thermal load to estimate the amount of useful heat recovery expected from the CHP system. The analysis quantified the CHP recovered heat that can meet the heating and dehumidification needs at the Walbaums store. This heat, then, represents energy that need not be supplied by the space heating or desiccant regeneration burners.
2-26

--
Due to limitations in the scope of this verification, the GHG Center adopts the avoided heat input analysis summarized here but will not independently verify it. In summary, the analysis included the following inputs:
• Meteorological conditions (hourly data for one year, obtained from the nearby LaGuardia Airport)
• Building heat and dehumidification loads (Heat: 800 MBtu/hr at 0 oF ambient tempearture with no heat needed at 60 oF; dehumidification: 417 MBtu/hr at 100 gr/lb with no dehumidification needed at 58 gr/lb)
• Operating temperatures and heat transfer effectiveness for the CHP Unifin, building heating, and dehumidifier desiccant regeneration heat exchangers.
For each hour during the model year, the analyst calculated the building’s potential heating and dehumidification loads based on that hour’s meteorological data. The calculations account for the fact that some hours require both heating and dehumidification, some require heating only, and some require dehumidification only. CDH used linear interpolation to calculate intermediate loads. For example, at 30 oF ambient temperature, the building would require 400 MBtu/hr for space heating. The CHP would offset a portion of that load by supplying approximately 180 MBtu/hr for space heating,
An important factor in the analysis is that the highest temperature available from the CHP for dehumidification is 180 oF. The air must be further heated to 250 oF for desiccant regeneration. This means that the desiccator burner must operate at all times when dehumidification is required, but at a reduced heating rate when the CHP is operating. Based on operating temperatures and heat exchanger effectiveness, the CHP will supply about ½ of the heat required for dehumidification.
Another factor considered in the analysis is that the CHP can assist space heating or dehumidification but not both at the same time. During hours when both are required, allocation of the CHP to the heating mode is more efficient. This is because it offsets the less efficient of the two burners.
Summation of the hourly heating/dehumidification load yields a total annual base load of 2,263 MMBtu. CHP operations would supply 1,671 MMBtu and reduce this load to 592 MMBtu. After adjustment for the two burners’ gross thermal efficiency (as specified by the manufacturer), the net heat offset during CHP operations is 2,125 MMBtu as shown in the following table.
Table 2-4. Summary of Projected Annual Heat Offsets
Operating Mode Base Load Heat
Required (MMBtu)
Heat Required with CHP Operating
(MMBtu)
Heat Supplied by
CHP
Mfg. Spec. Burner Eff. (%)
Heat Offset, Adjusted for
Burner Efficiency (MMBtu)
Space Heating 1,592 246 1,346 75.5 1,783 Dehumidifier Desiccant Regeneration 671 346 325 95.0 342
Total 2,263 592 1,671 2,125
The 2,125 MMBtu per year of heat offset is the value used for QBurners in Equation 16. The majority of the offset is due to space heating, which accounts for about 2/3 of total annual heat required. Almost half of the dehumidification load is offset, even though the desiccant burner must provide some heat during CHP operations.
2-27

(this page intentionally left blank)
2-28

3.0 DATA QUALITY
3.1 BACKGROUND
The GHG Center selects methodologies and instruments for all verifications to ensure a stated level of data quality in the final results. The GHG Center specifies DQOs for each verification parameter before testing commences as a statement of data quality. Each test measurement that contributes to the determination of a verification parameter has stated DQIs, which, if met, ensure achievement of that parameter’s DQO.
The establishment of DQOs begins with the determination of the desired level of confidence in the verification parameters. Table 3-1 summarizes the DQOs for each verification parameter. The next step is to identify all measured values which affect the verification parameter, and determine the levels of error which can be tolerated. The DQI goals, most often stated in terms of measurement accuracy, precision, and completeness, are used to determine if the stated DQOs are satisfied.
Table 3-1. Verification Parameter DQOs
Parameter Total Errora
Absolute Relative, % Power and Heat Production Performance
Electrical power output at selected loads (kW) 0.90b kW 1.50 c
Electrical efficiency at selected loads (%) 0.51 % 1.81 d
Heat recovery rate at selected loads (MMBtu/hr) 8,750 Btu/hr 2.50d
Thermal energy efficiency at selected loads (%) 1.07 % 2.24d
CHP production efficiency (%) 1.38 % 2.04d
Power Quality Performance Electrical frequency (Hz) 0.006 Hz 0.01 Voltage 1.21 V 1.01c
Power factor (%) TBD 0.50 Voltage and current total harmonic distortion (THD) (%) TBD 1.00
Emissions Performance CO, NOX , and CO2 Concentration (ppmv, %) TBD 2.0 CH4 and THC Concentration (ppmv) TBD 5.0 CO, NOX , and CO2 Emission Rates (lb/hr) TBD 5.59 d
CH4 and THC Emission Rates (lb/kWh) TBD 7.22 d
a Bold column entries are DQOs; non-bold column entries are for information purposes b Assumes full load operation 60 kW c Includes 1.0 % current transformer (CT) and potential transformer (PT) error d Calculated composite error described in text
The following sections describe the data quality assessment process for each verification parameter. This includes a discussion of key measurements that contribute to the determination of the verification parameters, how measurement uncertainties affect their determination, and the resulting DQO. Each
3-1

section consists of a listing and discussion of DQI goals and QA/QC checks that will be performed to verify the DQI goals are met, and how the DQOs will be reconciled.
3.2 ELECTRICAL POWER AND HEAT OUTPUT QA/QC PROCEDURES
Table 3-2 summarizes the instrument specifications, DQI goals, and the primary method of evaluating the DQI goals achieved for each measurement related to power and heat production. Factory calibrations, sensor function checks, and reasonableness checks in the field (listed in Table 3-2) will document achievement of the DQI goals. Some of the QA/QC procedures to be performed are listed in Table 3-3 and described below.
3.2.1 Electrical Power Output Quality Assurance
The 7600 and 7500 ION power meters will directly determine electrical power output and quality, and booster compressor consumption. The inherent instrument error shown in Table 3-2 constitutes the DQO for electrical power-derived verification parameters listed in Table 3-1.
The power meter manufacturer will issue a certificate of compliance, which certifies that both meters meet or exceed published specifications. Consistent with ISO 9002-1994 requirements, the manufacturer will supply calibration documents, which certify traceability to national standards. The GHG Center will review the certificate and traceability records to ensure that the ± 0.35 percent accuracy goal was achieved or exceeded. Note that this accuracy standard, compounded with the ± 1.0 percent accuracy specification for the current and potential transformers yields the ± 1.5 percent DQO specified in Table 31. The power meters are intended for electric utility custody transfer applications; calibration records are reported to be valid for a minimum of 1 year of use, provided the manufacturer-specified installation and setup procedures are followed. GHG Center personnel will perform the related QC checks listed in Table 3-3 and described in detail in Appendices B-1 and B-2.
The accuracy of the power meters is validated by the factory calibration above; however, other QC checks will be performed to identify instrument malfunction in the field. The first such reasonableness check is a field spot check of power output. GHG Center personnel will perform checks in the field for two key measurements, voltage and current output, which are directly related to the power output measurement. The Field Team Leader will measure distribution panel voltage and current at the beginning of the verification period. He will use a digital multimeter (DMM) and compare each phase’s voltage and current readings to the power meter readings as recorded by the DAS. Appendix B-2 presents the procedures for these checks. The power meter voltage and current accuracies are ± 1.01 percent while the DMM is specified at ± 1.0 percent. The percent difference between the DMM reading and the power meter reading will be computed to determine it is within ± 2.01 percent for voltage and current. In these cases, the power meter will be deemed to be functioning properly. Comparisons of the power meter readings as recorded by the GHG Center’s DAS with the power output recorded by the microturbine instrumentation will constitute the second reasonableness check. At full load, the power meter and machine instruments must indicate between 54 and 60 kW for the microturbine after derating for elevation differences (booster compressor consumption should be around 4 kW).
3.2.2 Fuel Flow Rate Quality Assurance
Prior to testing, the GHG Center will send the Rosemount gas flow meter to the factory for calibration. The calibration certificate will be NIST-traceable; GHG Center personnel will review the calibration to ensure satisfaction of the ± 1.0 percent accuracy specification for the differential pressure sensors and the
3-2

orifice plate bore. The factory certified calibration data are reported to be valid for three years, provided manufacturer-specified installation and set-up procedures are followed.
The Field Team Leader will program the transmitter electronics in the field to enable the meter to calculate compensated flow. Input parameters will be the gas composition based on the average results from the pre-test gas samples and operating ranges (i.e., gas temperature and pressure) expected at the site during testing. To program the transmitter, Rosemount’s Engineering Assistant (EA) Software interfaces with the transmitter via a HART protocol serial modem. Appendix B-4 provides the specific setup parameters required in the EA and installation/setup checks and log forms for this meter. The Field Team Leader will log all data entered into the EA on field data forms; the GHG Center will maintain an electronic copy of the configuration file.
To validate the performance of the meter in the field, the Field Team Leader will perform sensor diagnostic checks. He will establish zero flow conditions by isolating the meter from the flow, equalizing the pressure across the differential pressure (DP) sensors using a crossover valve on the orifice assembly, and reading the pressure differential and flow rate. The sensor output must read zero flow during these checks. He will also conduct transmitter analog output checks at the beginning and end of the test. In this loop test, a current of known amount will be checked against a DMM to ensure that 4 mA and 20 mA signals are produced. Appendix B-5 presents the procedures and log forms for conducting flow meter sensor diagnostic checks.
In addition, meter readings will be compared to readings obtained from the facility's gas meter for the Microturbine. This meter is an American Meter RPM 3.5M G65 (Roots displacement type) meter with a rated accuracy of ± 1 percent and is supplied and calibrated by the local utility. Readings between the two meters should agree within 3 percent.
3.2.3 Ambient Temperature and Barometric Pressure Quality Assurance
The manufacturers will calibrate the ambient temperature/RH transducer and the barometric pressure transducer prior to testing. The resulting calibration certificates will be NIST-traceable. GHG Center personnel will review the calibration to ensure satisfaction of the listed specifications on both sensors. As a reasonableness check prior to testing, the GHG Center will compare the sensor’s DAS readings with the adjusted local barometric station pressure (psia) and with a hand-held temperature/ RH sensor while all are exposed to ambient air. Agreement within 0.2 psia and 2 °F will confirm that the transducers are operating properly.
3-3

Table 3-2. Measurement Instrument Specifications and DQI Goals
Data Quality Indicator Goals
Measurement Variable
Operating Range
Expected in Field
Instrument Type / Manufacturer
Instrument Range
Instrument Rated Accuracy
Frequency of Measurements Accuracya Completeness How Verified /
Determined
Electrical Power Output and Quality
Power 0 to 60 kW
Electric Meter/ Power Measurements 7600 ION
0 to 260 kW ± 1.50c % reading
Once per sec.; DAS records 1 - min averages
± 1.50 % readingc
100 % for load test periods, 90 % for extended monitoring at normal site conditions.
Review manufacturer calibration certificates, Perform sensor function checks in field
Reasonableness check for voltage, current, and flow computer; field verification of heat meter RTDs
Voltage 480 V 3 – (phase) ± 10 % 0 to 600 V ± 1.01 % reading ± 1.01 %
reading
Frequency 60 Hz 57 to 63 Hz ± 0.01 % reading ± 0.01 % reading
Current 0 to 200 amps 0 to 200 amps ± 1.01 % reading ± 1.01 % reading
Voltage THD 0 to 100 % 0 to 100 % ± 1 % FS ± 1 % FS
Current THD 0 to 100 % 0 to 100 % ± 1 % FS ± 1 % FS
Power Factor 0 to 100 % 0 to 1.0 ± 0.5 % reading ± 0.5 % reading
Review
Power Consumed by Booster Compressor
Power 0 to 5 kW Power Measurements 7500 ION
0 to 260 kW ± 1.50 % reading Once per sec.; DAS records 1 - min averages
± 1.50 % reading c
100% for load test periods
manufacturer calibration certificates, Perform sensor function checks in field
Heat Recovery
Fluid Flow Rate 0 to 40 gpm
Controlotron Model 1010WP
Approx. 0 to 100 gpm ± 1.5 % reading ± 1.5 %
reading
Supply and Return Fluid Temperatureb
5-30 oF -40 to 250 oF ± 0.02 oF ± 1.5 o F @ 180 °F
Ambient Meteorological Conditions
Ambient Temperatureb 0 to 90 oF
Vaisala HMD 60Y0
-40 to 140 oF ± 1.08 oF
1 - min averages
± 1.08 o F Review manufacturer calibration certificates
Relative Humidityb 0 to 100 % 0 to 100 %
± 2 % 0 to 90 % (RH,) ± 3 % 90 to 100 % (RH)
± 3 %
Ambient Pressureb 28 to 31 in. Hg SETRA Model
280E or equiv. 0 to 51 in. Hg ± 0.11 % FS ± 0.11 % FS
(continued)
3-4

Table 3-2. Measurement Instrument Specifications and DQI Goals (continued)
Data Quality Indicator Goals
Measurement Variable
Operating Range Expected in Field
Instrument Type / Manufacturer
Instrument Range
Instrument Rated Accuracy
Frequency of Measurements Accuracya Completeness How Verified /
Determined
Fuel Input
Volumetric Flow Rate 6 to 14 scfm Mass Flow Meter /
Rosemount 3095 5 to 20 scfm ± 1.0 % reading
1-min. averages
± 1.0 % reading 100 % for load
tests, 90 % for extended monitoring at normal site conditions
Factory calibration of pressure sensors and orifice bore
Gas Pressure 15 to 20 psia Pressure Transducer / Rosemount 0 to 150 psia ± 0.075 % FS ± 0.075 %
FS Review manufacturer calibration certificates and reasonableness checks
Gas Temperature 50 to 90 oF RTD / Rosemount
Series 68 -58 to 752 oF ± 0.09 % reading
± 0.09 % reading
LHV 94 to 98 % CH4 (900 to 1,005 Btu/scf)
Gas Chromatograph / HP 589011 0 to 100 % CH4
± 3.0 % accuracy and ± 0.2 % precision for CH4 ± 0.1 % repeatability for LHV
min. 2 samples per day during load tests
± 0.2 % for LHV
100 % for load tests
Repeatability check - duplicate analyses on the same sample
FS: full-scale a Accuracy goal represents the maximum error expected at the operating range. It is defined as the sum of instrument and sampling errors. b These variables are not directly used to assess DQOs, but are used to determine if DQIs for key measurements are met. They are also used to form conclusions about the system performance. c Includes instrument, 1.0 % current transformer (CT), and 1.0 % potential transformer (PT) errors.
3-5

Table 3-3. Summary of QA/QC Checks
Measurement Variable QA/QC Check When
Performed/Frequency Expected or Allowable Result Response to Check
Failure or Out of Control Condition
Power Output
Instrument Calibration by Manufacturera Beginning and end of test ± 0.35 % reading
Identify cause of any problem and correct, or replace meter
Sensor Diagnostics in Field Beginning and end of test Voltage and current checks
within ± 1 % reading
Identify cause of any problem and correct, or replace meter Identify cause of any
Reasonableness checks Throughout test 54 to 60 kW at full load problem and correct or replace meter
Fuel Flow Rate
Instrument Calibration by Manufacturera Beginning and end of test ± 1.0 % reading
Identify cause of any problem and correct, or replace meter
Reasonableness checks: compare with on-site gas meter
Throughout test Approx. 13 scfm at full load, meter comparability ± 3 %
Perform sensor diagnostic checks
Fuel Gas Pressure
Reasonableness check with ambient pressure sensor
Prior to testing ± 0.2 psia Identify cause of any problem and correct, or replace meter
Instrument calibration by manufacturera Prior to testing ± 0.075 % FS
Identify cause of any problem and correct, or replace meter
Fuel Gas Temperature
Instrument calibration by manufacturera Prior to testing ± 0.1 % F or ± 0.2 °FS
Identify cause of any problem8 and correct, or replace meter
Reasonableness check with ambient temperature sensor
At least once during testing ± 2 °F
Identify cause of any problem and correct, or replace meter
Duplicate analyses At least once for load performed by tests and on one blind Refer to Tables 3-7 and 3-8 Repeat analysis
Fuel Gas Composition and Heating Value Analysis
laboratorya audit sample Confirm canister is fully evacuated
Before collection of each sample canister pressure < 1.0 psia Reject canister
Calibration with gas standards by laboratory
Prior to analysis of each lot of samples submitted ± 1.0 % for CH4 Repeat analysis
Independent performance check with blind audit samplea
Once during test period ± 3.0 % for each gas constituent
Apply correction factor to sample results
(continued)
3-6

Table 3-3. Summary of QA/QC Checks (continued)
Measurement Variable QA/QC Check When
Performed/Frequency Expected or Allowable Result Response to Check
Failure or Out of Control Condition
Heat Recovery Rate
Calibrate ultrasonic fluid flow meter with NIST traceable standarda
Prior to testing Fluid flow rate: ± 1.5 % of reading Recalibrate flow meter
Meter zero check Prior to testing Reported heat recovery < 0.5 Btu/min Recalibrate heat meter
Independent performance check of PG analysis with blind sample
One time PG concentration should be accurate to within ± 3 %, relative
Recalculate DQO achieved for heat recovered and thermal efficiency
Independent performance check of temperature readingsa
Beginning of test period
Difference between RTD readings < 0.4 °F. Difference between RTD and thermocouple readings < 1.5 °F.
Identify cause of discrepancy and recalibrate heat meter
Reasonableness Check At least once during test Difference between DAS and manual calculation < 5 %
Identify discrepancies / recalibrate heat meter
Ambient Meteorological Conditions
Instrument calibration by manufacturer or certified laboratory
Beginning and end of test Temp: ± 1.08 oF Pressure: ± 0.11 % FS RH: ± 3 %
Identify cause of any problem and correct, or replace meter
Reasonableness checks Once per day during load tests
Recording should be comparable with handheld digital temp/RH meter
Identify cause of any problem and correct, or replace meter
a Results of these QA checks will be used to reconcile DQIs
3.2.4 Fuel Analyses Quality Assurance
QA/QC procedures for assessing gas composition data quality include duplicate analyses on at least one sample collected during the load testing (designated by the Field Team Leader), review of laboratory instrument calibrations, duplicate analysis of a blind audit gas sample, and confirmation of canister pressure prior to sampling. The primary method of reconciling the accuracy goal for gas composition consists of comparison the laboratory reported values with the audit gas. The method of reconciling the precision goal will be comparisons of duplicate analysis results.
During field testing, the GHG Center will supply one blind/audit gas sample to the laboratory for analysis. The audit gas will be an independent Natural Gas GPA Reference Standard manufactured by Scott Specialty Gases with a certified analytical accuracy of ± 2 percent. The audit gas will be shipped to the test location and the Field Team Leader will collect a canister sample of it immediately after one of the fuel gas samples is collected. He will ship the audit sample to the laboratory with the other fuel samples. The laboratory will analyze the audit sample in duplicate. The GHG Center will compute the average result from the two analyses and will compare the results to the certified concentration of each constituent. Allowable error, which is the sum of the instrument calibration criteria and the analytical accuracy of the audit gas, must be less than ± 3 percent for each gas constituent.
3-7

Duplicate analyses must conform to ASTM Specification D1945 repeatability guidelines. These guidelines vary according to the component’s concentration as illustrated in Table 3-4. Repeatability is the difference between two successive results obtained by the same operator with the same apparatus under constant operating conditions.
Table 3-4. ASTM D1945 Repeatability Specifications (ASTM 2001b)
Component Concentration mol (%)
Repeatability (absolute difference between 2 results)
0 to 0.1 0.01 0.1 to 1.0 0.04 1.0 to 5.0 0.07 5.0 to 10 0.08 over 10 0.1
Using these guidelines, and the anticipated ranges of gas component concentrations, Table 3-5 summarizes the target repeatability goals of primary gas components (i.e., components present in concentrations greater than 1 percent) for the duplicate analyses. The average difference between all duplicate results will be used to report the precision achieved.
Table 3-5. DQIs for Anticipated Component Concentrations
Gas Component Expected Concentration Range mol (%)
Repeatability DQI Goal (absolute difference of 2 results)
Butane 0.1 – 0.5 n/a Ethane 3.0 – 5.0 0.08
Heptane/ < 0.1 n/a Hexane < 0.1 n/a Methane 90 – 95 0.2 Pentane < 0.1 n/a Propane 1.0 – 3.0 0.07
Additional QA/QC checks include instrument calibrations and confirmation of canister pressures prior to sampling. The analytical laboratory conducts the calibrations on a weekly basis or whenever equipment changes are made on the instrument with a Natural Gas GPA Reference Standard such as the example in Appendix C-2. ASTM Specification D1945 criteria for calibration states that consecutive analytical runs on the gas standard must be accurate to within ± 1 percent of the certified concentration of each component. The laboratory will be required to submit calibration results for each day samples are analyzed.
The Field Team Leader will check sample canister pressures before collection of each sample to confirm that the canisters were properly evacuated at the laboratory prior to shipment to the site. He will employ an electronic vacuum gauge to measure the absolute pressure in each canister and will record the results on log forms. Any canisters with absolute pressures greater than 1 psi will not be used for sampling.
Following ASTM Specification D3588 guidelines, gas LHV and compressibility factor are calculated based on the gas compositional analysis. The GHG Center will therefore evaluate these parameters’
3-8

validity based on the compositional analyses. The specification includes the equations that are used to calculate repeatability of the LHV calculations provided the analytical repeatability criteria (Table 3-4) are met. The repeatability expected for duplicate samples is approximately 1.2 Btu/1,000 ft3, or about 0.1 percent. Using input from the oil and gas industry and the GHG Center’s experience with these analyses, a conservative DQI goal of ± 0.2 percent is established. If the GHG Center determines that the DQI goal for compositional analyses are met, then it can be deduced that the DQI goal for LHV has been met.
3.2.5 Heat Recovery Rate Quality Assurance
Heat recovery efficiency is the heat recovered divided by the turbine fuel heat input. Precise determination of the thermal heat recovery rate is required because it is a key performance parameter for the CHP system. At full load (60 kW), the facility estimates that the heat recovery unit will provide between 180,000 and 220,000 Btu/hr.
The Controlotron heat meter determines the heat recovery rate by measuring the glycol solution heat exchanger temperature difference (delta T) and flow rate. It then multiplies delta T, flow rate, glycol solution specific heat, and density to yield the heat recovery rate (Equation 4, Section 2.2.2). Table 3-3 shows that the DQI for fluid flow rate is a measured accuracy of ± 1.5 percent of reading. This accuracy will be verified using a NIST traceable fluid flow through calibration on the same type of tubing (2-inch Type L copper) at the factory. Table 3-3 also shows that the DQI for fluid temperature is ± 1.5 oF absolute error determined in the field using comparison with a NIST traceable reference thermocouple. This equates to a maximum delta temperature error of ± 3 oF, or a relative error of ± 2 percent at the expected average fluid temperature of 150 oF.
Section 2.2.2 states that the GHG Center will collect and the laboratory will analyze glycol solution samples from the CHP system prior to the start of testing. The Field Team Leader will compute the average volume percent glycol and input it into the heat meter as described above. The laboratory’s specified analytical error for the glycol concentration is ± 3.0, relative. This means that, for an expected 50.0 percent glycol solution, actual concentration could range between 48.5 and 51.5 percent. Because specific heat and density vary with different glycol compositions, the laboratory analytical error will introduce additional error into the heat meter’s heat recovery rate determination.
Quantification of the additional error requires evaluation of the density and specific heat at the conditions expected during testing. Given an average 150 oF temperature across the heat exchanger, the following table shows these values for glycol concentrations of 49.0 and 52.0 percent. Appendices A-9 and A-10 contain the source data for the interpolations presented here.
Table 3-6. Glycol Solution Density and Specific Heat Analytical Error
ρ23, lb/ft3 ρ26, lb/ft3 Cp23, Btu/lb.F Cp26, Btu/lb.F 63.33 63.25 0.8855 0.8870
Abs. Diff. 0.08 0.0015 Rel. Diff (%) 0.126 0.169
3-9

These errors compound multiplicatively as follows:
2 2Analysis Glycol from Error = ( 00126.0 ) + ( 00169.0 ) = 00211.0
This error compounds multiplicatively with the fluid flow rate error of 1.5 percent and the delta temperature error of 2.0 percent as follows:
2 2Error Meter Heat Overall = ( 015 .0 )2 + ( 02.0 ) + ( 00211.0 ) = 0250.0
This means that for the given assumptions, heat recovery rate will be 350,000 ± 8,750 Btu/hr, or a relative compounded error of ± 2.5 percent.
Tables 3-2 and 3-3 summarize the DQIs and QA/QC checks associated with this verification parameter. The following paragraphs discuss these checks. To ensure the energy meter’s accuracy requirements are met, the GHG Center will obtain factory calibrations for the flow transducers and RTDs. The meter zero check verifies a zero reading by the meter when the CHP system is not in operation. The energy meter’s fluid index check employs the ultrasonic signal transit time to verify the meter installation integrity. The meter’s software uses a series of look-up tables to assign a reference transit time signal based on input parameters which includes tubing specifications and fluid composition. After installation of the meter components, the Field Team Leader will compare the actual transit-time signal to the reference value. Differences between the actual and reference values in excess of 5.0 percent indicate and installation or programming error and a need for corrective action.
The Field Team Leader will independently verify RTD accuracy in the field. He will remove the RTDs from the fluid tubing and place them in an ice water bath along with thermocouples of known accuracy. Temperature readings from both sensors will be recorded for comparison. He will then repeat the procedure in a hot water bath. If the average differences in temperature readings are greater than 1.5 oF, the meter RTDs will be sent for re-calibration. Appendix B-10 contains the field data form.
A final quality assurance check consists of laboratory analysis of the working fluid mixture (see Section 2.2.2 for further detail). The lab will quantify volume percent of PG and provide instrument calibration records. In addition, a blind/audit sample of known PG concentration will be submitted to the laboratory for analysis, and results will be used to determine errors between laboratory reported values and the true concentration of the audit samples. The GHG Center will compare the average glycol composition analysis results to the value input to the heat meter. Values within ± 3.0 percent (i.e., the accuracy of the laboratory analysis) will ensure that the glycol composition did not change during the test campaign.
3.3 EMISSION MEASUREMENTS QA/QC PROCEDURES
The GHG Center will employ the EPA Reference Methods listed in Table 2-2 to determine emission rates of criteria pollutants and greenhouse gases during the load tests and emissions profile test. Table 3-6 summarizes the instrument type or measurement method, accuracy, and data quality indicator goals for this verification. The Reference Methods specify the sampling methods, calibrations, and data quality checks that must be followed to achieve a data set that meets the DQOs. These procedures ensure the quantification of run-specific instrument and sampling errors and that runs are repeated if the specific performance goals are not met. The GHG Center will assess emissions data quality, integrity, and
3-10

accuracy through these system checks and calibrations. Specific procedures to be conducted during this test are outlined in the following sections and summarized in Table 3-7. Satisfaction and documentation of each of the calibrations and QC checks will verify the accuracy and integrity of the measurements with respect to the DQIs listed in Table 3-7, and subsequently the DQOs for each pollutant.
3.3.1 NOx Emissions Quality Assurance
NOX Analyzer Interference Test
In accordance with Method 20, an interference test will be conducted on the NOx analyzer once before the testing begins. This test is conducted by injecting the following calibration gases into the analyzer:
CO – 500 ± 50 ppm in balance N2
CO2 – 10 ± 1 % in N2
O2 – 20.9 ± 1 %
For acceptable analyzer performance, the sum of the interference responses to all of the interference test gases must be ≤ 2 percent of the analyzer span value. Analyzers failing this test will be repaired or replaced.
NO2 Converter Efficiency Test
The NOx analyzer converts any NO2 present in the gas stream to NO prior to gas analysis. A converter efficiency test must be conducted prior to beginning the testing. This procedure is conducted by introducing to the analyzer a mixture of mid-level calibration gas and air. The analyzer response is recorded every minute thereafter for 30 minutes. If the NO2 to NO conversion is 100 percent efficient, the response will be stable at the highest peak value observed. If the response decreases by more than 2 percent from the peak value observed during the 30-minute test period, the converter is faulty. A NOx analyzer failing the efficiency test will be either repaired or replaced prior to testing.
3-11

Table 3-7. Instrument Specifications and DQI Goals for Stack Emissions Testing
Instrument Specifications Data Quality Indicators
Measurement Variable Instrument Type or Method
Instrument Accuracy
Frequency of Measurements
Overall Sampling System Accuracy Completeness How Verified /
Determined
Microturbine Emissions
NOX Concentrations
Chemilumenescense analyzer ± 1 % FS
1-minute averages (DAS polls analyzer outputs at 5second intervals)
± 2 % FS includes sampling system bias corrections)
100 % 3 valid runs at each specified load)
Follow EPA Method calibration and system performance check criteria
CO Concentrations NDIR analyzer ± 1 % FS
± 2 % FS (includes sampling system bias corrections)
THC Concentrations FID analyzer ± 1 % FS ± 5 % FS
CO2 / O2 Levels; Stack Gas Molecular Weight
NDIR (CO2) / paramagnetic or equivalent (O2)
± 1 % FS ± 2 % FS (includes sampling system bias corrections)
CH4 Concentrations GC / FID ± 0.1 % FS ± 5 % FS
Water Content Gravimetric ± 0.5 % FS (FS = 100 %)
Once per load condition ± 5 % FS
3-12

Table 3-8. Summary of Emissions Testing Calibrations and QC Checks
Measurement Variable Calibration/QC Check When
Performed/Frequency Expected or
Allowable Result
Response to Check Failure or Out of Control
Condition
CO, CO2, O2,
Analyzer calibration error test Daily before testing ± 2 % of analyzer span Repair or replace analyzer
System bias checks Before each test run ± 5 % of analyzer span Correct or repair sampling system
Calibration drift test After each test run ± 3 % of analyzer span Repeat test
Analyzer interference ± 2 % of analyzer span check Once before testing
begins Repair or replace analyzer
Emission Rates
NOX NO2 converter efficiency 98 % minimum Sampling system calibration error and drift checks
Before and after each test run ± 2 % of analyzer span Repeat test
THCs
System calibration error test Daily before testing ± 5 % of analyzer span Correct or repair sampling
system System calibration drift test After each test run ± 3 % of analyzer span Repeat test
CH4
Duplicate analysis Each sample ± 5 % difference Repeat analysis of same sample
Calibration of GC with gas standards by certified laboratory
Immediately prior to sample analyses and/or at least once per day
± 5 % for each compound Repeat calibration
NOX and THC Sampling System Calibration Error and Drift
The sampling system calibration error test must be conducted prior to the start of the first test on each day of testing the NOX sampling system. Note that the same procedures must be performed on the THC sampling system. The calibration is conducted by sequentially introducing a suite of calibration gases to the sampling system at the sampling probe, and recording the system response. Calibrations will be conducted on all analyzers using EPA Protocol No. 1 calibration gases. Four NOX, and THC calibration gases are required including zero, 20 to 30 percent of span, 40 to 60 percent of span, and 80 to 90 percent of span. The maximum allowable error in response to any of the calibration gases is ± 2 percent of span for NOX and ± 5 percent of span for THC.
At the conclusion of each test the zero and mid-level calibration gases are again introduced to the sampling systems at the probe and the response is recorded. System response is compared to the initial calibration error to determine sampling system drift. Drifts in excess of ± 2 percent for NOx and ± 3 percent for THC are unacceptable and the test will be repeated.
3.3.2 CO, CO2, and O2 Emissions Quality Assurance
Calibration Error, System Bias, and Calibration Drift Tests
These calibrations will be conducted to verify accuracy of CO, CO2, and O2 measurements. The calibration error test is conducted at the beginning of each day of testing. A suite of calibration gases is introduced directly to each analyzer and analyzer responses are recorded. EPA Protocol 1 calibration gases must be used for these calibrations. Three gases will be used for CO2, and O2 including zero, 40 to 60 percent of span, and 80 to 100 percent of span. Four gases will be used for CO including zero and
3-13

approximately 30, 60, and 90 percent of span. The maximum allowable error in monitor response to any of the calibration gases is ± 2 percent of span.
Before and after each test, the zero and mid-level calibration gases will be introduced to the sampling system at the probe and the response recorded. System bias will then be calculated by comparing the responses to the calibration error responses recorded earlier. System bias must be less than ± 5 percent of span for each parameter for the sampling system to be acceptable. The pre- and post-test system bias calibrations will also be used to calculate drift for each monitor. Drifts in excess of ± 3 percent will be considered unacceptable and the test will be repeated.
Appendix C-5 provides an example calibration records sheet.
3.3.3 CH4 Emissions Quality Assurance
GC/FID Calibration for CH4
CH4 samples will be collected and analyzed using a GC/FID following the guidelines of EPA Method 18. The GC/FID will be calibrated prior to sample analysis using certified standards for CH4. The accuracy of the analysis is ± 5 percent. Each analysis includes the following quality assurance procedures outlined in CFR Title 40, Part 60, Subpart GG, Appendix A, Method 18, Section 7.4.4 - Quality Assurance (EPA 1999b).
• Duplicate injection of each sample aliquot with agreement of all injections to within 5 percent of the mean;
• Three point calibration curves based on least-squares regression analysis; • Calibration curves developed prior to analysis; • Agreement of all calibration points with the theoretical value to within 5 percent.
After all samples have been analyzed, a mid-point calibration will be performed in triplicate. If the asanalyzed value for any compound detected in the test program does not agree within ± 5 percent of its pretest value, then a full post-test curve will be generated and all concentrations will be based upon the average of the pre- and post-test calibration points.
3.4 DETERMINATION OF COMPOSITE ERROR ESTIMATES
Electrical, thermal, and total CHP system efficiency parameters require determination of electrical power output, recovered heat, and fuel heat input. The efficiency DQOs for the microturbine and CHP system were presented earlier in Table 3-1. Determination of these errors requires propagation of errors for one or more individual measurements, each with their own characteristic absolute and relative errors. These errors compound into an overall uncertainty for each verification parameter, which is the DQO for that parameter. Errors compound differently, depending on the algebraic operation required for the overall determination (Skoog 1982).
In general, for measurements which are added to or subtracted from each other, their absolute errors compound as follows:
2err abs c = err1 + err2 2 (Eqn. 18),
3-14

Relative error, then, is: err abs c , (Eqn. 19)err rel c , =
Value1 +Value2
Where: errc,abs = compounded error, absolute err1 = error in first added value, absolute value err2 = error in second added value, absolute value errc,rel = compounded error, relative value1 = first added value value2 = second added value
For measurements which are multiplied or divided by each other, their relative errors compound as follows:
= 2 2
err1 err2
(Eqn. 20)+, err rel c value1 value2
Where: errc,rel = compounded error, relative err1 = error in first multiplied (or divided) value, absolute value err2 = error in second multiplied (or divided) value, absolute value value1 = first multiplied (or divided) value value2 = second multiplied (or divided) value
Table 3-8 applies the concepts summarized in Equations 18 and 20 to estimate the compounded errors in the electrical efficiency, thermal energy efficiency, and total CHP efficiency. The table includes the contributing measurements, determinations, and reference equations. Each resulting DQO is stated as an overall compounded relative error in percent.
3-15

Table 3-9. Combined Thermal and Electrical Energy Efficiency Error Propagation and DQOs
Measurement Expected Valuea
Measurement/Compounded Error
Abs. Rel. (%) Operation Type
Fuel flow rate (Vg) 12.8 scfm 0.13 scfm 1.0 Measurement error LHV 950 Btu/scf 2 Btu/scf 0.2 Measurement error Heat Input (HI, Btu/hr) 730,000 7500 r 1.02 Multiplication, Equation 3 Power output (kW) 60 kW 0.90 kW 1.50 Measurement error Power output (Btu/h) 205,000 3070 1.50 Measurement error Electrical Efficiency (ηe) 28.1 % 0.51 % 1.81b Division, Equation 1 Heat Recovery, (Btu/h) 350,000 8,750 2.5% Measurement error Thermal Efficiency, Turbine (ηth)
47.9 % 1.07 % 2.24 Division, Equation 5
Total Energy Recovery, (Btu/h) 555,000 7,640 1.38% Addition
Combined Efficiency, Turbine (ηtotal)
75.9 % 1.38 % 2.04%b Division
a Values given are for the microturbine at full load, 60 kW. b DQO for unit Efficiency
Air pollutant emissions are measured in terms of concentration and production rate (in pounds per hour). These results are divided by the electrical power production rate in kWh to yield the air pollutant emission rate in pounds per kilowatt-hour. To determine overall emission rate error, the contributing measurement errors must be propagated. For example, the contributing measurements for the NOX emission rate are stack gas concentration (ppmv converted to lb/dscf), exhaust gas flow rate (dscf/hr), and the total CHP power output (kW). The accumulated errors (i.e., DQIs) are ± 2.0. ± 5.0, and ± 1.5 percent, respectively. Compounding of errors in each of these measurements is multiplicative, similar to the discussion above. The result is an overall ± 5.59 percent relative error in the NOX pound per kilowatthour emission rate. The calculations for CO and CO2 are identical; For CH4 and THC the higher concentration error yields a composite error of 7.22 percent. Table 3-1 summarizes these DQOs for all emission measurements.
3.5 INSTRUMENT TESTING, INSPECTION, AND MAINTENANCE
The equipment used to collect verification data will be subject to the pre- and post-test QC checks discussed earlier. Before the equipment leaves the GHG Center or analytical laboratories, it will be assembled exactly as anticipated to be used in the field and fully tested for functionality. For example, all controllers, flow meters, computers, instruments, and other sub-components of the measurements system will be operated and calibrated as required by the manufacturer and/or this Test Plan. Any faulty subcomponents will be repaired or replaced before being transported to the test site. A small amount of consumables and frequently needed spare parts will be maintained at the test site. Major sub-component failures will be handled on a case-by-case basis (e.g., by renting replacement equipment or buying replacement parts).
The instruments used to make gas flow rate measurements are new, having been purchased for this verification. They will be inspected at the GHG Center’s laboratory prior to installation in the field to ensure all parts are in good condition. The equipment used to make gas pressure and temperature, and the
3-16

GHG Center’s Environmental Studies Group maintain ambient measurements. The mass flow meters, temperature, gas pressure, and other sensors will be submitted to the manufacturer for calibration prior to being transported to the test site.
3.6 INSPECTION/ACCEPTANCE OF SUPPLIES AND CONSUMABLES
Natural Gas Reference Standard gases will be used to calibrate the GC used for fuel analyses, and to prepare and blind audit sample for submittal to the laboratory. The concentrations of components in the audit gas are certified within ± 2 percent of the tag value. Copies of the audit gas certifications will be available on-site during testing and archived at the GHG Center.
EPA Protocol gases will be used to calibrate the gaseous pollutant measurement system. Calibration gas concentrations meeting the levels stated in Section 2.4 will either be generated from high concentration gases for each target compound using a dilution system or supplied directly from gas cylinders. Per EPA Protocol gas specifications, the actual concentration must be within ± 2 percent of the certified tag value. Copies of the EPA Protocol gas certifications will be available on-site.
3-17

(this page intentionally left blank)
3-18

4.0 DATA ACQUISITION, VALIDATION, AND REPORTING
4.1 DATA ACQUISITION AND STORAGE
Test personnel will acquire the following types of data during the verification:
Continuous measurements i.e., gas pressure, gas temperature, power output and quality, heat recovery, and ambient conditions, to be collected by the GHG Center’s DAS Fuel gas composition and heating value content from canister samples collected by the Field Team Leader and submitted to laboratory for analysis Volumetric gas flow measurements collected by the Field Team Leader Emission measurements data collected by contractor and supervised by the Field Team Leader.
The Field Team Leader will also take site photographs and maintain a Daily Test Log which includes the dates and times of setup, testing, teardown, and other activities.
The Field Team Leader will submit digital data files, gas analyses, chain-of-custody forms, and the Daily Test Log to the Project Manager. The Project Manager will initiate the data review, validation, and calculation process. These submittals will form the basis of the Verification Report which will present data analyses and results in table, chart, or text format as is suited to the data type. The Verification Report’s conclusions will be based on the data and the resulting calculations. The GHG Center will archive and store all data in accordance with the GHG Center QMP.
4.1.1 Continuous Measurements Data Acquisition
An electronic DAS will collect and store continuous process and ambient meteorological data. Core components of the DAS are an Allen-Bradley (AB) Model SLC 5/05 programmable logic controller (PLC) and a Gladiator Unix-based data acquisition computer data server (TOGA). Figure 4-1 is a schematic of the DAS.
The PLC brings all analog and digital signals from the measurement sensors together into a single realtime data source. The DAS can accommodate any combination of up to 16 analog signal channels with 4 to 20 mA current or DC voltage inputs. Sensors can also provide digital signals via the ModBus network to the DF1 interface unit. This converts the ModBus data to the AB “DF1” protocol which is compatible with the PLC. The PLC nominally polls each sensor once per second and converts the signals to engineering units. It then computes 1-minute averages for export to the TOGA and applies a common time stamp to facilitate data synchronization of all measurements.
4-1

Figure 4-1. DAS Schematic
(s)
Remote or Local Connection Through Ethernet or Modem
4 - 20 MA current loops to analog output sensors
Modbus Sensors
Remote or Local Computer
Data Acquisition System
The TOGA data server records information from the PLC and contains the software for programming the PLC (i.e., data sampling rates, engineering unit conversions, calibration constants). Its UNIX operating system writes all PLC data to a My-SQL relational database for export to spreadsheet, graphics, and other programs. This database is ODBC-compliant, which means that almost any MS Windows program can use the data. The data server includes an external modem and Ethernet card for remote and local communications. During normal operations, the user accesses the data server with a portable laptop or remote computer (PC) via its communications port, Ethernet link, or telephone connection. Spreadsheets allow the user to download the entire database or only that portion which has been added since the last download. The user then conducts data queries i.e., for certain times, dates, and selected data columns on the downloaded data as needed.
During the verification testing, GHG Center personnel will configure the DAS to acquire the process variables listed in Table 4-1. Note that the Field Team Leader will acquire the CHP power command and date/time data manually at the start of each test run.
4-2

Table 4-1 Continuous Data to be Collected for Microturbine Evaluation
Sensor / Source Measurement Parameter Purposea Significance Rosemount pressure transducer Fuel gas pressure (psia) P System performance parameter Omega Type K Thermocouple Fuel gas temperature (°F) P System performance parameter
Vaisala Model HMP60YO Ambient temperature (oF) P System performance parameter Ambient relative humidity (% RH) P System performance parameter
Setra Model 280E Ambient pressure in (Hg) P System performance parameter
Electric Meter 7600 ION
Voltage Output (volts) P System performance parameter Current (amps) P System performance parameter Power factor P System performance parameter Power Output (kW) P System performance parameter Kilovolt-amps reactive S System operational parameter Frequency (Hz) P System performance parameter Voltage THD (%) P System performance parameter Current THD (%) P System performance parameter
Capstone Communication System (logged by facility)
Power Command (kW) P User input parameter Glycol outlet setpoint temperature D System operational parameter Date, time D/S System operational parameter
Controlotron Energy Meter
Temperature of heated liquid exiting heat exchanger (oF) S System operational parameter
Temperature of cooled liquid entering heat exchanger(oF) S System operational parameter
Liquid flow rate (ft3/min) S System operational parameter Heat recovery rate (Btu/min) P System performance parameter
a D = Documentation/diagnostic P = Primary value: data used in verification S = Secondary value; used as needed to perform comparisons and assess apparent abnormalities
During field testing, the Field Team Leader will retrieve, review, and validate the electronically collected data at the end of each load testing. To determine if the criteria for electrical efficiency determinations are met, time series power output, power factor, gas flow rate, ambient temperature, and ambient pressure will be processed using the statistical analysis tool in Microsoft Excel. If it is determined that maximum permissible limits for each variable, meet the variability criteria in Tables 2-1 and 2-2, the electrical efficiency measurement goal will be met. Conversely, the load testing will be repeated until maximum permissible limits are attained. Data for this task will be maintained by computer and by handwritten entries. The Field Team Leader will record manually acquired data (i.e., test run information and observations) in the Daily Test Log and on the log forms in Appendix A. Disk copies of the Excel spreadsheet results will be made at the end of each day. The Field Team Leader will report the following results to the Project Manager:
• Electrical power generated at selected loads • Gas pressure and temperature at selected loads • Electrical efficiency at selected loads (estimated until gas analyses results are
submitted) • Heat recovery and use rate at selected loads • Thermal efficiency at selected loads • Net system efficiency
Data quality assurance checks for the instruments illustrated in Figure 2-1 were discussed in Section 3.0. Manual and electronic records (as required) resulting from these checks will be maintained by the Field Team Leader.
4-3

After the completion of all test runs, original field data forms, the Daily Test Log, and electronic copies of data output and statistical analyses will be stored at the GHG Center’s RTP office per guidelines described in the GHG Center’s QMP.
4.1.2 Fuel Flow Rate Measurement
Fuel gas flow rate measurement and QA/QC procedures are discussed in Section 2.2.3.3. The Field Team Leader will acquire flow meter at 5-minute intervals. After the test run is completed, the Field Team leader will compute actual volumetric flow rate for each 5-minute interval. The actual flow rate will be corrected to standard conditions using 1-minute average fuel gas temperature and pressure from continuous monitors, and will correspond to the fuel measurements time interval. The mean of all standard gas flow rates will represent the average fuel flow rate for the test run. This value will be used to compute electrical and thermal efficiency.
4.1.3 Emission Measurements
The emissions testing contractor will be responsible for all emissions data, QA log forms, and electronic files until they are accepted by the Field Team Leader. For pollutant quantified on-site with analyzers, the emissions contractor will use software to record the concentration signals from the individual monitors. The typical DAS records instrument output at one-second intervals, and averages those signals into 1-minute averages. At the conclusion of a test run, the pre-and post-test calibration results and test run values will be electronically transferred from the tester's DAS into a Microsoft Excel spreadsheet for data calculations and averaging.
The emissions contractor will report emission measurements results to the Field Team Leader as:
• Parts per million by volume (ppmv) • ppmv corrected to 15 percent O2
• Emission rate (lb/hr)
Upon completion of the field test activities, the emissions contractor will provide copies of records of calibration, pre-test checks, system response time, NO2 converter flow/efficiency, and field test data to Field Team Leader prior to leaving the site. Testing for CH4 requires analytical procedures that are conducted off-site at a laboratory. The contractor will provide copies of sample chain-of-custody records, analytical data, and laboratory QA/QC documentation for these parameters after field activities are finished. Before leaving the site, the contractor will also provide copies of the field data logs that document collection of each of these samples, as well as QA/QC documentation for the equipment used in collection of these samples (e.g., gas meters, thermocouples).
A formal report will be prepared by the contractor and submitted to GHG Center Field Team Leader within three weeks of completion of the field activities. The report will describe the test conditions, document all QA/QC procedures, include copies of calibrations, calibration gas, and the certification test results. Field data will be included as an appendix and an electronic copy of the report will be submitted. The submitted information will be stored at the GHG Center’s RTP office per guidelines defined in the QMP.
4-4
4.1.4 Fuel Gas Sampling
Fuel gas sampling and QA/QC procedures are discussed in Section 2.0. The Field Team Leader will maintain manual fuel sampling logs and chain-of-custody records. After the field test, the laboratory will submit results for each sample, calibration records, and repeatability test results to the Field Team Leader. Original lab reports and electronic copies of data output and statistical analyses will be stored at the GHG Center’s RTP office per guidelines described in the GHG Center’s QMP. After receipt of the laboratory analyses, the Field Team Leader will compute the actual electrical and thermal efficiency at each load tested and report the results to the Project Manager.
4.2 DATA REVIEW, VALIDATION, AND VERIFICATION
Data review and validation will primarily occur at the following stages:
• On-site -- by the Field Team Leader • Before writing the draft Verification Report -- by the Project Manager • During QA review of the draft Verification Report and audit of the data -- by the
GHG Center QA Manager
Figure 1-6 identifies the individuals who are responsible for data validation and verification.
The Field Team Leader will be able to review, verify, and validate some data (i.e., DAS file data, reasonableness checks) while on-site. Other data, such as fuel LHV and fuel gas properties, must be reviewed, verified, and validated after testing has ended. The Project Manager holds overall responsibility for these tasks.
Upon review, all collected data will be classed as valid, suspect, or invalid. The GHG Center will employ the QA/QC criteria discussed in Section 3.0; and specified in Tables 3-2, 3-3, and 3-5 through 3-9. Review criteria are in the form of factory and on-site calibrations, maximum calibration and other errors, and audit gas analyses results, and lab repeatability results.
In general, valid results are based on measurements which meet the specified DQIs and QC checks, that were collected when an instrument was verified as being properly calibrated, and that are consistent with reasonable expectations (e.g., manufacturers’ specifications, professional judgement).
The data review process often identifies anomalous data. Test personnel will investigate all outlying or unusual values in the field as is possible. Anomalous data may be considered suspect if no specific operational cause to invalidate the data is found.
All data, valid, invalid, and suspect will be included in the Verification Report. However, report conclusions will be based on valid data only and the report will justify the reasons for excluding any data. Suspect data may be included in the analyses, but may be given special treatment as specifically indicated. If the DQI goals cannot be met due to excessive data variability, the Project Manager will decide to either continue the test, collect additional data, or terminate the test and report the data obtained.
The QA Manager will review and validates the data and the draft Verification Report using the Test Plan and test method procedures. The data review and data audit will be conducted in accordance with the GHG Center’s QMP. For example, the QA Manager will randomly select raw data and independently calculate the Performance Verification Parameters dependent on that data. The comparison of these
4-5

calculations with the results presented in the draft Verification Report will yield an assessment of the QA/QC procedures employed by the GHG Center.
4.3 RECONCILIATION OF DATA QUALITY OBJECTIVES
A fundamental component of all verifications is the reconciliation of the data and its quality as collected from the field with the DQOs.
In general, when data are collected, the Field Team Leader and Project Manager will review them to ensure that they are valid and are consistent with expectations. They will assess the quality of the data in terms of accuracy and completeness as they relate to the stated DQI goals. Section 3.0 discusses each of the verification parameters and they’re contributing measurements in detail. It also specifies the procedures that field personnel will employ to ensure that DQIs are achieved; they need not be repeated here. If the test data show that DQI goals were met, then it will be concluded that DQOs were achieved; DQIs and DQOs will therefore be reconciled. The GHG Center will assess achievement of certain DQI goals during field testing because QC checks and calibrations will be performed on-site or prior to testing. Other DQIs, such as gas analysis repeatability, will be verified after field tests have concluded.
4.4 ASSESSMENTS AND RESPONSE ACTIONS
The quality of the project and associated data are assessed by the Field Team Leader, Project Manager, QA Manager, GHG Center Director, and technical peer-reviewers. The Project Manager and QA Manager independently oversee the project and assess its quality through project reviews, inspections if needed, performance evaluation audit (PEA), and an audit of data quality (ADQ).
4.4.1 Project Reviews
The review of project data and the writing of project reports are the responsibility of the Project Manager, who also is responsible for conducting the first complete assessment of the project. Although the project’s data are reviewed by the project personnel and assessed to determine that the data meet the measurement quality objectives, it is the Project Manager who must assure that project activities meet the measurement and DQO requirements.
The second review of the project is performed by the GHG Center Director, who is responsible for ensuring that the project’s activities adhere to the requirements of the program and expectations of the stakeholders. The GHG Center Director’s review of the project will also include an assessment of the overall project operations to ensure that the Field Team Leader has the equipment, personnel, and resources to complete the project as required and to deliver data of known and defensible quality.
The third review is that of the QA Manager, who is responsible for ensuring that the program management systems are established and functioning as required by the QMP and corporate policy. The QA Manager is the final reviewer within the SRI organization, and is responsible for assuring that QA requirements have been met.
The draft document will be then reviewed by the OEMC team and selected members of the DG Technical Panel. Technically competent persons who are familiar with the technical aspects of the project, but not involved with the conduct of project activities, will perform the peer-reviews. The peer-reviewers will provide written comments to the Project Manager. Further details on project review requirements can be found in the GHG Center’s QMP.
4-6

The draft report will then be submitted to EPA QA personnel, and comments will be addressed by the Project Manager. Following this review, the Verification Report and Statement will undergo EPA management reviews, including the GHG Center Program Manager, EPA ORD Laboratory Director, and EPA Technical Editor.
4.4.2 Inspections
Although not planned, inspections may be conducted by the Project Manager or the QA Manager. Inspections assess activities that are considered important or critical to key activities of the project. These critical activities may include, but are not limited to, pre- and post-test calibrations, the data collection equipment, sample equipment preparation, sample analysis, or data reduction. Inspections are assessed with respect to the Test Plan or other established methods, and are documented in the field records. The results of the inspection are reported to the Project Manager and QA Manager. Any deficiencies or problems found during the inspections must be investigated and the results and responses or corrective actions reported in a Corrective Action Report (CAR), shown in Appendix B-8.
4.4.3 Performance Evaluation Audit
Two PEAs are designed to check the accuracy of the PG analyses conducted by Enthalpy Analytical and the natural gas analyses performance by Core Laboratories. As discussed in Section 3.0, PG and fuel gas audit samples will contain analytes at a known concentration. At the invitation of the QA Manager, the Field Team Leader will conduct the PEAs. He will submit the audit materials to the laboratories in such a manner as to have the concentration of the PEAs unknown or blind to the analyst. Upon receiving the analytical data from the analyst, the Field Team Leader will evaluate the performance data for compliance with the requirements of the project, and report the findings to the QA Manager.
4.4.4 Technical Systems Audit
A Technical Systems Audit (TSA) assesses implementation of Test/QA Plans. Regarding internal TSAs, the GHG Center's QMP specifies that:
The Test/QA Plan for each test, or substantially similar group of tests, will be subject of a TSA. This will include field verification in a representative number of tests (at least one per year). Such occasions will be specified in the Test/QA Plan. These will be conducted by SRI’s QA staff.
The current verification is one of five verifications of CHP technologies planned during 2002-2003, several of which are in progress. The intention of the GHG Center is to perform a detailed TSA, including on-site field observation, on one of the earliest of these substantially similar tests, followed by less intensive audits on the remaining tests. These subsequent audits will focus on elements which are unique to the specific tests, and will probably involve interviews and inspection of records rather than field observation. The current verification will receive a TSA in one of these forms.
Since the current schedule of projects suggests that this verification will be one of the first of these substantially similar tests, it is a candidate for the detailed field audit. However, if schedule changes alter the order of the verifications, the "baseline" audit may be performed on another verification, and the TSA for this test will be of the "derivative" or update scope.
4-7

4.4.5 Audit of Data Quality
The ADQ is an evaluation of the measurement, processing, and data evaluation steps to determine if systematic errors have been introduced. During the ADQ, the QA Manager, or designee, will randomly select approximately 10 percent of the data to be followed through the analysis and data processing. The scope of the ADQ is to verify that the data-handling system functions correctly and to assess the quality of the data generated.
The ADQ, as part of the system audit, is not an evaluation of the reliability of the data presentation. The review of the data presentation is the responsibility of the Project Manager and the technical peerreviewer.
4.5 DOCUMENTATION AND REPORTS
During the different activities on this project, documentation and reporting of information to management and project personnel is critical. To insure the complete transfer of information to all parties involved in this project, the following field test documentation, QC documentation, corrective action/assessment report, and verification report/statements will be prepared.
4.5.1 Field Test Documentation
The Field Team Leader will record all important field activities. The Field Team Leader will review all data sheets and maintain them in an organized file. The required test information was described earlier in Sections 2.0 and 3.0. The Field Team Leader will also maintain a daily test log that documents the activities of the field team each day and any deviations from the schedule, Test Plan, or any other significant event. Any major problems found during testing that require corrective action will be reported immediately by the Field Team Leader to the Project Manager through a CAR. The Field Team Leader will document this in the project files and report it to the QA Manager.
The Project Manager will check the test results with the assistance of the Field Team Leader to determine whether the QA criteria were satisfied. Following this review and confirmation that the appropriate data were collected and DQOs were satisfied, the GHG Center Director will be notified.
4.5.2 QC Documentation
After the completion of verification test, test data, sampling logs, calibration records, certificates of calibration, and other relevant information will be stored in the project file in the GHG Center’s RTP office. Calibration records will include information about the instrument being calibrated, raw calibration data, calibration equations, analyzer identifications, calibration dates, calibration standards used and their traceabilities, calibration equipment, and staff conducting the calibration. These records will be used to prepare the Data Quality section in the Verification Report, and made available to the QA Manager during audits.
4.5.3 Corrective Action and Assessment Reports
A corrective action must occur when the result of an audit or quality control measurement is shown to be unsatisfactory, as defined by the DQOs or by the measurement objectives for each task. The corrective action process involves the Field Team Leader, Project Manager, and QA Manager. A written Corrective
4-8

Action Report, included in Appendix B-8, is required on major corrective actions that deviate from the Test Plan.
This Test plan includes validation processes to ensure data quality and establishes predetermined limits for data acceptability. Consequently, data determined to deviate from these objectives require evaluation through an immediate correction action process.
Immediate corrective action responds quickly to improper procedures, indications of malfunctioning equipment, or suspicious data. The Field Team Leader, as a result of calibration checks and internal quality control sample analyses, will most frequently identify the need for such an action. The Field Team Leader will immediately notify the Project Manager and will take and document appropriate action. The Project Manager is responsible for and is authorized to halt the work if it is determined that a serious problem exists. The Field Team Leader is responsible for implementing corrective actions identified by the Project Manager, and is authorized to implement any procedures to prevent the recurrence of problems.
The QA Manager will route the ADQ results to the Project Manager for review, comments, and corrective action. The results will be documented in the project records. The Project Manager will take any necessary corrective action needed and will respond by addressing the QA Manger’s comments in the final verification Report.
4.5.4 Verification Report and Verification Statement
The Project Manager will coordinate preparation of a draft Verification Report and Statement within 8 weeks of completing the field test, if possible. The Verification Report will specifically address the results of the verification parameters identified in the Test Plan.
The Project Manager will submit the draft Report and Statement to the QA Manager and Center Director for review. The Report will contain a Verification Statement, which is a 3 to 4 page summary of each CHP technology, the test strategy used, and the verification results obtained. The Verification Report will summarize the results for each verification parameter discussed in Section 2.0 and will contain sufficient raw data to support findings and allow others to assess data trends, completeness, and quality. Clear statements will be provided which characterize the performance of the verification parameters identified in Sections 1.0 and 2.0. A preliminary outline of the report is shown below.
4-9

Preliminary Outline Microturbine Verification Reports
Verification Statement
Section 1.0: Verification Test Design and Description Description of the ETV program Turbine system and site description Overview of the verification parameters and evaluation strategies
Section 2.0: Results Power production performance Power quality performance Operational performance Emissions performance
Section 3.0: Data Quality
Section 4.0: Additional Technical and Performance Data (optional) supplied by the test facility
References:Appendices: Raw Verification and Other Data
4.6 TRAINING AND QUALIFICATIONS
The GHG Center’s Field Team Leader has extensive experience (+15 years) in field testing of air emissions from many types of sources. He is also familiar with natural gas flow measurements from production, processing and transmission stations. He is familiar with the requirements of all of the test methods and standards that will be used in the verification test.
The Project Manager has performed numerous field verifications under the ETV program, and is familiar with requirements mandated by the EPA and GHG Center QMPs. The QA Manager is an independently appointed individual whose responsibility is to ensure the GHG Center’s activities are performed according to the EPA approved QMP.
4.7 HEALTH AND SAFETY REQUIREMENTS
This section applies to GHG Center personnel only. Other organizations involved in the project have their own health and safety plans - specific to their roles in the project.
GHG Center staff will comply with all known host, state/local and Federal regulations relating to safety at the test facility. This includes use of personal protective gear (e.g., safety glasses, hard hats, hearing protection, safety toe shoes) as required by the host and completion of site safety orientation (i.e., site hazard awareness, alarms and signals).
4-10

5.0 REFERENCES
ANSI/ASHRAE 1992. American National Standards Institute/American Society of Heating,Refrigeration And Air-Conditioning Engineers, Method of Testing Thermal Energy Meters for LiquidStreams in HVAC Systems – ANSI/ASHRAE 125, Atlanta, GA, 1992.
ANSI/IEEE 1989. American National Standards Institute / Institute of Electrical and ElectronicsEngineers, IEEE Master Test Guide for Electrical Measurements in Power Circuits, ANSI/IEEE Std.120-1989, New York, NY, October, 1989
ASME 1997a. American Society of Mechanical Engineers, Performance Test Code on Gas Turbines(PTC-22), New York, NY, 1997.
ASTM 2001a. American Society for Testing and Materials, Standard Practice for Calculating HeatValue, Compressibility factor, and Relative Density of Gaseous Fuels, ASTM D3588-98. WestConshohocken. PA, 2001.
ASTM 2001b. American Society for Testing and Materials, Standard Test method for Analysis of naturalgas by Gas Chromatography, ASTM D1945-9GRI, West Conshohocken, PA, 2001.
DOE/EPA 2000a. U.S. Department of Energy and U.S. Environmental Protection Agency. CarbonDioxide Emissions from the Generation of Electric Power in the United States,http://www.eia.doe.gov/cneaf/electricity/page/co2_report/co2emiss.pdf, July 2000.
DOE/EIA 2000b. U.S. Department of Energy, Energy Information Administration, Annual ElectricUtility Data, EIA-861, Data File, published annually,http://www.eia.doe.gov/cneaf/electricity/page/eia861.html,Washington, DC, 2000.
DOE/EIA, 2000c. U.S. Department of Energy, Energy Information Administration, Annual Steam-Electric Plant Operation and Design Data, EIA-767, Data File, http://www.eia.doe.gov/cneaf/electricity/page/eia767.html, 2000.
DOE/EIA 2001a. U.S. Department of Energy, Energy Information Administration, Office of Coal, Nuclear, Electric, and Alternate Fuels, Electric Power Annual 2000, Volumes I and II; DOE/EIA-0348(2000)/1, published annually, www.eia.doe.gov/cneaf/electricity/epav1/epav1.pdf, , Washington, DC. August 2001.
DOE/EIA 2001b. U.S. Department of Energy, Energy Information Administration, Office of Coal, Nuclear, Electric, and Alternate Fields, State Electricity Profiles - New York, http://www.eia.doe.gov/cneaf/electricity/st_profiles/new_york.pdf, , Washington, DC, November 2001.
EIA 2000a. Energy Information Administration, Annual Electric Utility Data (EIA-861 data file), http://www.eia.doe.gov/cneaf/electricity, 2000.
EPA 1999a. U.S. Environmental Protection Agency, Inventory of Greenhouse Gas Emissions and Sinks 1990-1997. Office of Policy, Planning, and Evaluation, EPA 236-R-99-003, www.epa.gov/globalwarming/inventory/1999-inv.html, Washington, DC, 1999.
5-1

EPA 1999b. Code of Federal Regulations, (Title 40, Part 60, Subpart GG), Standards of Performance for Stationary Gas Turbines, U.S. Environmental Protection Agency, Washington, DC, 1999.
EPA 2001. U.S. Environmental Protection Agency, Inventory of U.S. Greenhouse Gas Emissions and Sinks: 1990 - 1999, Annex A: Methodology for Estimating Emissions of CO2 from Fossil Fuel Combustion, EPA 236-R-01-001, www.epa.gov/globalwarming/publications/emissions/us2001/index.html, Washington, DC, April 2001.
FERC 2001. Federal Energy Regulatory Commission, FERC Form No. 1, Electric Utility Annual Report (published annually), www.ferc.gov/documents/forms/forms.htm#fm1 and http://rimsweb2.ferc.fed.us/form1viewer, Washington, DC, 2001.
IEEE 1993. Institute of Electrical and Electronics Engineers, IEEE Recommended Practices and Requirements for Harmonic Control in Electrical Power Systems, IEEE Std 519-1992, New York, NY, April 1993.
Lindeberg 1990. Michael R. Lindeberg, P.E., Engineer-in-Training Reference Manual, 7th Edition, Professional Publications, Inc., Belmont, CA, 1990.
Skoog 1982. Douglas A. Skoog and Donald M. West, Fundamentals of Analytical Chemistry, 4th Edition, CBS College Publishing, Philadelphia, PA, 1982.
SRI 2001. Southern Research Institute. Environmental Technology Verification Greenhouse Gas Technology Verification Quality Management Plan, Version 1.2, Research Triangle Park, NC, January 2001.
5-2

APPENDIX A
Test Procedures and Field Log Forms
PageAppendix A-1. Load Testing Procedures ................................................................................... A-2Appendix A-2. Load Test Log ................................................................................................... A-3Appendix A-3. Fuel Gas Sampling Procedures.......................................................................... A-4Appendix A-4. Fuel Gas Sampling Log ..................................................................................... A-5Appendix A-5. Sample Chain-of-Custody Record..................................................................... A-6Appendix A-6. Propylene Glycol Sampling Log ....................................................................... A-7Appendix A-7. Density of Propylene Glycol ............................................................................. A-8Appendix A-8. Specific Heat of Propylene Glycol .................................................................... A-9
Heat Meter RTD QA Check .............................................................................. A-10Appendix A-9. Appendix A-10. Heat Meter Setup and Reasonableness Check................................................... A-11
A-1

Appendix A-1. Load Testing Procedures
1. Enter the load setting, unit controller, nameplate, and other information onto the Load Test Log form.
2. Synchronize all clocks (e.g., test personnel, analyzer) with the DAS time display. Coordinate with emissions testing personnel to establish a test run start time. Record this time on the Load Test Log form.
3. Operate microturbines for a minimum of 0.5 hour during gas analyzer emissions test runs and a minimum of 1 hour for particulate runs. All reciprocating engine test runs are a minimum of 1 hour. Test duration for fuel cells and other technologies varies. Refer to the Test and Quality Assurance Plan for details.
4. For pipeline quality natural gas, obtain a minimum of two (2) fuel gas samples on each day of emissions testing: one immediately before test runs commence, one following their completion. During extended test periods, obtain a minimum of two (2) fuel gas samples per week. Sampling frequency for other fuels (digester gas, etc.) varies. Refer to the Test and Quality Assurance Plan for details.
5. During emissions testing at CHP facilities which use glycol solutions as a heat transfer fluid, obtain a minimum of one (1) glycol sample per day. During extended test periods, obtain a minimum of two (2) glycol samples per week. Heat transfer fluid samples are not required at facilities which use pure water.
6. At the end of each test run, review the data on the Load Test Log form and compare with the maximum permissible variations for microturbines, reciprocating engines, and fuel cells. If the criteria are met, declare an end for the test run. If not, continue operating the unit until the criteria are satisfied. Refer to the Test and Quality Assurance Plan for maximum permissible variations for other technologies.
7. Repeat each emission test run until three (3) valid runs are completed at each of the required load settings.
A-2 Rev. Nov. 2002

----
---- --
Appendix A-2. Load Test Log
Project ID: Location (city, state):
Date: Signature:
Unit Description: Run ID:
Clock synchronization performed (Initials):
Start End Diff % Diff ([Diff/Start]*100)
Acceptable? (see below)
Time
Load Setting, kW
Load Setting, %
Actual kW (DAS)
Fuel Flow, scfm
Fuel Gas Pressure, psia
Fuel Gas Temp., oF n/a
Ambient Temp., oF n/a
Ambient Pressure, psia
Heat Recovery Rate, BTU/min
Maximum Permissible Variations Microturbines
(PTC-22) Reciprocating Engines
(PTC-17) Fuel Cells
(Draft PTC-50) Power Output ± 2.0 % ± 3.0 % ± 2.0 % Power Factor ± 2.0 % ± 2.0 %
Fuel Flow ± 2.0 % ± 2.0 % Fuel Gas Pressure ± 2.0 % ± 1.0 %
Fuel Gas Temp. ± 3.0 oF Inlet/Ambient Temp. ± 4.0 % ± 5.0 oF ± 5.0 oF
Inlet/Ambient Pressure ± 0.5 % ± 1.0 % ± 0.5 %
Notes:
A-3 Rev. Nov. 2002

Appendix A-3. Fuel Gas Sampling Procedures
Important: Follow these procedures when the gas pressure is > 5 psi above atmospheric pressure.
Collect at least two (2) gas samples during each day of load testing, and two (2) samples per week during the extended monitoring period.
Attach a leak free vacuum gauge to the sample canister inlet. Open the canister inlet valve and verify that the canister vacuum is at least 15 “Hg. Record the gage pressure on the Fuel Sampling Log form.
Close the canister inlet valve, remove the vacuum gauge, and attach the canister to the fuel line sample port.
Open the fuel line sample port valve and check all connections for leaks with bubble solution or a hand held analyzer. Repair any leaks, then open the canister inlet valve. Wait five (5) seconds to allow the canister to fill with fuel.
Open the canister outlet valve and purge the canister with fuel gas for at least fifteen (15) but not more than thirty (30) seconds. Close the canister outlet valve, canister inlet valve, and fuel line sampling port valve in that order.
Obtain the fuel gas pressure and temperature from the DAS display. Enter the required information (date, time, canister ID number, etc.) on the Fuel Sampling Log (Appendix A-4a) and Chain of Custody Record (Appendix A-5) forms. Remove the canister from the sampling port.
Important: Follow these procedures when the gas pressure is < 5 psi above atmospheric pressure.
Construct a leak free gas extraction and collection system such as shown in the following sketch.
Peristaltic Pump
Sample Canister
- Pressure/vacuum Gauge
- Flow Control Valves
Gas Purge Vent
Canister Evacuation Loop
Make a leak free connection from the gas source to the inlet of the gas collection system.
Using the control valves and vacuum gauge, check and record the sample canister vacuum. If necessary, fully evacuate the canister using the peristaltic pump and control valves. Record the final canister vacuum (should be -25 in. Hg or less).
Isolate the evacuated canister and configure the valves so that gas is slowly vented through the purge vent (ensure proper ventilation of gas before starting the purge). Purge for 10 seconds.
(continued)
A-4 Rev. Nov. 2002

Appendix A-3. Fuel Gas Sampling Procedures (continued)
Close the purge vent, and slowly open the valves upstream of the canister and allow the canister to pressurize to no less than 2 psig.
With the pump still running, open the canister outlet valve and purge the canister for 5 seconds. Sequentially close the canister outlet valve, canister inlet valve, and pump inlet valve. Turn off pump.
Record the date, time, gas temperature (from DAS), canister ID number, and final canister pressure on log form (Appendix A-4b).
Return collected sample(s) to laboratory with completed chain-of-custody form (Appendix A-5).
A-5 Rev. Nov. 2002

Appendix A-4. Fuel Sampling Log
Project ID: Location (city, state):
Date: Signature:
Unit Description: Fuel Source (e.g., pipeline, digester):
Note: If desired, assign random sample ID numbers to prevent the lab from attributing analysis results to a particular test or audit sample. Transfer sample ID numbers to Chain-of-Custody Record prior to sample shipment.
Obtain sample pressure and temperature from the DAS display.
Date Time Run ID Sample ID Canister ID
Initial Vacuum
(“Hg)
Fuel Pressure
(DAS)
Fuel Temperature
(DAS)
Notes:
A-6 Rev. Nov. 2002

Appendix A-5. Sample Chain-of-Custody Record
Southern Research Institute Chain-of-Custody Record
Important: Use separate Chain-of-Custody Record for each laboratory and/or sample type.
Project ID:
Originator’s signature:
Sample description & type (gas, liquid, other.):
Laboratory:
Address:
Location (city, state):
Unit description:
Phone: Fax:
City: State: Zip:
Sample ID Bottle/Canister ID Sample Pressure Sample Temp. (°F) Analyses Req’d
Relinquished by: Date: Time: Received by: Date: Time:
Relinquished by: Date: Time: Received by: Date: Time:
Relinquished by: Date: Time: Received by: Date: Time:
Notes: (shipper tracking #, other)
A-7 Rev. Nov. 2002

Appendix A-6. PG Sampling Log
Project ID:______________________ Location (city, state):___________________________________
Date:____________________ Signature:____________________________________________
Unit Description:_________________________ Sampling Location (supply, return):_________________
Note: If desired, assign random sample ID numbers to prevent the lab from attributing analysis results to aparticular test or audit sample. Transfer sample ID numbers to Chain of Custody Record prior to sample shipment.
Obtain sample temperature from the DAS display.
Date Time (24 hr) Run ID Sample ID Sample Temp
Notes:
A-8 Rev. Nov. 2002

Appendix A-7. Density of Propylene Glycol (lb/ft3)
Density of Propylene Glycol (lb/ft3) Concentrations in Volume Percent Propylene Glycol
Source: ASHRAE 1997 (pg. 20.8) Temp (°F) 30% 40% 50% 60% -30 67.05 -20 66.46 66.93 -10 66.35 66.81
0 65.71 66.23 66.68 10 65.00 65.60 66.11 66.54 20 64.90 65.48 65.97 66.38 30 64.79 65.35 65.82 66.22 40 64.69 65.21 65.67 66.05 50 64.53 65.06 65.50 65.87 60 64.39 64.90 65.33 65.68 70 64.24 64.73 65.14 65.47 80 64.08 64.55 64.95 65.26 90 63.91 64.36 64.74 65.04
100 63.73 64.16 64.53 64.81 110 63.54 63.95 64.30 64.57 120 63.33 63.74 64.06 64.32 130 63.12 63.51 63.82 64.06 140 62.90 63.27 63.57 63.79 150 62.67 63.02 63.30 63.51 160 62.43 62.76 63.03 63.22 170 62.18 62.49 62.74 62.92 180 61.92 62.22 62.45 62.61 190 61.65 61.93 62.14 62.29 200 61.37 61.63 61.83 61.97 210 61.08 61.32 61.50 61.63 220 60.78 61.00 61.17 61.28 230 60.47 60.68 60.83 60.92 240 60.15 60.34 60.47 60.55 250 59.82 59.99 60.11 60.18
A-9 Rev. Nov. 2002

Appendix A-8. Specific Heat of Propylene Glycol (Btu/lb F)
Specific Heat of Propylene Glycol (Btu/lb °F) Concentrations in Volume Percent Propylene Glycol
Source: ASHRAE 1997 (pg. 20.8) Temp (°F) 30% 40% 50% 60% -30 0.741 -20 0.799 0.746 -10 0.804 0.752
0 0.855 0.809 0.758 10 0.898 0.859 0.814 0.764 20 0.902 0.864 0.820 0.770 30 0.906 0.868 0.825 0.776 40 0.909 0.872 0.830 0.782 50 0.913 0.877 0.835 0.787 60 0.917 0.881 0.840 0.793 70 0.920 0.886 0.845 0.799 80 0.924 0.890 0.850 0.805 90 0.928 0.894 0.855 0.811
100 0.931 0.899 0.861 0.817 110 0.935 0.903 0.866 0.823 120 0.939 0.908 0.871 0.828 130 0.942 0.912 0.876 0.834 140 0.946 0.916 0.881 0.840 150 0.950 0.921 0.886 0.846 160 0.953 0.925 0.891 0.852 170 0.957 0.929 0.896 0.858 180 0.961 0.934 0.902 0.864 190 0.964 0.938 0.907 0.869 200 0.968 0.943 0.912 0.875 210 0.971 0.947 0.917 0.881 220 0.975 0.951 0.922 0.887 230 0.979 0.956 0.927 0.893 240 0.982 0.960 0.932 0.899 250 0.986 0.965 0.937 0.905
A-10 Rev. Nov. 2002

Appendix A-9. Heat Meter RTD QA Check
The heat meter receives temperature signals from two (2) resistance temperature devices (RTDs), mounted upstream and downstream of the heat recovery unit. The data acquisition system (DAS) displays and records these temperatures. Evaluate the RTD performance by comparing the DAS displayed temperature values with a calibrated digital thermometer. As calibrated, the digital thermometer accuracy specification is ± 0.5 %, ± 1.3 oF or ± 2.2 oF at 190 oF.
Conduct the performance check at least once prior to the start of testing as follows:
1. Simultaneously immerse the digital thermometer thermocouple and the RTD under test. IMPORTANT: On direct contact RTDs, do not allow the top of the unit (with nameplate and electrical connector) to get wet.
2. While stirring, obtain the digital thermometer and DAS readings. Record below. 3. Repeat the procedure for hot water and ice baths. 4. Compare the RTD DAS readings to the digital thermometer readings. If differences equal or exceed 2.2 oF, the
RTDs should be submitted for recalibration. 5. Compare the RTD delta t readings. If delta t equals or exceeds 0.4 oF while the RTDs are suspended in the
same water bath, submit the RTD pair for recalibration.
Project ID: Location (city, state):
Date: Signature:
Digital Thermometer Make: Model: Serial No:
Thermocouple ID No: Last Calibration Date:
Performance Check Location (laboratory or field):
Heat Meter Make: Model: Serial No:
RTD1 Model: ID No: Type (contact/immersion):
RTD2 Model: ID No: Type (contact/immersion):
Bath Description
(hot/cool/ice)
RTD1 or RTD2?
RTD DAS Value
Digital Thermometer
Value Difference
Acceptable ?
(<2.2 oF)
delta t (RTD1-RTD2)
Acceptable ? (<0.4 oF)
A-11 Rev. Nov. 2002

Appendix A-10. Heat Meter Setup and Reasonableness Check
Date: Unit:
Heat Meter Make: Model # Serial #:
Signature:
Enter the following values into the heat meter software:
Pipe or Tubing OD: Material: Wall Thickness:
Nom. Dia Schedule 40 Steel Pipe Type L Copper Tubing
Actual OD Wall Thickness Actual ID Actual OD Wall
Thickness Actual ID
1 ¼ 1.660 0.140 1.380 1.375 0.055 1.265 1 ½ 1.900 0.145 1.610 1.625 0.060 1.505
2 2.375 0.154 2.067 2.125 0.070 1.985 2 ½ 2.875 0.203 2.469 2.625 0.080 2.465
3 3.500 0.216 3.068 3.125 0.090 2.945 3 ½ 4.000 0.226 3.548 3.625 0.100 3.425
Source: T. Baumeister, Ed. Standard Handbook for Mechanical Engineers, 7th Ed, McGraw Hill, NY, NY 1967
Acquire the following data from the DAS and perform the applicable calculations. Interpolate density and specific heat for Tavg from the reference table below or ASHRAE publications.
Date: Time (24-Hr):
tDAS t1 ___________
avg __________ t1-t2 _____________ DAS t2 ___________
DAS Gal/min ______ (Gal / min)
= ft 3 / min _____________ 4805.7
DAS Btu/min ______ Cp ______________
ρ _______________
Q = VρC p (t − t2 ) _______________ 1
Percent Difference: ( Btu DAS / min)−Q 100 * _____________
Q Acceptable? (< 5 %) (Y/N) ______________
Reference -- Water Specific Heat and Density
Temp, oF ρ, lb/ft3 Cp, Btu/lb.oF Temp, oF ρ, lb/ft3 Cp,
Btu/lb.oF Temp, oF ρ, lb/ft3 Cp, Btu/lb.oF
100 61.9951 0.99799 140 61.3818 0.99943 180 60.5821 1.00272 110 61.8616 0.99817 150 61.1955 1.00008 190 60.3552 1.00388 120 61.7132 0.99847 160 61.0027 1.00082 200 60.1234 1.00517 130 61.5548 0.99889 170 60.7956 1.00172 210 59.8784 1.00388
Source: Interpolated from R. Weast, Ed., CRC Handbook, 60th Ed., CRC Press, Inc., Boca Raton, FL. 1979
A-12 Rev. Nov. 2002

APPENDIX B
Quality Assurance/Quality Control Checks and Log Forms
PageAppendix B-1. 7600 ION Installation and Setup Checks ................................................................. B-2Appendix B-2. 7600 ION Sensor Function Checks .......................................................................... B-3Appendix B-3. Rosemount 3095 Installation Procedures ................................................................. B-4Appendix B-4. Rosemount 3095 Configuration ............................................................................... B-5Appendix B-5. Rosemount 3095, TriLoop, Heat Meter, and other Smart Sensor Function Checks B-7Appendix B-6. Ambient Monitoring Instrument Checks.................................................................. B-9Appendix B-7. RTD Performance Test............................................................................................. B-10 Appendix B-8. Corrective Action Report ......................................................................................... B-11
B-1

Appendix B-1. 7600/7500 ION Installation and Setup Checks
Project ID: Location (city, state):
Date: Signature:
Unit Description:
IMPORTANT: Conformance to applicable local codes supercede the instructions in this log sheet or the 7600/7500 ION installation manual
Only qualified personnel shall install current transformers (CTs) or voltage transformers (PTs). To avoid risk of fire or shock, be sure that the CT shorting switch(es) are installed and operated properly.
Note: Instructions below pertain to both the 7600-ION and 7500-ION power meters. Initial each item upon completion.
_______ Obtain and read the ION Installation and Basic Setup Manual (manual). It is the source of the items outlined below and is the reference for further questions.
_______ Verify that the ION calibration certificate(s) and supporting data are on hand.
_______ Mount the meter(s) in a well-ventilated location free of moisture, oil, dust, and corrosive vapors. Ensure that all wiring conforms to NEC standards.
_______ Verify that the ION power source is 110 VAC, nominal, protected by a switch or circuit breaker. If used with the DAS, plug the meter into the DAS uninterruptable power supply (UPS).
_______ Connect each ION ground terminal (usually the “Vref” terminal) directly to the switchgear earth ground with a dedicated AWG 12 gauge wire or larger. In most 4-wire WYE setups, jumper the “V4” terminal to the “Vref” terminal. Refer to the manual for specific instructions.
_______ Choose the proper CTs and PTs for the application. Install them in the power circuit and connect them to the ION power meters according to the directions in the manual (pages 8-14).
_______ Trace or color code each CT and PT circuit to ensure that they go to the proper meter terminals. Each CT must match its corresponding PT (i.e. connect the CT for phase A to meter terminals I11 and I12 and connect the PT for phase A to meter terminals V1 and Vref).
_______ Use a digital volt meter (DVM) to measure each phase’s voltage and current. Enter the data on the ION Sensor Function Checks form and compare with the ION front panel.
_______ Confirm that the ION front panel readings agree with the DAS display.
_______ Compare the ION and DAS readings to the unit’s panel or controller display. Enter this information in the Daily Test Log as is appropriate.
_______ Verify that the DAS is properly logging and storing data by downloading data to the laptop computer and reviewing it.
B-2 Rev. Aug. 2002

Appendix B-2. 7600/7500 ION Sensor Function Checks
Date: Project:
QA/QC Test Leader Name:
Phase Wiring (Delta or Wye):
Initial all items after they have been completed.
_____ 7600 ION calibration certificates and supporting data are on-hand.
_____ Check power supply voltage with a DMM (should be between 85 and 240 VAC.)
_____ Check the 7600 ION ground terminal connection for continuity with the switchgear earth ground.
_____ Use a digital multimeter (DMM) to check that the phase and polarity of the AC voltage inputs are correct.
_____ Verify the operation of the 7600 ION according to the instructions in the 7600 ION INSTALLATION & BASIC SETUP MANUAL [page 30].
_____ Using a DMM measure the voltage and current for each phase and compare them to the readings on the display of the 7600 ION. The readings on the DMM should agree (within the tolerance of the meters) with the readings from the 7600 ION.
_____ Confirm that the readings on the 7600 ION agree with the corresponding readings on the DAS. If they do not agree, troubleshoot the communications link until proper readings are obtained by the DAS.
_____ Verify that the readings are being properly stored on the DAS hard disk or other non-volatile memory.
Load %
24-hr Time
Voltage, V Current, Amps
Phase A Phase B Phase C Phase A Phase B Phase C 7600 ION DVM 7600
ION DVM 7600 ION DVM 7600
ION DVM 7600 ION DVM 7600
ION DVM
Average
% Diff = [(ION-DVM) / ION] * 100
B-3 Rev. Aug. 2002

Appendix B-3. Rosemount 3095 Installation Procedure
The gas flowmeter consists of a two-piece pipe spool which usually includes the proper upstream and downstream distances to disturbances (e.g., elbows, valves). Some spools do not include the lengths specified by AGA guidelines and, in these cases, the upstream/downstream lengths can be made up in line with the installed spool. In most cases, 29 diameters are required upstream, 5 downstream for meter runs. Refer to AGA Report 3, part 2 (2000 issue) for details.
Other components include an orifice plate, manifold assembly, 3095 mass flow transmitter, and separate RTD process temperature sensor.
Project ID: Location (city, state):
Date: Signature:
Unit Description: Gas Supply Description:
____ Install the orifice plate in the meter run. Be sure that the side stamped “inlet” faces the upstream meter run section. Use new O-rings, and torque the bolts partially before tightening fully. On orifice flanges with more than two (2) bolts, tighten all bolts in a star pattern to crush the O-rings evenly.
____ Install the meter run in a safe, accessible, and vibration-free section of pipe. Use the proper thread sealant on threaded connections. On flanges, use new flange gaskets and tighten all bolts partially before tightening fully. Use a star pattern to crush the gaskets evenly.
____ Install the manifold and 3095 transmitter onto the meter run with new O-rings. Tighten all bolts partially before tightening fully.
____ Install the RTD just outside the meter run. Adjust the connection nipple length to ensure that the end of the RTD is in the center of the fuel pipe. Plug the RTD connector into the 3095 receptacle.
____ Pressurize the pipe and leak check all connections with bubble solution or handheld detector.
____ Energize the mass flow transmitter and ensure that the configuration is consistent with the data entered on the “Rosemount 3095 Configuration” form.
B-4 Rev. Aug. 2002

Appendix B-4. Rosemount 3095 Configuration
Enter the 3095 mass flow meter, orifice (primary element) and gas information onto this form.Use the Rosemount MV Engineering Assistant (EA) and AMS Configurator software to program the 3095
transmitter with the data on this form.
Project ID: Location (city, state):
Date: Signature:
Unit Description: Gas Supply Description:
Engineering Assistant Entries
Enter the following data into the EA <Configure Flow> menu series. When finished, save the configuration to disk. Then, download it to the mass flow transmitter.
Configuration file name (*.mv); include path:______________________________________________
Gas Composition Methane (CH4) n-Butane (C4H10) Nitrogen (N2) i-Pentane (C5H12) Carbon Dioxide (CO2) n-Pentane (C5H12) Ethane (C2H6) n-Hexane (C6H14) Propane (C3H8) n-Heptane (C7H16) Water (H2O) n-Octane (C8H18) Hydrogen Sulfide (H2S) n-Nonane (C9H20) Hydrogen (H2) n-Decane (C10H22) Carbon Monoxide (CO) Helium (He) Oxygen (O2) Argon (Ar) i-Butane (C4H10)
Primary Element Selection: Check the appropriate entry or choose alternatives from the EA menu items. Enter different choices in the blanks provided.
Category: Specific Primary Element (orifice plate types): Orifice Plate 1195 Mass ProPlate Other; Describe: 1195 Mass ProPlate, Calibrated Cd
Flange Taps, AGA Other; Describe:
Notes:
(continued)
B-5 Rev. Aug. 2002

Appendix B-4. Rosemount 3095 Configuration Engineering Assistant Entries (continued)
Element and Meter Tube Data:
Element Min. Dia. (in): at (68 oF default): Mat’l (304 stainless, other)
Meter Tube Dia. (in): at(68 oF default): Mat’l (carbon steel, other)
Operating Conditions: Specify the ranges that will include the conditions expected during each test run.
Pressure range: to Units: (psia; psig)
Temperature range: to Units: ( oF; oC)
Flow units: (StdCuFt/min; StdCuFt/hr)
*Atmospheric pressure: Units: (psia)
**Reference conditions: Units: (psia) at ( oF)
* Enter the atmospheric pressure expected under normal weather conditions at the site’s elevation. This allows the 3095 to report gage pressure if desired.
** Gas industry standard conditions are 14.7 psia, 60 oF.
AMS Configurator Entries
In the AMS Configurator, right click on the transmitter icon, then click on the <3095 Configuration Properties> menu item. Select the “Basic Setup” tab for the following entries. Defaults are in parentheses.
DP (orifice delta P) units (in H2O):
AP (absolute pressure) units (psi):
PT (process temperature) units (oF):
Flow units (StdCuFt/min; StdCuFt/hr):
Analog output: URV (upper range value or upper engineering value): Units:
LRV (lower range value or lower engineering value): Units:
Notes:
B-6 Rev. Aug. 2002

Appendix B-5. Rosemount 3095 TriLoop, Heat Meter, and Other Smart Sensor Function Checks
Check and record loop power supply voltage.
Enter sensor information in the appropriate table.
“Smart” sensors allow the operator to command current and voltage outputs to check sensor and DAS functions. Command Rosemount 3095 and TriLoop sensors from the MV Engineering Assistant, <AMS Configurator>, <Diagnostics and Tests> menu items. Command Controlotron Heat Meter outputs fron the <Diagnostics>, <Energy Data>, <Energy ANCAL> and <Diagnostics>, <Flow Data>, <AnCal> menues for heat rate and flow, respectively.
Command 4 mA (lowest level engineering units) and 20 mA (highest level engineering units) outputs from each sensor and record the resulting data in the appropriate table cells. Return all sensors to normal operating modes.
Isolate the Rosemount 3095 mass flow transmitter from the gas pipeline by closing the left and right manifold valves. Open the center valve to equalize the differential pressure (delta P) across the transmitter. Enter “actual zero/4.00 mA” in the “Sensor Output Command” table cell and complete the other table entries. Close the center and open the left and right manifold valves to restore normal operation.
(continued)
B-7 Rev. Aug. 2002

Appendix B-5. Rosemount 3095 TriLoop, Heat Meter, and Other Smart Sensor Function Checks (continued)
Project ID: Location (city, state):
Signature: Loop Voltage (11-30 VDC Acceptable):
Sensors
Designator Make Model No. Serial No.
Date Time (24 hour)
Operator Initials
Sensor Designator (see above)
Variable (flow, delta
P, psia, other)
Sensor Output
Command, mA
DVM Reading,
mA
% Diff ([DVM-
Command]/ DVM*100)
Acceptable? (< 2.2
%)
DVM Expected
Value
DAS Value
% Diff ([DVM-DAS]/
DVM*100)
Accept-able? (< 2.2 %)
Rev. Aug. 2002 B-8

Appendix B-6. Ambient Monitor Instrument Checks
Note: Route all signal wires away from motors, power mains, or other electrically noisy equipment. Do not use 2-way radios near instruments.
Project ID: Location (city, state):
Ambient Pressure Reasonableness Check
Date: Signature:
Site elevation, ft: Source of elevation data:
Note: Obtain local barometric pressure from airport, National Weather Service, Internet, weather radio, or other. Altitude correction (Corralt) is ≈ 1” Hg per 1000 ft elevation. For exact values, refer to Instruction Booklet for use with Princo Fortin Type Mercury Barometers, http://www.princoinstruments.com/barometers.htm, Table 8, “Pressure Altitude ...”
Pbar, “Hg: Source of Data: Corralt, “Hg:
Psta=Pbar-Corralt: Psta, “Hg:
Psta * 0.491 = Psta, psia: DAS Amb. press., psia:
Difference, psia: Difference should be < 0.2 psia.
Temperature, Relative Humidity Reasonableness Checks
Place Omega temp/RH meter in shade adjacent to the Visala sensor shield. Compare DAS temperature and relative humidity display to handheld Omega temp/RH meter display.
Date: Signature:
DAS Temp Omega Temp Difference Acceptable?
(within 2 oF) DAS RH Omega RH Difference Acceptable ? (within 8
%)
Notes:
B-9 Rev. Aug. 2002

Appendix A-9. Heat Meter RTD QA Check
The heat meter receives temperature signals from two (2) resistance temperature devices (RTDs), mounted upstream and downstream of the heat recovery unit. The data acquisition system (DAS) displays and records these temperatures. Evaluate the RTD performance by comparing the DAS displayed temperature values with a calibrated digital thermometer. As calibrated, the digital thermometer accuracy specification is ± 0.5 %, ± 1.3 oF or ± 2.2 oF at 190 oF.
Conduct the performance check at least once prior to the start of testing as follows:
6. Simultaneously immerse the digital thermometer thermocouple and the RTD under test. IMPORTANT: On direct contact RTDs, do not allow the top of the unit (with nameplate and electrical connector) to get wet.
7. While stirring, obtain the digital thermometer and DAS readings. Record below. 8. Repeat the procedure for hot water and ice baths. 9. Compare the RTD DAS readings to the digital thermometer readings. If differences equal or exceed 2.2 oF, the
RTDs should be submitted for recalibration. 10. Compare the RTD delta t readings. If delta t equals or exceeds 0.4 oF while the RTDs are suspended in the
same water bath, submit the RTD pair for recalibration.
Project ID: Location (city, state):
Date: Signature:
Digital Thermometer Make: Model: Serial No:
Thermocouple ID No: Last Calibration Date:
Performance Check Location (laboratory or field):
Heat Meter Make: Model: Serial No:
RTD1 Model: ID No: Type (contact/immersion):
RTD2 Model: ID No: Type (contact/immersion):
Bath Description
(hot/cool/ice)
RTD1 or RTD2?
RTD DAS Value
Digital Thermometer
Value Difference
Acceptable ?
(<2.2 oF)
delta t (RTD1-RTD2)
Acceptable ? (<0.4 oF)
B-10 Rev. Aug. 2002

Figure B-8. Corrective Action Report
Corrective Action Report
Verification Title:
Verification Description:
Description of Problem:
Originator: Date:
Investigation and Results:
Investigator: Date:
Corrective Action Taken:
Originator: Date: Approver: Date:
Carbon copy: GHG Center Project Manager, GHG Center Director, SRI QA Manager, APPCD Project Officer
B-11 Rev. Aug. 2002

(this page intentionally left blank)
B-12

APPENDIX C
Example Test and Calibration Data
PageAppendix C-1. Example of Core Laboratories Gas Analysis Results............................................... C-2Appendix C-2. Example of Core Laboratories Calibration Data ...................................................... C-3Appendix C-3. Example of Exhaust Stack Emission Rate Results................................................... C-4Appendix C-4. Example of Exhaust Stack Raw Emission Measurements Data............................... C-5Appendix C-5. Example of Exhaust Stack Emission Measurements Calibration Data .................... C-6
C-1
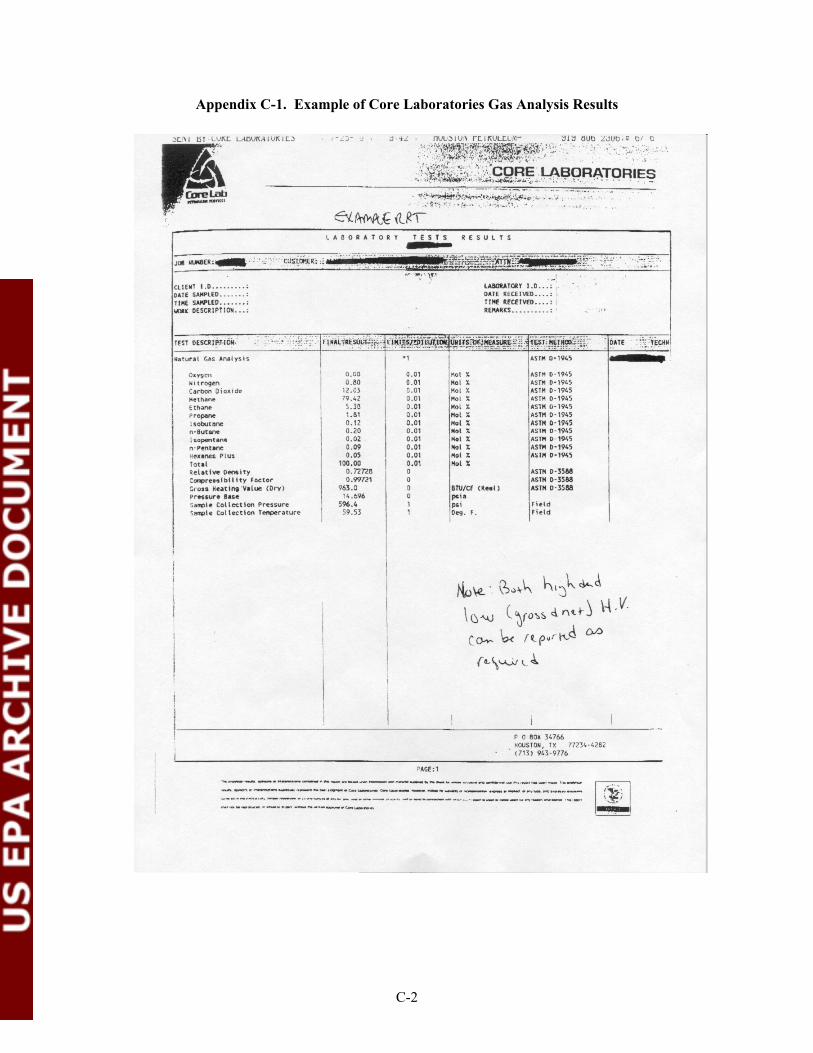
Appendix C-1. Example of Core Laboratories Gas Analysis Results
C-2

Appendix C-2. Example of Core Laboratories Calibration Data
C-3

Appendix C-3. Example of Exhaust Stack Emission Rate Results
C-4

Appendix C-4. Example of Exhaust Stack Raw Emission Measurements Data
C-5

Appendix C-5. Example of Exhaust Stack Emission Measurements Calibration Data
C-6