Paper 4: Sec 4.4.3) Project Management with Majid Tahir
4
Paper 4: Sec 4.4.3) Project Management Computer Science 9608 with Majid Tahir 1 Email: [email protected] www.majidtahir.com Contact: +923004003666 Syllabus Content: 4.4 Software development 4.4.3 Project management show understanding that large developments will involve teams show understanding of the need for project management show understanding of project planning techniques including the use of GANTT and Program Evaluation Review Technique (PERT) charts describe the information that GANTT and PERT charts provide construct and edit GANTT and PERT charts 4.2.3: Project Management: PERT Chart: PERT Program Evaluation Review Technique (PERT) charts, was developed for the US Navy to simplify the planning and scheduling of a large and complex project. It is a method to analyse the activities required to complete a project, especially the time required to complete each activity. It also helps to identify the minimum time needed to complete the project (critical path analysis). Program Evaluation Review Technique (PERT) charts show each task in a project as a node. An activity may result in a document, a report or some other building block of the project. Such a building block is called a deliverable. A milestone is a scheduled event signifying the completion or submission of a deliverable Dependencies between tasks (e.g. where one task requires another one to be completed before it can start) are clearly shown by interconnections between the task nodes. PERT charts also show timing information for each task. Project managers can use PERT charts to: set a realistic timetable for project completion make sure focus is maintained on the most critical tasks for the critical path – since the path leads to the minimum time the project requires, any delays to these tasks will result in a delay to the overall project identify tasks that need to be shortened if the overall project time needs to be reduced identify tasks that can be carried out simultaneously
Transcript of Paper 4: Sec 4.4.3) Project Management with Majid Tahir

Paper 4: Sec 4.4.3) Project Management Computer Science 9608
with Majid Tahir
1 Email: [email protected] www.majidtahir.com Contact: +923004003666
Syllabus Content:
4.4 Software development
4.4.3 Project management show understanding that large developments will involve teams
show understanding of the need for project management
show understanding of project planning techniques including the use of GANTT and
Program Evaluation Review Technique (PERT) charts
describe the information that GANTT and PERT charts provide
construct and edit GANTT and PERT charts
4.2.3: Project Management:
PERT Chart:
PERT Program Evaluation Review Technique (PERT) charts, was developed for the US Navy to simplify the planning and scheduling of a large and complex project. It is a method to analyse the activities required to complete a project, especially the time required to complete each activity. It also helps to identify the minimum time needed to complete the project (critical path analysis).
Program Evaluation Review Technique (PERT) charts show each task in a project as a node. An activity may result in a document, a report or some other building block of the project. Such a building block is called a deliverable. A milestone is a scheduled event signifying the completion or submission of a deliverable
Dependencies between tasks (e.g. where one task requires another one to be
completed before it can start) are clearly shown by interconnections between the task
nodes.
PERT charts also show timing information for each task.
Project managers can use PERT charts to:
set a realistic timetable for project completion make sure focus is maintained on the most critical tasks for the critical path – since the
path leads to the minimum time the project requires, any delays to these tasks will result in a delay to the overall project
identify tasks that need to be shortened if the overall project time needs to be reduced identify tasks that can be carried out simultaneously

Paper 4: Sec 4.4.3) Project Management Computer Science 9608
with Majid Tahir
2 Email: [email protected] www.majidtahir.com Contact: +923004003666
Milestones are shown as numbered nodes.
Activities are represented by arrows linking the milestones. The arrows are labelled
with the activity code below the arrow and the duration above the arrow.
Nodes 1, 2, 3, 5, 6, 7, 8, 10 and 11 are joined by solid arrows.
These activities must be completed in sequence; they are called 'dependent activities'.
Activities that must be completed in sequence but that don't require resources or
completion time are represented by dotted lines and are called 'dummy activities'.
The dotted line between milestones 3 and 4 indicates that the program modules must
be tested before software installation can begin, but the time required to do the testing
is on another path (path D).
Paper 4: Sec 4.4.3) Project Management Computer Science 9608
with Majid Tahir
3 Email: [email protected] www.majidtahir.com Contact: +923004003666
Critical path
The critical path is the longest possible continuous pathway from Start to Finish. It determines
the shortest time required to complete the project. Any time delays along the critical path will
delay the final milestone
In Worked Example 30.02, the critical path is A, B, C, E, F, G, K, L. This means the shortest possible time to complete the project is 20 weeks.
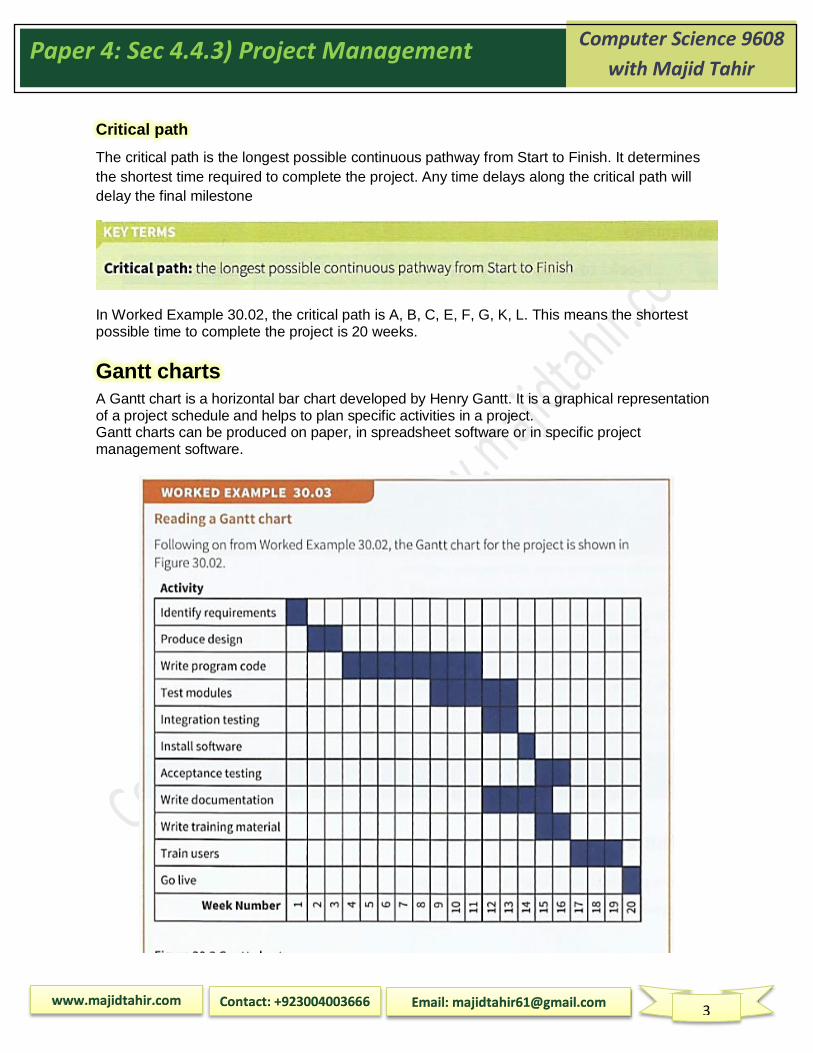
Gantt charts
A Gantt chart is a horizontal bar chart developed by Henry Gantt. It is a graphical representation of a project schedule and helps to plan specific activities in a project. Gantt charts can be produced on paper, in spreadsheet software or in specific project management software.

Paper 4: Sec 4.4.3) Project Management Computer Science 9608
with Majid Tahir
4 Email: [email protected] www.majidtahir.com Contact: +923004003666
Figure 30.02 demonstrates the following features:
The horizontal axis represents time. In this example the schedule is worked out in weekly steps. This could be done on a daily or monthly basis, depending on the overall length of the project.
Individual activities are shown as horizontal bars, one activity per row.
Activities can overlap. In this example, module testing can begin before all the program code has been written. The documentation can be started before all the testing has been completed.
Some activities can only begin when others have been completed. In this example, integration testing can only start after all modules have been successfully tested.
Software can only be installed after integration testing has been successfully completed.
If any activities take longer than planned, the chart may need to be modified to represent the
revised schedule. For example, if serious problems are encountered during acceptance testing, further design, program coding, module testing and integration testing may be required. Refrences:
AS & A level Course Book by Sylvia Langfield & Dave Duddell A level 9608 Pastpaers