TABLES - who.int · 13 weeks RCT 1 A Singapore RV1 RR 2.53 0.13 48.89 3/1779 0/642 - 20 weeks RCT 1...
51
2 TABLES ROTAVIRUS VACCINES SCHEDULES: A SYSTEMATIC REVIEW OF SAFETY AND EFFICACY FROM RANDOMIZED CONTROLLED TRIALS AND OBSERVATIONAL STUDIES OF CHILDHOOD SCHEDULES USING RV1 AND RV5 VACCINES REPORT TO WHO/IVR KARLA SOARES-WEISER (MD, PHD) ENHANCE REVIEWS LTD
-
Upload
duongduong -
Category
Documents
-
view
215 -
download
0
Transcript of TABLES - who.int · 13 weeks RCT 1 A Singapore RV1 RR 2.53 0.13 48.89 3/1779 0/642 - 20 weeks RCT 1...

2
TABLES
ROTAVIRUS VACCINES SCHEDULES: A SYSTEMATIC REVIEW OF SAFETY AND EFFICACY FROM RANDOMIZED CONTROLLED TRIALS AND OBSERVATIONAL STUDIES OF CHILDHOOD SCHEDULES USING RV1 AND RV5 VACCINES
REPORT TO WHO/IVR
KARLA SOARES-WEISER (MD, PHD)
ENHANCE REVIEWS LTD
3
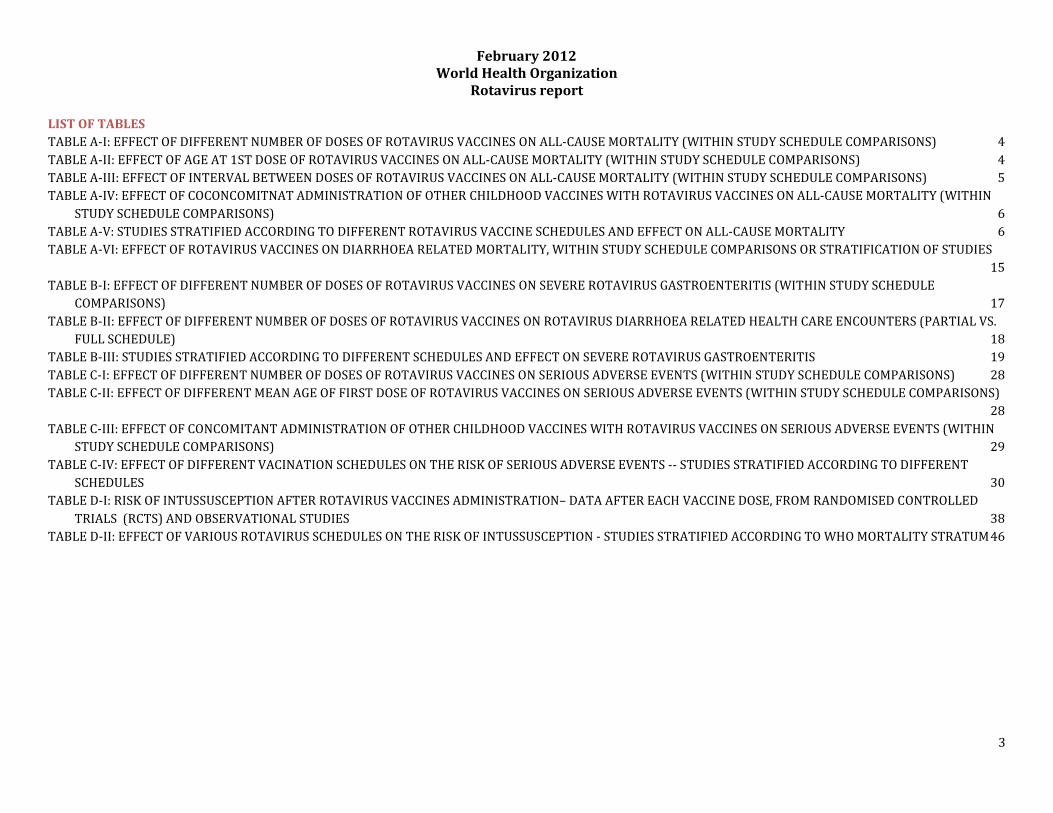
February 2012 World Health Organization
Rotavirus report
LIST OF TABLES TABLE A-I: EFFECT OF DIFFERENT NUMBER OF DOSES OF ROTAVIRUS VACCINES ON ALL-CAUSE MORTALITY (WITHIN STUDY SCHEDULE COMPARISONS) 4 TABLE A-II: EFFECT OF AGE AT 1ST DOSE OF ROTAVIRUS VACCINES ON ALL-CAUSE MORTALITY (WITHIN STUDY SCHEDULE COMPARISONS) 4 TABLE A-III: EFFECT OF INTERVAL BETWEEN DOSES OF ROTAVIRUS VACCINES ON ALL-CAUSE MORTALITY (WITHIN STUDY SCHEDULE COMPARISONS) 5 TABLE A-IV: EFFECT OF COCONCOMITNAT ADMINISTRATION OF OTHER CHILDHOOD VACCINES WITH ROTAVIRUS VACCINES ON ALL-CAUSE MORTALITY (WITHIN
STUDY SCHEDULE COMPARISONS) 6 TABLE A-V: STUDIES STRATIFIED ACCORDING TO DIFFERENT ROTAVIRUS VACCINE SCHEDULES AND EFFECT ON ALL-CAUSE MORTALITY 6 TABLE A-VI: EFFECT OF ROTAVIRUS VACCINES ON DIARRHOEA RELATED MORTALITY, WITHIN STUDY SCHEDULE COMPARISONS OR STRATIFICATION OF STUDIES
15 TABLE B-I: EFFECT OF DIFFERENT NUMBER OF DOSES OF ROTAVIRUS VACCINES ON SEVERE ROTAVIRUS GASTROENTERITIS (WITHIN STUDY SCHEDULE
COMPARISONS) 17 TABLE B-II: EFFECT OF DIFFERENT NUMBER OF DOSES OF ROTAVIRUS VACCINES ON ROTAVIRUS DIARRHOEA RELATED HEALTH CARE ENCOUNTERS (PARTIAL VS.
FULL SCHEDULE) 18 TABLE B-III: STUDIES STRATIFIED ACCORDING TO DIFFERENT SCHEDULES AND EFFECT ON SEVERE ROTAVIRUS GASTROENTERITIS 19 TABLE C-I: EFFECT OF DIFFERENT NUMBER OF DOSES OF ROTAVIRUS VACCINES ON SERIOUS ADVERSE EVENTS (WITHIN STUDY SCHEDULE COMPARISONS) 28 TABLE C-II: EFFECT OF DIFFERENT MEAN AGE OF FIRST DOSE OF ROTAVIRUS VACCINES ON SERIOUS ADVERSE EVENTS (WITHIN STUDY SCHEDULE COMPARISONS)
28 TABLE C-III: EFFECT OF CONCOMITANT ADMINISTRATION OF OTHER CHILDHOOD VACCINES WITH ROTAVIRUS VACCINES ON SERIOUS ADVERSE EVENTS (WITHIN
STUDY SCHEDULE COMPARISONS) 29 TABLE C-IV: EFFECT OF DIFFERENT VACINATION SCHEDULES ON THE RISK OF SERIOUS ADVERSE EVENTS -- STUDIES STRATIFIED ACCORDING TO DIFFERENT
SCHEDULES 30 TABLE D-I: RISK OF INTUSSUSCEPTION AFTER ROTAVIRUS VACCINES ADMINISTRATION– DATA AFTER EACH VACCINE DOSE, FROM RANDOMISED CONTROLLED
TRIALS (RCTS) AND OBSERVATIONAL STUDIES 38 TABLE D-II: EFFECT OF VARIOUS ROTAVIRUS SCHEDULES ON THE RISK OF INTUSSUSCEPTION - STUDIES STRATIFIED ACCORDING TO WHO MORTALITY STRATUM 46
4
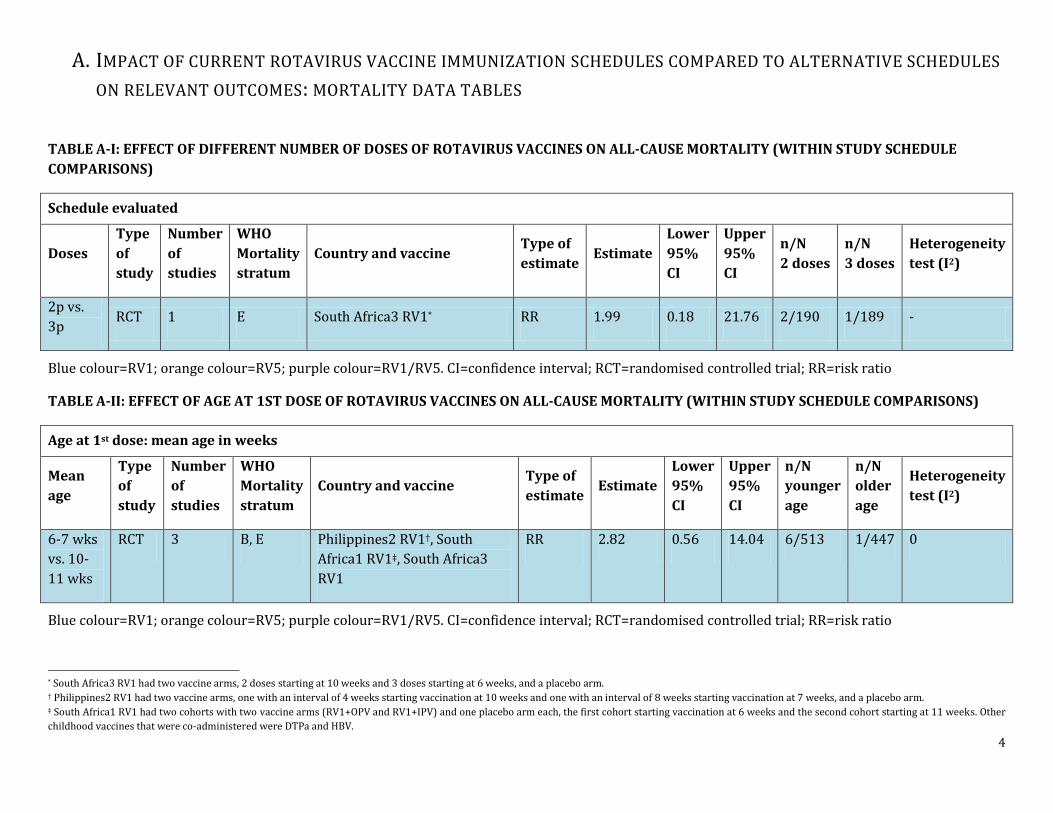
A. IMPACT OF CURRENT ROTAVIRUS VACCINE IMMUNIZATION SCHEDULES COMPARED TO ALTERNATIVE SCHEDULES ON RELEVANT OUTCOMES: MORTALITY DATA TABLES
TABLE A-I: EFFECT OF DIFFERENT NUMBER OF DOSES OF ROTAVIRUS VACCINES ON ALL-CAUSE MORTALITY (WITHIN STUDY SCHEDULE COMPARISONS)
Schedule evaluated
Doses Type of study
Number of studies
WHO Mortality stratum
Country and vaccine Type of estimate
Estimate Lower 95% CI
Upper 95% CI
n/N 2 doses
n/N 3 doses
Heterogeneity test (I2)
2p vs. 3p RCT 1 E South Africa3 RV1* RR 1.99 0.18 21.76 2/190 1/189 -
Blue colour=RV1; orange colour=RV5; purple colour=RV1/RV5. CI=confidence interval; RCT=randomised controlled trial; RR=risk ratio
TABLE A-II: EFFECT OF AGE AT 1ST DOSE OF ROTAVIRUS VACCINES ON ALL-CAUSE MORTALITY (WITHIN STUDY SCHEDULE COMPARISONS)
Age at 1st dose: mean age in weeks
Mean age
Type of study
Number of studies
WHO Mortality stratum
Country and vaccine Type of estimate
Estimate Lower 95% CI
Upper 95% CI
n/N younger age
n/N older age
Heterogeneity test (I2)
6-7 wks vs. 10-11 wks
RCT 3 B, E Philippines2 RV1†, South Africa1 RV1‡, South Africa3 RV1
RR 2.82 0.56 14.04 6/513 1/447 0
Blue colour=RV1; orange colour=RV5; purple colour=RV1/RV5. CI=confidence interval; RCT=randomised controlled trial; RR=risk ratio
* South Africa3 RV1 had two vaccine arms, 2 doses starting at 10 weeks and 3 doses starting at 6 weeks, and a placebo arm. † Philippines2 RV1 had two vaccine arms, one with an interval of 4 weeks starting vaccination at 10 weeks and one with an interval of 8 weeks starting vaccination at 7 weeks, and a placebo arm. ‡ South Africa1 RV1 had two cohorts with two vaccine arms (RV1+OPV and RV1+IPV) and one placebo arm each, the first cohort starting vaccination at 6 weeks and the second cohort starting at 11 weeks. Other childhood vaccines that were co-administered were DTPa and HBV.
5
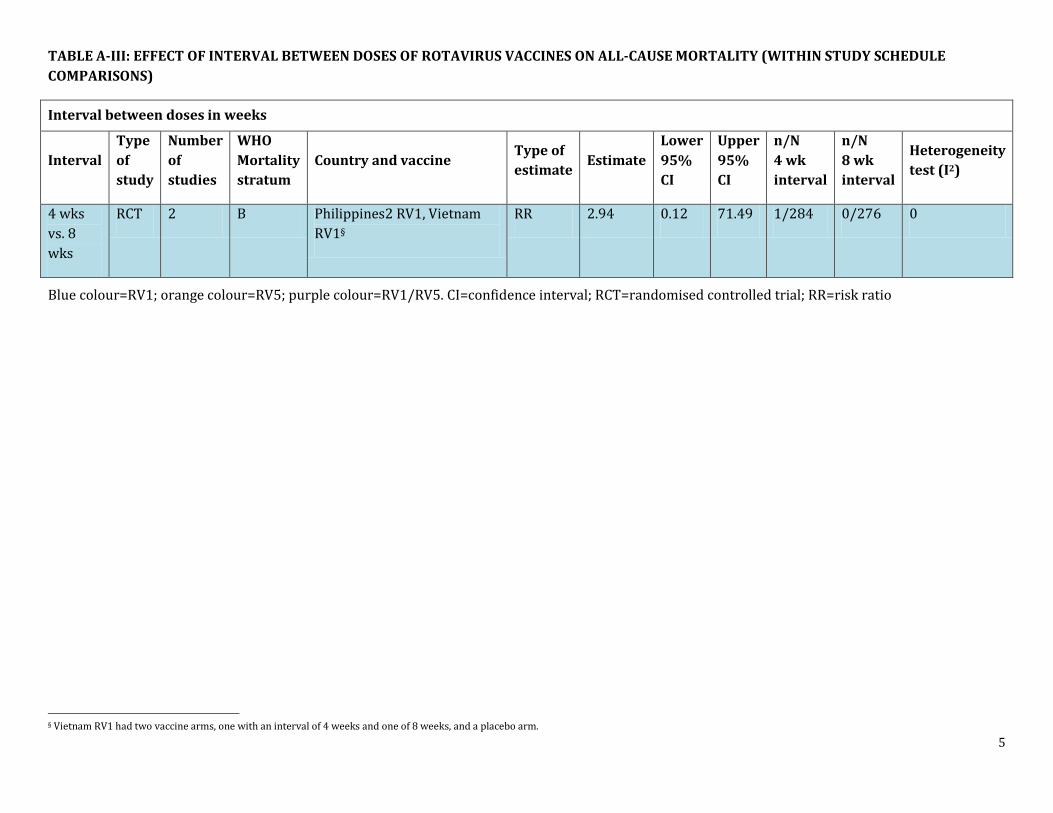
TABLE A-III: EFFECT OF INTERVAL BETWEEN DOSES OF ROTAVIRUS VACCINES ON ALL-CAUSE MORTALITY (WITHIN STUDY SCHEDULE COMPARISONS)
Interval between doses in weeks
Interval Type of study
Number of studies
WHO Mortality stratum
Country and vaccine Type of estimate Estimate
Lower 95% CI
Upper 95% CI
n/N 4 wk interval
n/N 8 wk interval
Heterogeneity test (I2)
4 wks vs. 8 wks
RCT 2 B Philippines2 RV1, Vietnam RV1§
RR 2.94 0.12 71.49 1/284 0/276 0
Blue colour=RV1; orange colour=RV5; purple colour=RV1/RV5. CI=confidence interval; RCT=randomised controlled trial; RR=risk ratio
§ Vietnam RV1 had two vaccine arms, one with an interval of 4 weeks and one of 8 weeks, and a placebo arm.
6
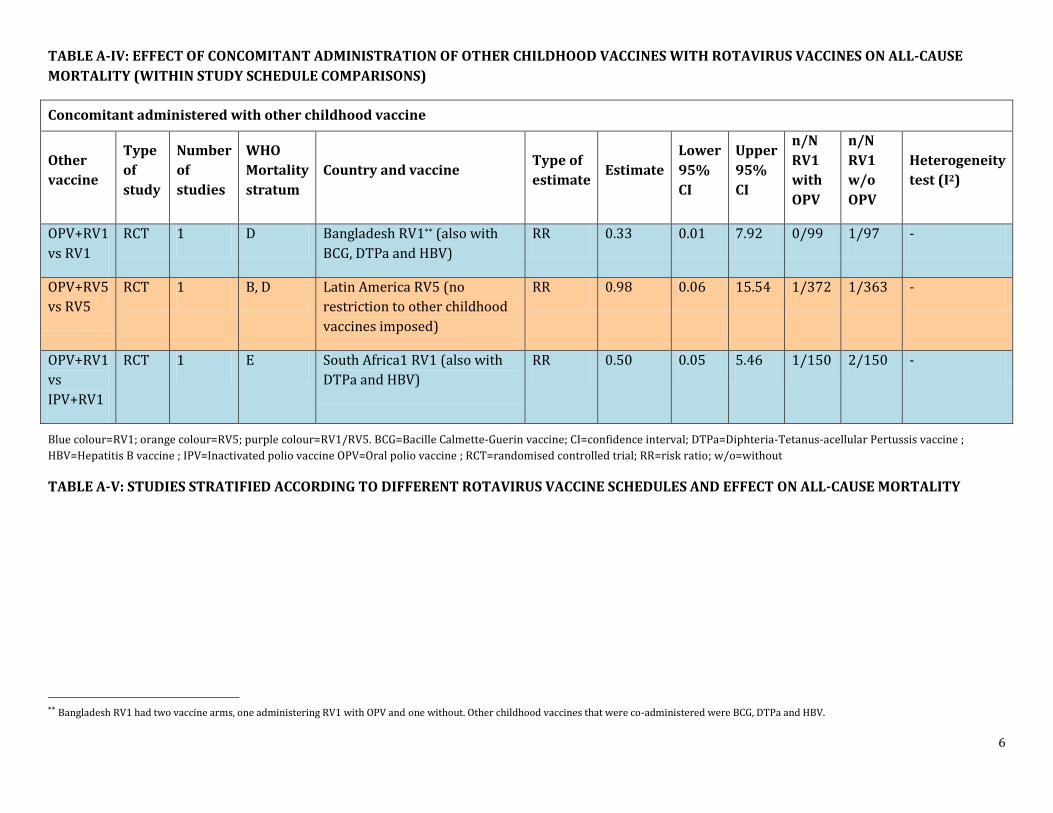
TABLE A-IV: EFFECT OF CONCOMITANT ADMINISTRATION OF OTHER CHILDHOOD VACCINES WITH ROTAVIRUS VACCINES ON ALL-CAUSE MORTALITY (WITHIN STUDY SCHEDULE COMPARISONS)
Concomitant administered with other childhood vaccine
Other vaccine
Type of study
Number of studies
WHO Mortality stratum
Country and vaccine Type of estimate
Estimate Lower 95% CI
Upper 95% CI
n/N RV1 with OPV
n/N RV1 w/o OPV
Heterogeneity test (I2)
OPV+RV1 vs RV1
RCT 1 D Bangladesh RV1** (also with BCG, DTPa and HBV)
RR 0.33 0.01 7.92 0/99 1/97 -
OPV+RV5 vs RV5
RCT 1 B, D Latin America RV5 (no restriction to other childhood vaccines imposed)
RR 0.98 0.06 15.54 1/372 1/363 -
OPV+RV1 vs IPV+RV1
RCT 1 E South Africa1 RV1 (also with DTPa and HBV)
RR 0.50 0.05 5.46 1/150 2/150 -
Blue colour=RV1; orange colour=RV5; purple colour=RV1/RV5. BCG=Bacille Calmette-Guerin vaccine; CI=confidence interval; DTPa=Diphteria-Tetanus-acellular Pertussis vaccine ; HBV=Hepatitis B vaccine ; IPV=Inactivated polio vaccine OPV=Oral polio vaccine ; RCT=randomised controlled trial; RR=risk ratio; w/o=without
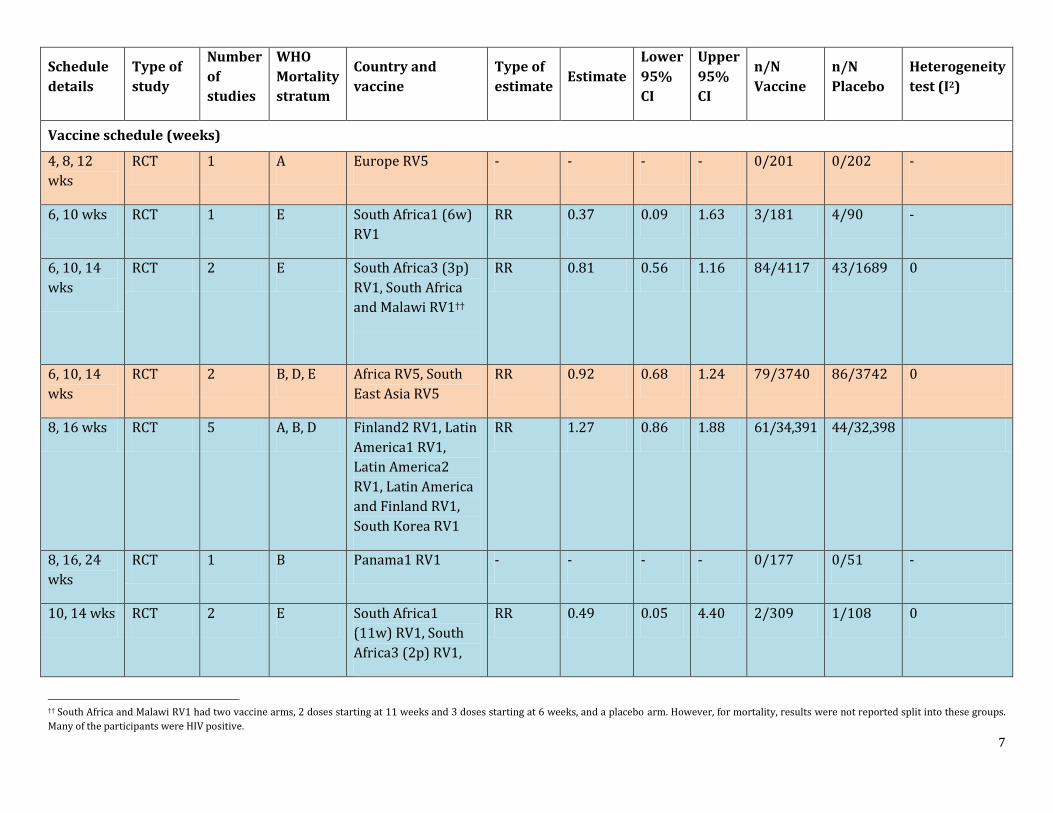
TABLE A-V: STUDIES STRATIFIED ACCORDING TO DIFFERENT ROTAVIRUS VACCINE SCHEDULES AND EFFECT ON ALL-CAUSE MORTALITY
** Bangladesh RV1 had two vaccine arms, one administering RV1 with OPV and one without. Other childhood vaccines that were co-administered were BCG, DTPa and HBV.
7
Schedule details
Type of study
Number of studies
WHO Mortality stratum
Country and vaccine
Type of estimate
Estimate Lower 95% CI
Upper 95% CI
n/N Vaccine
n/N Placebo
Heterogeneity test (I2)
Vaccine schedule (weeks)
4, 8, 12 wks
RCT 1 A Europe RV5 - - - - 0/201 0/202 -
6, 10 wks RCT 1 E South Africa1 (6w) RV1
RR 0.37 0.09 1.63 3/181 4/90 -
6, 10, 14 wks
RCT 2 E South Africa3 (3p) RV1, South Africa and Malawi RV1††
RR 0.81 0.56 1.16 84/4117 43/1689 0
6, 10, 14 wks
RCT 2 B, D, E Africa RV5, South East Asia RV5
RR 0.92 0.68 1.24 79/3740 86/3742 0
8, 16 wks RCT 5 A, B, D Finland2 RV1, Latin America1 RV1, Latin America2 RV1, Latin America and Finland RV1, South Korea RV1
RR 1.27 0.86 1.88 61/34,391 44/32,398
8, 16, 24 wks
RCT 1 B Panama1 RV1 - - - - 0/177 0/51 -
10, 14 wks RCT 2 E South Africa1 (11w) RV1, South Africa3 (2p) RV1,
RR 0.49 0.05 4.40 2/309 1/108 0
†† South Africa and Malawi RV1 had two vaccine arms, 2 doses starting at 11 weeks and 3 doses starting at 6 weeks, and a placebo arm. However, for mortality, results were not reported split into these groups. Many of the participants were HIV positive.
8
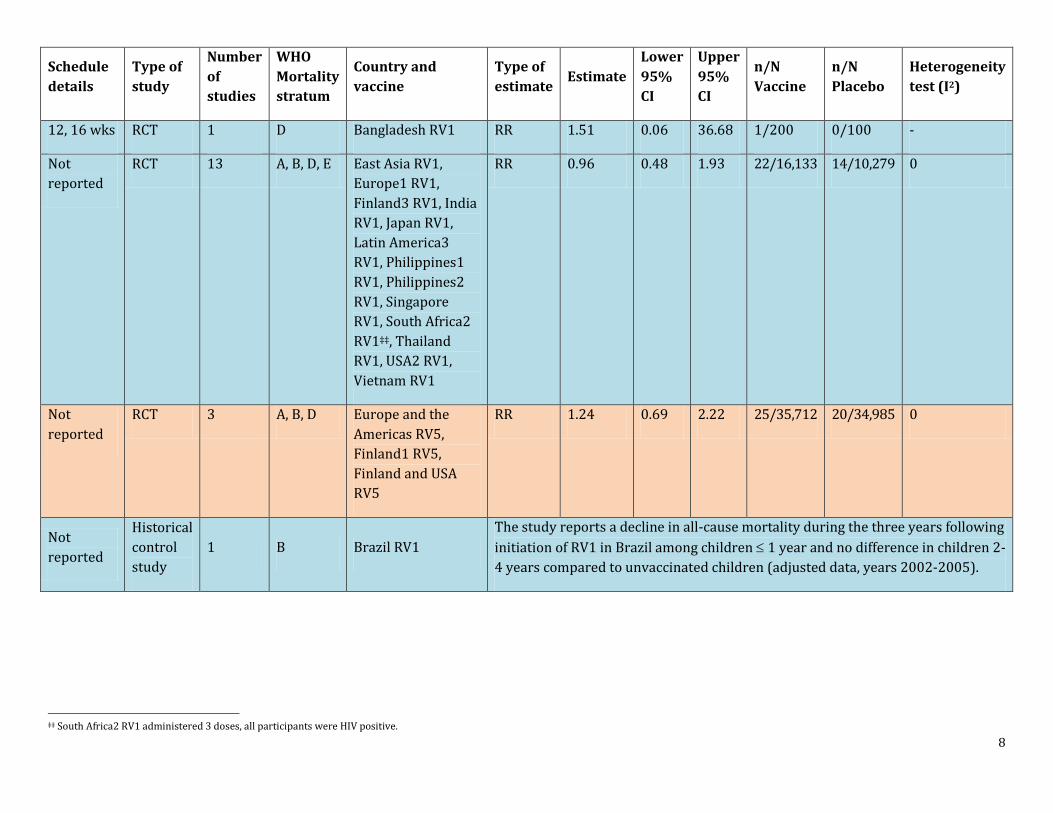
Schedule details
Type of study
Number of studies
WHO Mortality stratum
Country and vaccine
Type of estimate
Estimate Lower 95% CI
Upper 95% CI
n/N Vaccine
n/N Placebo
Heterogeneity test (I2)
12, 16 wks RCT 1 D Bangladesh RV1 RR 1.51 0.06 36.68 1/200 0/100 -
Not reported
RCT 13 A, B, D, E East Asia RV1, Europe1 RV1, Finland3 RV1, India RV1, Japan RV1, Latin America3 RV1, Philippines1 RV1, Philippines2 RV1, Singapore RV1, South Africa2 RV1‡‡, Thailand RV1, USA2 RV1, Vietnam RV1
RR 0.96 0.48 1.93 22/16,133 14/10,279 0
Not reported
RCT 3 A, B, D Europe and the Americas RV5, Finland1 RV5, Finland and USA RV5
RR 1.24 0.69 2.22 25/35,712 20/34,985 0
Not reported
Historical control study
1 B Brazil RV1 The study reports a decline in all-cause mortality during the three years following initiation of RV1 in Brazil among children 1 year and no difference in children 2-4 years compared to unvaccinated children (adjusted data, years 2002-2005).
‡‡ South Africa2 RV1 administered 3 doses, all participants were HIV positive.
9
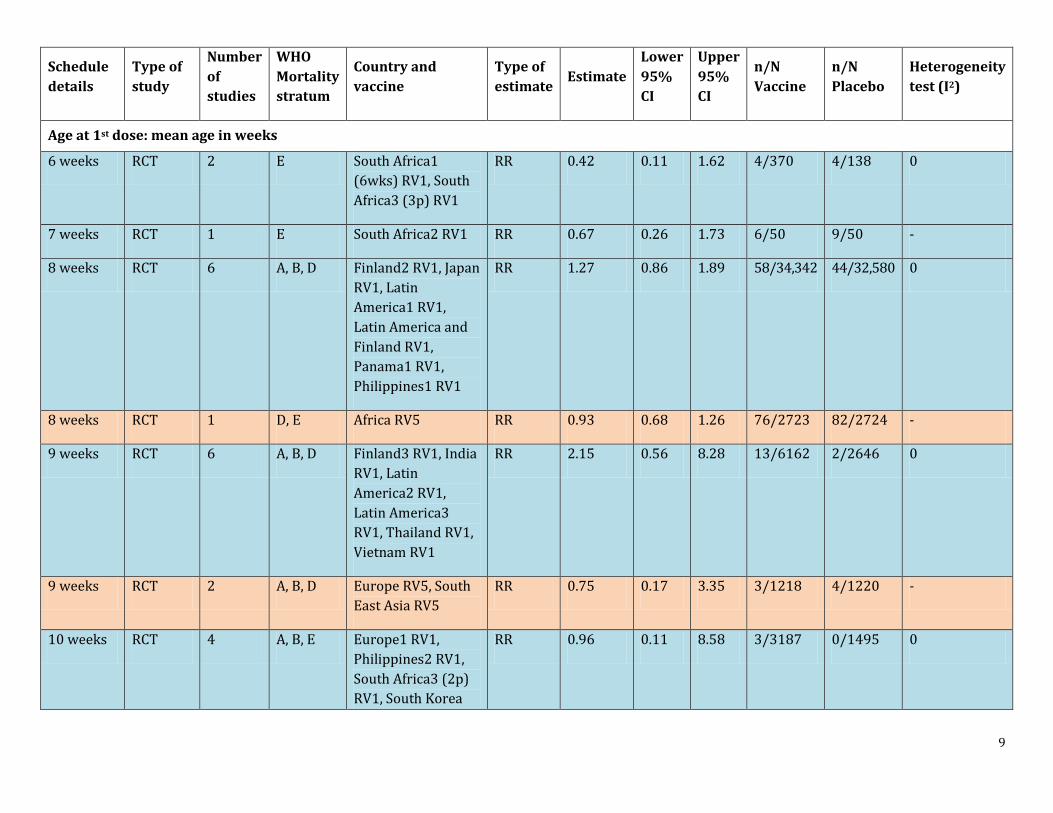
Schedule details
Type of study
Number of studies
WHO Mortality stratum
Country and vaccine
Type of estimate
Estimate Lower 95% CI
Upper 95% CI
n/N Vaccine
n/N Placebo
Heterogeneity test (I2)
Age at 1st dose: mean age in weeks
6 weeks RCT 2 E South Africa1 (6wks) RV1, South Africa3 (3p) RV1
RR 0.42 0.11 1.62 4/370 4/138 0
7 weeks RCT 1 E South Africa2 RV1 RR 0.67 0.26 1.73 6/50 9/50 -
8 weeks RCT 6 A, B, D Finland2 RV1, Japan RV1, Latin America1 RV1, Latin America and Finland RV1, Panama1 RV1, Philippines1 RV1
RR 1.27 0.86 1.89 58/34,342 44/32,580 0
8 weeks RCT 1 D, E Africa RV5 RR 0.93 0.68 1.26 76/2723 82/2724 -
9 weeks RCT 6 A, B, D Finland3 RV1, India RV1, Latin America2 RV1, Latin America3 RV1, Thailand RV1, Vietnam RV1
RR 2.15 0.56 8.28 13/6162 2/2646 0
9 weeks RCT 2 A, B, D Europe RV5, South East Asia RV5
RR 0.75 0.17 3.35 3/1218 4/1220 -
10 weeks RCT 4 A, B, E Europe1 RV1, Philippines2 RV1, South Africa3 (2p) RV1, South Korea
RR 0.96 0.11 8.58 3/3187 0/1495 0
10
Schedule details
Type of study
Number of studies
WHO Mortality stratum
Country and vaccine
Type of estimate
Estimate Lower 95% CI
Upper 95% CI
n/N Vaccine
n/N Placebo
Heterogeneity test (I2)
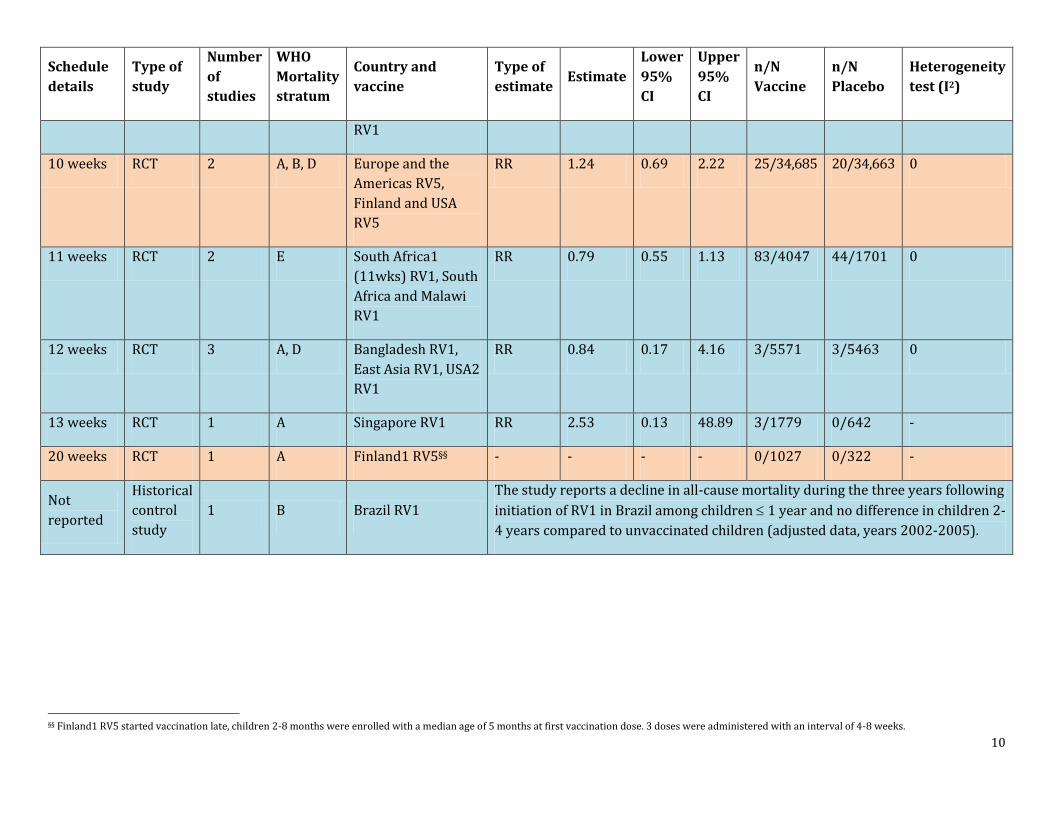
RV1
10 weeks RCT 2 A, B, D Europe and the Americas RV5, Finland and USA RV5
RR 1.24 0.69 2.22 25/34,685 20/34,663 0
11 weeks RCT 2 E South Africa1 (11wks) RV1, South Africa and Malawi RV1
RR 0.79 0.55 1.13 83/4047 44/1701 0
12 weeks RCT 3 A, D Bangladesh RV1, East Asia RV1, USA2 RV1
RR 0.84 0.17 4.16 3/5571 3/5463 0
13 weeks RCT 1 A Singapore RV1 RR 2.53 0.13 48.89 3/1779 0/642 -
20 weeks RCT 1 A Finland1 RV5§§ - - - - 0/1027 0/322 -
Not reported
Historical control study
1 B Brazil RV1 The study reports a decline in all-cause mortality during the three years following initiation of RV1 in Brazil among children 1 year and no difference in children 2-4 years compared to unvaccinated children (adjusted data, years 2002-2005).
§§ Finland1 RV5 started vaccination late, children 2-8 months were enrolled with a median age of 5 months at first vaccination dose. 3 doses were administered with an interval of 4-8 weeks.
11
Schedule details
Type of study
Number of studies
WHO Mortality stratum
Country and vaccine
Type of estimate
Estimate Lower 95% CI
Upper 95% CI
n/N Vaccine
n/N Placebo
Heterogeneity test (I2)
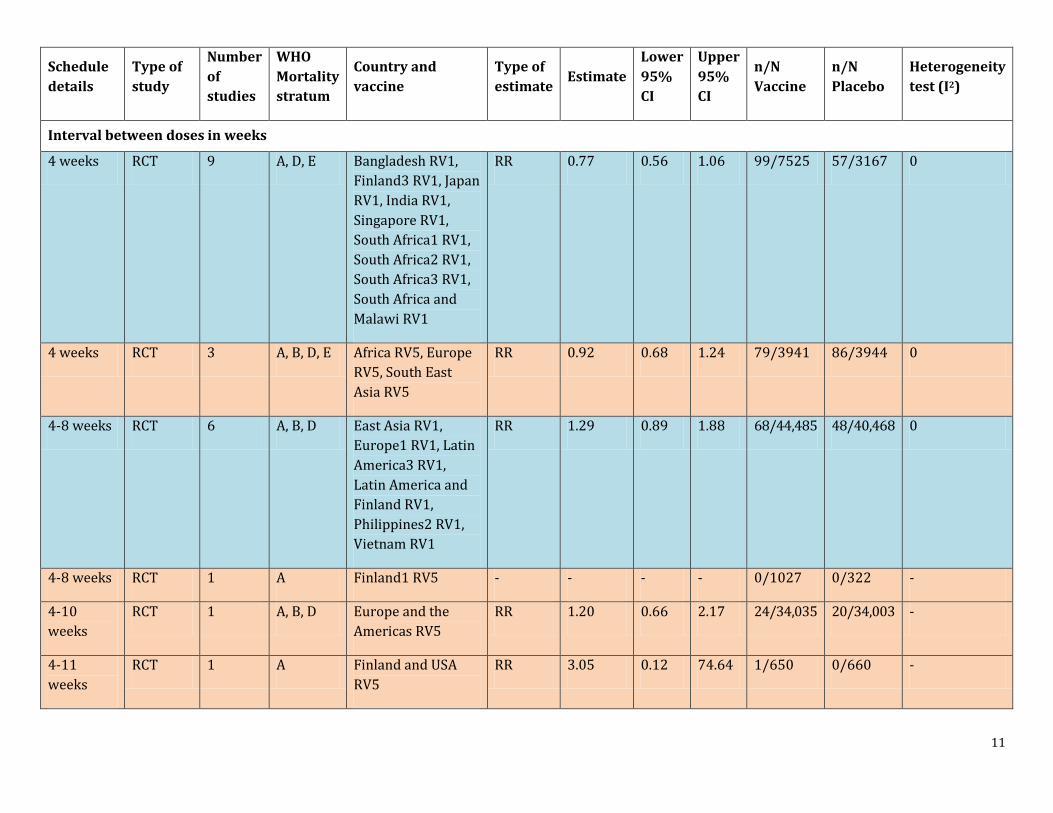
Interval between doses in weeks
4 weeks RCT 9 A, D, E Bangladesh RV1, Finland3 RV1, Japan RV1, India RV1, Singapore RV1, South Africa1 RV1, South Africa2 RV1, South Africa3 RV1, South Africa and Malawi RV1
RR 0.77 0.56 1.06 99/7525 57/3167 0
4 weeks RCT 3 A, B, D, E Africa RV5, Europe RV5, South East Asia RV5
RR 0.92 0.68 1.24 79/3941 86/3944 0
4-8 weeks RCT 6 A, B, D East Asia RV1, Europe1 RV1, Latin America3 RV1, Latin America and Finland RV1, Philippines2 RV1, Vietnam RV1
RR 1.29 0.89 1.88 68/44,485 48/40,468 0
4-8 weeks RCT 1 A Finland1 RV5 - - - - 0/1027 0/322 -
4-10 weeks
RCT 1 A, B, D Europe and the Americas RV5
RR 1.20 0.66 2.17 24/34,035 20/34,003 -
4-11 weeks
RCT 1 A Finland and USA RV5
RR 3.05 0.12 74.64 1/650 0/660 -
12
Schedule details
Type of study
Number of studies
WHO Mortality stratum
Country and vaccine
Type of estimate
Estimate Lower 95% CI
Upper 95% CI
n/N Vaccine
n/N Placebo
Heterogeneity test (I2)
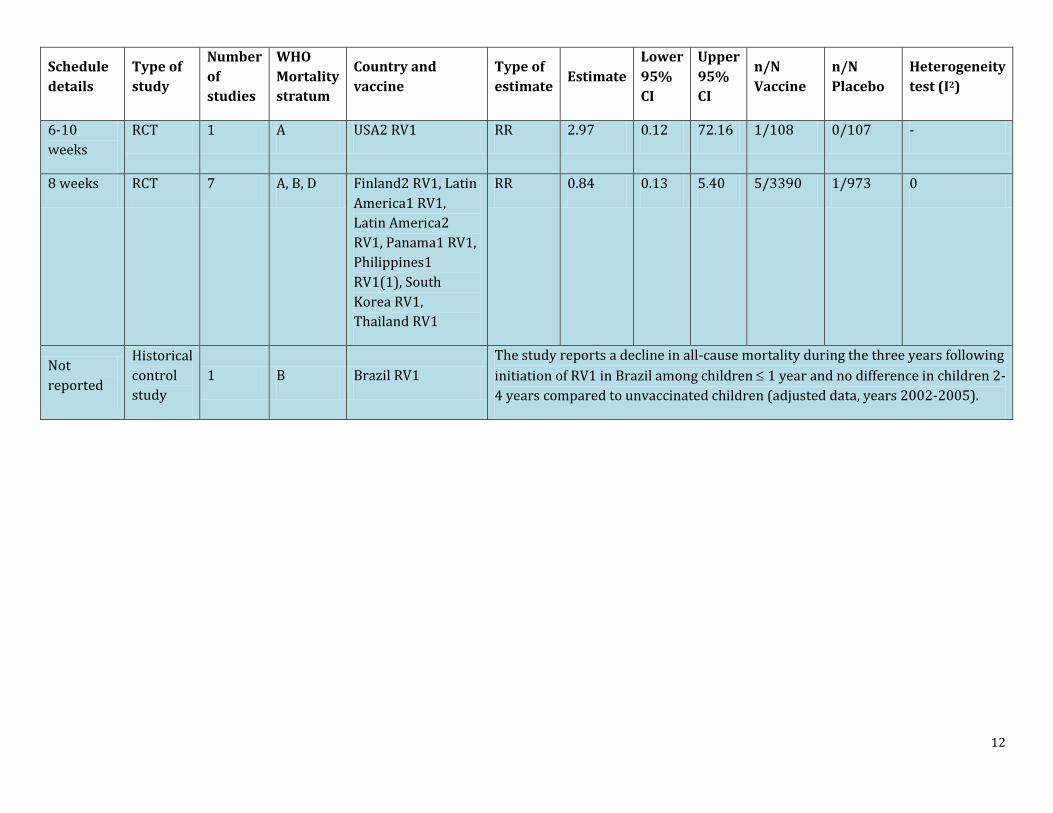
6-10 weeks
RCT 1 A USA2 RV1 RR 2.97 0.12 72.16 1/108 0/107 -
8 weeks RCT 7 A, B, D Finland2 RV1, Latin America1 RV1, Latin America2 RV1, Panama1 RV1, Philippines1 RV1(1), South Korea RV1, Thailand RV1
RR 0.84 0.13 5.40 5/3390 1/973 0
Not reported
Historical control study
1 B Brazil RV1 The study reports a decline in all-cause mortality during the three years following initiation of RV1 in Brazil among children 1 year and no difference in children 2-4 years compared to unvaccinated children (adjusted data, years 2002-2005).
13
Schedule details
Type of study
Number of studies
WHO Mortality stratum
Country and vaccine
Type of estimate
Estimate Lower 95% CI
Upper 95% CI
n/N Vaccine
n/N Placebo
Heterogeneity test (I2)
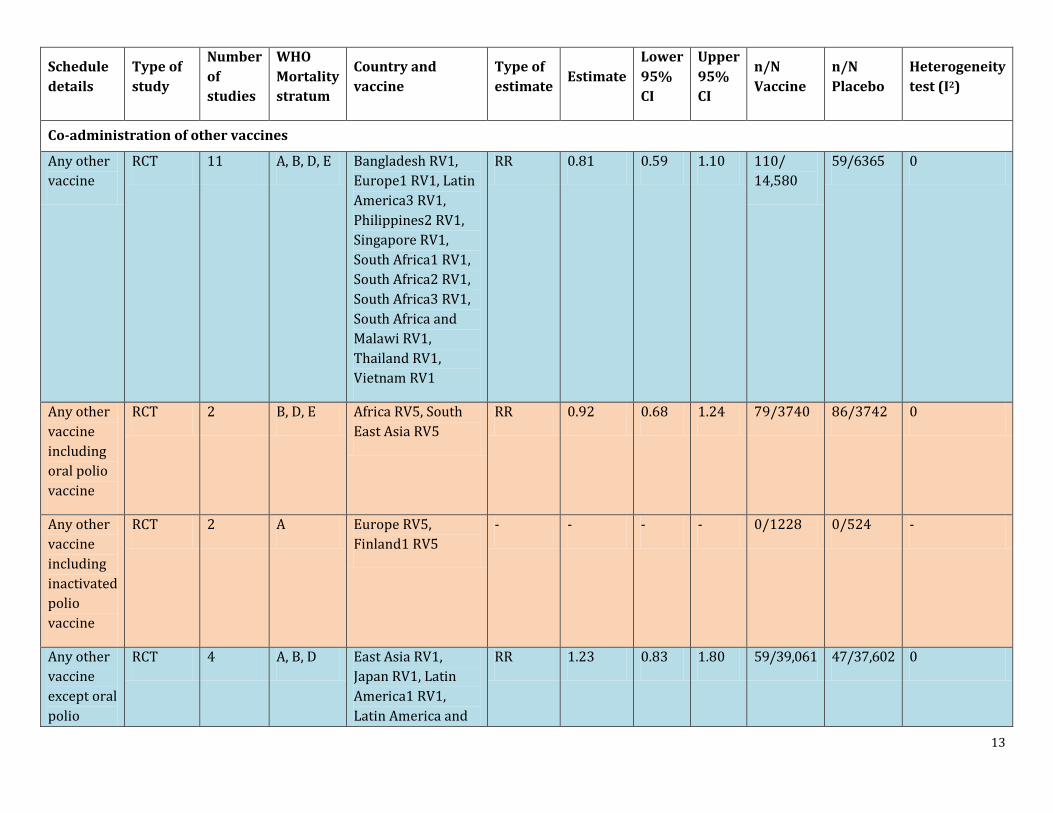
Co-administration of other vaccines
Any other vaccine
RCT 11 A, B, D, E Bangladesh RV1, Europe1 RV1, Latin America3 RV1, Philippines2 RV1, Singapore RV1, South Africa1 RV1, South Africa2 RV1, South Africa3 RV1, South Africa and Malawi RV1, Thailand RV1, Vietnam RV1
RR 0.81 0.59 1.10 110/ 14,580
59/6365 0
Any other vaccine including oral polio vaccine
RCT 2 B, D, E Africa RV5, South East Asia RV5
RR 0.92 0.68 1.24 79/3740 86/3742 0
Any other vaccine including inactivated polio vaccine
RCT 2 A Europe RV5, Finland1 RV5
- - - - 0/1228 0/524 -
Any other vaccine except oral polio
RCT 4 A, B, D East Asia RV1, Japan RV1, Latin America1 RV1, Latin America and
RR 1.23 0.83 1.80 59/39,061 47/37,602 0
14
Schedule details
Type of study
Number of studies
WHO Mortality stratum
Country and vaccine
Type of estimate
Estimate Lower 95% CI
Upper 95% CI
n/N Vaccine
n/N Placebo
Heterogeneity test (I2)
vaccine Finland RV1
Any other vaccine except oral polio vaccine
RCT 2 A, B, D Europe and the Americas RV5, Finland and USA RV5
RR 1.24 0.69 2.22 25/34,685 20/34,663 0
None allowed
RCT 5 A, B, D Finland2 RV1, Finland3 RV1, India RV1, South Korea RV1, USA2 RV1
RR 2.97 0.12 72.16 1/860 0/523 0
Not reported
RCT 3 B, D Latin America2 RV1, Panama1 RV1, Philippines2 RV1
RR 1.20 0.06 23.03 3/1007 0/225 -
Not reported
Historical control study
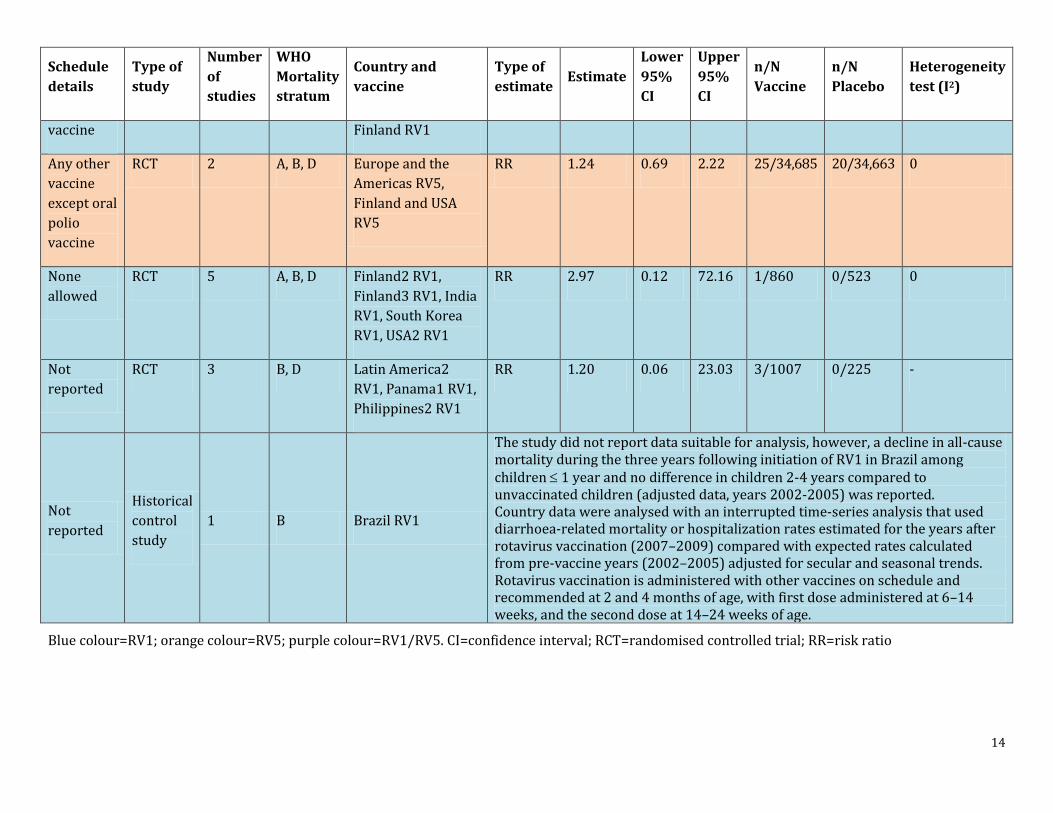
1 B Brazil RV1
The study did not report data suitable for analysis, however, a decline in all-cause mortality during the three years following initiation of RV1 in Brazil among children 1 year and no difference in children 2-4 years compared to unvaccinated children (adjusted data, years 2002-2005) was reported. Country data were analysed with an interrupted time-series analysis that used diarrhoea-related mortality or hospitalization rates estimated for the years after rotavirus vaccination (2007–2009) compared with expected rates calculated from pre-vaccine years (2002–2005) adjusted for secular and seasonal trends. Rotavirus vaccination is administered with other vaccines on schedule and recommended at 2 and 4 months of age, with first dose administered at 6–14 weeks, and the second dose at 14–24 weeks of age.
Blue colour=RV1; orange colour=RV5; purple colour=RV1/RV5. CI=confidence interval; RCT=randomised controlled trial; RR=risk ratio
15
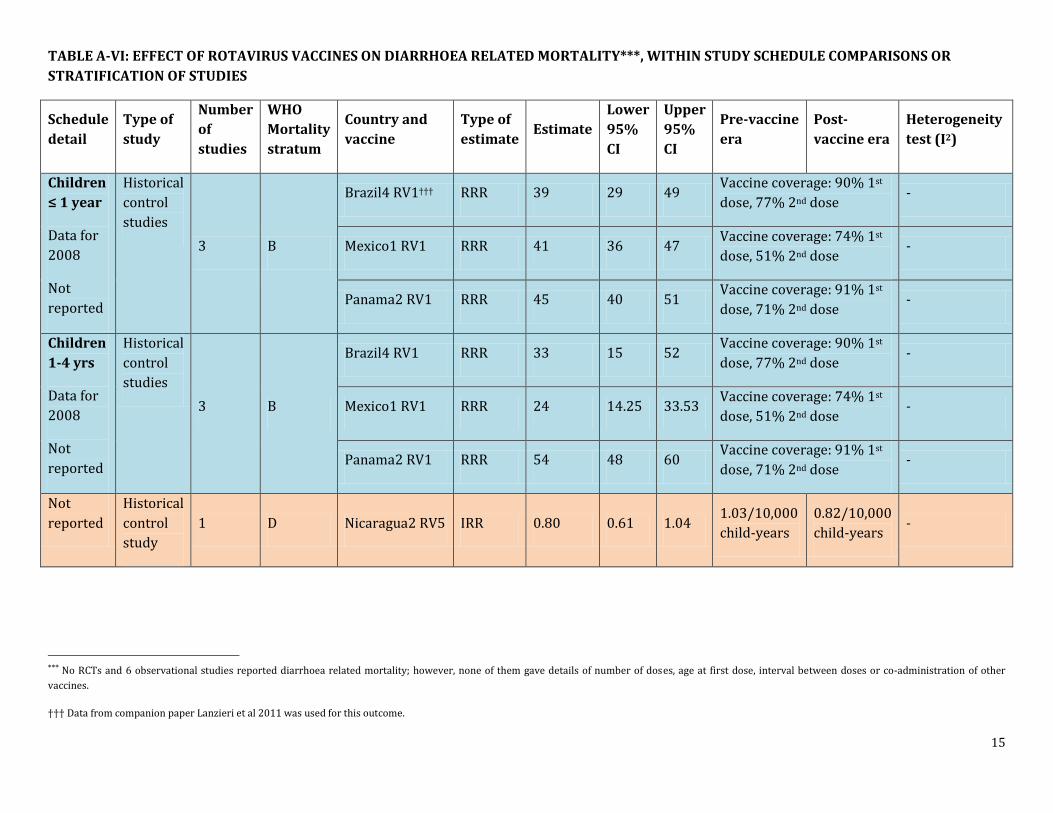
TABLE A-VI: EFFECT OF ROTAVIRUS VACCINES ON DIARRHOEA RELATED MORTALITY***, WITHIN STUDY SCHEDULE COMPARISONS OR STRATIFICATION OF STUDIES
Schedule detail
Type of study
Number of studies
WHO Mortality stratum
Country and vaccine
Type of estimate
Estimate Lower 95% CI
Upper 95% CI
Pre-vaccine era
Post-vaccine era
Heterogeneity test (I2)
Children ≤ 1 year
Data for 2008
Not reported
Historical control studies
3 B
Brazil4 RV1††† RRR 39 29 49 Vaccine coverage: 90% 1st dose, 77% 2nd dose -
Mexico1 RV1 RRR 41 36 47 Vaccine coverage: 74% 1st dose, 51% 2nd dose -
Panama2 RV1 RRR 45 40 51 Vaccine coverage: 91% 1st dose, 71% 2nd dose -
Children 1-4 yrs
Data for 2008
Not reported
Historical control studies
3 B
Brazil4 RV1 RRR 33 15 52 Vaccine coverage: 90% 1st dose, 77% 2nd dose
-
Mexico1 RV1 RRR 24 14.25 33.53 Vaccine coverage: 74% 1st dose, 51% 2nd dose -
Panama2 RV1 RRR 54 48 60 Vaccine coverage: 91% 1st dose, 71% 2nd dose -
Not reported
Historical control study
1 D Nicaragua2 RV5 IRR 0.80 0.61 1.04 1.03/10,000 child-years
0.82/10,000 child-years -
*** No RCTs and 6 observational studies reported diarrhoea related mortality; however, none of them gave details of number of doses, age at first dose, interval between doses or co-administration of other vaccines.
††† Data from companion paper Lanzieri et al 2011 was used for this outcome.
16
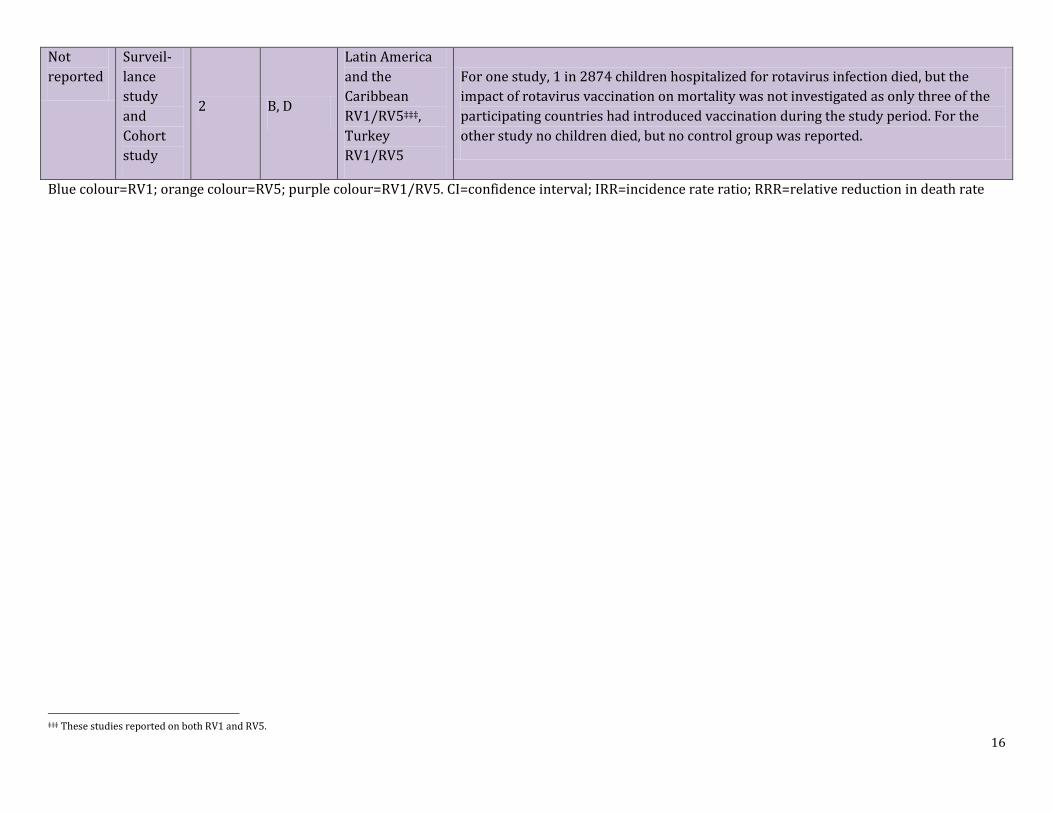
Not reported
Surveil-lance study and Cohort study
2 B, D
Latin America and the Caribbean RV1/RV5‡‡‡, Turkey RV1/RV5
For one study, 1 in 2874 children hospitalized for rotavirus infection died, but the impact of rotavirus vaccination on mortality was not investigated as only three of the participating countries had introduced vaccination during the study period. For the other study no children died, but no control group was reported.
Blue colour=RV1; orange colour=RV5; purple colour=RV1/RV5. CI=confidence interval; IRR=incidence rate ratio; RRR=relative reduction in death rate
‡‡‡ These studies reported on both RV1 and RV5.
17
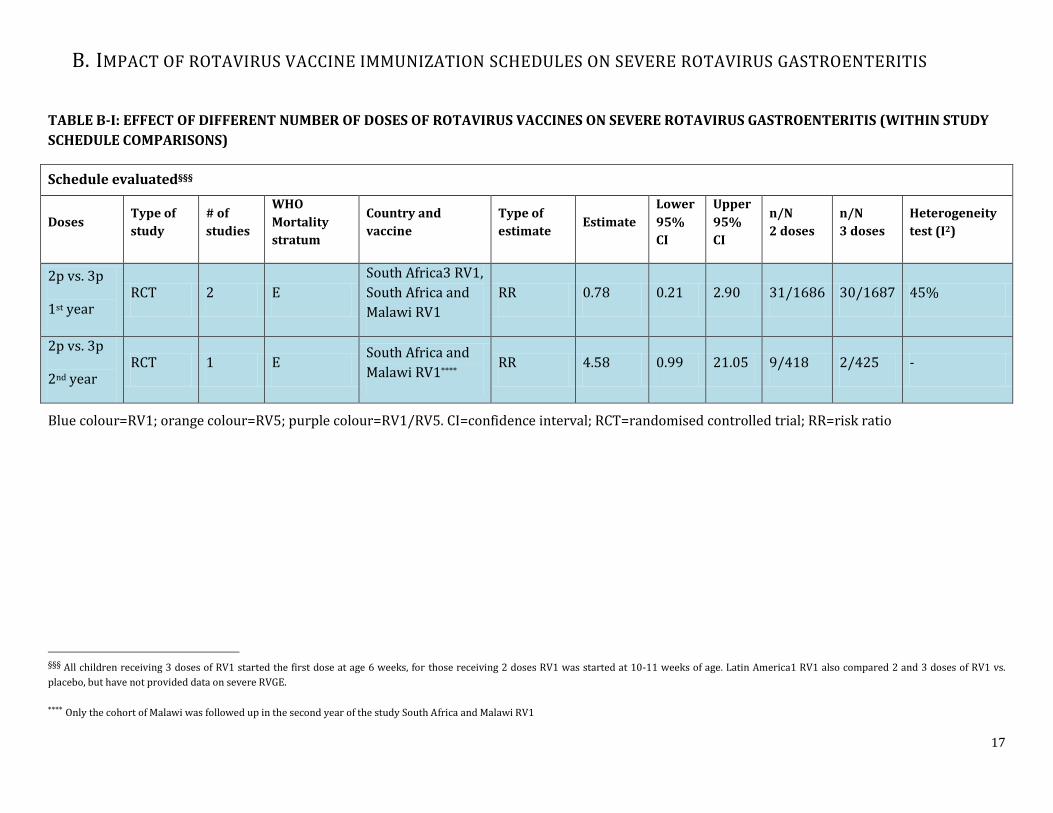
B. IMPACT OF ROTAVIRUS VACCINE IMMUNIZATION SCHEDULES ON SEVERE ROTAVIRUS GASTROENTERITIS
TABLE B-I: EFFECT OF DIFFERENT NUMBER OF DOSES OF ROTAVIRUS VACCINES ON SEVERE ROTAVIRUS GASTROENTERITIS (WITHIN STUDY SCHEDULE COMPARISONS)
Schedule evaluated§§§
Doses Type of study
# of studies
WHO Mortality stratum
Country and vaccine
Type of estimate
Estimate Lower 95% CI
Upper 95% CI
n/N 2 doses
n/N 3 doses
Heterogeneity test (I2)
2p vs. 3p
1st year RCT 2 E
South Africa3 RV1, South Africa and Malawi RV1
RR 0.78 0.21 2.90 31/1686 30/1687 45%
2p vs. 3p
2nd year RCT 1 E
South Africa and Malawi RV1**** RR 4.58 0.99 21.05 9/418 2/425 -
Blue colour=RV1; orange colour=RV5; purple colour=RV1/RV5. CI=confidence interval; RCT=randomised controlled trial; RR=risk ratio
§§§ All children receiving 3 doses of RV1 started the first dose at age 6 weeks, for those receiving 2 doses RV1 was started at 10-11 weeks of age. Latin America1 RV1 also compared 2 and 3 doses of RV1 vs. placebo, but have not provided data on severe RVGE.
**** Only the cohort of Malawi was followed up in the second year of the study South Africa and Malawi RV1

18
TABLE B-II: EFFECT OF DIFFERENT NUMBER OF DOSES OF ROTAVIRUS VACCINES ON ROTAVIRUS DIARRHOEA RELATED HEALTH CARE ENCOUNTERS (PARTIAL VS. FULL SCHEDULE)
Doses Type of study Number of studies
WHO Mortality stratum
Country and vaccine Type of estimate Estimate Lower
95% CI Upper 95% CI n/N Heterogeneity
test (I2)
1p vs. no vaccination
Case-control and Historical-control studies
4 A, B El Salvador RV1, Australia1 RV1, Australia2 RV1, Brazil3 RV1
OR 0.61 0.36 1.06 - 5%
2p vs. no vaccination
Case-control and Historical-control studies
4 A, B El Salvador RV1, Australia1 RV1, Australia2 RV1, Brazil3 RV1
OR 0.40 0.20 0.81 - 78%
1p vs. no vaccination
Case-control and Historical-control studies
7 A, D
Australia2 RV5, Nicaragua1 RV5, USA6 RV5, USA7 RV5, USA9 RV5, USA10 RV5, USA12 RV5
OR 0.34 0.20 0.59 - 69%
2p vs. no vaccination
Case-control and Historical-control studies
7 A, D
Australia2 RV5, Nicaragua1 RV5, USA6 RV5, USA7 RV5, USA9 RV5, USA11 RV5, USA12 RV5
OR 0.24 0.14 0.40 - 36%
3p vs. no vaccination
Case-control and Historical-control studies
8 A, D
Australia2 RV5, Nicaragua1 RV5, USA6 RV5, USA7 RV5, USA9 RV5, USA10 RV5, USA11 RV5, USA12 RV5
OR 0.18 0.11 0.29 - 63%
Blue colour=RV1; orange colour=RV5; purple colour=RV1/RV5. CI=confidence interval; OR=odds ratio

19
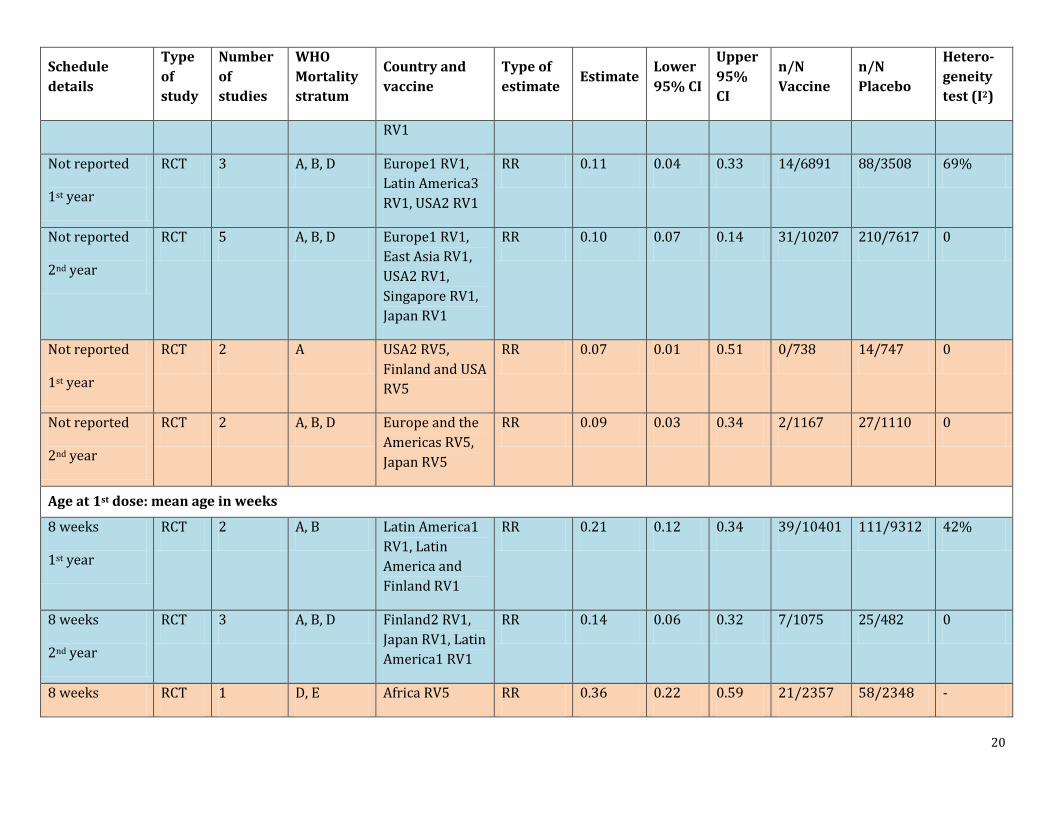
TABLE B-III: STUDIES STRATIFIED ACCORDING TO DIFFERENT SCHEDULES AND EFFECT ON SEVERE ROTAVIRUS GASTROENTERITIS
Schedule details
Type of study
Number of studies
WHO Mortality stratum
Country and vaccine
Type of estimate Estimate
Lower 95% CI
Upper 95% CI
n/N Vaccine
n/N Placebo
Hetero-geneity test (I2)
Vaccine schedule (weeks)
(6), 10, 14 wks
1st year
RCT 2 E South Africa1 RV1, South Africa and Malawi RV1††††
RR 0.39 0.28 0.55 61/3353 73/1539 0
(6), 10, 14 wks
2nd year
RCT 1 E South Africa and Malawi RV1
RR 0.41 0.19 0.91 11/843 13/408 -
6, 10, 14 wk
1st year
RCT 2 B, D, E Africa RV5, South East Asia RV5
RR 0.42 0.29 0.60 40/3348 96/3326 0
6, 10, 14 wk
2nd year
RCT 2 B, D, E Africa RV5, South East Asia RV5
RR 0.58 0.46 0.73 117/3348 200/3326 0
8, 16 wks
1st year
RCT 2 A, B, D Latin America1 RV1, Latin America and Finland RV1
RR 0.21 0.12 0.34 39/10401 111/9312 42%
8, 16 wks
2nd year
RCT 2 A, B, D Latin America1 RV1, Finland2
RR 0.17 0.06 0.48 5/577 13/232 0
†††† South Africa and Malawi RV1 had two vaccine arms, 2 doses starting at 11 weeks and 3 doses starting at 6 weeks, and a placebo arm. However, for mortality, results were not reported split into these groups. Many of the participants were HIV positive.
20
Schedule details
Type of study
Number of studies
WHO Mortality stratum
Country and vaccine
Type of estimate
Estimate Lower 95% CI
Upper 95% CI
n/N Vaccine
n/N Placebo
Hetero-geneity test (I2)
RV1
Not reported
1st year
RCT 3 A, B, D Europe1 RV1, Latin America3 RV1, USA2 RV1
RR 0.11 0.04 0.33 14/6891 88/3508 69%
Not reported
2nd year
RCT 5 A, B, D Europe1 RV1, East Asia RV1, USA2 RV1, Singapore RV1, Japan RV1
RR 0.10 0.07 0.14 31/10207 210/7617 0
Not reported
1st year
RCT 2 A USA2 RV5, Finland and USA RV5
RR 0.07 0.01 0.51 0/738 14/747 0
Not reported
2nd year
RCT 2 A, B, D Europe and the Americas RV5, Japan RV5
RR 0.09 0.03 0.34 2/1167 27/1110 0
Age at 1st dose: mean age in weeks
8 weeks
1st year
RCT 2 A, B Latin America1 RV1, Latin America and Finland RV1
RR 0.21 0.12 0.34 39/10401 111/9312 42%
8 weeks
2nd year
RCT 3 A, B, D Finland2 RV1, Japan RV1, Latin America1 RV1
RR 0.14 0.06 0.32 7/1075 25/482 0
8 weeks RCT 1 D, E Africa RV5 RR 0.36 0.22 0.59 21/2357 58/2348 -
21
Schedule details
Type of study
Number of studies
WHO Mortality stratum
Country and vaccine
Type of estimate
Estimate Lower 95% CI
Upper 95% CI
n/N Vaccine
n/N Placebo
Hetero-geneity test (I2)
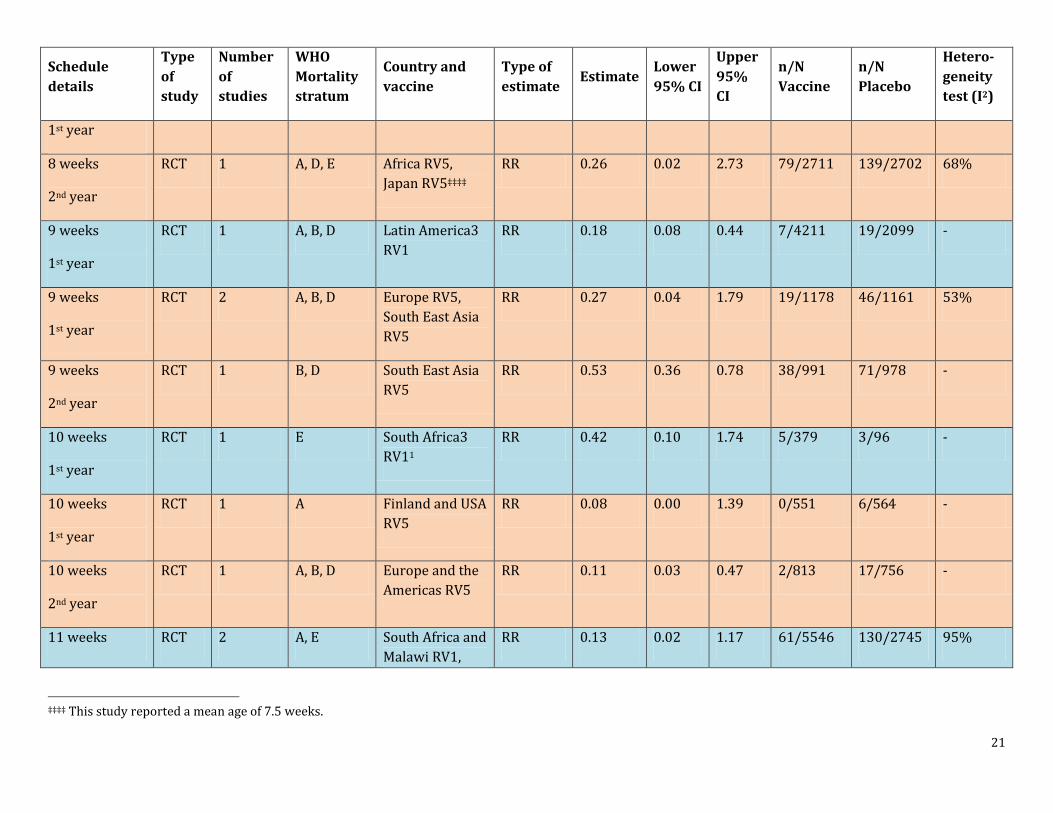
1st year
8 weeks
2nd year
RCT 1 A, D, E Africa RV5, Japan RV5‡‡‡‡
RR 0.26 0.02 2.73 79/2711 139/2702 68%
9 weeks
1st year
RCT 1 A, B, D Latin America3 RV1
RR 0.18 0.08 0.44 7/4211 19/2099 -
9 weeks
1st year
RCT 2 A, B, D Europe RV5, South East Asia RV5
RR 0.27 0.04 1.79 19/1178 46/1161 53%
9 weeks
2nd year
RCT 1 B, D South East Asia RV5
RR 0.53 0.36 0.78 38/991 71/978 -
10 weeks
1st year
RCT 1 E South Africa3 RV11
RR 0.42 0.10 1.74 5/379 3/96 -
10 weeks
1st year
RCT 1 A Finland and USA RV5
RR 0.08 0.00 1.39 0/551 6/564 -
10 weeks
2nd year
RCT 1 A, B, D Europe and the Americas RV5
RR 0.11 0.03 0.47 2/813 17/756 -
11 weeks RCT 2 A, E South Africa and Malawi RV1,
RR 0.13 0.02 1.17 61/5546 130/2745 95%
‡‡‡‡ This study reported a mean age of 7.5 weeks.

22
Schedule details
Type of study
Number of studies
WHO Mortality stratum
Country and vaccine
Type of estimate
Estimate Lower 95% CI
Upper 95% CI
n/N Vaccine
n/N Placebo
Hetero-geneity test (I2)
1st year Europe1 RV1
11 weeks
2nd year
RCT 2 A, E South Africa and Malawi RV1, Europe1 RV1
RR 0.19 0.05 0.77 35/3402 140/1770 89%
12 weeks
1st year
RCT 1 A USA2 RV1 RR 0.22 0.05 1.00 2/108 9/107 -
12 weeks
2nd year
RCT 2 A USA2 RV1, East Asia RV1
RR 0.08 0.02 0.32 5/5371 70/5363 54%
13 weeks
2nd year
RCT 1 A Singapore RV1 RR 0.12 0.00 2.95 0/1779 1/642 -
Interval between doses in weeks
4 weeks
1st year
RCT 2 E South Africa3 RV1, South Africa and Malawi RV1
RR 0.39 0.28 0.55 61/3353 73/1539 0
4 weeks
2nd year
RCT 3 A, E Singapore RV1, Japan RV1, South Africa and Malawi RV1
RR 0.21 0.06 0.68 13/3120 26/1300 46%
4 weeks
1st year
RCT 2 B, D, E Africa RV5, South East Asia RV5
RR 0.42 0.29 0.60 40/3348 96/3326 0
23
Schedule details
Type of study
Number of studies
WHO Mortality stratum
Country and vaccine
Type of estimate
Estimate Lower 95% CI
Upper 95% CI
n/N Vaccine
n/N Placebo
Hetero-geneity test (I2)
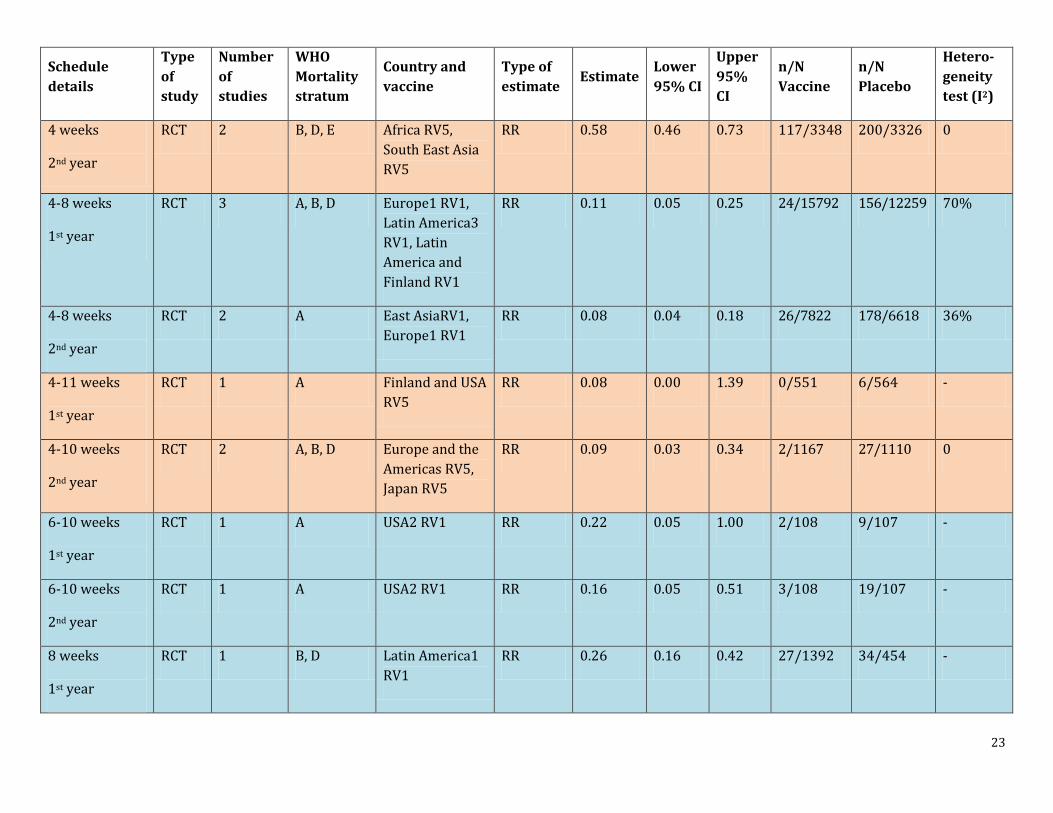
4 weeks
2nd year
RCT 2 B, D, E Africa RV5, South East Asia RV5
RR 0.58 0.46 0.73 117/3348 200/3326 0
4-8 weeks
1st year
RCT 3 A, B, D Europe1 RV1, Latin America3 RV1, Latin America and Finland RV1
RR 0.11 0.05 0.25 24/15792 156/12259 70%
4-8 weeks
2nd year
RCT 2 A East AsiaRV1, Europe1 RV1
RR 0.08 0.04 0.18 26/7822 178/6618 36%
4-11 weeks
1st year
RCT 1 A Finland and USA RV5
RR 0.08 0.00 1.39 0/551 6/564 -
4-10 weeks
2nd year
RCT 2 A, B, D Europe and the Americas RV5, Japan RV5
RR 0.09 0.03 0.34 2/1167 27/1110 0
6-10 weeks
1st year
RCT 1 A USA2 RV1 RR 0.22 0.05 1.00 2/108 9/107 -
6-10 weeks
2nd year
RCT 1 A USA2 RV1 RR 0.16 0.05 0.51 3/108 19/107 -
8 weeks
1st year
RCT 1 B, D Latin America1 RV1
RR 0.26 0.16 0.42 27/1392 34/454 -
24
Schedule details
Type of study
Number of studies
WHO Mortality stratum
Country and vaccine
Type of estimate
Estimate Lower 95% CI
Upper 95% CI
n/N Vaccine
n/N Placebo
Hetero-geneity test (I2)
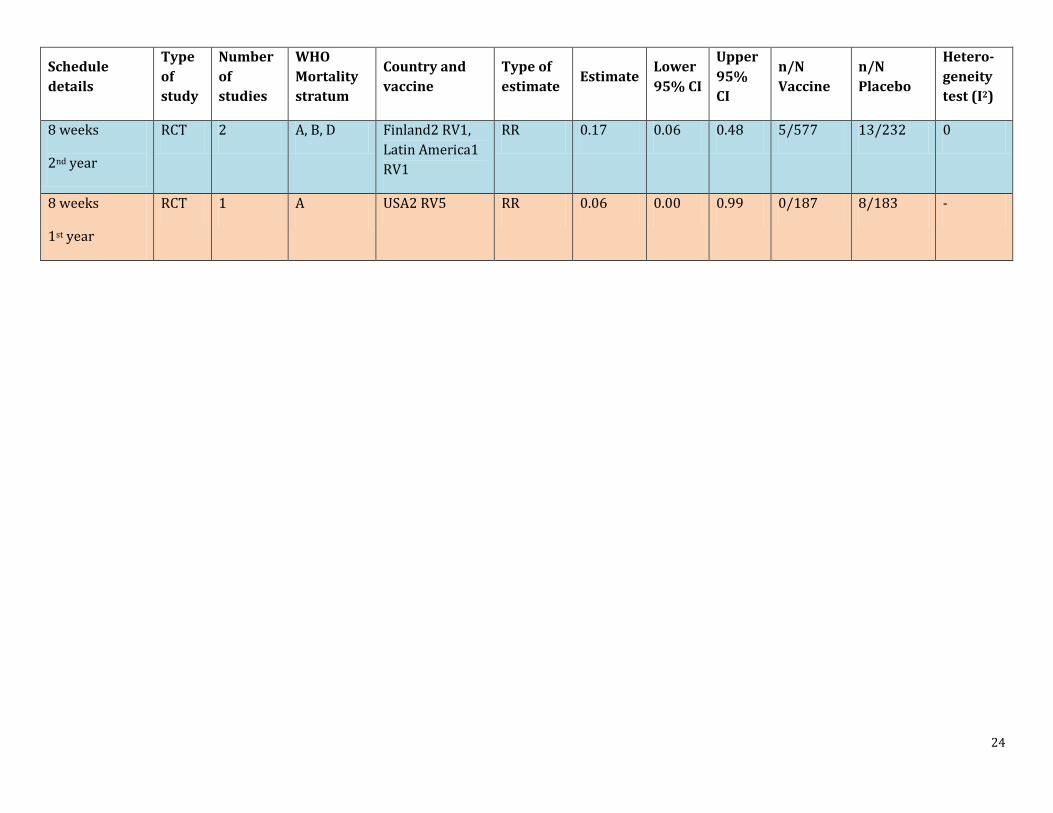
8 weeks
2nd year
RCT 2 A, B, D Finland2 RV1, Latin America1 RV1
RR 0.17 0.06 0.48 5/577 13/232 0
8 weeks
1st year
RCT 1 A USA2 RV5 RR 0.06 0.00 0.99 0/187 8/183 -
25
Schedule details
Type of study
Number of studies
WHO Mortality stratum
Country and vaccine
Type of estimate
Estimate Lower 95% CI
Upper 95% CI
n/N Vaccine
n/N Placebo
Hetero-geneity test (I2)
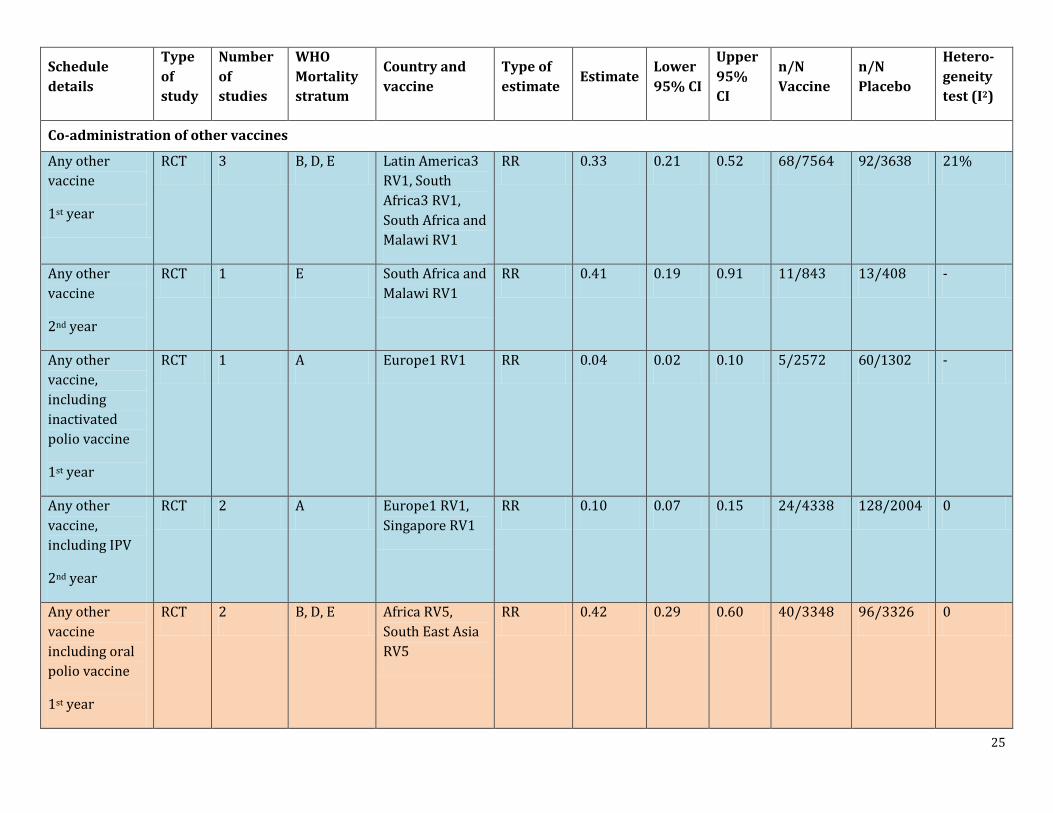
Co-administration of other vaccines
Any other vaccine
1st year
RCT 3 B, D, E Latin America3 RV1, South Africa3 RV1, South Africa and Malawi RV1
RR 0.33 0.21 0.52 68/7564 92/3638 21%
Any other vaccine
2nd year
RCT 1 E South Africa and Malawi RV1
RR 0.41 0.19 0.91 11/843 13/408 -
Any other vaccine, including inactivated polio vaccine
1st year
RCT 1 A Europe1 RV1 RR 0.04 0.02 0.10 5/2572 60/1302 -
Any other vaccine, including IPV
2nd year
RCT 2 A Europe1 RV1, Singapore RV1
RR 0.10 0.07 0.15 24/4338 128/2004 0
Any other vaccine including oral polio vaccine
1st year
RCT 2 B, D, E Africa RV5, South East Asia RV5
RR 0.42 0.29 0.60 40/3348 96/3326 0
26
Schedule details
Type of study
Number of studies
WHO Mortality stratum
Country and vaccine
Type of estimate
Estimate Lower 95% CI
Upper 95% CI
n/N Vaccine
n/N Placebo
Hetero-geneity test (I2)
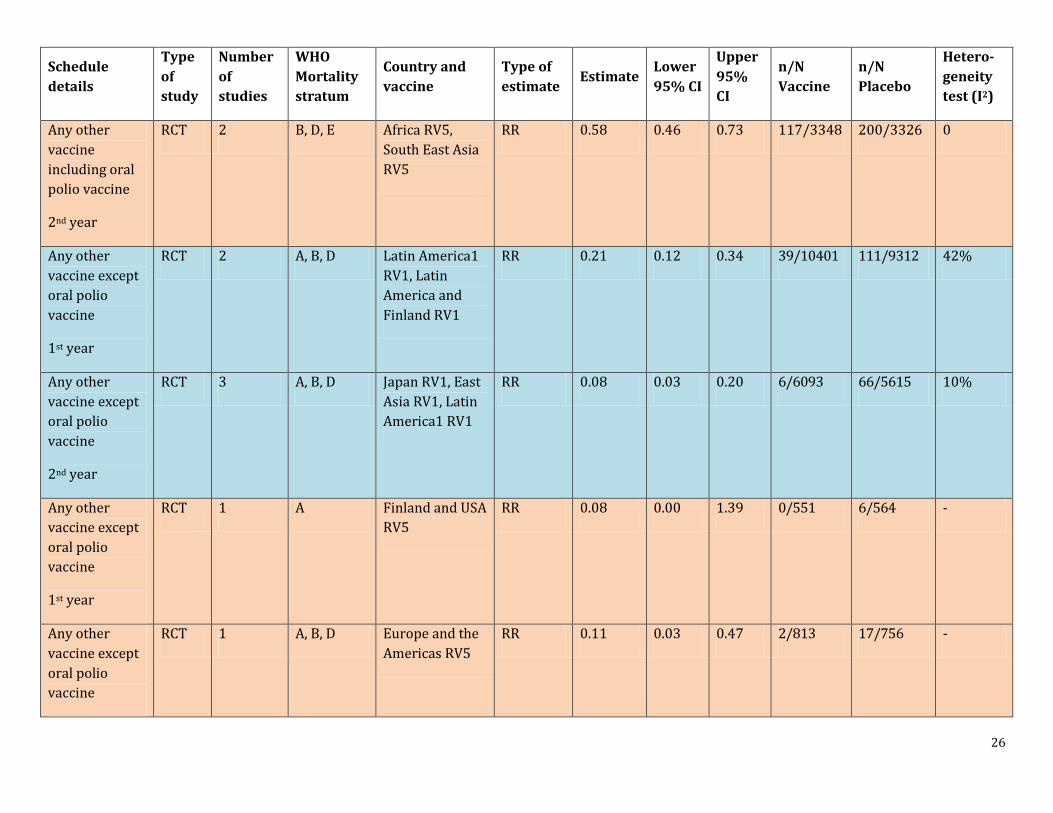
Any other vaccine including oral polio vaccine
2nd year
RCT 2 B, D, E Africa RV5, South East Asia RV5
RR 0.58 0.46 0.73 117/3348 200/3326 0
Any other vaccine except oral polio vaccine
1st year
RCT 2 A, B, D Latin America1 RV1, Latin America and Finland RV1
RR 0.21 0.12 0.34 39/10401 111/9312 42%
Any other vaccine except oral polio vaccine
2nd year
RCT 3 A, B, D Japan RV1, East Asia RV1, Latin America1 RV1
RR 0.08 0.03 0.20 6/6093 66/5615 10%
Any other vaccine except oral polio vaccine
1st year
RCT 1 A Finland and USA RV5
RR 0.08 0.00 1.39 0/551 6/564 -
Any other vaccine except oral polio vaccine
RCT 1 A, B, D Europe and the Americas RV5
RR 0.11 0.03 0.47 2/813 17/756 -
27
Schedule details
Type of study
Number of studies
WHO Mortality stratum
Country and vaccine
Type of estimate
Estimate Lower 95% CI
Upper 95% CI
n/N Vaccine
n/N Placebo
Hetero-geneity test (I2)
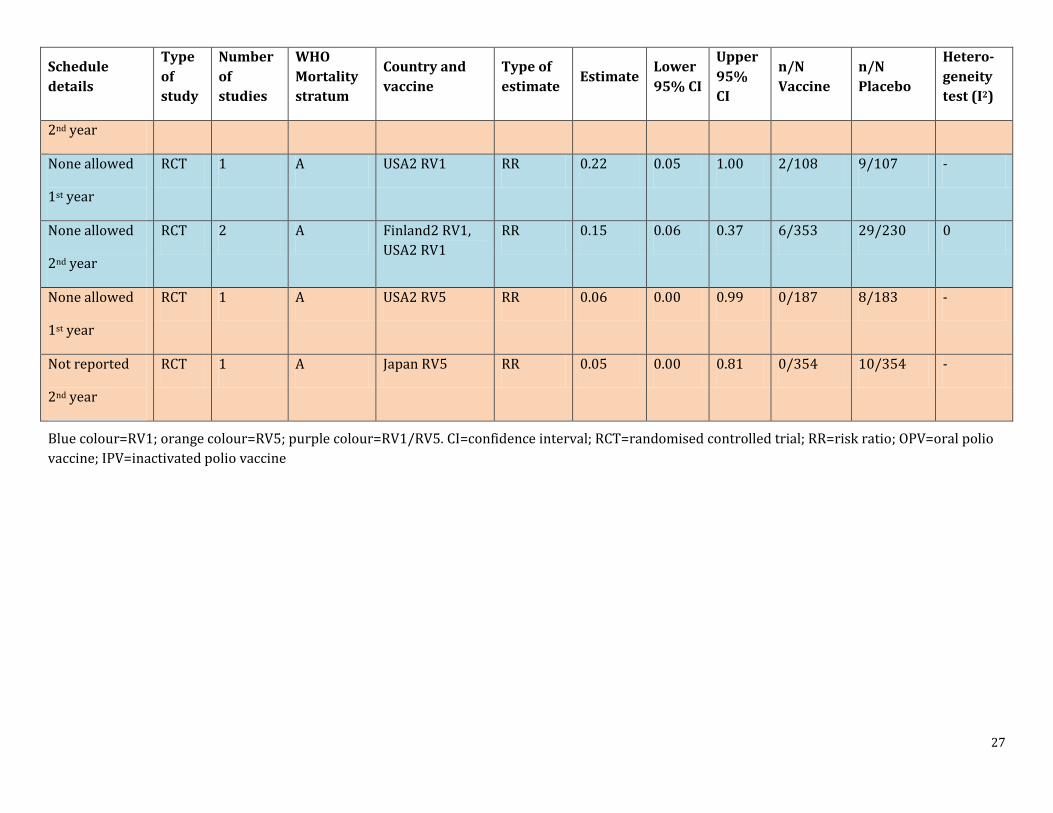
2nd year
None allowed
1st year
RCT 1 A USA2 RV1 RR 0.22 0.05 1.00 2/108 9/107 -
None allowed
2nd year
RCT 2 A Finland2 RV1, USA2 RV1
RR 0.15 0.06 0.37 6/353 29/230 0
None allowed
1st year
RCT 1 A USA2 RV5 RR 0.06 0.00 0.99 0/187 8/183 -
Not reported
2nd year
RCT 1 A Japan RV5 RR 0.05 0.00 0.81 0/354 10/354 -
Blue colour=RV1; orange colour=RV5; purple colour=RV1/RV5. CI=confidence interval; RCT=randomised controlled trial; RR=risk ratio; OPV=oral polio vaccine; IPV=inactivated polio vaccine
28
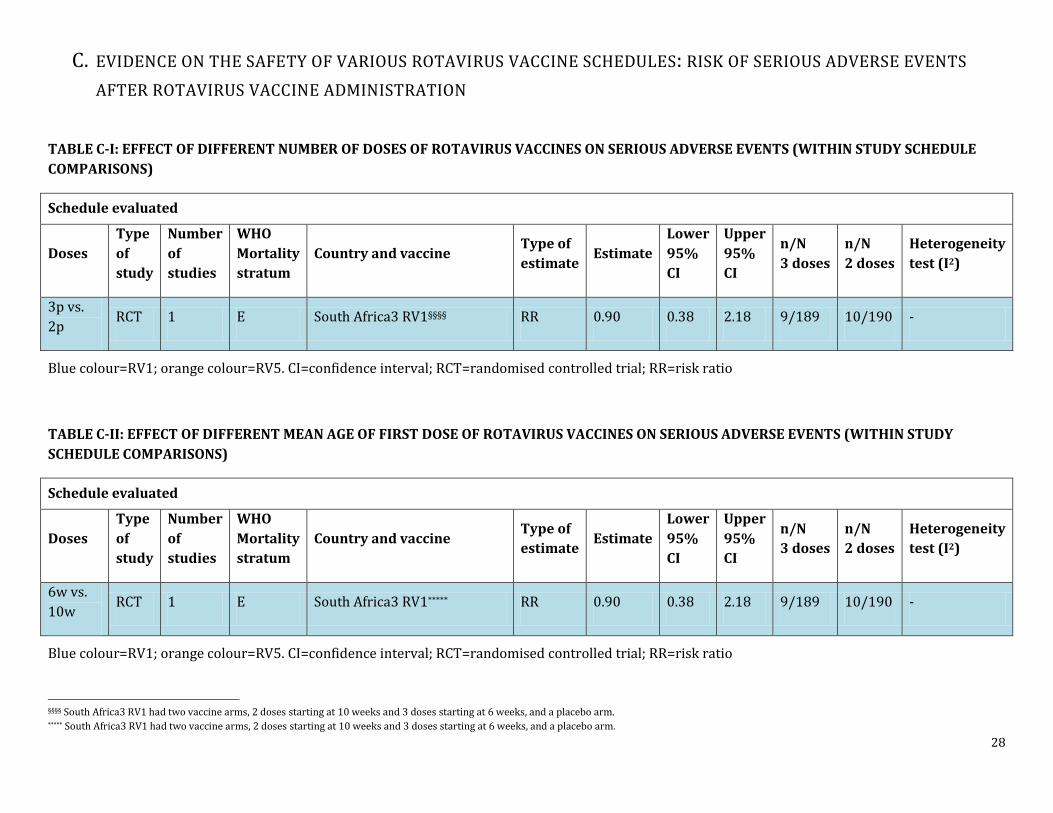
C. EVIDENCE ON THE SAFETY OF VARIOUS ROTAVIRUS VACCINE SCHEDULES: RISK OF SERIOUS ADVERSE EVENTS AFTER ROTAVIRUS VACCINE ADMINISTRATION
TABLE C-I: EFFECT OF DIFFERENT NUMBER OF DOSES OF ROTAVIRUS VACCINES ON SERIOUS ADVERSE EVENTS (WITHIN STUDY SCHEDULE COMPARISONS)
Schedule evaluated
Doses Type of study
Number of studies
WHO Mortality stratum
Country and vaccine Type of estimate
Estimate Lower 95% CI
Upper 95% CI
n/N 3 doses
n/N 2 doses
Heterogeneity test (I2)
3p vs. 2p RCT 1 E South Africa3 RV1§§§§ RR 0.90 0.38 2.18 9/189 10/190 -
Blue colour=RV1; orange colour=RV5. CI=confidence interval; RCT=randomised controlled trial; RR=risk ratio
TABLE C-II: EFFECT OF DIFFERENT MEAN AGE OF FIRST DOSE OF ROTAVIRUS VACCINES ON SERIOUS ADVERSE EVENTS (WITHIN STUDY SCHEDULE COMPARISONS)
Schedule evaluated
Doses Type of study
Number of studies
WHO Mortality stratum
Country and vaccine Type of estimate Estimate
Lower 95% CI
Upper 95% CI
n/N 3 doses
n/N 2 doses
Heterogeneity test (I2)
6w vs. 10w RCT 1 E South Africa3 RV1***** RR 0.90 0.38 2.18 9/189 10/190 -
Blue colour=RV1; orange colour=RV5. CI=confidence interval; RCT=randomised controlled trial; RR=risk ratio
§§§§ South Africa3 RV1 had two vaccine arms, 2 doses starting at 10 weeks and 3 doses starting at 6 weeks, and a placebo arm. ***** South Africa3 RV1 had two vaccine arms, 2 doses starting at 10 weeks and 3 doses starting at 6 weeks, and a placebo arm.
29
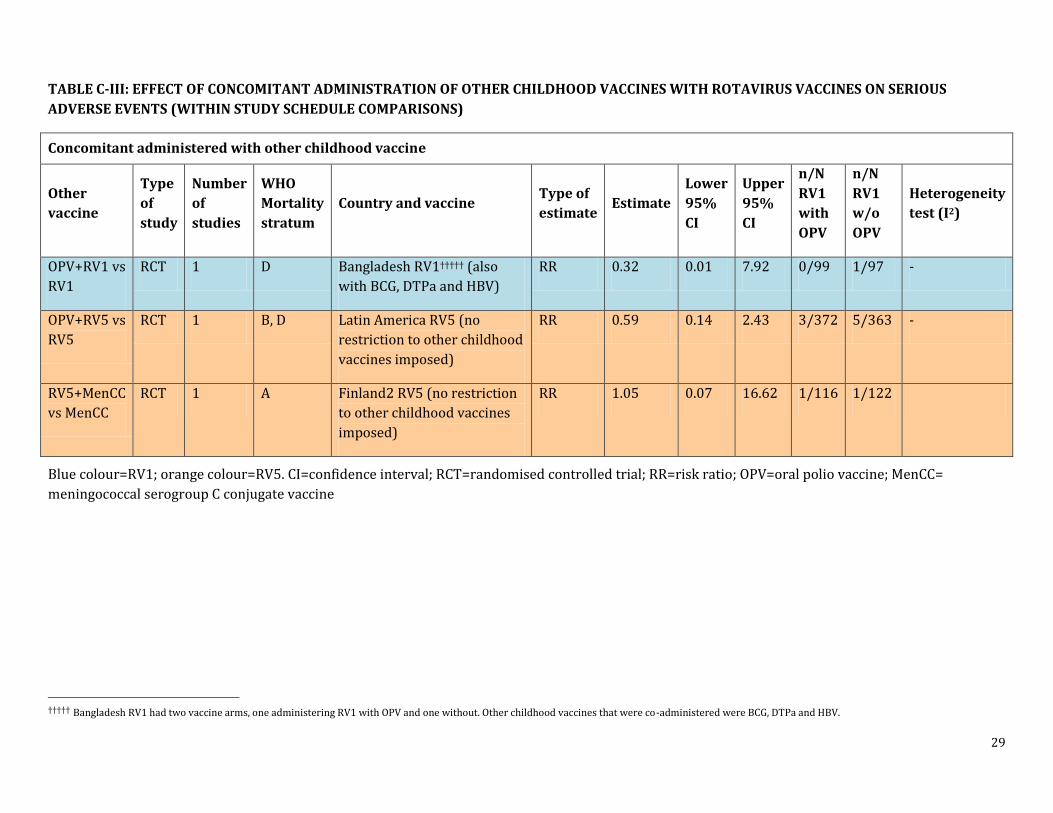
TABLE C-III: EFFECT OF CONCOMITANT ADMINISTRATION OF OTHER CHILDHOOD VACCINES WITH ROTAVIRUS VACCINES ON SERIOUS ADVERSE EVENTS (WITHIN STUDY SCHEDULE COMPARISONS)
Concomitant administered with other childhood vaccine
Other vaccine
Type of study
Number of studies
WHO Mortality stratum
Country and vaccine Type of estimate
Estimate Lower 95% CI
Upper 95% CI
n/N RV1 with OPV
n/N RV1 w/o OPV
Heterogeneity test (I2)
OPV+RV1 vs RV1
RCT 1 D Bangladesh RV1††††† (also with BCG, DTPa and HBV)
RR 0.32 0.01 7.92 0/99 1/97 -
OPV+RV5 vs RV5
RCT 1 B, D Latin America RV5 (no restriction to other childhood vaccines imposed)
RR 0.59 0.14 2.43 3/372 5/363 -
RV5+MenCC vs MenCC
RCT 1 A Finland2 RV5 (no restriction to other childhood vaccines imposed)
RR 1.05 0.07 16.62 1/116 1/122
Blue colour=RV1; orange colour=RV5. CI=confidence interval; RCT=randomised controlled trial; RR=risk ratio; OPV=oral polio vaccine; MenCC=
meningococcal serogroup C conjugate vaccine
††††† Bangladesh RV1 had two vaccine arms, one administering RV1 with OPV and one without. Other childhood vaccines that were co-administered were BCG, DTPa and HBV.
30
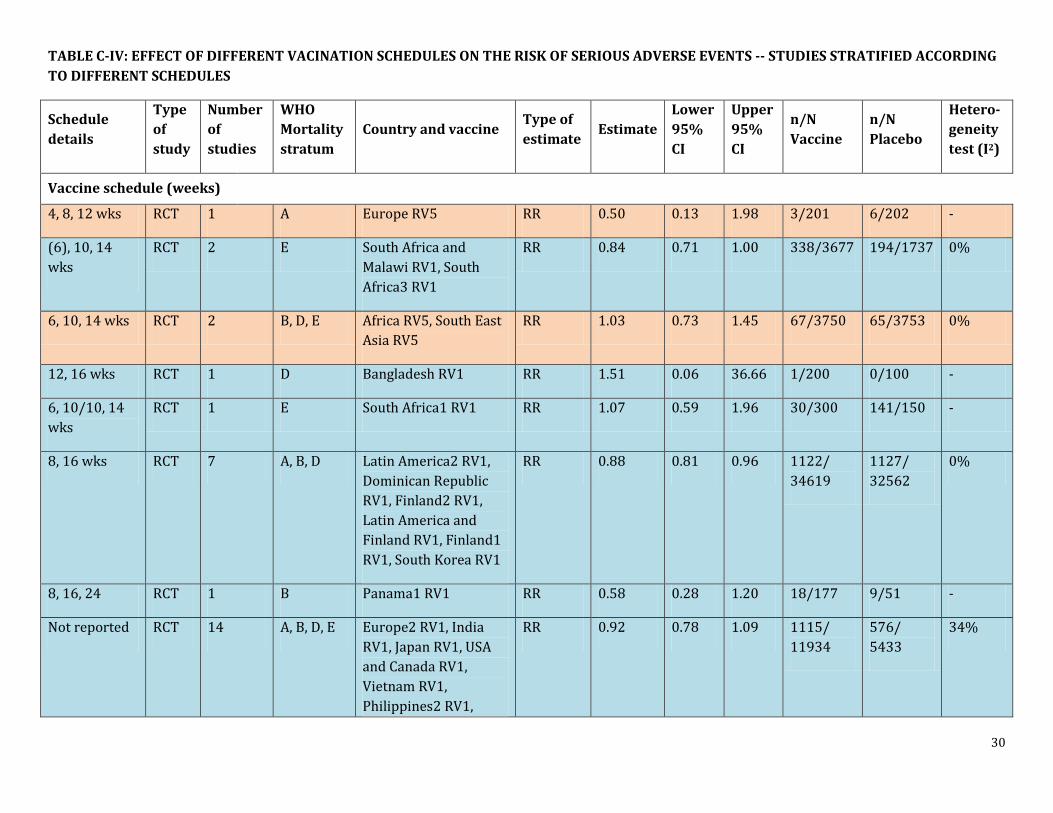
TABLE C-IV: EFFECT OF DIFFERENT VACINATION SCHEDULES ON THE RISK OF SERIOUS ADVERSE EVENTS -- STUDIES STRATIFIED ACCORDING TO DIFFERENT SCHEDULES
Schedule details
Type of study
Number of studies
WHO Mortality stratum
Country and vaccine Type of estimate
Estimate Lower 95% CI
Upper 95% CI
n/N Vaccine
n/N Placebo
Hetero-geneity test (I2)
Vaccine schedule (weeks)
4, 8, 12 wks RCT 1 A Europe RV5 RR 0.50 0.13 1.98 3/201 6/202 -
(6), 10, 14 wks
RCT 2 E South Africa and Malawi RV1, South Africa3 RV1
RR 0.84 0.71 1.00 338/3677 194/1737 0%
6, 10, 14 wks RCT 2 B, D, E Africa RV5, South East Asia RV5
RR 1.03 0.73 1.45 67/3750 65/3753 0%
12, 16 wks RCT 1 D Bangladesh RV1 RR 1.51 0.06 36.66 1/200 0/100 -
6, 10/10, 14 wks
RCT 1 E South Africa1 RV1 RR 1.07 0.59 1.96 30/300 141/150 -
8, 16 wks RCT 7 A, B, D Latin America2 RV1, Dominican Republic RV1, Finland2 RV1, Latin America and Finland RV1, Finland1 RV1, South Korea RV1
RR 0.88 0.81 0.96 1122/ 34619
1127/ 32562
0%
8, 16, 24 RCT 1 B Panama1 RV1 RR 0.58 0.28 1.20 18/177 9/51 -
Not reported RCT 14 A, B, D, E Europe2 RV1, India RV1, Japan RV1, USA and Canada RV1, Vietnam RV1, Philippines2 RV1,
RR 0.92 0.78 1.09 1115/ 11934
576/ 5433
34%
31
Schedule details
Type of study
Number of studies
WHO Mortality stratum
Country and vaccine Type of estimate
Estimate Lower 95% CI
Upper 95% CI
n/N Vaccine
n/N Placebo
Hetero-geneity test (I2)
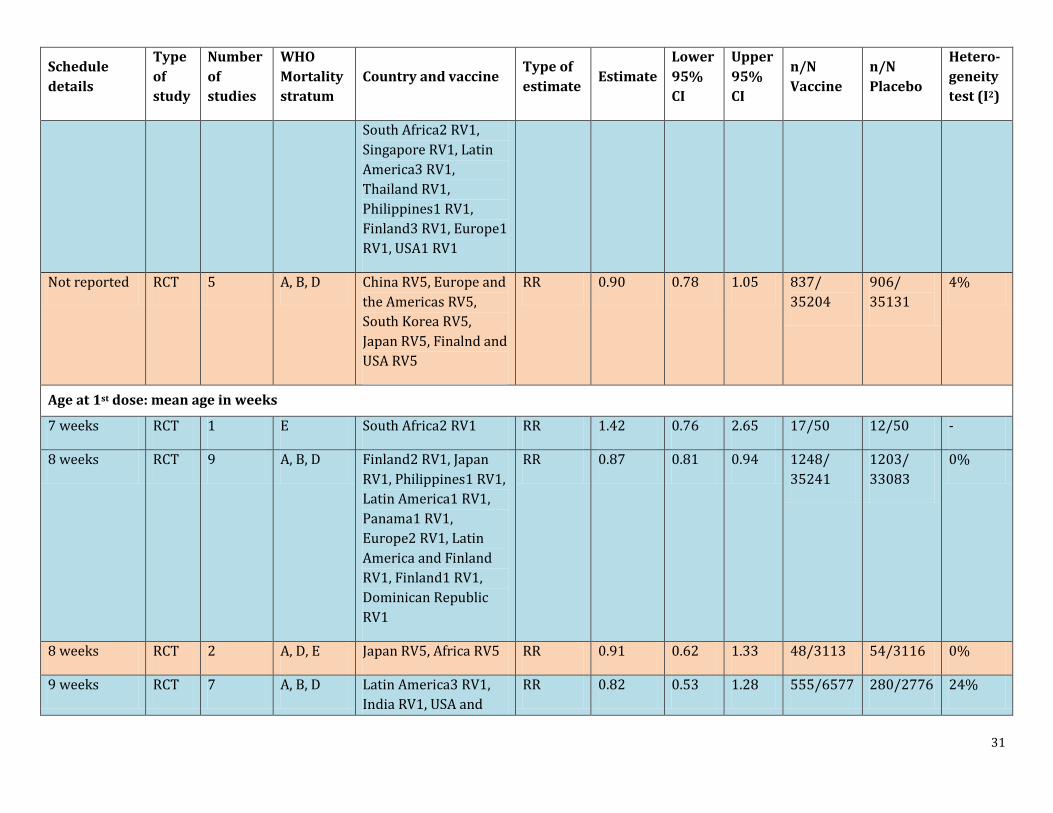
South Africa2 RV1, Singapore RV1, Latin America3 RV1, Thailand RV1, Philippines1 RV1, Finland3 RV1, Europe1 RV1, USA1 RV1
Not reported RCT 5 A, B, D China RV5, Europe and the Americas RV5, South Korea RV5, Japan RV5, Finalnd and USA RV5
RR 0.90 0.78 1.05 837/ 35204
906/ 35131
4%
Age at 1st dose: mean age in weeks
7 weeks RCT 1 E South Africa2 RV1 RR 1.42 0.76 2.65 17/50 12/50 -
8 weeks RCT 9 A, B, D Finland2 RV1, Japan RV1, Philippines1 RV1, Latin America1 RV1, Panama1 RV1, Europe2 RV1, Latin America and Finland RV1, Finland1 RV1, Dominican Republic RV1
RR 0.87 0.81 0.94 1248/ 35241
1203/ 33083
0%
8 weeks RCT 2 A, D, E Japan RV5, Africa RV5 RR 0.91 0.62 1.33 48/3113 54/3116 0%
9 weeks RCT 7 A, B, D Latin America3 RV1, India RV1, USA and
RR 0.82 0.53 1.28 555/6577 280/2776 24%
32
Schedule details
Type of study
Number of studies
WHO Mortality stratum
Country and vaccine Type of estimate
Estimate Lower 95% CI
Upper 95% CI
n/N Vaccine
n/N Placebo
Hetero-geneity test (I2)
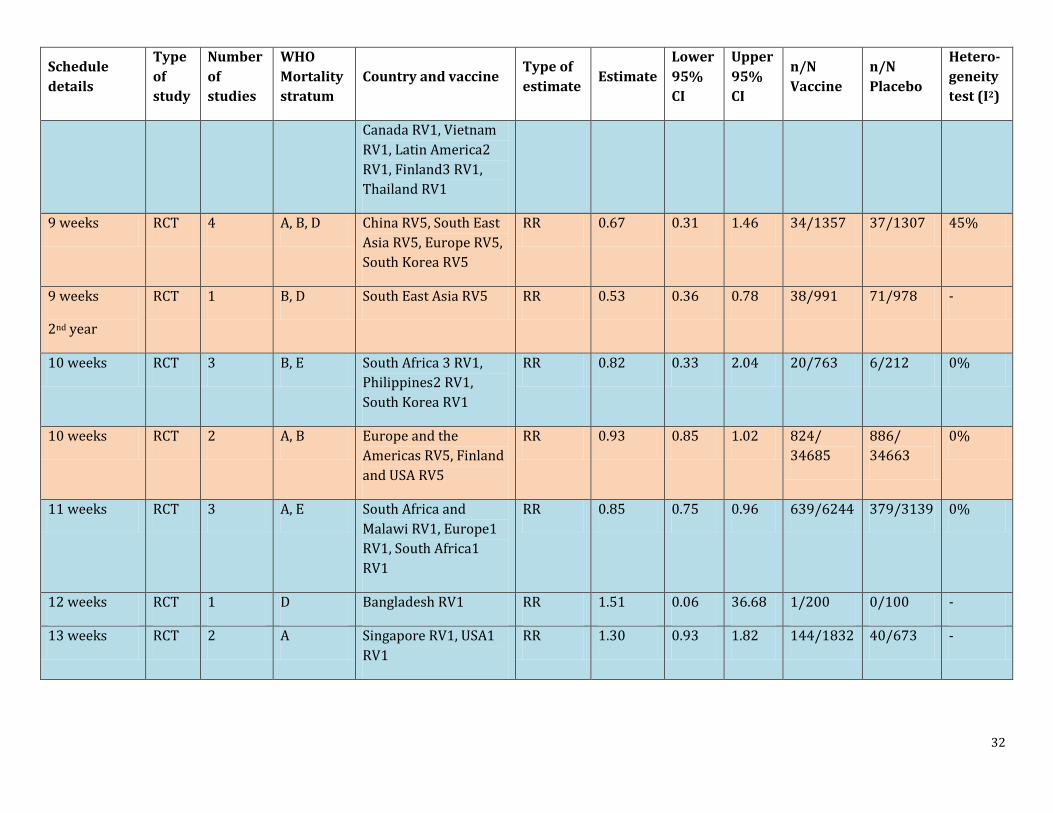
Canada RV1, Vietnam RV1, Latin America2 RV1, Finland3 RV1, Thailand RV1
9 weeks RCT 4 A, B, D China RV5, South East Asia RV5, Europe RV5, South Korea RV5
RR 0.67 0.31 1.46 34/1357 37/1307 45%
9 weeks
2nd year
RCT 1 B, D South East Asia RV5 RR 0.53 0.36 0.78 38/991 71/978 -
10 weeks RCT 3 B, E South Africa 3 RV1, Philippines2 RV1, South Korea RV1
RR 0.82 0.33 2.04 20/763 6/212 0%
10 weeks RCT 2 A, B Europe and the Americas RV5, Finland and USA RV5
RR 0.93 0.85 1.02 824/ 34685
886/ 34663
0%
11 weeks RCT 3 A, E South Africa and Malawi RV1, Europe1 RV1, South Africa1 RV1
RR 0.85 0.75 0.96 639/6244 379/3139 0%
12 weeks RCT 1 D Bangladesh RV1 RR 1.51 0.06 36.68 1/200 0/100 -
13 weeks RCT 2 A Singapore RV1, USA1 RV1
RR 1.30 0.93 1.82 144/1832 40/673 -
33
Schedule details
Type of study
Number of studies
WHO Mortality stratum
Country and vaccine Type of estimate
Estimate Lower 95% CI
Upper 95% CI
n/N Vaccine
n/N Placebo
Hetero-geneity test (I2)
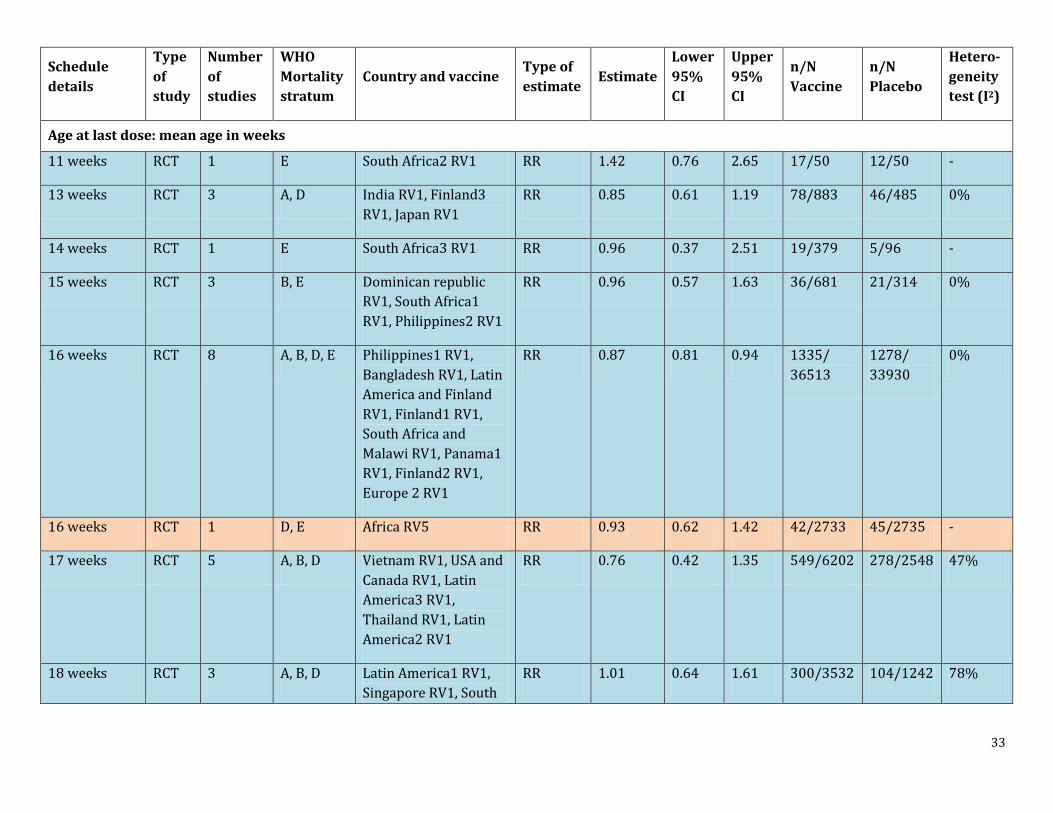
Age at last dose: mean age in weeks
11 weeks RCT 1 E South Africa2 RV1 RR 1.42 0.76 2.65 17/50 12/50 -
13 weeks RCT 3 A, D India RV1, Finland3 RV1, Japan RV1
RR 0.85 0.61 1.19 78/883 46/485 0%
14 weeks RCT 1 E South Africa3 RV1 RR 0.96 0.37 2.51 19/379 5/96 -
15 weeks RCT 3 B, E Dominican republic RV1, South Africa1 RV1, Philippines2 RV1
RR 0.96 0.57 1.63 36/681 21/314 0%
16 weeks RCT 8 A, B, D, E Philippines1 RV1, Bangladesh RV1, Latin America and Finland RV1, Finland1 RV1, South Africa and Malawi RV1, Panama1 RV1, Finland2 RV1, Europe 2 RV1
RR 0.87 0.81 0.94 1335/ 36513
1278/ 33930
0%
16 weeks RCT 1 D, E Africa RV5 RR 0.93 0.62 1.42 42/2733 45/2735 -
17 weeks RCT 5 A, B, D Vietnam RV1, USA and Canada RV1, Latin America3 RV1, Thailand RV1, Latin America2 RV1
RR 0.76 0.42 1.35 549/6202 278/2548 47%
18 weeks RCT 3 A, B, D Latin America1 RV1, Singapore RV1, South
RR 1.01 0.64 1.61 300/3532 104/1242 78%
34
Schedule details
Type of study
Number of studies
WHO Mortality stratum
Country and vaccine Type of estimate
Estimate Lower 95% CI
Upper 95% CI
n/N Vaccine
n/N Placebo
Hetero-geneity test (I2)
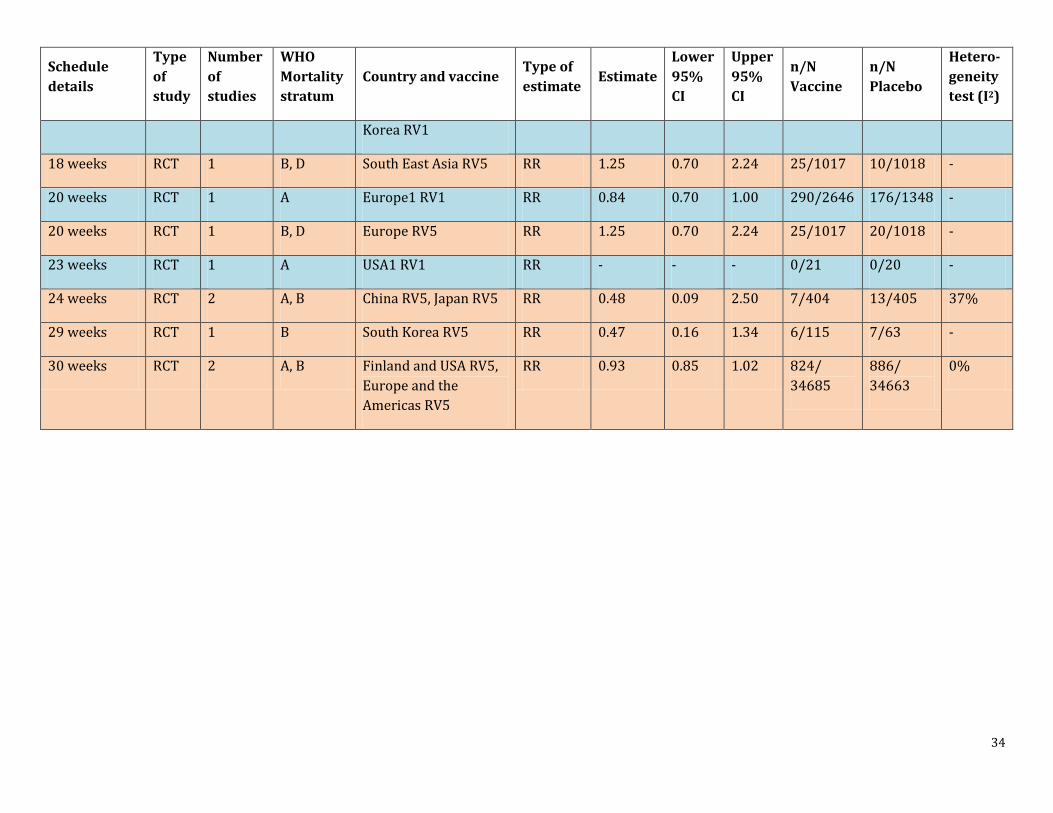
Korea RV1
18 weeks RCT 1 B, D South East Asia RV5 RR 1.25 0.70 2.24 25/1017 10/1018 -
20 weeks RCT 1 A Europe1 RV1 RR 0.84 0.70 1.00 290/2646 176/1348 -
20 weeks RCT 1 B, D Europe RV5 RR 1.25 0.70 2.24 25/1017 20/1018 -
23 weeks RCT 1 A USA1 RV1 RR - - - 0/21 0/20 -
24 weeks RCT 2 A, B China RV5, Japan RV5 RR 0.48 0.09 2.50 7/404 13/405 37%
29 weeks RCT 1 B South Korea RV5 RR 0.47 0.16 1.34 6/115 7/63 -
30 weeks RCT 2 A, B Finland and USA RV5, Europe and the Americas RV5
RR 0.93 0.85 1.02 824/ 34685
886/ 34663
0%
35
Schedule details
Type of study
Number of studies
WHO Mortality stratum
Country and vaccine Type of estimate
Estimate Lower 95% CI
Upper 95% CI
n/N Vaccine
n/N Placebo
Hetero-geneity test (I2)
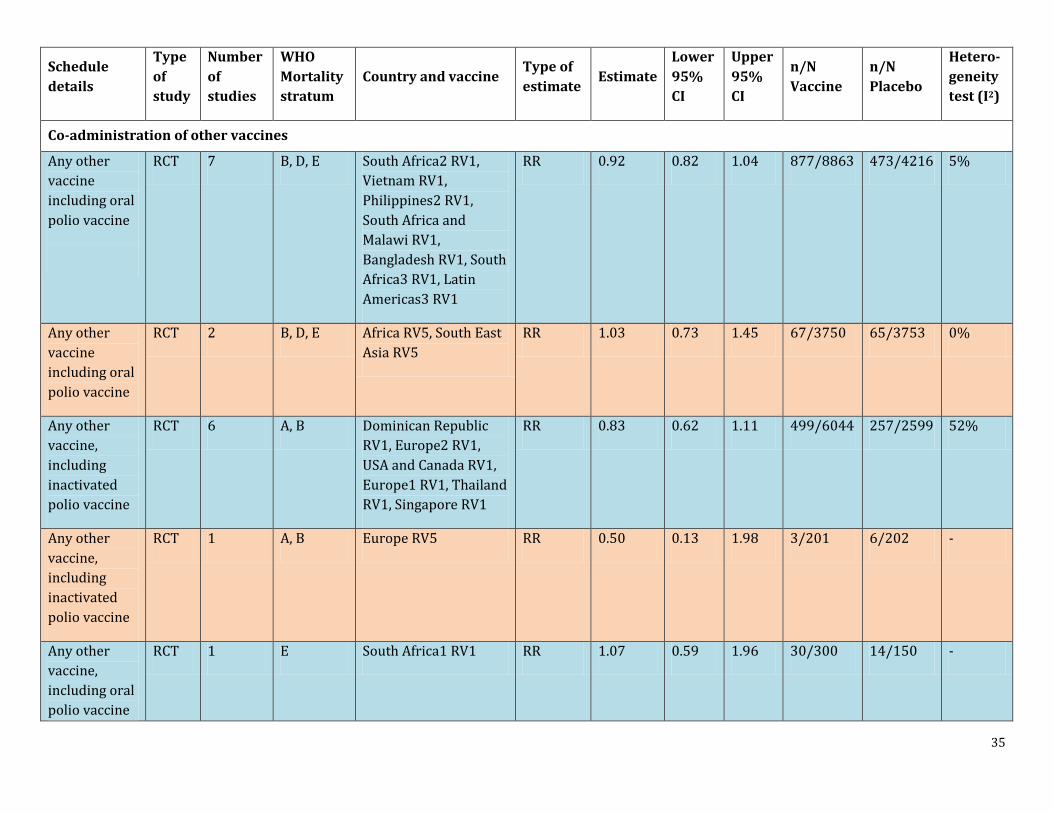
Co-administration of other vaccines
Any other vaccine including oral polio vaccine
RCT 7 B, D, E South Africa2 RV1, Vietnam RV1, Philippines2 RV1, South Africa and Malawi RV1, Bangladesh RV1, South Africa3 RV1, Latin Americas3 RV1
RR 0.92 0.82 1.04 877/8863 473/4216 5%
Any other vaccine including oral polio vaccine
RCT 2 B, D, E Africa RV5, South East Asia RV5
RR 1.03 0.73 1.45 67/3750 65/3753 0%
Any other vaccine, including inactivated polio vaccine
RCT 6 A, B Dominican Republic RV1, Europe2 RV1, USA and Canada RV1, Europe1 RV1, Thailand RV1, Singapore RV1
RR 0.83 0.62 1.11 499/6044 257/2599 52%
Any other vaccine, including inactivated polio vaccine
RCT 1 A, B Europe RV5 RR 0.50 0.13 1.98 3/201 6/202 -
Any other vaccine, including oral polio vaccine
RCT 1 E South Africa1 RV1 RR 1.07 0.59 1.96 30/300 14/150 -
36
Schedule details
Type of study
Number of studies
WHO Mortality stratum
Country and vaccine Type of estimate
Estimate Lower 95% CI
Upper 95% CI
n/N Vaccine
n/N Placebo
Hetero-geneity test (I2)
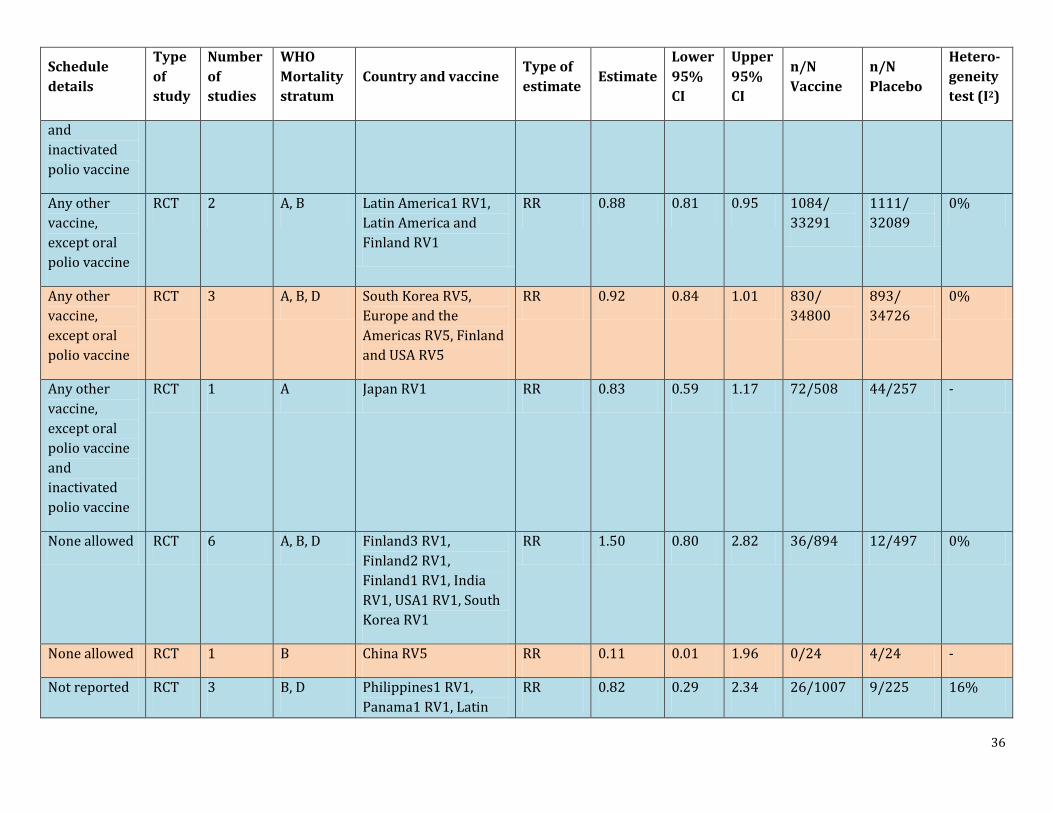
and inactivated polio vaccine
Any other vaccine, except oral polio vaccine
RCT 2 A, B Latin America1 RV1, Latin America and Finland RV1
RR 0.88 0.81 0.95 1084/ 33291
1111/ 32089
0%
Any other vaccine, except oral polio vaccine
RCT 3 A, B, D South Korea RV5, Europe and the Americas RV5, Finland and USA RV5
RR 0.92 0.84 1.01 830/ 34800
893/ 34726
0%
Any other vaccine, except oral polio vaccine and inactivated polio vaccine
RCT 1 A Japan RV1 RR 0.83 0.59 1.17 72/508 44/257 -
None allowed RCT 6 A, B, D Finland3 RV1, Finland2 RV1, Finland1 RV1, India RV1, USA1 RV1, South Korea RV1
RR 1.50 0.80 2.82 36/894 12/497 0%
None allowed RCT 1 B China RV5 RR 0.11 0.01 1.96 0/24 4/24 -
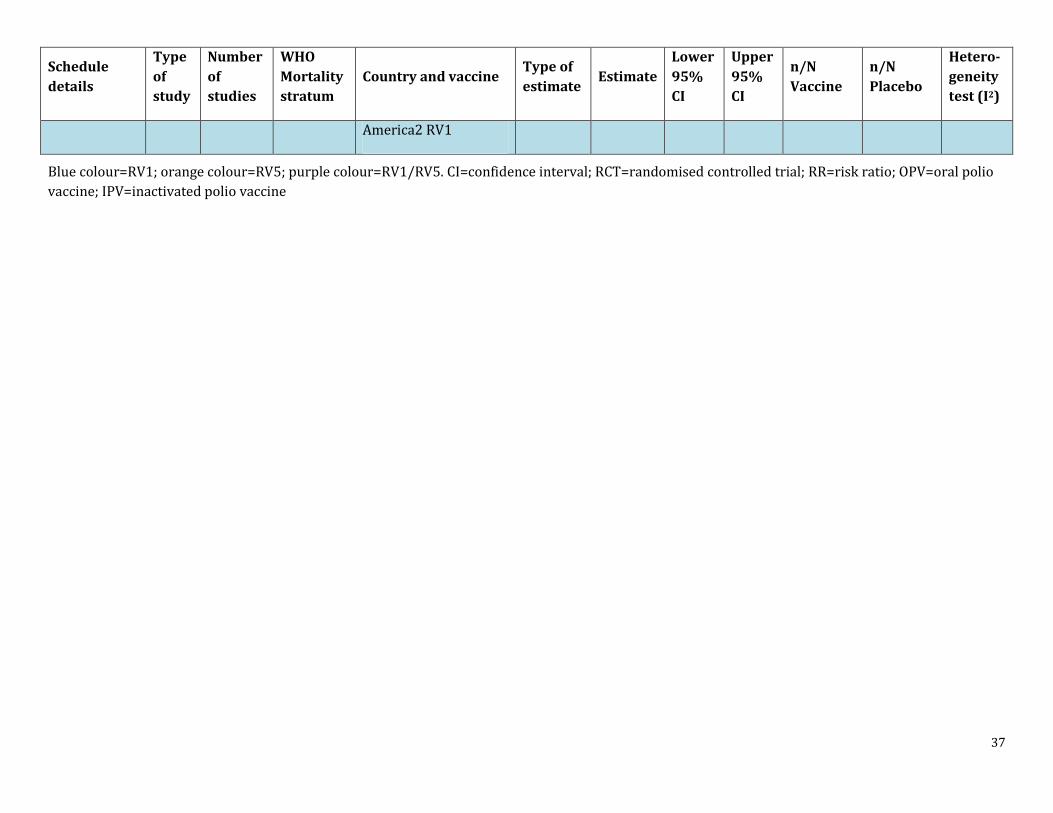
Not reported RCT 3 B, D Philippines1 RV1, Panama1 RV1, Latin
RR 0.82 0.29 2.34 26/1007 9/225 16%
37
Schedule details
Type of study
Number of studies
WHO Mortality stratum
Country and vaccine Type of estimate
Estimate Lower 95% CI
Upper 95% CI
n/N Vaccine
n/N Placebo
Hetero-geneity test (I2)
America2 RV1
Blue colour=RV1; orange colour=RV5; purple colour=RV1/RV5. CI=confidence interval; RCT=randomised controlled trial; RR=risk ratio; OPV=oral polio vaccine; IPV=inactivated polio vaccine
38
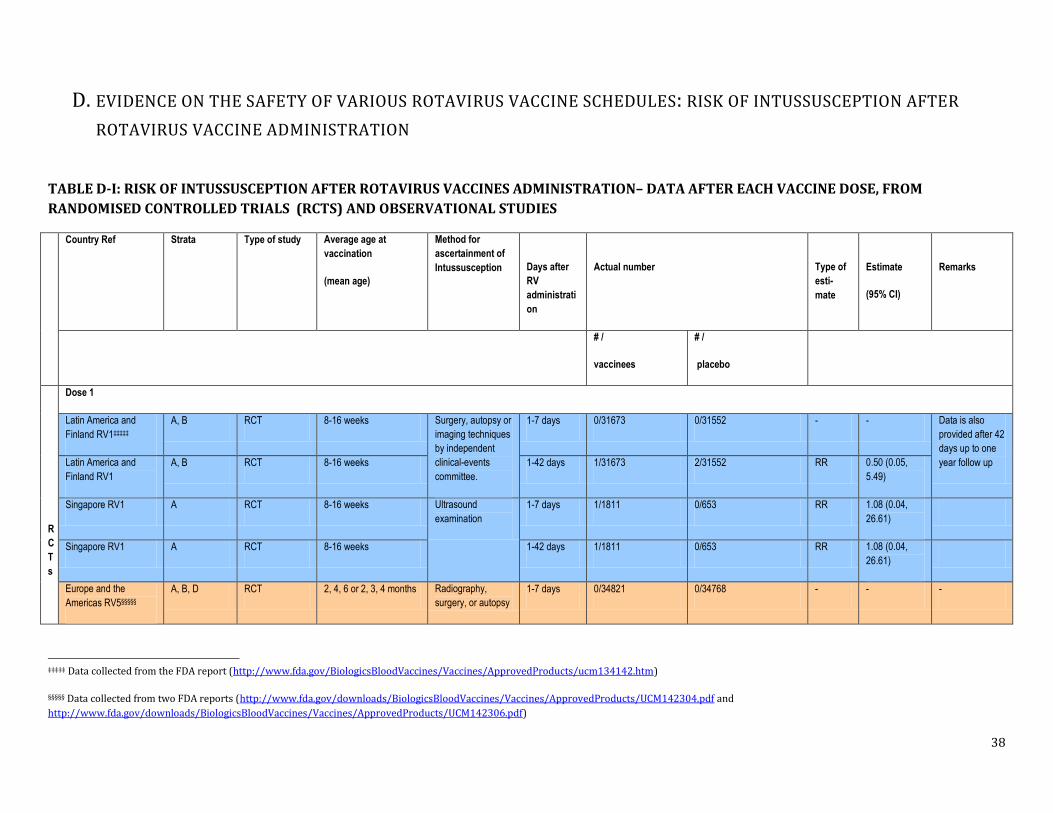
D. EVIDENCE ON THE SAFETY OF VARIOUS ROTAVIRUS VACCINE SCHEDULES: RISK OF INTUSSUSCEPTION AFTER ROTAVIRUS VACCINE ADMINISTRATION
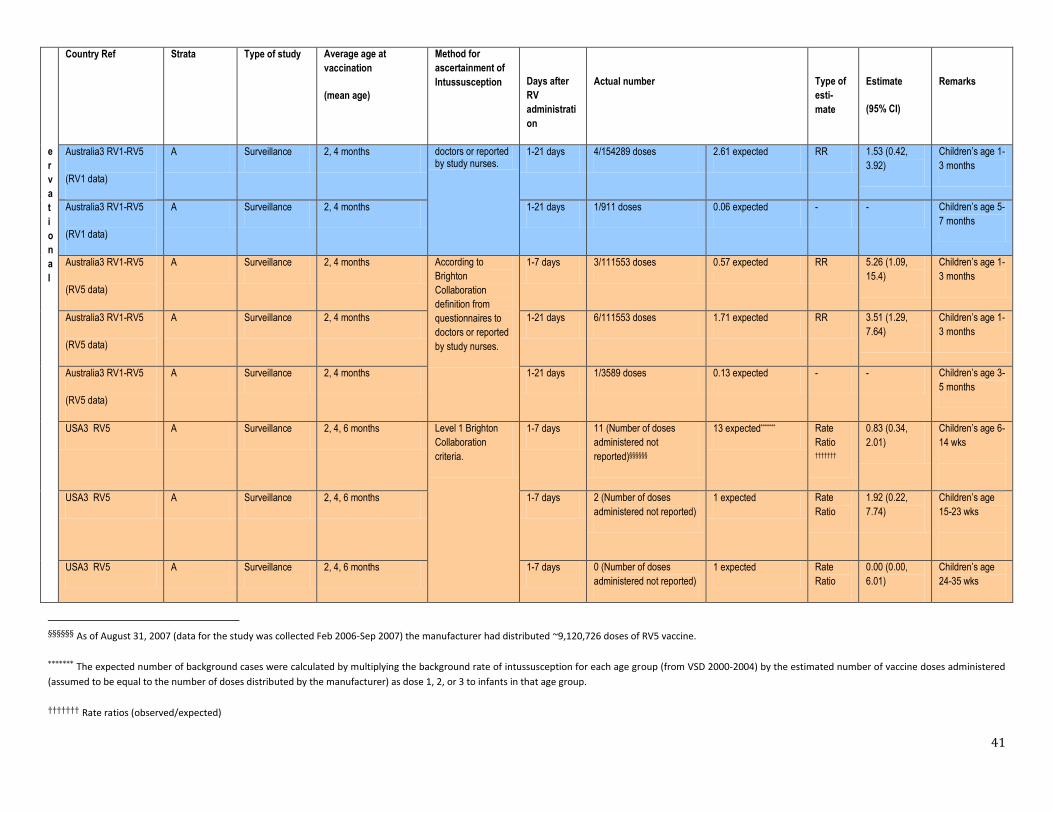
TABLE D-I: RISK OF INTUSSUSCEPTION AFTER ROTAVIRUS VACCINES ADMINISTRATION– DATA AFTER EACH VACCINE DOSE, FROM RANDOMISED CONTROLLED TRIALS (RCTS) AND OBSERVATIONAL STUDIES
Country Ref Strata Type of study Average age at vaccination
(mean age)
Method for ascertainment of Intussusception
Days after RV administration
Actual number
Type of esti-mate
Estimate
(95% CI)
Remarks
# /
vaccinees
# /
placebo
RCTs
Dose 1
Latin America and Finland RV1‡‡‡‡‡
A, B RCT 8-16 weeks Surgery, autopsy or imaging techniques by independent clinical-events committee.
1-7 days 0/31673 0/31552 - - Data is also provided after 42 days up to one year follow up Latin America and
Finland RV1 A, B RCT 8-16 weeks 1-42 days 1/31673 2/31552 RR 0.50 (0.05,
5.49)
Singapore RV1 A RCT 8-16 weeks Ultrasound examination
1-7 days 1/1811 0/653 RR 1.08 (0.04, 26.61)
Singapore RV1 A RCT 8-16 weeks 1-42 days 1/1811 0/653 RR 1.08 (0.04, 26.61)
Europe and the Americas RV5§§§§§
A, B, D RCT 2, 4, 6 or 2, 3, 4 months Radiography, surgery, or autopsy
1-7 days 0/34821 0/34768 - - -
‡‡‡‡‡ Data collected from the FDA report (http://www.fda.gov/BiologicsBloodVaccines/Vaccines/ApprovedProducts/ucm134142.htm)
§§§§§ Data collected from two FDA reports (http://www.fda.gov/downloads/BiologicsBloodVaccines/Vaccines/ApprovedProducts/UCM142304.pdf and http://www.fda.gov/downloads/BiologicsBloodVaccines/Vaccines/ApprovedProducts/UCM142306.pdf)
39
Country Ref Strata Type of study Average age at vaccination
(mean age)
Method for ascertainment of Intussusception
Days after RV administration
Actual number
Type of esti-mate
Estimate
(95% CI)
Remarks
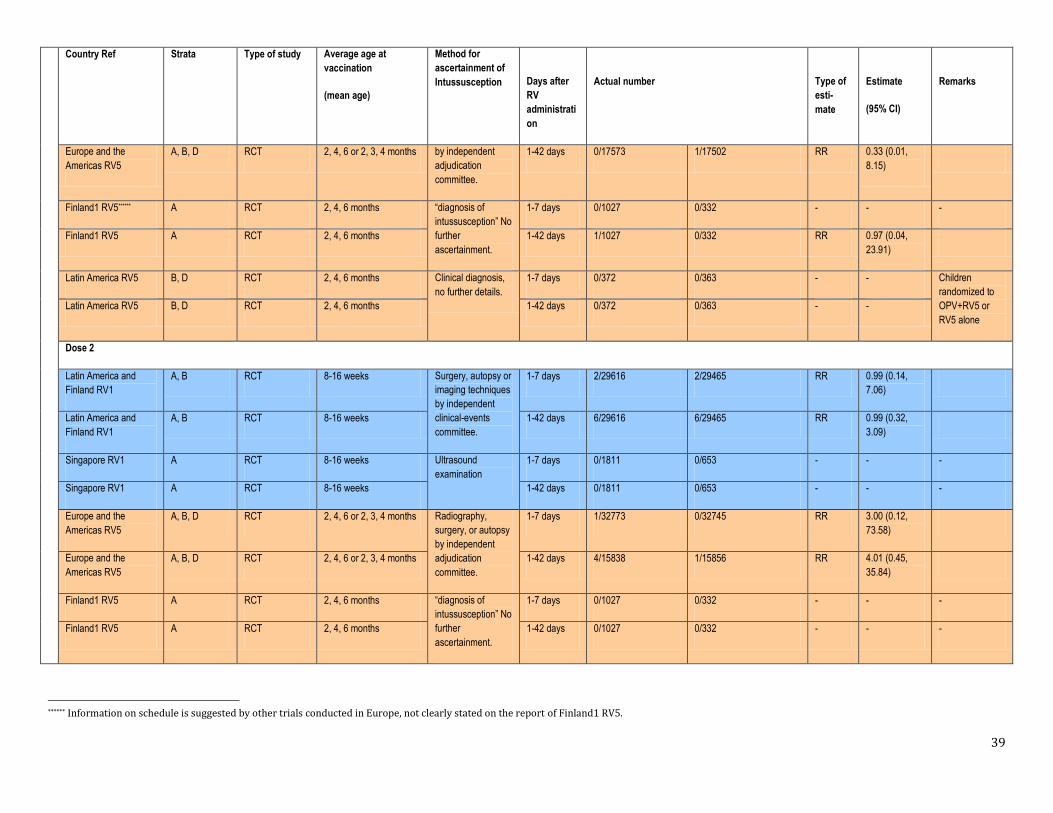
Europe and the Americas RV5
A, B, D RCT 2, 4, 6 or 2, 3, 4 months by independent adjudication committee.
1-42 days 0/17573 1/17502 RR 0.33 (0.01, 8.15)
Finland1 RV5****** A RCT 2, 4, 6 months “diagnosis of intussusception” No further ascertainment.
1-7 days 0/1027 0/332 - - -
Finland1 RV5 A RCT 2, 4, 6 months 1-42 days 1/1027 0/332 RR 0.97 (0.04, 23.91)
Latin America RV5 B, D RCT 2, 4, 6 months Clinical diagnosis, no further details.
1-7 days 0/372 0/363 - - Children randomized to OPV+RV5 or RV5 alone
Latin America RV5 B, D RCT 2, 4, 6 months 1-42 days 0/372 0/363 - -
Dose 2
Latin America and Finland RV1
A, B RCT 8-16 weeks Surgery, autopsy or imaging techniques by independent clinical-events committee.
1-7 days 2/29616 2/29465 RR 0.99 (0.14, 7.06)
Latin America and Finland RV1
A, B RCT 8-16 weeks 1-42 days 6/29616 6/29465 RR 0.99 (0.32, 3.09)
Singapore RV1 A RCT 8-16 weeks Ultrasound examination
1-7 days 0/1811 0/653 - - -
Singapore RV1 A RCT 8-16 weeks 1-42 days 0/1811 0/653 - - -
Europe and the Americas RV5
A, B, D RCT 2, 4, 6 or 2, 3, 4 months Radiography, surgery, or autopsy by independent adjudication committee.
1-7 days 1/32773 0/32745 RR 3.00 (0.12, 73.58)
Europe and the Americas RV5
A, B, D RCT 2, 4, 6 or 2, 3, 4 months 1-42 days 4/15838 1/15856 RR 4.01 (0.45, 35.84)
Finland1 RV5 A RCT 2, 4, 6 months “diagnosis of intussusception” No further ascertainment.
1-7 days 0/1027 0/332 - - -
Finland1 RV5 A RCT 2, 4, 6 months 1-42 days 0/1027 0/332 - - -
****** Information on schedule is suggested by other trials conducted in Europe, not clearly stated on the report of Finland1 RV5.
40
Country Ref Strata Type of study Average age at vaccination
(mean age)
Method for ascertainment of Intussusception
Days after RV administration
Actual number
Type of esti-mate
Estimate
(95% CI)
Remarks
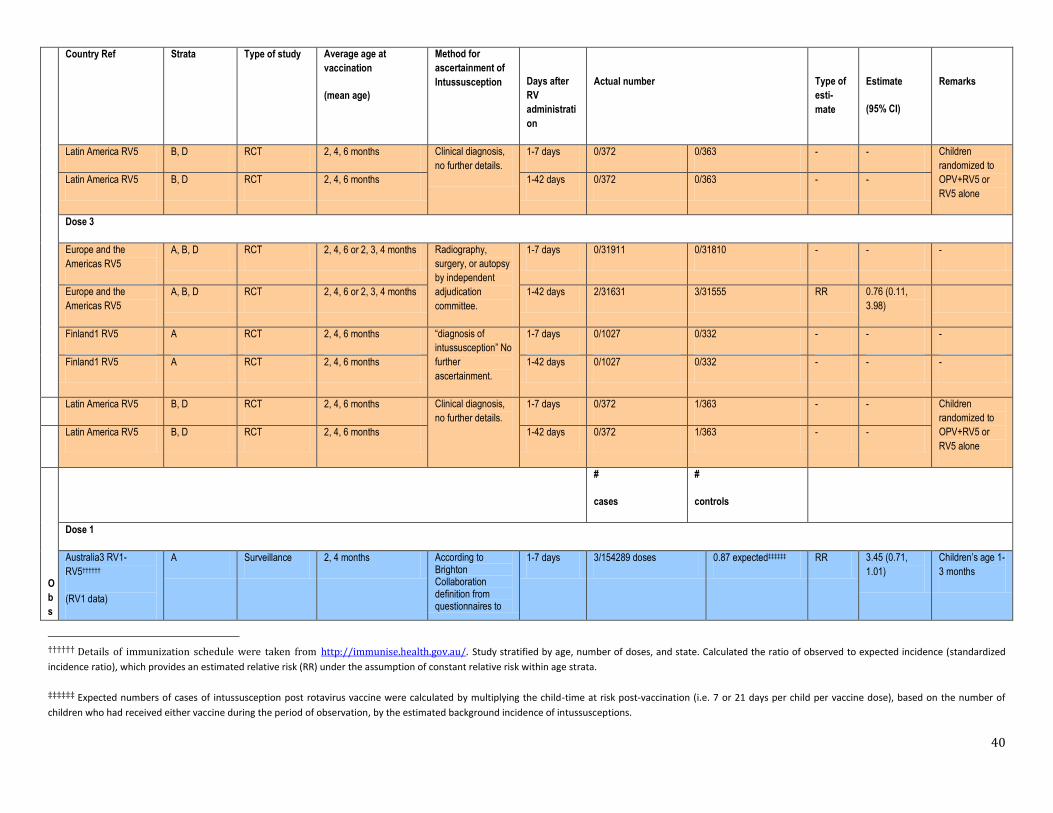
Latin America RV5 B, D RCT 2, 4, 6 months Clinical diagnosis, no further details.
1-7 days 0/372 0/363 - - Children randomized to OPV+RV5 or RV5 alone
Latin America RV5 B, D RCT 2, 4, 6 months 1-42 days 0/372 0/363 - -
Dose 3
Europe and the Americas RV5
A, B, D RCT 2, 4, 6 or 2, 3, 4 months Radiography, surgery, or autopsy by independent adjudication committee.
1-7 days 0/31911 0/31810 - - -
Europe and the Americas RV5
A, B, D RCT 2, 4, 6 or 2, 3, 4 months 1-42 days 2/31631 3/31555 RR 0.76 (0.11, 3.98)
Finland1 RV5 A RCT 2, 4, 6 months “diagnosis of intussusception” No further ascertainment.
1-7 days 0/1027 0/332 - - -
Finland1 RV5 A RCT 2, 4, 6 months 1-42 days 0/1027 0/332 - - -
Latin America RV5 B, D RCT 2, 4, 6 months Clinical diagnosis, no further details.
1-7 days 0/372 1/363 - - Children randomized to OPV+RV5 or RV5 alone
Latin America RV5 B, D RCT 2, 4, 6 months 1-42 days 0/372 1/363 - -
Obs
#
cases
#
controls
Dose 1
Australia3 RV1-RV5††††††
(RV1 data)
A Surveillance 2, 4 months According to Brighton Collaboration definition from questionnaires to
1-7 days 3/154289 doses 0.87 expected‡‡‡‡‡‡ RR 3.45 (0.71, 1.01)
Children’s age 1-3 months
†††††† Details of immunization schedule were taken from http://immunise.health.gov.au/. Study stratified by age, number of doses, and state. Calculated the ratio of observed to expected incidence (standardized
incidence ratio), which provides an estimated relative risk (RR) under the assumption of constant relative risk within age strata.
‡‡‡‡‡‡ Expected numbers of cases of intussusception post rotavirus vaccine were calculated by multiplying the child-time at risk post-vaccination (i.e. 7 or 21 days per child per vaccine dose), based on the number of
children who had received either vaccine during the period of observation, by the estimated background incidence of intussusceptions.
41
Country Ref Strata Type of study Average age at vaccination
(mean age)
Method for ascertainment of Intussusception
Days after RV administration
Actual number
Type of esti-mate
Estimate
(95% CI)
Remarks
ervational
Australia3 RV1-RV5
(RV1 data)
A Surveillance 2, 4 months doctors or reported by study nurses.
1-21 days 4/154289 doses 2.61 expected RR 1.53 (0.42, 3.92)
Children’s age 1-3 months
Australia3 RV1-RV5
(RV1 data)
A Surveillance 2, 4 months 1-21 days 1/911 doses 0.06 expected - - Children’s age 5-7 months
Australia3 RV1-RV5
(RV5 data)
A Surveillance 2, 4 months According to Brighton Collaboration definition from questionnaires to doctors or reported by study nurses.
1-7 days 3/111553 doses 0.57 expected RR 5.26 (1.09, 15.4)
Children’s age 1-3 months
Australia3 RV1-RV5
(RV5 data)
A Surveillance 2, 4 months 1-21 days 6/111553 doses 1.71 expected RR 3.51 (1.29, 7.64)
Children’s age 1-3 months
Australia3 RV1-RV5
(RV5 data)
A Surveillance 2, 4 months 1-21 days 1/3589 doses 0.13 expected - - Children’s age 3-5 months
USA3 RV5 A Surveillance 2, 4, 6 months Level 1 Brighton Collaboration criteria.
1-7 days 11 (Number of doses administered not reported)§§§§§§
13 expected******* Rate Ratio†††††††
0.83 (0.34, 2.01)
Children’s age 6-14 wks
USA3 RV5 A Surveillance 2, 4, 6 months 1-7 days 2 (Number of doses administered not reported)
1 expected Rate Ratio
1.92 (0.22, 7.74)
Children’s age 15-23 wks
USA3 RV5 A Surveillance 2, 4, 6 months 1-7 days 0 (Number of doses administered not reported)
1 expected Rate Ratio
0.00 (0.00, 6.01)
Children’s age 24-35 wks
§§§§§§ As of August 31, 2007 (data for the study was collected Feb 2006-Sep 2007) the manufacturer had distributed ~9,120,726 doses of RV5 vaccine.
******* The expected number of background cases were calculated by multiplying the background rate of intussusception for each age group (from VSD 2000-2004) by the estimated number of vaccine doses administered
(assumed to be equal to the number of doses distributed by the manufacturer) as dose 1, 2, or 3 to infants in that age group.
††††††† Rate ratios (observed/expected)

42
Country Ref Strata Type of study Average age at vaccination
(mean age)
Method for ascertainment of Intussusception
Days after RV administration
Actual number
Type of esti-mate
Estimate
(95% CI)
Remarks
USA3 RV5 A Surveillance 2, 4, 6 months 1-21 days 14 (Number of doses administered not reported)
40 expected Rate Ratio
0.35 (0.15-0.81)
Children’s age 6-14 wks
USA3 RV5 A Surveillance 2, 4, 6 months 1-21 days 2 (Number of doses administered not reported)
3 expected Rate Ratio
0.64 (0.07-2.58)
Children’s age 15-23 wks
USA3 RV5 A Surveillance 2, 4, 6 months 1-21 days 0 (Number of doses administered not reported)
2 expected Rate Ratio
0.00 (0.00-2.01)
Children’s age 24-35 wks
USA13 RV5 A Surveillance 2, 4, 6 months Brighton Collaboration definition.
1-7 days 1/309,844 doses 0.8 expected‡‡‡‡‡‡‡ SIR§§§§§§§ 1.21 (0.03, 6.75)
Number of exposed cases and number of unexposed cases reported
USA13 RV5 A Surveillance 2, 4, 6 months 1-21 days 7/309,844 doses 5.7 expected SIR 1.23 (0.50, 2.54)
Brazil and Mexico RV1 B Case-control 2,4 months Surgery, autopsy, contrast enema or ultrasonography by trained coordinators
1-7 days 24/274 17/701 OR 5.8 (2.6, 13.0) Data from Mexico
Brazil and Mexico RV1 B Case-control 2,4 months 8-14 days 6/256 17/701 OR 1.1 (0.5–2.7) Data from Mexico
Brazil and Mexico RV1 B Case-control 2,4 months 15-21 days 5/255 21/705 OR 0.9 (0.3–2.2) Data from Mexico
Brazil and Mexico RV1 B Case-control 2,4 months 1-7 days 4/321 13/1271 OR 1.4 (0.4–4.8) Data from Brazil
Brazil and Mexico RV1 B Case-control 2,4 months 8-14 days 6/323 19/1277 OR 1.6 (0.5–4.7) Data from Brazil
‡‡‡‡‡‡‡ Expected cases of intussusception were based on background rates from VSD 2001-2005 (ICD-9 codes) stratified by age and care site.
§§§§§§§ Standardized incidence ratio, computed by dividing the number of observed visits for intussusceptions following RV5 by the number of expected visits.
43
Country Ref Strata Type of study Average age at vaccination
(mean age)
Method for ascertainment of Intussusception
Days after RV administration
Actual number
Type of esti-mate
Estimate
(95% CI)
Remarks
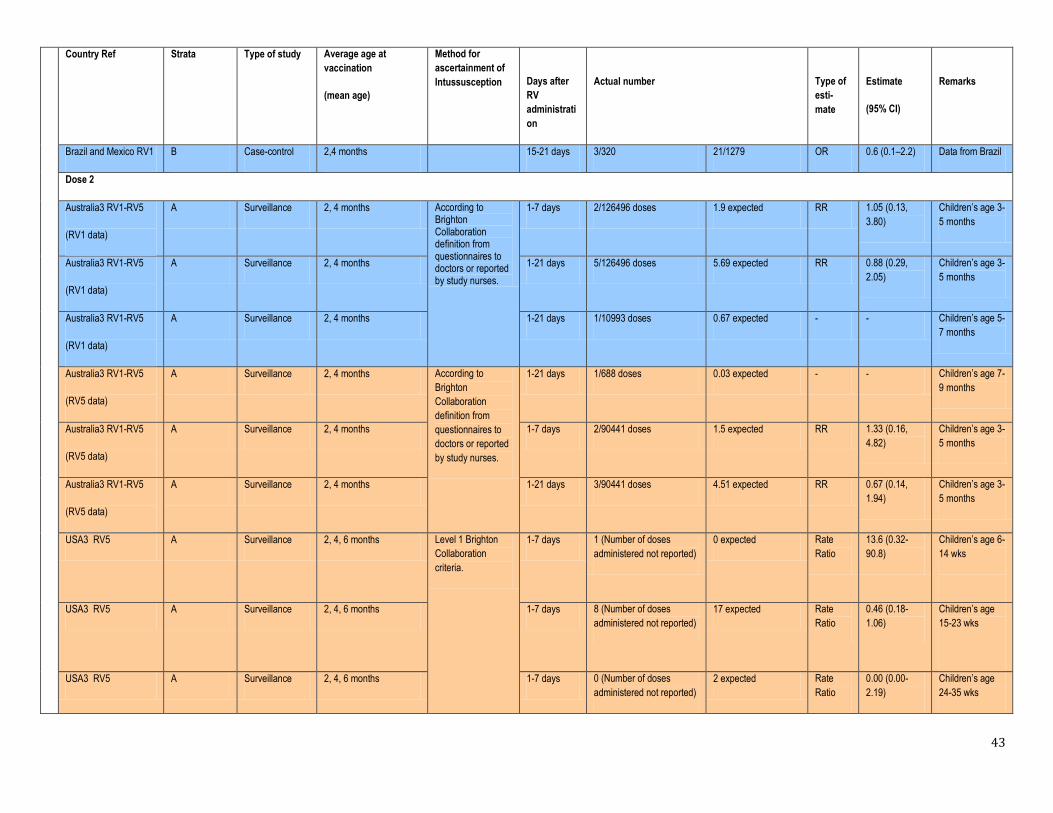
Brazil and Mexico RV1 B Case-control 2,4 months 15-21 days 3/320 21/1279 OR 0.6 (0.1–2.2) Data from Brazil
Dose 2
Australia3 RV1-RV5
(RV1 data)
A Surveillance 2, 4 months According to Brighton Collaboration definition from questionnaires to doctors or reported by study nurses.
1-7 days 2/126496 doses 1.9 expected RR 1.05 (0.13, 3.80)
Children’s age 3-5 months
Australia3 RV1-RV5
(RV1 data)
A Surveillance 2, 4 months 1-21 days 5/126496 doses 5.69 expected RR 0.88 (0.29, 2.05)
Children’s age 3-5 months
Australia3 RV1-RV5
(RV1 data)
A Surveillance 2, 4 months 1-21 days 1/10993 doses 0.67 expected - - Children’s age 5-7 months
Australia3 RV1-RV5
(RV5 data)
A Surveillance 2, 4 months According to Brighton Collaboration definition from questionnaires to doctors or reported by study nurses.
1-21 days 1/688 doses 0.03 expected - - Children’s age 7-9 months
Australia3 RV1-RV5
(RV5 data)
A Surveillance 2, 4 months 1-7 days 2/90441 doses 1.5 expected RR 1.33 (0.16, 4.82)
Children’s age 3-5 months
Australia3 RV1-RV5
(RV5 data)
A Surveillance 2, 4 months 1-21 days 3/90441 doses 4.51 expected RR 0.67 (0.14, 1.94)
Children’s age 3-5 months
USA3 RV5 A Surveillance 2, 4, 6 months Level 1 Brighton Collaboration criteria.
1-7 days 1 (Number of doses administered not reported)
0 expected Rate Ratio
13.6 (0.32-90.8)
Children’s age 6-14 wks
USA3 RV5 A Surveillance 2, 4, 6 months 1-7 days 8 (Number of doses administered not reported)
17 expected Rate Ratio
0.46 (0.18-1.06)
Children’s age 15-23 wks
USA3 RV5 A Surveillance 2, 4, 6 months 1-7 days 0 (Number of doses administered not reported)
2 expected Rate Ratio
0.00 (0.00-2.19)
Children’s age 24-35 wks
44
Country Ref Strata Type of study Average age at vaccination
(mean age)
Method for ascertainment of Intussusception
Days after RV administration
Actual number
Type of esti-mate
Estimate
(95% CI)
Remarks
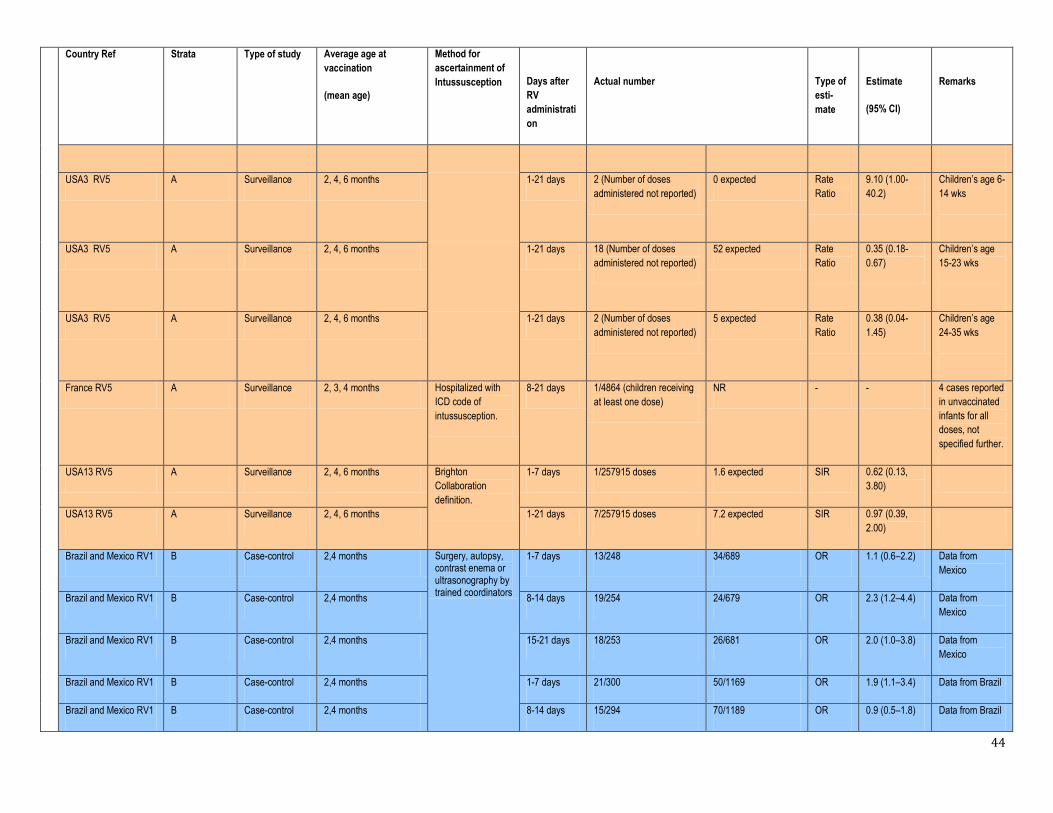
USA3 RV5 A Surveillance 2, 4, 6 months 1-21 days 2 (Number of doses administered not reported)
0 expected Rate Ratio
9.10 (1.00-40.2)
Children’s age 6-14 wks
USA3 RV5 A Surveillance 2, 4, 6 months 1-21 days 18 (Number of doses administered not reported)
52 expected Rate Ratio
0.35 (0.18-0.67)
Children’s age 15-23 wks
USA3 RV5 A Surveillance 2, 4, 6 months 1-21 days 2 (Number of doses administered not reported)
5 expected Rate Ratio
0.38 (0.04-1.45)
Children’s age 24-35 wks
France RV5 A Surveillance 2, 3, 4 months Hospitalized with ICD code of intussusception.
8-21 days 1/4864 (children receiving at least one dose)
NR - - 4 cases reported in unvaccinated infants for all doses, not specified further.
USA13 RV5 A Surveillance 2, 4, 6 months Brighton Collaboration definition.
1-7 days 1/257915 doses 1.6 expected SIR 0.62 (0.13, 3.80)
USA13 RV5 A Surveillance 2, 4, 6 months 1-21 days 7/257915 doses 7.2 expected SIR 0.97 (0.39, 2.00)
Brazil and Mexico RV1 B Case-control 2,4 months Surgery, autopsy, contrast enema or ultrasonography by trained coordinators
1-7 days 13/248 34/689 OR 1.1 (0.6–2.2) Data from Mexico
Brazil and Mexico RV1 B Case-control 2,4 months 8-14 days 19/254 24/679 OR 2.3 (1.2–4.4) Data from Mexico
Brazil and Mexico RV1 B Case-control 2,4 months 15-21 days 18/253 26/681 OR 2.0 (1.0–3.8) Data from Mexico
Brazil and Mexico RV1 B Case-control 2,4 months 1-7 days 21/300 50/1169 OR 1.9 (1.1–3.4) Data from Brazil
Brazil and Mexico RV1 B Case-control 2,4 months 8-14 days 15/294 70/1189 OR 0.9 (0.5–1.8) Data from Brazil
45
Country Ref Strata Type of study Average age at vaccination
(mean age)
Method for ascertainment of Intussusception
Days after RV administration
Actual number
Type of esti-mate
Estimate
(95% CI)
Remarks
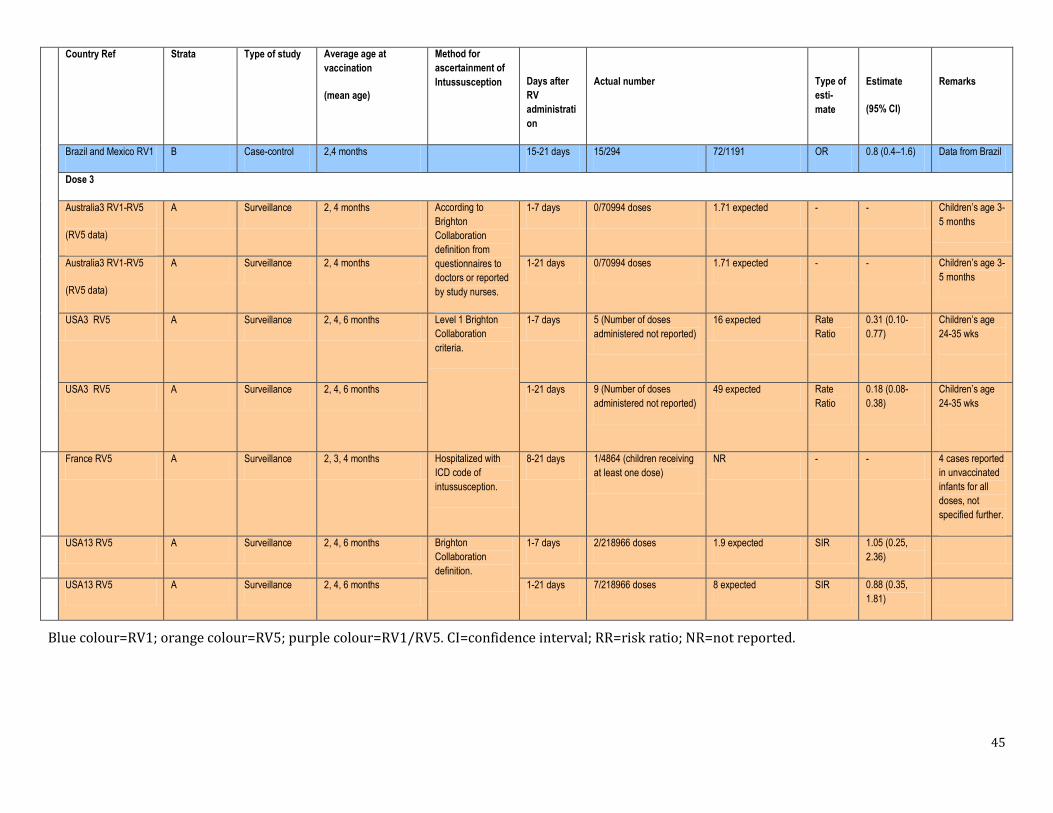
Brazil and Mexico RV1 B Case-control 2,4 months 15-21 days 15/294 72/1191 OR 0.8 (0.4–1.6) Data from Brazil
Dose 3
Australia3 RV1-RV5
(RV5 data)
A Surveillance 2, 4 months According to Brighton Collaboration definition from questionnaires to doctors or reported by study nurses.
1-7 days 0/70994 doses 1.71 expected - - Children’s age 3-5 months
Australia3 RV1-RV5
(RV5 data)
A Surveillance 2, 4 months 1-21 days 0/70994 doses 1.71 expected - - Children’s age 3-5 months
USA3 RV5 A Surveillance 2, 4, 6 months Level 1 Brighton Collaboration criteria.
1-7 days 5 (Number of doses administered not reported)
16 expected Rate Ratio
0.31 (0.10-0.77)
Children’s age 24-35 wks
USA3 RV5 A Surveillance 2, 4, 6 months 1-21 days 9 (Number of doses administered not reported)
49 expected Rate Ratio
0.18 (0.08-0.38)
Children’s age 24-35 wks
France RV5 A Surveillance 2, 3, 4 months Hospitalized with ICD code of intussusception.
8-21 days 1/4864 (children receiving at least one dose)
NR - - 4 cases reported in unvaccinated infants for all doses, not specified further.
USA13 RV5 A Surveillance 2, 4, 6 months Brighton Collaboration definition.
1-7 days 2/218966 doses 1.9 expected SIR 1.05 (0.25, 2.36)
USA13 RV5 A Surveillance 2, 4, 6 months 1-21 days 7/218966 doses 8 expected SIR 0.88 (0.35, 1.81)
Blue colour=RV1; orange colour=RV5; purple colour=RV1/RV5. CI=confidence interval; RR=risk ratio; NR=not reported.
46
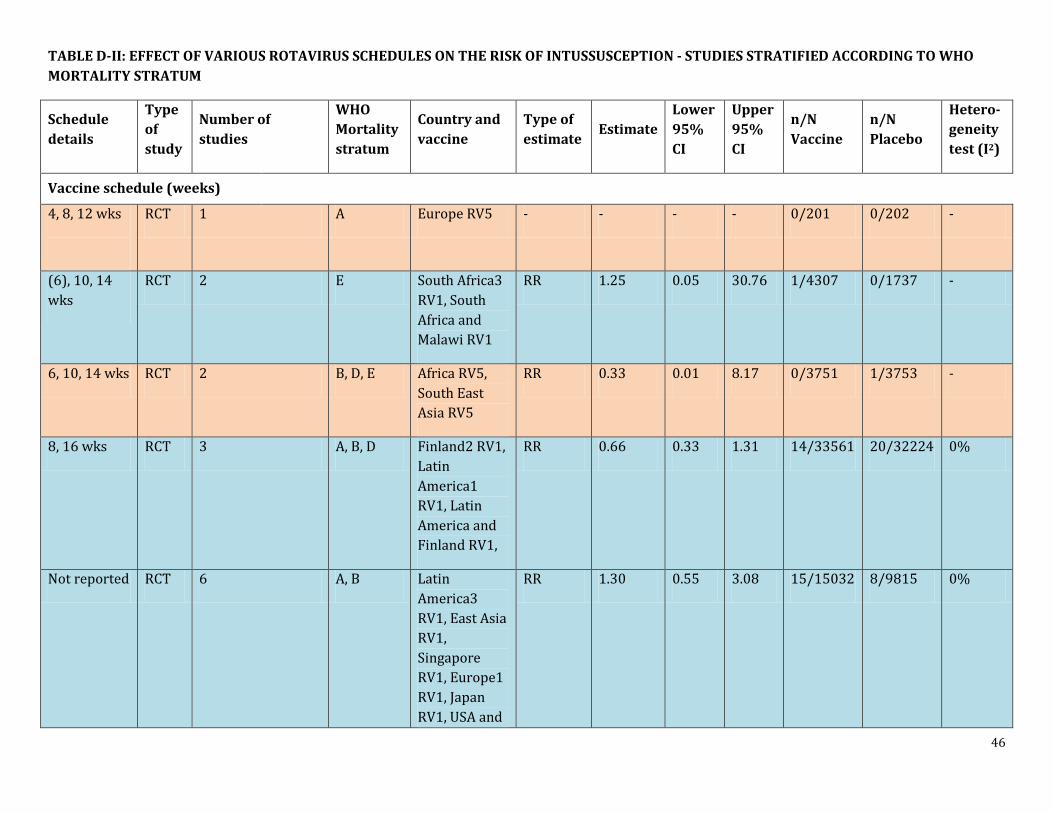
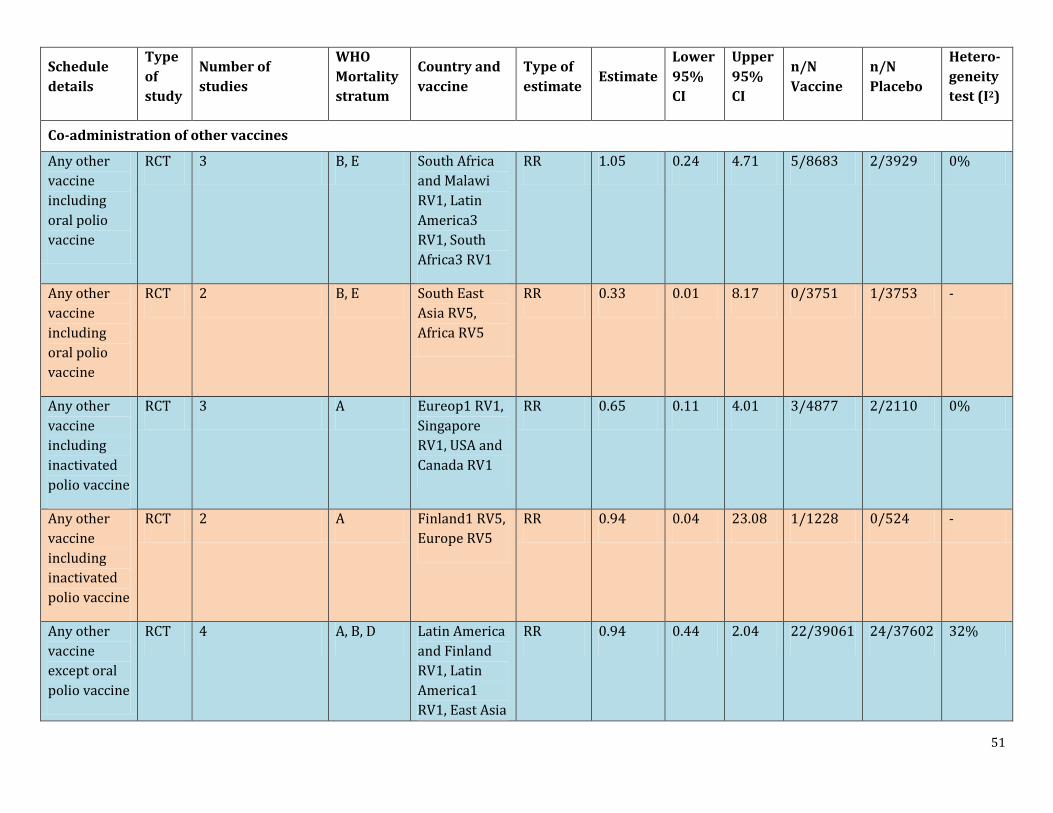
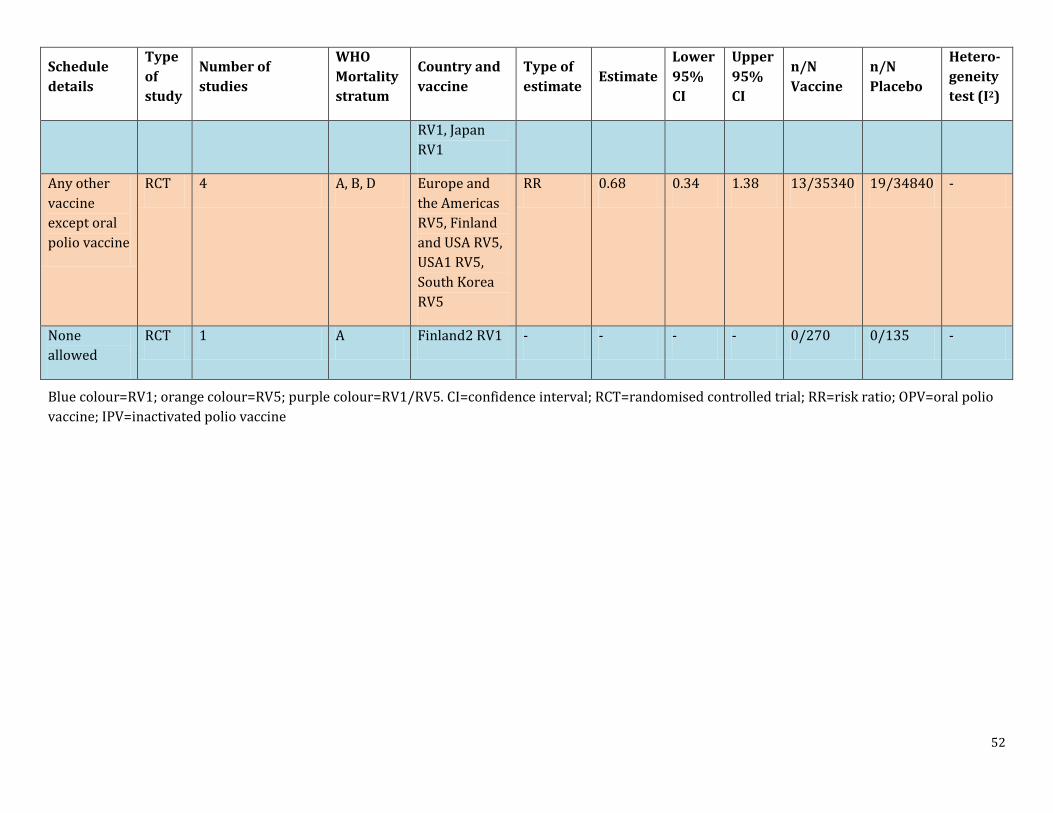
TABLE D-II: EFFECT OF VARIOUS ROTAVIRUS SCHEDULES ON THE RISK OF INTUSSUSCEPTION - STUDIES STRATIFIED ACCORDING TO WHO MORTALITY STRATUM
Schedule details
Type of study
Number of studies
WHO Mortality stratum
Country and vaccine
Type of estimate
Estimate Lower 95% CI
Upper 95% CI
n/N Vaccine
n/N Placebo
Hetero-geneity test (I2)
Vaccine schedule (weeks)
4, 8, 12 wks
RCT 1 A Europe RV5 - - - - 0/201 0/202 -
(6), 10, 14 wks
RCT 2 E South Africa3 RV1, South Africa and Malawi RV1
RR 1.25 0.05 30.76 1/4307 0/1737 -
6, 10, 14 wks RCT 2 B, D, E Africa RV5, South East Asia RV5
RR 0.33 0.01 8.17 0/3751 1/3753 -
8, 16 wks RCT 3 A, B, D Finland2 RV1, Latin America1 RV1, Latin America and Finland RV1,
RR 0.66 0.33 1.31 14/33561 20/32224 0%
Not reported RCT 6 A, B Latin America3 RV1, East Asia RV1, Singapore RV1, Europe1 RV1, Japan RV1, USA and
RR 1.30 0.55 3.08 15/15032 8/9815 0%
47
Schedule details
Type of study
Number of studies
WHO Mortality stratum
Country and vaccine
Type of estimate
Estimate Lower 95% CI
Upper 95% CI
n/N Vaccine
n/N Placebo
Hetero-geneity test (I2)
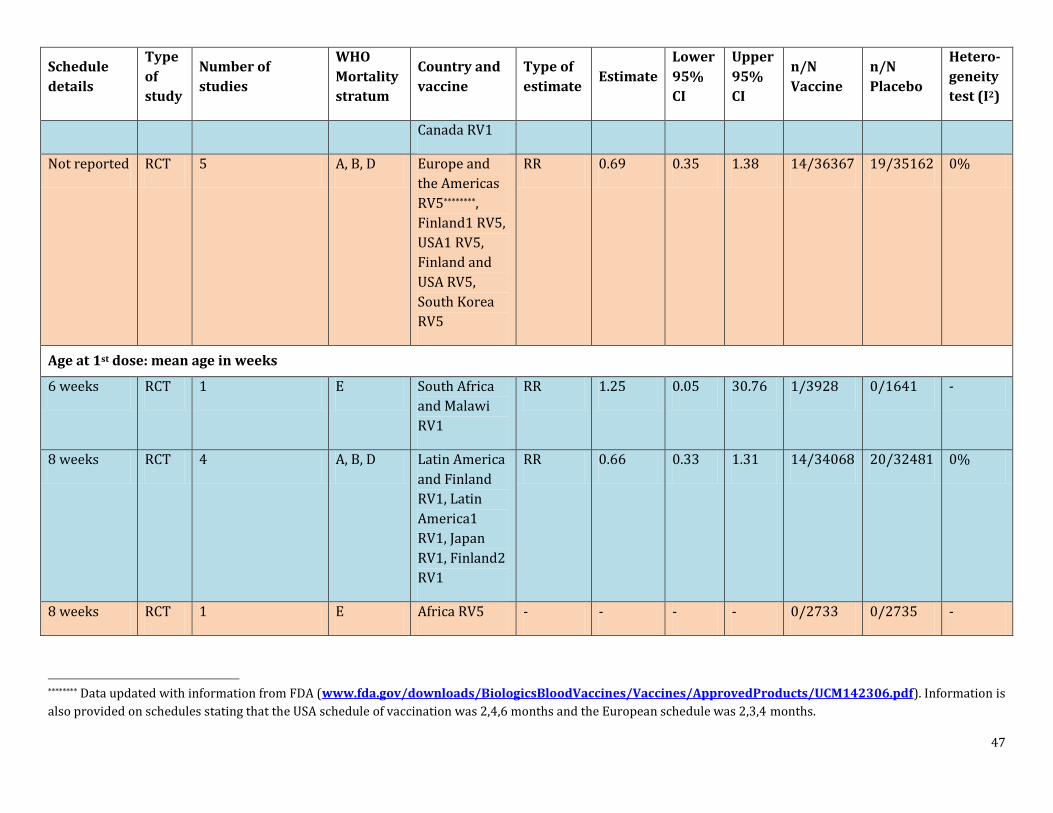
Canada RV1
Not reported RCT 5 A, B, D Europe and the Americas RV5********, Finland1 RV5, USA1 RV5, Finland and USA RV5, South Korea RV5
RR 0.69 0.35 1.38 14/36367 19/35162 0%
Age at 1st dose: mean age in weeks
6 weeks RCT 1 E South Africa and Malawi RV1
RR 1.25 0.05 30.76 1/3928 0/1641 -
8 weeks RCT 4 A, B, D Latin America and Finland RV1, Latin America1 RV1, Japan RV1, Finland2 RV1
RR 0.66 0.33 1.31 14/34068 20/32481 0%
8 weeks RCT 1 E Africa RV5 - - - - 0/2733 0/2735 -
******** Data updated with information from FDA (www.fda.gov/downloads/BiologicsBloodVaccines/Vaccines/ApprovedProducts/UCM142306.pdf). Information is also provided on schedules stating that the USA schedule of vaccination was 2,4,6 months and the European schedule was 2,3,4 months.
48
Schedule details
Type of study
Number of studies
WHO Mortality stratum
Country and vaccine
Type of estimate
Estimate Lower 95% CI
Upper 95% CI
n/N Vaccine
n/N Placebo
Hetero-geneity test (I2)
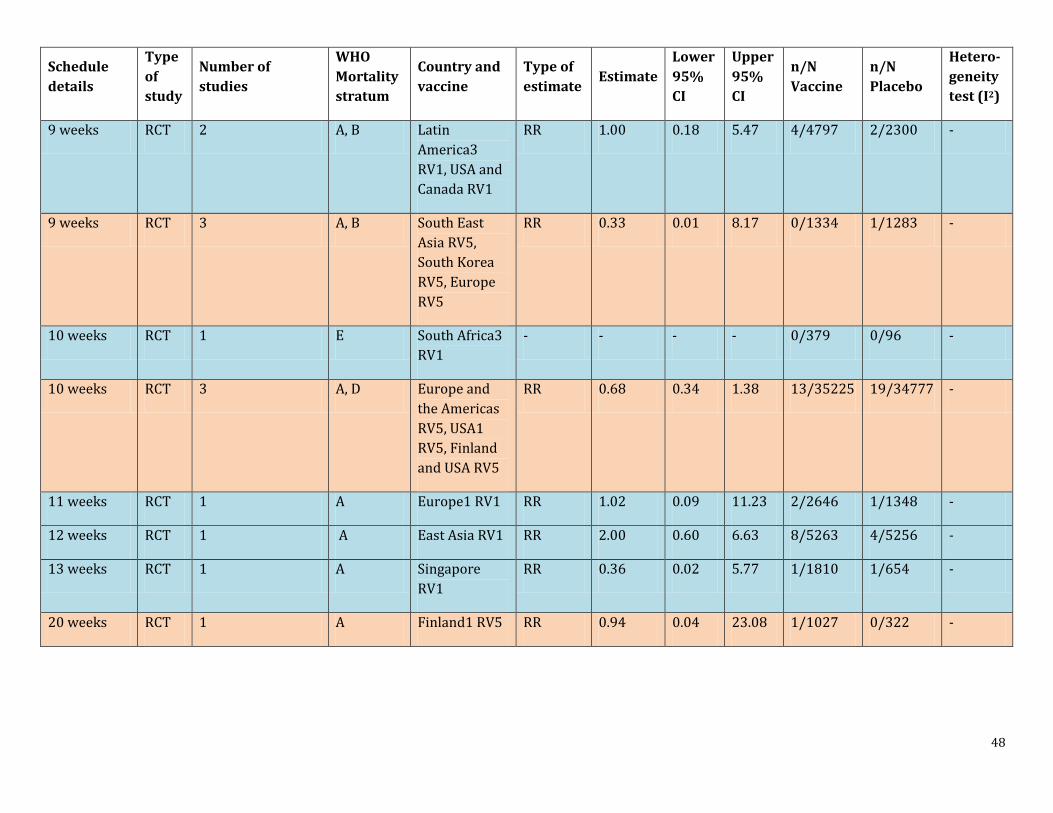
9 weeks RCT 2 A, B Latin America3 RV1, USA and Canada RV1
RR 1.00 0.18 5.47 4/4797 2/2300 -
9 weeks RCT 3 A, B South East Asia RV5, South Korea RV5, Europe RV5
RR 0.33 0.01 8.17 0/1334 1/1283 -
10 weeks RCT 1 E South Africa3 RV1
- - - - 0/379 0/96 -
10 weeks RCT 3 A, D Europe and the Americas RV5, USA1 RV5, Finland and USA RV5
RR 0.68 0.34 1.38 13/35225 19/34777 -
11 weeks RCT 1 A Europe1 RV1 RR 1.02 0.09 11.23 2/2646 1/1348 -
12 weeks RCT 1 A East Asia RV1 RR 2.00 0.60 6.63 8/5263 4/5256 -
13 weeks RCT 1 A Singapore RV1
RR 0.36 0.02 5.77 1/1810 1/654 -
20 weeks RCT 1 A Finland1 RV5 RR 0.94 0.04 23.08 1/1027 0/322 -
49
Schedule details
Type of study
Number of studies
WHO Mortality stratum
Country and vaccine
Type of estimate
Estimate Lower 95% CI
Upper 95% CI
n/N Vaccine
n/N Placebo
Hetero-geneity test (I2)
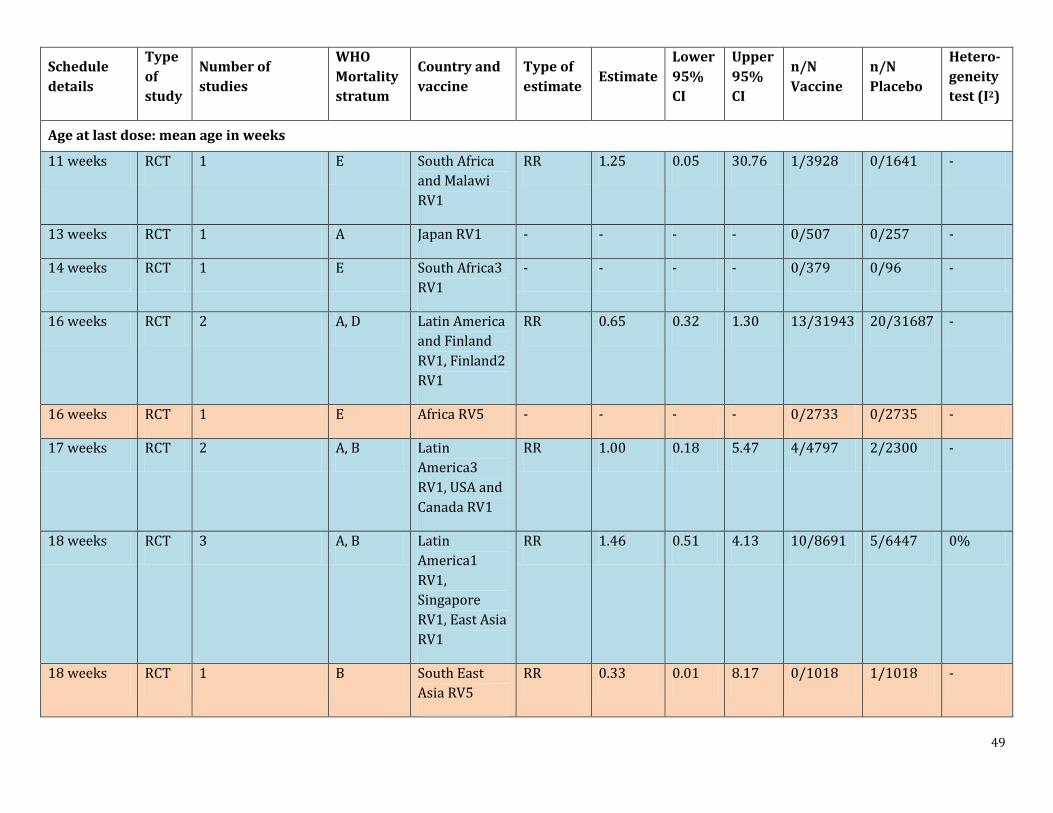
Age at last dose: mean age in weeks
11 weeks RCT 1 E South Africa and Malawi RV1
RR 1.25 0.05 30.76 1/3928 0/1641 -
13 weeks RCT 1 A Japan RV1 - - - - 0/507 0/257 -
14 weeks RCT 1 E South Africa3 RV1
- - - - 0/379 0/96 -
16 weeks RCT 2 A, D Latin America and Finland RV1, Finland2 RV1
RR 0.65 0.32 1.30 13/31943 20/31687 -
16 weeks RCT 1 E Africa RV5 - - - - 0/2733 0/2735 -
17 weeks RCT 2 A, B Latin America3 RV1, USA and Canada RV1
RR 1.00 0.18 5.47 4/4797 2/2300 -
18 weeks RCT 3 A, B Latin America1 RV1, Singapore RV1, East Asia RV1
RR 1.46 0.51 4.13 10/8691 5/6447 0%
18 weeks RCT 1 B South East Asia RV5
RR 0.33 0.01 8.17 0/1018 1/1018 -

50
Schedule details
Type of study
Number of studies
WHO Mortality stratum
Country and vaccine
Type of estimate
Estimate Lower 95% CI
Upper 95% CI
n/N Vaccine
n/N Placebo
Hetero-geneity test (I2)
20 weeks RCT 1 A Europe1 RV1 RR 1.02 0.09 11.23 2/2646 1/1348 -
20 weeks RCT 1 A Europe RV5 - - - - 0/201 0/202 -
26 weeks RCT 1 A USA1 RV5 - - - - 0/573 0/148 -
29 weeks RCT 1 B South Korea RV5
- - - - 0/115 0/63 -
30 weeks RCT 2 A, D Europe and the Americas RV5, Finland and USA RV5
RR 0.68 0.34 1.38 13/34652 19/34629 -
36 weeks RCT 1 A Finland1 RV5 RR 0.94 0.04 23.08 1/1027 0/322 -
51
Schedule details
Type of study
Number of studies
WHO Mortality stratum
Country and vaccine
Type of estimate
Estimate Lower 95% CI
Upper 95% CI
n/N Vaccine
n/N Placebo
Hetero-geneity test (I2)
Co-administration of other vaccines
Any other vaccine including oral polio vaccine
RCT 3 B, E South Africa and Malawi RV1, Latin America3 RV1, South Africa3 RV1
RR 1.05 0.24 4.71 5/8683 2/3929 0%
Any other vaccine including oral polio vaccine
RCT 2 B, E South East Asia RV5, Africa RV5
RR 0.33 0.01 8.17 0/3751 1/3753 -
Any other vaccine including inactivated polio vaccine
RCT 3 A Eureop1 RV1, Singapore RV1, USA and Canada RV1
RR 0.65 0.11 4.01 3/4877 2/2110 0%
Any other vaccine including inactivated polio vaccine
RCT 2 A Finland1 RV5, Europe RV5
RR 0.94 0.04 23.08 1/1228 0/524 -
Any other vaccine except oral polio vaccine
RCT 4 A, B, D Latin America and Finland RV1, Latin America1 RV1, East Asia
RR 0.94 0.44 2.04 22/39061 24/37602 32%
52
Schedule details
Type of study
Number of studies
WHO Mortality stratum
Country and vaccine
Type of estimate
Estimate Lower 95% CI
Upper 95% CI
n/N Vaccine
n/N Placebo
Hetero-geneity test (I2)
RV1, Japan RV1
Any other vaccine except oral polio vaccine
RCT 4 A, B, D Europe and the Americas RV5, Finland and USA RV5, USA1 RV5, South Korea RV5
RR 0.68 0.34 1.38 13/35340 19/34840 -
None allowed
RCT 1 A Finland2 RV1 - - - - 0/270 0/135 -
Blue colour=RV1; orange colour=RV5; purple colour=RV1/RV5. CI=confidence interval; RCT=randomised controlled trial; RR=risk ratio; OPV=oral polio vaccine; IPV=inactivated polio vaccine