Tableau training in bangalore
16
Presented By kellyTechnologies
-
Upload
kelly-technologies -
Category
Education
-
view
25 -
download
1
Transcript of Tableau training in bangalore

Presented BykellyTechnologies

Tableau Server
Share
Discover
Participate
http://www.kellytechno.com

Share | Discover | Participate
A library of visual results+ The place to publish+ Share findings with the
group+ No more isolated
desktops
Analytic templates+ Retrieve and re-purpose+ Centralize data models
Understanding data is not only for a few experts
http://www.kellytechno.com

Server Basics
Tableau Professional
publishes to and imports from
the server
Web Browser
interacts with server content
Tableau Server
http://www.kellytechno.com

Share | Discover | Participate
Discover what others are discovering
Just browsing…
“What has Teri been working on?”
http://www.kellytechno.com
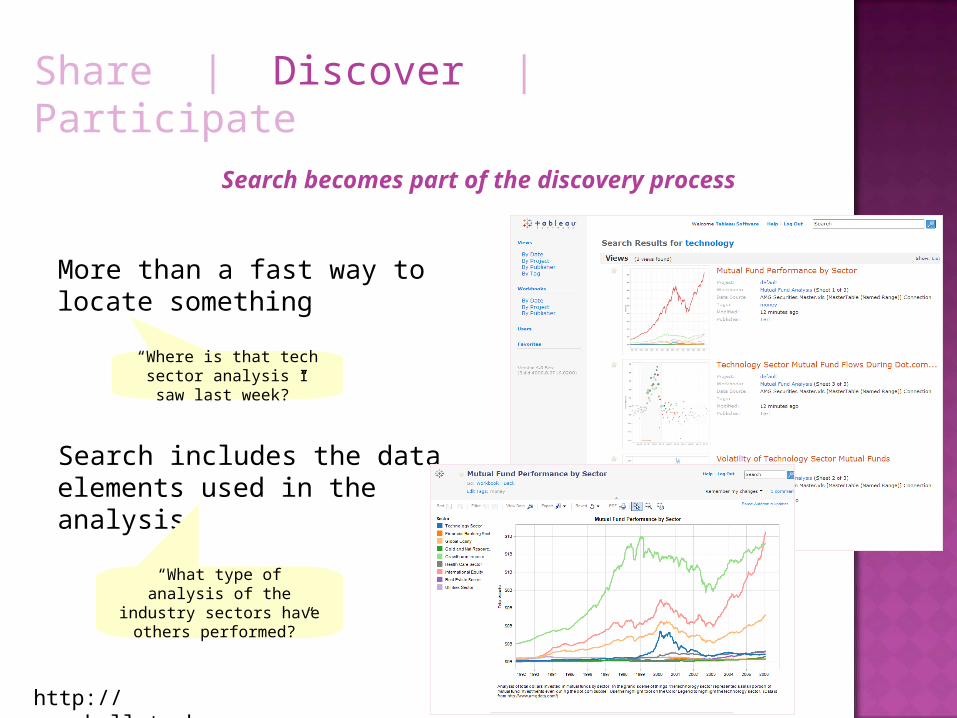
Share | Discover | Participate
Search becomes part of the discovery process
More than a fast way to locate something
Search includes the data elements used in the analysis
“Where is that tech sector analysis I saw
last week?”
“What type of analysis of the industry sectors have
others performed?”
http://www.kellytechno.com

Share | Discover | Participate
Unlock the data analyst inside everyone
Bring data to life+ Filtering, drilling,
sorting, paging, and inspecting data values
Explore with live data
http://www.kellytechno.com

Share | Discover | Participate
Diversity increases the quality of the wisdom
Discussion enhances understanding
The community evolves how content is organized by using tags
http://www.kellytechno.com

Tableau Server
Share
Discover
Participate
http://www.kellytechno.com
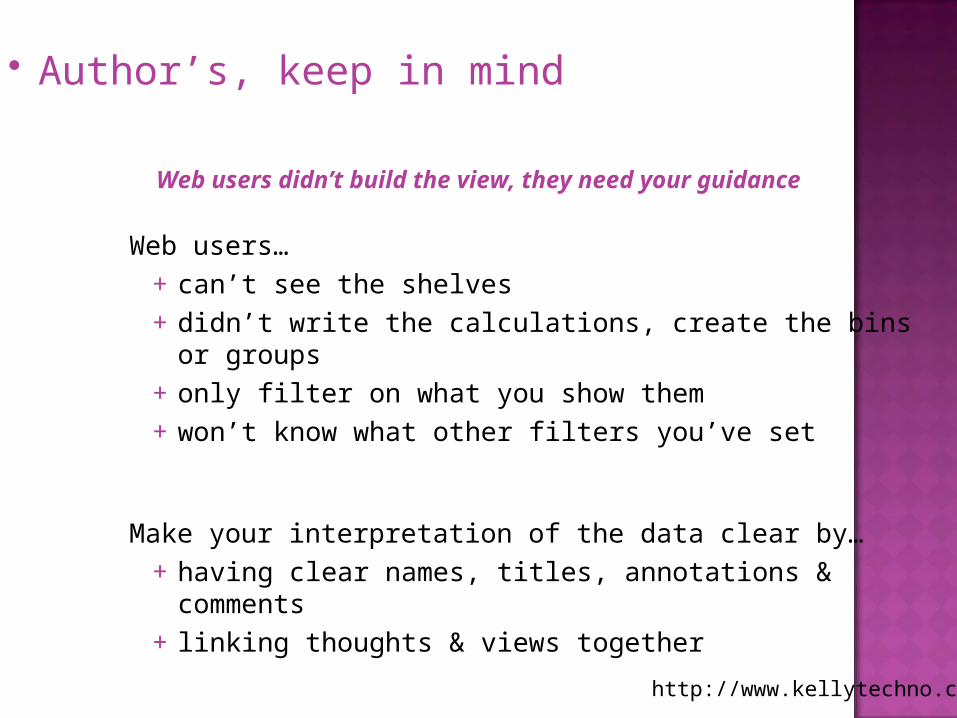
Author’s, keep in mind
Web users…+ can’t see the shelves+ didn’t write the calculations, create the bins or groups+ only filter on what you show them+ won’t know what other filters you’ve set
Make your interpretation of the data clear by…+ having clear names, titles, annotations & comments+ linking thoughts & views together
Web users didn’t build the view, they need your guidance
http://www.kellytechno.com

Authoring Checklist
Does the view have a clear title and caption?
Are the legends shown?
Does it have quick filters?
Are axes labeled with measures and units?
Is the formatting clean and simple?
Would an annotation help identify a key point?
Would a link to a related view provide context or more depth of analysis?
Have you overloaded a dashboard?
Does it look beautiful on a laptop?
Consider adding “director’s cut” text as a comment or annotation
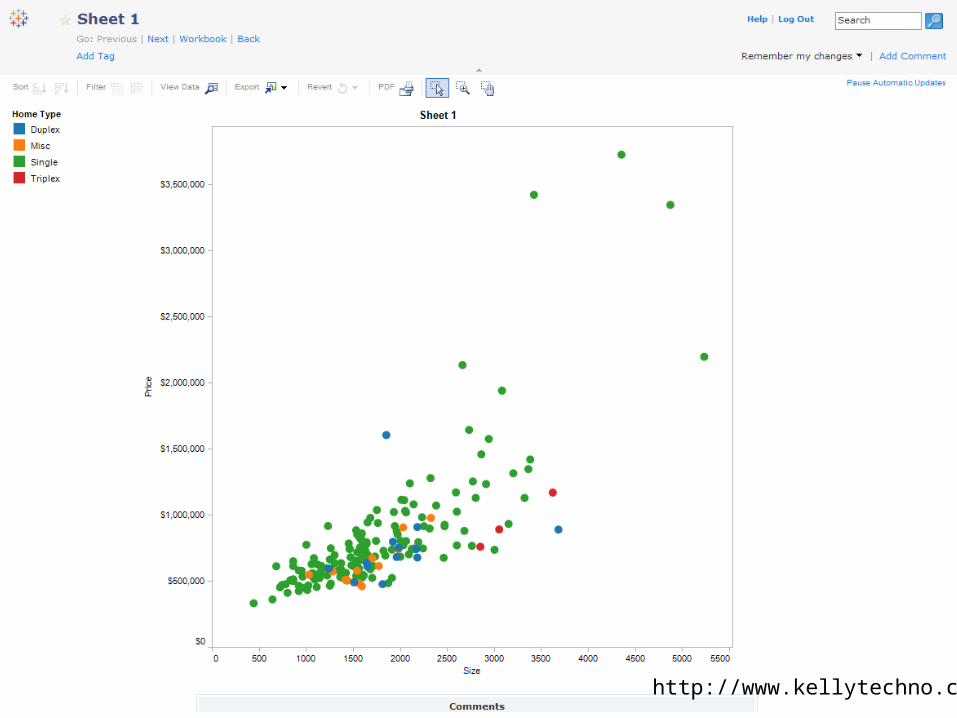
Sheet 1
http://www.kellytechno.com
http://www.kellytechno.com

http://www.kellytechno.com

http://www.kellytechno.com

http://www.kellytechno.com

Presented ByKellyTechnologies