Synthesis on Construction Unit Cost Development: · PDF file · 2017-01-04SYNTHESIS...
142
Technical Report Documentation Page 1. Report No. FHWA/TX-09/0-6023-1 2. Government Accession No. 3. Recipient's Catalog No. 4. Title and Subtitle SYNTHESIS ON CONSTRUCTION UNIT COST DEVELOPMENT: TECHNICAL REPORT 5. Report Date October 2008 Published: January 2009 6. Performing Organization Code 7. Author(s) Stuart Anderson, Ivan Damnjanovic, Ali Nejat, and Sushanth Ramesh 8. Performing Organization Report No. Report 0-6023-1 9. Performing Organization Name and Address Texas Transportation Institute The Texas A&M University System College Station, Texas 77843-3135 10. Work Unit No. (TRAIS) 11. Contract or Grant No. Project 0-6023 12. Sponsoring Agency Name and Address Texas Department of Transportation Research and Technology Implementation Office P.O. Box 5080 Austin, Texas 78763-5080 13. Type of Report and Period Covered Technical Report: August 2007 – August 2008 14. Sponsoring Agency Code 15. Supplementary Notes Project performed in cooperation with the Texas Department of Transportation and the Federal Highway Administration. Project Title: Synthesis on Construction Unit Cost Development URL: http://tti.tamu.edu/documents/0-6023-1.pdf 16. Abstract Availability of historical unit cost data is an important factor in developing accurate project cost estimates. State highway agencies (SHAs) collect data on historical bids and/or production rates, crew sizes and mixes, material costs, and equipment costs, including contractor overhead and profit. The goal of this synthesis is to identify how state highway agencies develop unit prices for construction and maintenance projects. The synthesis approach consists of a comprehensive online survey, covering every aspect of unit cost development, to identify the state of practice in state highway agencies and interviews with several representative SHAs to gain a better understanding of the practices followed for unit cost development. This study finds that even though SHAs collect and store historical cost data, they do not have a formal and documented process for adjusting unit costs for project characteristics and market conditions. 17. Key Words Accessing Unit Cost, Storing Unit Cost, Applying Unit Cost, Unit Cost Development Procedure, Project Cost Estimation 18. Distribution Statement No restrictions. This document is available to the public through NTIS: National Technical Information Service Springfield, Virginia 22161 http://www.ntis.gov 19. Security Classif.(of this report) Unclassified 20. Security Classif.(of this page) Unclassified 21. No. of Pages 142 22. Price Form DOT F 1700.7 (8-72) Reproduction of completed page authorized
Transcript of Synthesis on Construction Unit Cost Development: · PDF file · 2017-01-04SYNTHESIS...

Technical Report Documentation Page 1. Report No. FHWA/TX-09/0-6023-1
2. Government Accession No.
3. Recipient's Catalog No.
4. Title and Subtitle SYNTHESIS ON CONSTRUCTION UNIT COST DEVELOPMENT: TECHNICAL REPORT
5. Report Date October 2008 Published: January 2009 6. Performing Organization Code
7. Author(s) Stuart Anderson, Ivan Damnjanovic, Ali Nejat, and Sushanth Ramesh
8. Performing Organization Report No. Report 0-6023-1
9. Performing Organization Name and Address Texas Transportation Institute The Texas A&M University System College Station, Texas 77843-3135
10. Work Unit No. (TRAIS)
11. Contract or Grant No. Project 0-6023
12. Sponsoring Agency Name and Address Texas Department of Transportation Research and Technology Implementation Office P.O. Box 5080 Austin, Texas 78763-5080
13. Type of Report and Period Covered Technical Report: August 2007 – August 2008
14. Sponsoring Agency Code
15. Supplementary Notes
Project performed in cooperation with the Texas Department of Transportation and the Federal Highway Administration. Project Title: Synthesis on Construction Unit Cost Development URL: http://tti.tamu.edu/documents/0-6023-1.pdf 16. Abstract
Availability of historical unit cost data is an important factor in developing accurate project cost estimates. State highway agencies (SHAs) collect data on historical bids and/or production rates, crew sizes and mixes, material costs, and equipment costs, including contractor overhead and profit. The goal of this synthesis is to identify how state highway agencies develop unit prices for construction and maintenance projects. The synthesis approach consists of a comprehensive online survey, covering every aspect of unit cost development, to identify the state of practice in state highway agencies and interviews with several representative SHAs to gain a better understanding of the practices followed for unit cost development. This study finds that even though SHAs collect and store historical cost data, they do not have a formal and documented process for adjusting unit costs for project characteristics and market conditions. 17. Key Words
Accessing Unit Cost, Storing Unit Cost, Applying Unit Cost, Unit Cost Development Procedure, Project Cost Estimation
18. Distribution Statement No restrictions. This document is available to the public through NTIS: National Technical Information Service Springfield, Virginia 22161 http://www.ntis.gov
19. Security Classif.(of this report)
Unclassified 20. Security Classif.(of this page)
Unclassified 21. No. of Pages
142 22. Price
Form DOT F 1700.7 (8-72) Reproduction of completed page authorized


SYNTHESIS ON CONSTRUCTION UNIT COST DEVELOPMENT: TECHNICAL REPORT
by
Dr. Stuart Anderson
Program Manager, Construction Engineering and Management Program Texas Transportation Institute
Dr. Ivan Damnjanovic
Assistant Professor, Zachry Department of Civil Engineering Texas A&M University
Ali Nejat
Graduate Research Assistant, Zachry Department of Civil Engineering Texas A&M University
and
Sushanth Ramesh
Graduate Research Assistant, Zachry Department of Civil Engineering Texas A&M University
Report 0-6023-1 Project 0-6023
Project Title: Synthesis on Construction Unit Cost Development
Performed in cooperation with the Texas Department of Transportation
and the Federal Highway Administration
October 2008 Published: January 2009
TEXAS TRANSPORTATION INSTITUTE The Texas A&M University System College Station, Texas 77843-3135


v
DISCLAIMER
The contents of this report reflect the views of the authors, who are responsible for the facts and the accuracy of the data presented herein. The contents do not necessarily reflect the official vi ew or pol icies of the F ederal Highway Administration (FHWA) or the T exas Department of Transportation (TxDOT). This report does not constitute a standard, specification, or regulation. The United States Government and the State of Texas do not endorse products or manufacturers. Trades or manufactures’ names appear herein solely because they are considered essential to the object of the report. The researcher in charge of the project was Stuart Anderson.

vi
ACKNOWLEDGMENTS
The a uthors a cknowledge a nd a ppreciate t he he lp f rom P roject D irector, M r. A .R. (Rocky) H abibi, of t he T exas D epartment of Transportation ( TxDOT), A ustin D istrict. T he authors acknowledge t he s upport a nd s ponsorship of t he T exas D epartment of T ransportation and thank t he pe rsonnel f rom B ryan, D allas a nd F ort W orth D istricts who pa rticipated i n t he survey and interview process. The authors would like to thank everyone who participated in the online s urvey. Finally, t he a uthors w ould l ike t o t hank e xperts f rom Virginia Department of Transportation (VDOT), Utah Department of Transportation (UDOT), California Department of Transportation (CALTRANS), Minnesota Department of Transportation (MnDOT), New York State Department of Transportation (NYSDOT), Florida Department of Transportation (FDOT), and Washington Department of Transportation (WSDOT) for their valuable contributions.

vii
TABLE OF CONTENTS
LIST OF FIGURES ........................................................................................................................ x
LIST OF TABLES ....................................................................................................................... xiv
1. INTRODUCTION ...................................................................................................................... 1
1.1 BACKGROUND .............................................................................................................. 1
1.2 PROBLEM DESCRIPTION ............................................................................................ 2
1.3 OBJECTIVES .................................................................................................................. 2
2. LITERATURE REVIEW ........................................................................................................... 3
2.1 ESTIMATING GUIDELINES ......................................................................................... 4
2.2 INFORMATION SYSTEMS ........................................................................................... 6
3. RESEARCH APPROACH ....................................................................................................... 11
3.1 INTRODUCTION .......................................................................................................... 11
3.2 TEXAS DEPARTMENT OF TRANSPORTATION SURVEY ................................... 11
3.2.1 Outline..................................................................................................................... 11
3.2.2 Results ..................................................................................................................... 11
3.3 ONLINE SURVEY ........................................................................................................ 12
3.3.1 Survey Approach .................................................................................................... 12
3.3.2 Survey Structure...................................................................................................... 13
3.3.3 Survey Results ........................................................................................................ 19
3.4 ANALYSIS OF THE RESULTS ................................................................................... 30
3.4.1 Interviews – Selection Criteria ................................................................................ 30
3.4.2 State Agencies Interviewed ..................................................................................... 31
4. RESULTS FROM INTERVIEWS ........................................................................................... 33
4.1 VIRGINIA DEPARTMENT OF TRANSPORTATION ............................................... 33

viii
4.1.1 Construction Unit Cost Information ....................................................................... 33
4.1.2 Maintenance Unit Cost Information ....................................................................... 42
4.2 UTAH DEPARTMENT OF TRANSPORTATION ..................................................... 43
4.2.1 Construction Unit Cost Information ....................................................................... 43
4.2.2 Maintenance Unit Cost Information ....................................................................... 49
4.3 CALIFORNIA DEPARTMENT OF TRANSPORTATION ......................................... 50
4.3.1 Construction Unit Cost Information ....................................................................... 50
4.4 MINNESOTA DEPARTMENT OF TRANSPORTATION ......................................... 59
4.4.1 Construction Unit Cost Information ....................................................................... 59
4.5 NEW YORK STATE DEPARTMENT OF TRANSPORTATION .............................. 63
4.5.1 Construction Unit Cost Information ....................................................................... 63
4.5.2 Maintenance Cost Information ............................................................................... 69
4.6 FLORIDA DEPARTMENT OF TRANSPORTATION ................................................ 70
4.6.1 Construction Unit Cost Information ....................................................................... 70
4.6.2 Maintenance Unit Cost Information ....................................................................... 74
4.7 WASHINGTON STATE DEPARTMENT OF TRANSPORTATION ........................ 75
4.7.1 Construction Unit Cost Information ....................................................................... 75
5. TEXAS DEPARTMENT OF TRANSPORTATION ............................................................... 85
5.1 CONSTRUCTION UNIT COST INFORMATION ...................................................... 85
5.2 SIMILARITIES AND DIFFERENCES......................................................................... 91
5.2.1 General .................................................................................................................... 92
5.2.2 Acquiring and Accessing Unit Cost Information.................................................... 92
5.2.3 Storing Unit Cost Information ................................................................................ 93
5.2.4 Applying Unit Cost Information ............................................................................. 93

ix
6. CONCLUSION AND RECOMMENDATIONS ..................................................................... 95
6.1 SHORT TERM RECOMMENDATIONS ..................................................................... 95
6.2 LONG TERM RECOMMENDATIONS ....................................................................... 97
REFERENCES ............................................................................................................................. 99
BIBLIOGRAPHY ....................................................................................................................... 101
APPENDIX A ............................................................................................................................. 103
APPENDIX B ............................................................................................................................. 109
APPENDIX C ............................................................................................................................. 119
APPENDIX D ............................................................................................................................. 123

x
LIST OF FIGURES
Figure 1.NYSDOT Average Price Report. ..................................................................................... 8
Figure 2. ODOT Construction Management System. ..................................................................... 9
Figure 3. TxDOT Survey - Participating State Agencies. ............................................................ 12
Figure 4. Flowchart - General Section. ......................................................................................... 14
Figure 5. Flowchart - Acquiring Unit Cost Information. .............................................................. 15
Figure 6. Flowchart - Storing Unit Cost Information. .................................................................. 16
Figure 7. Flowchart - Accessing Unit Cost Information............................................................... 17
Figure 8. Flowchart - Applying Unit Cost Information. ............................................................... 18
Figure 9. Flowchart - Maintenance Unit Cost Information. ......................................................... 19
Figure 10. Online Survey - Participating State Agencies. ............................................................ 20
Figure 11. General Section - Estimating Technique (Bid-Based). ............................................... 20
Figure 12. General Section - Application of Bid-Based Estimating Technique. .......................... 21
Figure 13 General Section - Estimating Technique (Cost-Based). ............................................... 22
Figure 14. General Section - Application of Cost-Based Estimating Technique. ........................ 22
Figure 15. General Section - Documented Process/Procedure for Unit Cost Development. ....... 23
Figure 16. Acquiring Unit Cost - Extracting of Bid Details. ........................................................ 24
Figure 17. Acquiring Unit Cost - Types of Historical Bid Data. .................................................. 24
Figure 18. Storing Unit Cost - General Form of Storing Unit Costs. ........................................... 25
Figure 19. Applying Unit Cost - Calendar Duration for Unit Prices. ........................................... 26
Figure 20. Applying Unit Cost - Statistical Technique for Cost Estimating. ............................... 27
Figure 21. Applying Unit Cost - Unit Price Adjustment (Project Characteristics). ..................... 28
Figure 22. Applying Unit Cost - Unit Price Adjustment (Current Market Conditions). ............. 28
Figure 23. Applying Unit Cost - Unit Price Adjustment (Current Day Prices) ........................... 29

xi
Figure 24. Maintenance Unit Cost - Maintenance Database. ....................................................... 29
Figure 25. Maintenance Unit Cost – Documented Process/Procedure for Unit Cost Development. ................................................................................................................................ 30
Figure 26. VDOT Estimation Framework. ................................................................................... 34
Figure 27. VDOT Two-Year Historical Bid Price Listing. .......................................................... 39
Figure 28. VDOT Statewide Averages. ........................................................................................ 40
Figure 29. VDOT District Averages. ............................................................................................ 40
Figure 30. VDOT Production Rate Estimation. ............................................................................ 42
Figure 31. UDOT Estimation Framework. ................................................................................... 43
Figure 32. UDOT Concept Cost Estimate Form. .......................................................................... 44
Figure 33. UDOT Statewide Average Unit Low Bid Prices. ........................................................ 46
Figure 34. UDOT Red Flag Analysis – PDBS. ............................................................................ 48
Figure 35. Caltrans Estimation Framework. ................................................................................. 50
Figure 36 . Caltrans Comparative Bridge Costs (2007). ................................................................ 51
Figure 37. Caltrans Advance Planning Estimate Excel Spreadsheet. ........................................... 52
Figure 38. Caltrans District 8 Contract Cost Database. ................................................................ 54
Figure 39. Caltrans Search Results for Contract Cost Database. .................................................. 55
Figure 40. Caltrans Contract Item Cost Report. ........................................................................... 56
Figure 41. Caltrans Summary of Average/Weighted Average Price. ........................................... 57
Figure 42. Caltrans Trend Line Feature of Contract Cost Database. ............................................ 57
Figure 43. Caltrans Comparison of Low Bid versus Engineer's Estimate. ................................... 58
Figure 44. MnDOT Estimation Framework.................................................................................. 59
Figure 45. MnDOT Historical Price Database. ............................................................................. 61
Figure 46. MnDOT Historical Price Database. ............................................................................. 61
Figure 47. MnDOT Project Abstracts. .......................................................................................... 62

xii
Figure 48. NYSDOT Estimation Framework. .............................................................................. 63
Figure 49. NYSDOT Preliminary Cost Estimate Worksheet for New and Replacement Bridges.......................................................................................................................................... 64
Figure 50. Shoulder Break Area Diagram – NYSDOT Preliminary Cost Estimate Worksheet. . 65
Figure 51. NYSDOT Historical Unit Costs within Trns*port System. ........................................ 66
Figure 52. NYSDOT Weighted Average Item Price Report (WAIPR) - January 2007 to December 2007. ............................................................................................................................ 67
Figure 53. NYSDOT Regional and Statewide Average Award Prices (RSWAAPR) - January 2007 to December 2007. ............................................................................................................... 68
Figure 54. FDOT Estimation Framework. .................................................................................... 70
Figure 55. FDOT Generic Cost Per Mile Model - Rural Projects. ............................................... 71
Figure 56. FDOT Generic Cost per Mile Model - Urban Projects. .............................................. 71
Figure 57. FDOT Annual Statewide Averages. ............................................................................ 73
Figure 58. FDOT Annual Market Areas Averages. ...................................................................... 73
Figure 59. WSDOT Estimation Framework. ................................................................................ 75
Figure 60. WSDOT Unit Bid Analysis. ........................................................................................ 77
Figure 61. Unit Bid Analysis - Inquiry Results. ........................................................................... 78
Figure 62. WSDOT Bid Tabs Pro - Search By Pay Item. ............................................................. 79
Figure 63. WSDOT Bid Tabs Pro - Search Results (By Pay Item). ............................................. 80
Figure 64. WSDOT Bid Tabs Pro - Search by Job. ...................................................................... 81
Figure 65. WSDOT Bid Tabs Pro – Search Results (By Job). ..................................................... 82
Figure 66. TxDOT Estimation Framework. .................................................................................. 85
Figure 67. Interaction between DCIS, Estimator, and Excel Spreadsheet. ................................... 86
Figure 68. TxDOT Average Low Bid Unit Price. ........................................................................ 87
Figure 69. TxDOT Average Low Bid Unit Prices for Dallas. ...................................................... 87
Figure 70. TxDOT Item Search by Description - Site Manager Spreadsheet. ............................. 88

xiii
Figure 71. TxDOT Item Search by Number - Site Manager Spreadsheet. ................................... 89
Figure 72. TxDOT Item Search by Supplemental Description - Site Manager Spreadsheet. ...... 89
Figure 73. TxDOT Bid Tabulations. ............................................................................................. 90

xiv
LIST OF TABLES
Table 1. State Agencies with Formal Process for Adjusting Unit Prices. .................................... 27
Table 2. VDOT Estimation Software............................................................................................ 34
Table 3. VDOT Urban/Rural Sections - Planning Cost Estimate Excel. ...................................... 35
Table 4. VDOT Bridge Cost - Planning Cost Estimate Excel. ..................................................... 36
Table 5. VDOT ROW Cost Percentages - Planning Cost Estimate Excel. ................................... 36
Table 6. VDOT Source of Equipment, Labor, Material, and Production Rates. ......................... 38
Table 7. UDOT Contingency Percentages. ................................................................................... 49
Table 8. Caltrans Contingency Percentages. ................................................................................. 58
Table 9. MnDOT Source of Equipment, Labor, Material, and Production Rates. ....................... 60
Table 10. NYSDOT Contingency Percentage Ranges. ................................................................ 69

1
1. INTRODUCTION
1.1 BACKGROUND
Project c ost e stimates play a crucial r ole i n development of construction pr ojects. T he c ost estimates are continuously updated in each phase of the project development as new information becomes available. The Engineer’s Estimate is the final estimate prepared by the state agencies in the Plan, Specifications, and Estimate (PS&E) phase. This estimate is particularly important because the state a gency uses it to compare the estimated cost w ith contractor bi d prices a nd allocate funds for construction.
The t wo important inputs in developing accurate es timates are hi storical da ta and market conditions a s i dentified by Anderson e t a l. 20 07. Historical da ta are generally us ed in two different fo rms. The f irst form of hi storical da ta i s uni t c osts f rom r ecent pr ojects. T hese uni t costs r eflect bi d pricing for ite ms r elated to past pr ojects tha t a re r elevant to project be ing estimated. The s econd form of historical da ta is related to production rates and crew s izes, material pricing, construction equipment pricing, which are marked up with contractor overhead and profit. Both forms of historical data need to be adjusted to market conditions specific to the project. Based on t his information, t he es timator s elects unit c osts for e ach line ite m in the Engineer’s E stimate. This can be a challenge, as it r equires the e stimator to have s ufficient knowledge of hi storical c ost da ta, c urrent pr oject c onditions a nd c haracteristics, and how t o adjust these historical data for the current project estimate.
Estimators r ely on t wo ba sic t echniques to prepare the e stimates: H istorical Bid-Based Estimating and C ost-Based Estimating. Both t echniques r ely on hi storical da ta, a lthough t he type of historical data varies.
Historical B id-Based Estimating c reates c ost e stimates f rom hi storic bid prices. This i s a relatively simple, straightforward, and quick technique to use. Once the quantities are determined from t he pr oject pl ans, the estimator ma tches those qua ntities to appropriate hi storical uni t prices. The s tate a gencies g enerate hi storical uni t pr ices b y s ystematically compiling bi d data from pa st pr oject le ttings. An important de cision t o be m ade w hen us ing t his a pproach i s the number of bids from each project that should be included in the data. This number varies among state agencies with some using only the lowest bid from each project and others using the two or three lowest bids. Some agencies use all the bids from the project. The adjustment to historical unit prices rests upon the engineering judgment and experience of the estimator.
Cost-Based E stimating is a t ype of estimation ba sed on knowledge about t he c onstruction methods, supply systems, labor markets, and productivity specific to the area where the work is being p erformed. T his a pproach is more complex a nd t ime c onsuming than bid-based as the estimator must conceptualize the whole construction process in order to prepare the estimates.

2
State highway agencies utilize computer systems to assist them in developing estimates. This can range from a s imple E xcel s preadsheet t o sophisticated computer s ystems l ike T rns*port® System. The estimator should be familiar with t he available resources a nd have knowledge of construction process. All these elements are necessary for developing an accurate cost estimate.
1.2 PROBLEM DESCRIPTION
Cost e stimating oc curs r epeatedly t hroughout t he pr oject s tages i nvolved i n t he pr oject development pr ocess. The us e of H istorical B id-Based or C ost-Based e stimating te chnique depends on the project phase and the level of project scope information available. Historical cost data t hat s upport t he p reparation o f e stimation also vary based on t he estimating t echniques. Historical bi d pr ices are of ten us ed when pr eparing cost e stimates. A t t he P S&E pha se, bi d pricing i s t he m ost c ommon a pproach, a lthough s ome S tate H ighway Agenci es ( SHAs) use production rates, crew sizes, labor wage rates, material costs, and equipment costs to build a unit price for their Engineers’ Estimates. Historical bid prices are more frequently used for estimates prepared in the scoping and design phases. In the planning phase, estimators often use historical unit prices to develop average lane mile costs for planning estimates.
The effectiveness of both techniques is a function of the historical cost data available to support the tw o estimating t echniques. This s ynthesis t ries t o address the pr oblem of the l ack of systematic m ethodology t o a nalyze a nd de velop uni t c osts f or c onstruction a nd m aintenance projects. If such a systematic approach is not defined, estimators will spend considerable time searching d atabases f or uni t cos ts. Furthermore, having a s tandard approach t hat i ncludes keeping the hi storical u nit c osts c urrent w ill a id the e stimator in ma king mor e consistent a nd accurate estimates.
1.3 OBJECTIVES
The objective of this s ynthesis is to explore the current practices in determining the uni t costs based on hi storical bids and/or historical production rates, crew sizes, equipments and material costs. The processes and procedures SHAs utilize will be compared with TxDOT practices and procedures. The com parison will form a basis f rom w hich r ecommendations are provided t o TxDOT.

3
2. LITERATURE REVIEW
Project cost estimation plays an integral part in the development of any construction project. The estimation process begins as early as the planning phase with a preparation of planning-level, or conceptual, estimates. As m ore de tails of t he pr oject be come ava ilable, the es timates be come more de tailed. Conceptual e stimates become d esign-level es timates an d progress f urther t o become the Engineer’s Estimate. This estimate is used as a baseline estimate against which the bids submitted by the contractors are compared and awarded. Every estimate typically consists of the different types of work in the project, its associated quantity, and the cost. The purpose of the synthesis is to identify the process involved in developing the unit cost for each item of work.
The review of literature showed that there is no s ingle approach to developing construction unit costs. Typically S HAs have developed their own process for pr eparing t heir project es timates, tailor ma de to suit the ir r equirements. As a r esult, highway c onstruction pr ojects e mploy a number of estimating procedures.
A number of studies have investigated techniques used for cost estimation. The most common estimating te chnique reported is the hi storical bi d-based estimation. A ccording t o AASHTO’s Technical C ommittee on Cost Estimating ( TCCE) publ ication ( 2007), historical bi d-based estimation is a method of developing estimates using data from the unit cost database. The unit cost database is a repository of the costs associated with all standard items of work taken from the previously awarded contracts or bids. This database stores information in a suitable format to aid the e stimator in preparing c ost e stimates f or hi ghway pr ojects. The uni t pr ice f rom th is database is adjusted to reflect the specific project/location (geographic) conditions.
Cost-Based Estimating is an estimation technique also used b y SHAs bu t with l ess f requency. This method is used i n de veloping p roject estimates us ing a pr oduction r ate a nd t he c ost associated w ith l abor, m aterials, a nd construction e quipment. B y e stimating t he cost of e ach component required to complete the work together with a contractor’s profit and overhead, SHAs develop a n e stimated un it pr ice for t he w ork. T his m ethod a lso t akes i nto a ccount t he uni que character of the projects, geographical location, market factors, and volatility of material prices. Cost-based estimation is mainly used in preparing the Engineer’s Estimate, as this method can provide a more accurate and defendable cost to support the decision for contract award/rejection.
In addition to bid-based estimation and cost-based estimation, SHAs use Parametric Estimation early in project development. Parametric estimation, as defined in Washington State Department of T ransportation’s ( WSDOT) C ost E stimation Manual, is a me thod to estimate the c ost of a project or a pa rt of a project based on one or more project pa rameters. Historical bid da ta are used to define t he cos t of a t ypical t ransportation facility s egment, such as cos t pe r l ane m ile, cost pe r i nterchange, or c ost pe r s quare f oot. SHAs can al so use h istorical p ercentages t o estimate project segments based on major project parameters. These methods are of ten used in early estimating, such as planning and scoping.

4
2.1 ESTIMATING GUIDELINES
Agencies maintaining guidelines on cost estimating have outlined the factors that estimators need to c onsider w hen de termining t he uni t pr ices f or va rious l ine i tems. T he c ommon f actors identified i n t he e stimation m anuals of Utah D epartment of T ransportation ( UDOT), V irginia Department of T ransportation ( VDOT) a nd Pennsylvania D epartment of T ransportation (PennDOT) are:
• Project location,
• Project size,
• Quantity of materials,
• Time of year,
• Current market conditions,
• Constructability,
• Price-volatile materials,
• Sequence of construction,
• Contractor's familiarity of process,
• Risks to contractors, and
• Inflation.
Even though availability of guidelines and manuals on cost estimating ensure better estimates, in order to increase the accuracy of the estimates, as suggested by De la Garza (1991), the estimator must have a s trong know ledge of c osts a s w ell a s i mplicit de sign know ledge. T he de sign knowledge insures that all components of work are included in the estimates. Without knowledge of t he c onstruction m ethodologies, t he estimator m ay not r ealize t hat e ach c omponent ha s i ts own associated cost that may have a significant impact on the final estimate.
Estimating guidelines available for WSDOT, UDOT, and PennDOT outline the steps involved in preparing estimates in each of the project development phases. The four main phases of project development are:
• Planning – concept definition to support a 20-year long range plan; • Scoping – basic scope definition to place a project into a priority program (10 years or
less from the project letting date); • Design – development of pl ans and s pecifications t o s upport a pr oject i n t he S tate
Transportation Improvement Program (4 years or less from the letting date); and • PS&E – final pl ans a nd s pecifications t o s upport a n E ngineer’s E stimate f or l etting a
project for construction.

5
Planning
According to the Cost Estimating Manual (WSDOT), the planning level estimate is used during the P roject D efinition and Project Initiation and A lignment phase to determine funds f or l ong range planning and to prioritize the need for highway system plan. The planning level estimates are p repared using ei ther pa rametric estimating where t he i nput f rom a per-mile c ost f or the roadway i s combined w ith a pe r-square foot s tructure cost o r b y analogous project e stimating (Cost Estimating Guidelines, PennDOT, 2007). Most agencies use simple Excel® spreadsheets for preparing the planning level estimates. Some agencies have developed their own conceptual cost e stimating tool s. Examples of c onceptual c ost e stimating t ools i nclude t he P lanning C ost Estimate s preadsheet o f V DOT, C omparative B ridge C osts of C alifornia D epartment o f Transportation (Caltrans), and the Concept Cost Estimate Form of UDOT.
Scoping
A scoping level estimate is used during the post planning phase to set the baseline cost for the project a nd t o pr ogram the pr oject. T his pha se uses the bid-based estimation and parametric estimation methods of e stimating. Here es timators de termine a pproximate qua ntities f or ite ms such as asphalt, concrete pavements, structures, and roadway excavations. While most agencies update t heir planning l evel spreadsheets with more de tails for p reparing the s coping le vel estimates, some a gencies use sophisticated systems f or pr eparing th e s ame e stimate. VDOT’s Project C ost E stimating System (PCES) is a n e xample of a s ophisticated system us ed b y a n agency to prepare scoping level estimates.
Design
Design level estimates help in development of plans and specifications to support a project in the State Transportation Improvement Program (STIP). The project requirements typically become clearer at thi s s tage. This solidifies many i tems i n t he s cope s uch a s R ight of W ay ( ROW), permit c onditions, quantities of ma jor ite ms, and out side s takeholders. H istorical bi d-based estimating and hi storical pe rcentage estimation t echniques a re used in d eveloping d esign l evel estimates. Some agencies also use cost-based estimating to estimate major items of work, that is, items ha ving hi gh c ost impacts (80-20 R ule). At t his s tage m any agencies us e s ophisticated computer software like the Proposal and Estimates System (PES), Cost Estimation System (CES) or the Estimator, all belonging to the Trns*port system developed by AASHTO [InfoTech].
Plans, Specifications and Estimate (PS&E)
At thi s phase the f inal Engineer’s Estimate is prepared for advertising the project, committing construction f unds, and eva luating contractors’ bids. All the ite ms of work required for t he project, their quantities, and unit prices are available at this stage. Historical bid-based estimating and c ost-based e stimating a re t he t wo m ethods us ed i n pr eparing t he E ngineer’s E stimate.

6
Commercial s oftware li ke E stimator a nd C ES of Trns*port system are commonly us ed i n preparing e stimates at thi s le vel. Some a gencies us e the ir ow n in-house de veloped computer system, l ike t he P roject D evelopment B usiness S ystem (PDBS) of U DOT, and E BASE of WSDOT to prepare the final estimates.
2.2 INFORMATION SYSTEMS
The development of estimating software and its proliferation into the transportation industry has enabled estimators t o make f aster and more accurate es timates. Computer s oftware al lows t he estimators to manage large volumes of project information. Estimator, a module of the Trns*port system, is the commonly used estimating software. According to Schexnayder et al. (2003), 22 state age ncies us e t he Estimator m odule. CES is a nother m odule of T rns*port us ed b y s tate agencies. Some a gencies u se B id Tabs P ro® developed b y Oman S ystems t o a id i n estimate preparation.
Historical bid prices are necessary to prepare historical es timates. As such they are s tored in a database. The da tabase structure can be as simple or complex as the es timating ne eds di ctate (Practical Guide to Estimating, AASHTO’s Technical Committee on Estimating, 2007). Historic bid prices database can be created using the Bid Analysis Management System (BAMS), which is t he Decision Support S ystem (DSS) of Trns*port s ystem. This hi storical da tabase holds the construction contract information. When establishing a database, all aspects of a project that may become n ecessary during estimating s hould be saved. T he f ollowing l ist, as ide ntified in the TCCE report (2007), contains some of the important items for consideration when establishing a database.
• Bid Item Number,
• Item Description,
• Item Quantity,
• Unit of Work,
• Letting Date,
• Low Bidder Amount,
• Second Bidder Amount,
• Third Bidder Amount,
• Average Bid,
• Estimated Unit Price, and
• Project Number.

7
An important factor tha t is considered w hen hi storical uni t pr ices a re s tored i s t he num ber of bids. Schexnayder et al . (2003) re port the r esults f or num ber o f bi ds us ed i n e stablishing t he average prices.
• Low bid only – 20 DOTs
• Low and second bid – 1 DOT
• Three lowest bids – 15 DOTs
• All bids (but may exclude single bids that are very high or low) – 11 DOTs
• All bids except high and low – 2 DOTs
• Bid analysis to determine a reasonable bid amount for each line item – 1 DOT
Further, their study identified that using three low bids for each item produced the best results, while using all bids produced the worst.
State agencies make these historical averages available for their estimators to use. This can be in the form of a simple Excel spreadsheet containing all the historical bid details to a sophisticated computer s ystem. Figure 1 s hows sample historical bi d data ma intained by N ew Y ork State Department of Transportation (NYSDOT) on its website as a simple PDF file.

8
Figure 1.NYSDOT Average Price Report.
On the other hand, Caltrans and Ohio Department of Transportation (ODOT) use sophisticated computer systems tha t allow the e stimators to s earch based on the d istricts, maximum a nd minimum qua ntity, and maximum a nd minimum a mount. Figure 2 s hows t he C onstruction Management System (CMS) developed by ODOT for accessing historical bid information.

9
Figure 2. ODOT Construction Management System.
The m ain f ocus of t his s ynthesis i s t o e xplore t he va rious aspects of c onstruction c ost development. T his i ncludes de tails on e stimating t echniques us ed, us e of hi storical da ta f or arriving at a unit price, and the information systems used for developing construction unit cost information. Since estimating practices differs among the agencies, it necessary to investigate as many practices to be able to make sound recommendations.


11
3. RESEARCH APPROACH
3.1 INTRODUCTION
The mos t impor tant ta sk in the s ynthesis is to identify th e s tate of p ractice w ithin SHAs for developing unit c osts f or c onstruction and m aintenance pr ojects. Information on t he pr actices followed b y ot her S HAs w ill be us ed a s t he basis f or t he r ecommendation t o T xDOT on developing unit costs for construction project estimation. In order to identify the good practices, the researchers conducted two surveys. The first was a single questionnaire survey conducted by TxDOT, and the second was a comprehensive web-based survey conducted by the research team. In t his chapter, t he first s ection discusses the TxDOT s urvey and i ts r esults, f ollowed b y a discussion of the approach taken for the onl ine survey and its results. The last section outlines the selection criteria used in identifying SHAs for further interviews.
3.2 TEXAS DEPARTMENT OF TRANSPORTATION SURVEY
3.2.1 Outline
TxDOT’s Construction Division conducted this preliminary survey on unit pr ice development. As pa rt of t he s urvey, the t eam s ent emails to the t ransportation agencies of all f ifty states to identify the process behind unit price development for estimating projects and possibly used for change order analysis. The survey question read as follows:
“Do you have a formal process that uses a systematic tool for developing unit prices that categorizes for issues such as complexity, total quantities, difficulty, and type of project? Please point us to your system on the web or transmit electronically or by mail.”
3.2.2 Results Thirty-seven state a gencies r eplied. Though non e of t he a gencies ha d any f ormal pr ocess f or developing uni t pr ices, 14 s tate a gencies us ed s ystematic t ools f or d eveloping uni t pr ices f or project estimation. Figure 3 shows the states which responded to the survey and the states which use a systematic tool for unit price development. The following list of states use a systematic tool or have a systematic approach to unit price development.
• California • Colorado • Florida • Illinois • New Jersey • New York • Minnesota

12
• Massachusetts • Ohio • Oregon • Oklahoma • Utah • Virginia • Washington
Refer to Appendix A for the complete list of state agencies and their replies.
Figure 3. TxDOT Survey - Participating State Agencies.
The r eplies r eceived for t he T xDOT s urvey s howed that t he s tate a gencies us ing a s ystematic tool to develop unit prices were referring to their estimating technique and the computer system used to prepare their final Engineer’s Estimate. No state agencies that replied to the survey had a formal process to adjust unit prices for project type and complexity. The impact on uni t prices due to project type and complexity was determined based on t he knowledge and experience of the estimator.
3.3 ONLINE SURVEY
3.3.1 Survey Approach
The research team decided to carry out an online survey to determine the state of practice within SHAs regarding the development o f uni t pr ices for construction and maintenance. This survey

13
identified SHAs conducting considerable work in unit price development. The online survey was conducted using a web-based survey tool called Zoomerang® and request for participation was sent to the O ffices of C onstruction a nd D esign in a ll t he s tate a gencies. In t otal 104 s urvey requests were sent as part of the online survey.
3.3.2 Survey Structure
The research team formulated a questionnaire to identify good practices specifically on unit cost development. The survey questionnaire was broadly divided into two sections:
1. Section I - Construction Unit Cost, addressing the unit cost information for construction projects.
2. Section II - Maintenance Unit Cost, addressing t he uni t c ost information f or maintenance projects.
Section I was di vided f urther i nto f ollowing f ive s ub-sections i n or der t o c over a ll a spects of developing construction unit cost development.
• General Section - Focuses on i dentifying w hether t he s tate a gency h as a s tructured construction unit cost database and unit cost development procedure in place.
• Acquiring Unit Cost Information - Identifies the use of any system that extracts unit cost information from the past contract details and stores them in an historical cost database.
• Storing Unit Cost Information - Focuses on ho w the uni t cost details a re s tored in the database.
• Accessing Unit Cost Information - Identifies the presence of any mechanism to access historic unit cost information.
• Applying Unit Cost Information - Focuses on the use of the unit cost information in the estimation process.
Appendix B contains the complete questionnaire.
3.3.2.1 General Section
This section identifies the primary estimation technique used by a state agency when estimating a construction project and the tools used for estimation. Respondents chose between the traditional bid-based estimation and the cos t-based estimation methods. O ne of r equirements of this synthesis was to identify the development of uni t pr ices in di fferent phases of the project. For this purpose, the agencies were asked to identify the estimation technique along with the tools used in various project phases. The following are the four phases identified:

14
• Planning – concept definition to support a 20-year long range plan; • Scoping – basic scope definition to place a project into a priority program (10 years or
less from the project letting date); • Design – development of pl ans and s pecifications t o s upport a pr oject i n t he S tate
Transportation Improvement Program (4 years or less from the letting date); and • PS&E – final pl ans a nd s pecifications t o s upport a n E ngineers’ E stimate f or l etting a
project for construction.
Agencies listing cost-based estimation as the ir pr imary estimation technique w ere further required to identify different parameters, like the actual production rates and crew sizes, current material costs, and actual equipment rates that they tracked periodically. The survey also asked agencies to provide the names of the computer based system (Commercial or In-house) used for estimation i n a ll f our p hases of p roject de velopment. T his s ection a lso included que stions t o identify the s tate agencies having a w ell-documented process or procedure for developing uni t costs for construction cost estimating and using innovative techniques for developing unit costs for construction cost estimating. Figure 4 presents the flow of questions in the General section of the survey.
Respondent’s Information
Historical Bid Based Est. – Primary Est.
Technique?
Select Project Phases
Planning
Scoping
Design
PS&E
Cost Based Est. – Primary Est. Technique?
Select Project Phases
Select Items tracked
periodically
Actual Production Rates & Crew Size
Current Material Costs
Equipments Rates
Planning
Scoping
Design
PS&E
YES
NO
YES
NO
Using Computer System for preparing
estimates?
Names of Computer System
Planning
Scoping
Design
PS&E
Documented process/procedure for developing unit
costs?
Web address/copy of document
Any Innovative technique for estimation?
Go to next section
YEs
NO
YES
NO
NO
Techniques?YES
A
A
Figure 4. Flowchart - General Section.

15
3.3.2.2 Acquiring Unit Cost Information
The acquiring unit cost section of the survey captured the system (Commercial or In-house) used by the state agencies to extract unit cost information from the submitted bids and store them in a database. The section also captured the type of historical bid data acquired from the submitted bids to be stored in the database. Figure 5 shows the flow of questions for this section.
How is cost data for unit cost
database acquired from bid details?
Go to next section
Commercial Software
In-House Software
Both
Other
Which types of historical bid data are acquired from bid
details?
Low bid
Low & second bid
Three lowest bids
All excluding single higher or lower
All except high and low bid
All bids
Figure 5. Flowchart - Acquiring Unit Cost Information.
3.3.2.3 Storing Unit Cost Information
The storing unit cost information section focused on how the unit cost details are stored in the database. This involves identifying the type of system (Commercial or In-house, internet or intranet, or Spreadsheet) used to store the historical unit costs and the duration for which these historical unit costs remain in the database. This section also identified whether the unit costs were available for the entire state, districts/regions, counties or market areas and the form in

16
which these unit cost details were stored, either as standard construction line items or based on different work categories or project types. Figure 6 shows the flow of questions for this section.
Where is historical unit costs
maintained?
Are historical unit cost available
based on?
State Wide
District/Region
Market Areas
Counties
Go to next section
Commercial Software
In-House Software
In-House Spreadsheet
Other
What calendar duration is used for storing historical
unit cost?
One Month
Twelve Months
Three Years
Five Years & more
Others
How are historical unit cost information
stored?
Standard Line Items
Different Work Categories
Project Types
Figure 6. Flowchart - Storing Unit Cost Information.

17
3.3.2.4 Accessing Unit Cost Information
This section of the survey captured the ways in which historical unit costs can be accessed within the state agency. This includes any system (Commercial or In-House) used by the state agency to sort and summarize historical unit cost data based on the input parameters like standard line item number, quantities, and time period. Figure 7 presents the flow of questions for this section of the survey.
How can the historical unit costs be accessed over
the agency?
Does agency have system to sort and
summarize historical unit cost?
What type of system?
Commercial
In-HouseYES
Go to next section
Internet
Intranet
Both
None
NO
What is the name?
What is the name?
Can it be accessed over the internet?What is the URL? YES
NO
Figure 7. Flowchart - Accessing Unit Cost Information.
3.3.2.5 Applying Unit Cost Information
The final section of the Construction Unit Cost section focused on application of unit cost information in the estimation process. This section identified the calendar duration over which the historical unit costs are averaged, the type of statistical technique used to determine the unit prices, and the items of work (major or minor or both) to which these techniques are applied. Since TxDOT uses moving average when determining the unit price for an item, this section also identified the state agencies using moving averages as part of their estimation process, the type of moving average used (Simple or Weighted), and the duration considered. The final three

18
questions of this section captured the state agencies having a documented process or method for adjusting unit prices for project characteristics, current market conditions, and current day prices.
What calendar duration for
averaging is used?
Major items
Minor items
Both
One Month
Twelve Months
Three Years
Five Years & More
What statistical techniques are
used?
Simple Avg.
Weighted Avg.
Median
Mode
Other
Scatter Plot
Other
What items of work are these
techniques most often applied to?
Does your agency use moving averages?
Go to next sectionWhat time period is considered for calculating the
moving average?
What type of moving average is
considered?
Weighted
Simple
Yes
B
No
B
Does the agency has a formal process to adjust
unit prices for size, location and complexity?
Yes/No
Does the agency has a formal process to adjust
unit prices for market conditions?
Does the agency has a formal process to adjust
unit prices for current day prices?
Yes/No
Yes/No
Figure 8. Flowchart - Applying Unit Cost Information.
19
3.3.2.6 Maintenance Unit Cost Information
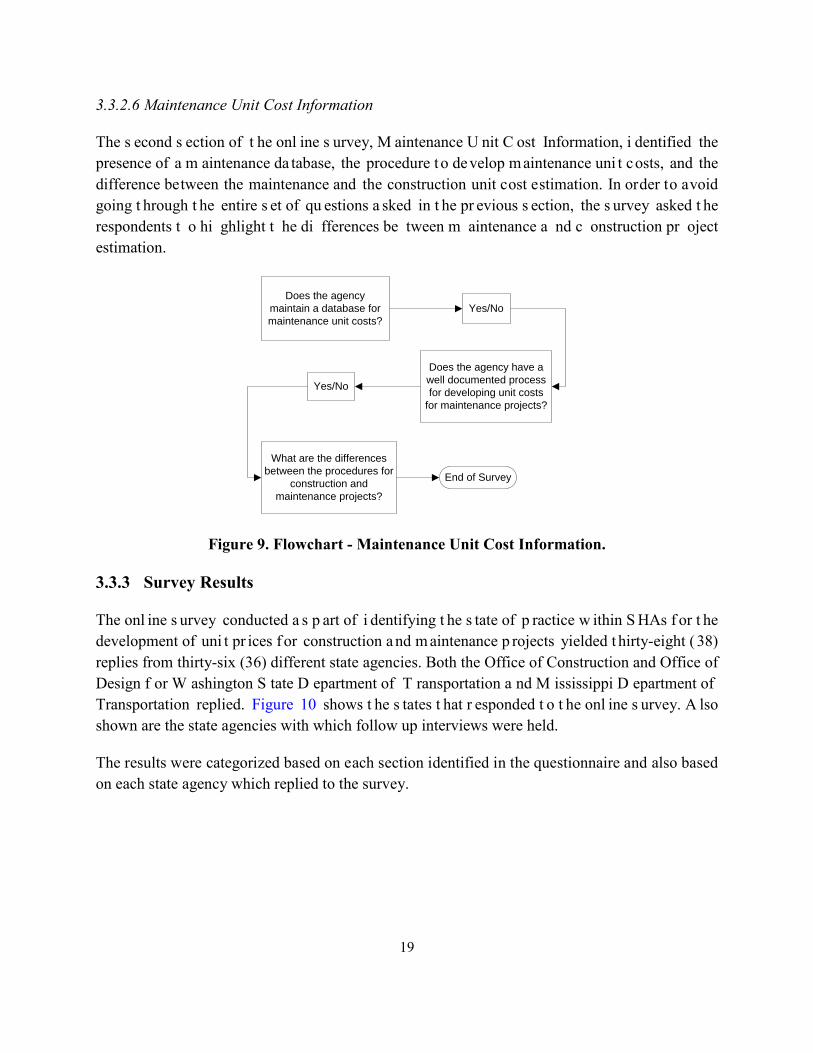
The s econd s ection of t he onl ine s urvey, M aintenance U nit C ost Information, i dentified the presence of a m aintenance da tabase, the procedure t o develop maintenance uni t costs, and the difference between the maintenance and the construction unit cost estimation. In order to avoid going t hrough t he entire s et of qu estions a sked in t he pr evious s ection, the s urvey asked t he respondents t o hi ghlight t he di fferences be tween m aintenance a nd c onstruction pr oject estimation.
Does the agency maintain a database for maintenance unit costs?
Yes/No
Does the agency have a well documented process for developing unit costs
for maintenance projects?
What are the differences between the procedures for
construction and maintenance projects?
Yes/No
End of Survey
Figure 9. Flowchart - Maintenance Unit Cost Information.
3.3.3 Survey Results
The onl ine s urvey conducted a s p art of i dentifying t he s tate of p ractice w ithin S HAs f or t he development of uni t pr ices f or construction a nd m aintenance p rojects yielded t hirty-eight ( 38) replies from thirty-six (36) different state agencies. Both the Office of Construction and Office of Design f or W ashington S tate D epartment of T ransportation a nd M ississippi D epartment of Transportation replied. Figure 10 shows t he s tates t hat r esponded t o t he onl ine s urvey. A lso shown are the state agencies with which follow up interviews were held.
The results were categorized based on each section identified in the questionnaire and also based on each state agency which replied to the survey.

20
Figure 10. Online Survey - Participating State Agencies.
3.3.3.1 General Section
The r esponses r eceived for t he general s ection, which identifies t he estimation t echniques and tools us ed b y t he s tate agencies for d eveloping uni t c osts f or c onstruction pr ojects gave t he following results.
• The majority of state agencies (32) that replied to the survey use the historical bid-based estimation as their primary estimation technique (Figure 11).
Yes84%
No16%
1. Is Historical Bid-Based Estimating your agency’s primary estimating technique?
Figure 11. General Section - Estimating Technique (Bid-Based).

21
• The agencies using historical bid-based estimation as their primary estimation technique use it to estimate projects in their Design and PS&E phases. Some agencies use the bid-based e stimation a pproach e ven i n t he P lanning a nd S coping pha se of p roject development.
Planning 15%
Scoping 19%
Design 32%
PS&E34%
2. If Historical Bid-Based Estimating is used, in which project phases i s it most o ften applied? [Select a ll that apply]
Figure 12. General Section - Application of Bid-Based Estimating Technique.
• When it comes to the use of cost-based estimation technique, only 10 state agencies listed
cost-based estimation as their primary estimating technique, as shown in Figure 13. Some states appl y this t echnique in the PS&E phase of project development, and some s tates use it in the Design as well as Scoping phases. No states reported using it in the Planning phase, as shown in Figure 14.

22
Yes26%
No74%
3. Is Cost Based Estimating your agency’s primary estimating technique?
Figure 13 General Section - Estimating Technique (Cost-Based).
Planning 0%
Scoping 7%
Design21%
PS&E72%
4. If Cost Based Estimating is used, in which project phases i s i t most o ften applied ? [Select all that apply]
Figure 14. General Section - Application of Cost-Based Estimating Technique. • On the question of having a well documented process or procedure for developing uni t
costs for construction cost estimating, more than half of the agencies replied negatively, as shown in Figure 15. Some agencies which had answered ‘Yes’ for this question, when interviewed, replied that they did not have any formal documentation on the development of unit costs.

23
Yes47%
No53%
7. Does your agency have a well documented process or procedure for developing unit costs for construction cost estimating (process/procedure covers acquiring, storing, accessing and applying unit costs)?
Figure 15. General Section - Documented Process/Procedure for Unit Cost Development.
3.3.3.2 Acquiring Unit Cost Information
The r esponses t o t he s ection on a cquiring uni t c ost i nformation s howed t hat most of the s tate agencies use commercial software to acquire data from the bid tabulations, as shown in Figure 16. Some s tate a gencies l ike C alifornia D epartment of T ransportation (Caltrans), Utah Department of Transportation (UDOT) and Texas Department of Transportation (TxDOT) have their own systems to acquire and store bid information.

24
16
910
3
Commercial Software (e.g., BAMS/DSS)
In-House Software Both Other
9. How is cost data for the unit cost database acquired from bid details?
Figure 16. Acquiring Unit Cost - Extracting of Bid Details.
Twenty of the thirty-eight state agencies which responded to the survey considered using all the submitted bids for storing in the database. This enabled the agency to assess the price range for various items of work in the submitted bids.
7
0
10
1 0
20
Low bid only Low and second bid
Three lowest bids
All b ids excluding single b id
that may be higher or
lower
All b ids except high and low bid
All b ids
11. Which types o f historical bid data are acquired f rom bid details in your agency?
Figure 17. Acquiring Unit Cost - Types of Historical Bid Data.

25
3.3.3.3 Storing Unit Cost Information
The survey responses for the Storing Unit Cost section showed that 26 s tate agencies of the 38 that r eplied used commercial c omputer s ystem like B AMS/DSS to store the uni t c ost information. The majority of the state agencies had more than five years of historical data stored in the da tabase. These hi storical da ta w ere available m ostly f or t he ent ire s tate and districts/regions, with a few s tate agencies l ike Caltrans, Florida Department of Transportation (FDOT), and Colorado Department of Transportation (CDOT) storing it based on m arket areas. Standard construction line item was the most popular form of storing these historical unit costs (Figure 18).
Standard Construction
Line Items52%
Different work categories
21%
Project types27%
15. How does your agency store historical unit cost information (Select all that apply)?
Figure 18. Storing Unit Cost - General Form of Storing Unit Costs.
3.3.3.4 Accessing Unit Cost Information
The responses to the Accessing Unit Cost section showed that state agencies maintain historical unit c osts on t he i nternet ( SHAs’ website) as w ell as on t heir i ntranet. In or der t o access t he historical uni t c osts, 28 state a gencies ha ve s ystems capa ble o f s orting and summarizing t he historical unit costs based on l ine i tem number, quantity range, t ime period, source of funding, etc.

26
3.3.3.5 Applying Unit Cost Information
Based on the response received from the state agencies, the researchers observed the following results for the Applying Unit Cost section.
State a gencies p refer t o consider m ore t han 12 months of hi storical da ta t o e stablish t he uni t prices for cost estimating as shown in Figure 19 below.
3
7
13
18
1 month - 3 months 4 months - 6 months 7 months - 12 months Greater than 12 months
22. Over what calendar duration are historical bid data most often considered to establish unit prices for cost estimating? [Select dominant choices]
Figure 19. Applying Unit Cost - Calendar Duration for Unit Prices.
The statistical technique most commonly used in determining the unit prices for cost estimating is t he w eighted average f ollowed b y e qual num ber of a gencies us ing s imple a verages a nd regression analysis for determining the unit prices. Weighted average is the preferred statistical technique s ince i t t akes i nto c onsideration t he effects of qua ntities on unit pr ices. Agencies applied these techniques to both major and minor items of work.

27
13
26
52
13
4
Simple Average
Weighted Average
Median Mode Scatter plots with best fit
Other
23.What statistical techniques are used to determine the unit prices for cost estimating? [Select all that apply]
Figure 20. Applying Unit Cost - Statistical Technique for Cost Estimating.
A fewer number of agencies have any formal process or method to adjust unit prices for project characteristics ( e.g., complexity, l ocation, s ize), c urrent m arket c onditions ( e.g., bidding environment) or current day prices (e.g., inflation) as shown in Figure 21, Figure 22, and Figure 23. Table 1 lists the agencies that have a formal process or method for adjusting unit prices.
Table 1. State Agencies with Formal Process for Adjusting Unit Prices.
State Agencies
Formal Process/Methods (Documented) for adusting unit prices based on
Project Characteristics
(Complexity, Size)
Current Market Condition
Current Day Prices
California X X XColorado X X XHawaii X
Minnesota X XNew Hampshire X
Oregon X X XUtah X X X
Wisconsin X

28
Yes18%
No82%
28.Does your agency have a formal process/method (documented) to adjust historical unit prices for project size, project location and project complexity when preparing a cost estimate?
Figure 21. Applying Unit Cost - Unit Price Adjustment (Project Characteristics).
Yes11%
No89%
29.Does your agency have a formal process/method (documented) for adjusting the unit prices to reflect the current market condition (e.g., bidding environment)?
Figure 22. Applying Unit Cost - Unit Price Adjustment (Current Market Conditions).

29
Yes16%
No84%
30.Does your agency have a formal process/method (documented) for adjusting historical unit prices to reflect the current day prices (i.e., impact of inflation)?
Figure 23. Applying Unit Cost - Unit Price Adjustment (Current Day Prices)
3.3.3.6 Maintenance Unit Cost Information
The results for the maintenance unit cost information section showed that 25 state agencies that replied to the survey had a database for maintenance unit costs (Figure 24). 21 agencies have no procedure or process for developing unit prices for maintenance projects, as shown in Figure 25.
Yes66%
No34%
31.Does your agency maintain a database for maintenance unit costs?
Figure 24. Maintenance Unit Cost - Maintenance Database.

30
Yes45%
No55%
32.Does your agency have a well documented process or procedure for developing historical unit costs for maintenance projects (process/procedure covers acquiring, storing, accessing and applying unit costs)?
Figure 25. Maintenance Unit Cost – Documented Process/Procedure
for Unit Cost Development.
3.4 ANALYSIS OF THE RESULTS
The research team an alyzed the results f rom th e onl ine s urvey to identify th e s tate a gencies conducting considerable work in the development of unit costs for project estimation. The team selected seven state agencies for further interview. The analysis technique involved conducting interviews ove r t he t elephone a nd vi siting t he s tate a gency’s of fices. F or t his pur pose, a structured i nterview p rotocol w as d eveloped and us ed i n a ll t he i nterviews. T he follow-up interview questionnaire for the respective states was developed based on the replies received for the online survey.
3.4.1 Interviews – Selection Criteria
The criteria applied to select state agencies for the follow-up interviews covered different aspects of unit cost development for construction projects. They included:
• Estimating approach – Type of estimating technique used by the agency in estimating construction pr ojects. E ither ( 1) Historical B id-Based E stimating or ( 2) C ost-Based Estimating.
• Trns*port Users – Agencies using Trns*port suite of software like CES, PES, Estimator.
• Non-Trns*port Users – Agencies us ing i n-house de veloped s ystem for e stimating construction projects.

31
• Innovative ap proach t o e stimating – Agencies us ing innovative ways to estimate construction projects.
• Sophisticated d atabases – Agencies ha ving s ophisticated databases f or hi storical uni t costs.
• Agencies having guidance on developing estimates for construction projects.
The t eam al so considered different di stricts within TxDOT f or int erview to gain a b etter understanding of t he u nit c ost de velopment f ollowed i n t he di stricts. The results of these interviews were compared with the r eplies f rom ot her s tate agencies an d used as t he basis for recommendations.
3.4.2 State Agencies Interviewed
The research team selected the following state agencies for a follow-up interview based on the selection criteria identified in the previous section.
• California
• Florida
• New York
• Minnesota
• Utah
• Virginia
• Washington
• Texas
o Dallas District
o Fort Worth District
o Bryan District
Each agency was given a follow-up questionnaire developed based on their replies to the online survey. The i nterviews w ere conducted ove r t he t elephone for all s tate agencies ex cept Minnesota Department of Transportation ( MnDOT). Appendix D shows t he s ample questionnaire used for the telephone interview with the VDOT. The researchers also interviewed TxDOT pe rsonnel t o unde rstand t he de velopment of uni t c osts w ithin TxDOT. Dallas, Fort Worth, and Bryan districts were selected for the interview. The Dallas and Fort Worth interviews were conducted over the telephone, while the Bryan District interview was conducted on site.


33
4. RESULTS FROM INTERVIEWS
This section consolidates the replies received from the SHAs interviewed over the telephone or by personal visit to their offices. Similar to the online survey, the replies from the interview are grouped under two sections, construction and maintenance unit cost information, for each SHA. Similar to the survey, construction unit cost information section is further divided into five sub-sections: 1) a general s ection; 2) acquiring; 3) storing; 4) accessing; and 5) applying uni t cost information.
4.1 VIRGINIA DEPARTMENT OF TRANSPORTATION
4.1.1 Construction Unit Cost Information
4.1.1.1 General Section
VDOT’s primary estimation technique is cost-based estimating carried out in the PS&E phase of project de velopment. VDOT us es cost-based e stimating to develop pr oject es timates us ing a production rate and the cost a ssociated with l abor, materials, and construction equipment. B y estimating the cost of each component required to complete the work together with a contractor’s profit a nd ove rhead an estimated uni t pr ice f or the w ork is developed. Estimation dur ing the planning, s coping, and design pha se i s pe rformed w ith t he he lp of di fferent s oftware w hich includes the commercially available Trns*port system as well as software developed in-house by VDOT. Table 2 provides details of the software used by VDOT in different phases of project development. Figure 26 provides the cost estimation framework used by VDOT, set against its contract time estimation framework (Williams et al., 2007).

34
Figure 26. VDOT Estimation Framework.
Table 2. VDOT Estimation Software.
Project Development Phases Computer Based System Planning Planning Cost Estimate Excel Scoping Project Cost Estimating System (PCES) Design Trns*port PES PS&E Estimator, InfoTech Pvt. Ltd
4.1.1.1.1 Planning Cost Estimate Excel
The pl anning di vision o f V DOT uses P lanning C ost E stimate E xcel to arrive at t he pl anning level cost estimate. This Excel spreadsheet was last updated on June 2006 and is used throughout the s tate in preparing planning level estimates. This includes cost of typical sections for urban and rural regions, bridge cost, other improvement costs, Right-of-Way (ROW), and Utilities cost (expressed as percentage of construction cost). The estimates are given for three different regions of V irginia. A contingency factor of 20 percent for P reliminary E ngineering ( PE) and Construction Engineering (CE) is included in the costs. At the planning level, statewide inflation is a ssumed t o be 5.5 percent annually a nd an i nflation r ate of 6.5 percent is a ssumed f or NOVA/Hampton roads.
The urban and rural typical section estimates, given in Table 3, do not include bridge, right-of-way ( ROW), and other improvement cos ts. T he es timates are r epresented in Cost Per Mile (CPM). T he t hree r egions i nclude Bristol a nd Lynchburg f or R egion I, R ichmond,

35
Fredericksburg, C ulpeper, S alem and S taunton for R egion II and N OVA/Hampton R oads f or Region III.
Table 3. VDOT Urban/Rural Sections - Planning Cost Estimate Excel.
Urban Typical SectionsBikeway 5' pavement CPM 490,000$ 540,000$ 630,000$ 2 lanes U2 26'-30' pavement Reconstruct or New CPM 2,700,000$ 3,000,000$ 3,500,000$ 3 lanes U3 36'-40' pavement Reconstruct or New CPM 5,200,000$ 5,700,000$ 6,600,000$
4 lanes U4 40'-48' pavement Reconstruct or New CPM 6,200,000$ 6,800,000$ 7,900,000$ 4 lanes divided U4D 48' pavement w/16' raised median Reconstruct or New CPM 6,900,000$ 7,600,000$ 8,800,000$ 4 lanes divided U4D 48' pavement w/28' raised median Reconstruct or New CPM 7,400,000$ 8,200,000$ 9,400,000$
6 lanes divided U6D 72' pavement w/16' raised median Reconstruct or New CPM 8,900,000$ 9,800,000$ 11,300,000$ 6 lanes divided U6D 72' pavement w/28' raised median Reconstruct or New CPM 9,700,000$ 10,600,000$ 12,300,000$
8 lanes divided U8D 96' pavement w/16' raised median Reconstruct or New CPM 11,100,000$ 12,200,000$ 14,200,000$ 8 lanes divided U8D 96' pavement w/ 28' raised median Reconstruct or New CPM 11,800,000$ 12,900,000$ 14,900,000$
Rural Typical SectionsBikeway 5' pavement CPM 220,000$ 240,000$ 280,000$ 1 lane 12' pavement CPM 300,000$ 330,000$ 380,000$
2 lanes R2 18' pavement Reconstruct or New CPM 460,000$ 500,000$ 580,000$ 2 lanes R2 20' pavement Reconstruct or New CPM 750,000$ 830,000$ 960,000$ 2 lanes R2 22' pavement Reconstruct or New CPM 900,000$ 990,000$ 1,140,000$ 2 lanes R2 24' pavement Reconstruct or New CPM 1,300,000$ 1,400,000$ 1,700,000$
3 lanes R3 36' pavement Reconstruct or New CPM 2,600,000$ 2,900,000$ 3,300,000$
4 lanes divided R4D 48'pavement Reconstruct CPM 3,500,000$ 3,900,000$ 4,500,000$ 4 lanes divided R4D 48' pavement New CPM 5,300,000$ 5,900,000$ 6,800,000$ 4 lanes divided R4D 48' pavement Parallel CPM 2,700,000$ 3,000,000$ 3,500,000$ 4 lanes divided R4D 48' pavement w/16' raised median Reconstruct or New CPM 3,800,000$ 4,100,000$ 4,800,000$ 4 lanes divided R4D 48' pavement w/28' raised median Reconstruct or New CPM 4,400,000$ 4,900,000$ 5,600,000$
6 lanes divided R6D 72' pavement widen 4-6 lanes Reconstruct CPM 4,900,000$ 5,400,000$ 6,300,000$ 6 lanes divided R6D 72' pavement w/depress median New CPM 6,500,000$ 7,100,000$ 8,300,000$
8 lanes divided R8D 96' pavement widen 6-8 lanes Reconstruct CPM 4,900,000$ 5,400,000$ 6,300,000$ 8 lanes divided R8D 96' pavement widen 4-8 lanes CPM 9,800,000$ 10,700,000$ 12,400,000$ The t ool e xcludes b ridges f rom th e t ypical s ection since the y c ontribute s ignificantly to construction cost. Estimates for bridge are computed using the available costs per square footage multiplied by the bridge dimensions. Table 4 gives the bridge cost used in the planning level cost estimate.

36
Table 4. VDOT Bridge Cost - Planning Cost Estimate Excel.
Bridge CostOver 25' to 200' in length Widen Reconst or New per sq ft 110$ 120$ 140$ Over 200' in length Widen Reconst or New per sq ft 140$ 150$ 170$
Other i mprovement c osts a re a dded t o c onstruction c ost ba sed on t he p roject c ondition. T he urban/rural s ections, br idges and ot her i mprovement c osts m ake up t he pl anning l evel construction estimate. The Planning Cost Estimate Excel derives the planning level cost estimate by adding the ROW cost and utilities cost to the construction estimate. The ROW and utilities cost, given in Table 5, are classified based on location of project.
Table 5. VDOT ROW Cost Percentages - Planning Cost Estimate Excel.
30%55%75%125%100%
RuralResidential/Suburban low densityOutlying business/Suburban high density 60%
Right of Way & Utilities Cost % of Cost Estimate
Central business district
25%50%
4.1.1.1.2 Project Cost Estimating System (PCES)
PCES is a n in-house s ystem de veloped b y VDOT f or p reparing e stimates dur ing t he s coping phase of project development. The current version of the PCES is 2.5, though the discussion used version 2.1. The PCES consists of following sections:
• Summary Page
The summary page gives the total project estimate, which is made up of the construction estimate, Preliminary Engineering (PE) estimate, and right-of-way and utilities estimate along with the project number, district, and year of estimation.
• Construction/Bridge/PE
This s ection uses la ne mile c ost f or di fferent geometric s tandards ta ken from the bi d details. The construction estimate includes details of the roadway like the total length of project, length of two/four lanes to be built, length of the curb (ft), length of the sidewalk, number of new traffic signals required or number of signals requiring adjustment, cost of large drainage structures, and in-plan utility cost.
The PCES s ystem pr ovides an estimate ba sed on project f eatures r ather t han the quantities. For e xample, t he c ost of a ll t he components r equired i n c onstructing a ne w

37
signal i s r olled up i nto one c ost, which constitutes t he uni t pr ice f or the signal. By entering the number of new signals to be constructed, a total estimate for the s ignals is computed.
PCES e stimates b ridges s eparately, again for t he s ame r eason that they c ontribute significantly to project construction cost. The dimensions of the existing and new bridge along w ith t he c omplexity/type of ne w br idge a re e ntered f or e stimating t he br idge construction c ost. Bridge complexity c an be s elected as s imple, moderate, or c omplex based upon the height, difficulty of construction and other factors. Estimates for a bridge of moderate complexity are taken as the base estimate, which is increased by 15 percent for complex bridges and decreased by 10 percent for bridges of simple complexity. Also, PCES provides the option to select whether the bridge work is only widening of existing structure or super structure repair. The demolition of bridges is estimated as a lump sum item.
• Right-of-way (ROW) Estimate
The costs associated with the ROW estimate can be either “computed” or “user-defined” costs. ROW e stimate c omprises of t he l and v alue, bui lding v alue, d amages, ot her improvements, administrative s ettlements, condemnation increases, administrative costs and incidental e xpenses, de molition c ontracts, h azardous m aterials r emoval, pr operty management, r elocation assistance, year o f R OW a uthorization a nd a manual inf lation rate.
• Utilities Estimate
The ut ilities e stimate i ncludes the c ost a ssociated with setting up electrical line s, telephone l ines, water, sanitary sewer, natural gas/propane, petroleum, cellular, and any additional items.
4.1.1.1.3 Trns*port Proposal and Estimate System (PES)
VDOT uses the PES module of the Trns*port s ystem for preparing the design level estimates. PES generates an item cost estimate using the historical bid data stored in the BAMS/DSS. The emphasis a t thi s s tage is on estimating the correct quantities. VDOT us es a de tailed estimate generated by PES to compare the estimates generated by the estimators.

38
4.1.1.1.4 Trns*port Estimator
VDOT uses the Estimator to perform “rational estimation” or cost-based estimation to compare the es timates of designers. The definition of rational estimate given by VDOT is “An estimate prepared by determining the required manpower, equipment, labor, and production rate, per day needed t o c omplete a uni t of w ork.” R ational estimation is pe rformed on bid items w hich constitute 65 percent of total project cost. All unit prices are reviewed and modified as necessary. VDOT checks the remaining 35 percent of project cost, which mostly includes minor items of work, against the prices estimated in PES and does not modify the amounts unless there is a large deviation in the prices contained in PES. VDOT uses various catalogs for its rational estimation. These catalogs are databases containing the equipment, labor, and material costs that are loaded into Estimator. The Site Manager module of the Trns*port suite of software is also used in the estimation to obtain production rates based on the similarity of work being estimated.
4.1.1.2 Acquiring Unit Cost Information
As part of its rational estimation, VDOT makes use of di fferent catalogs. These ‘catalogs’ ar e databases of equipment, labor and material costs loaded into Estimator to help in preparing the cost es timate. These catalogs are updated every year from their respective sources specified in Table 6.
Table 6. VDOT Source of Equipment, Labor, Material, and Production Rates.
Equipment Costs Blue Book of Construction Equipment Rental Rates Material Costs Material on Hand (VDOT form C-22) reports, individual
suppliers, and internet Labor rates Virginia Employment Commission (VEC) Production Rates RS Means and Site Manager (Trns*port), Bid Item Duration
Data System (BIDDS)
Equipments r ates, l abor r ates, and material costs ar e upd ated periodically as and when t heir respective data sources are revised. The State Estimates Officer and Bid Engineer are responsible for verifying the updated catalogs of equipments, labor, and material costs.
4.1.1.3 Storing Unit Cost Information
VDOT ma intains over f ive years of hi storical unit c osts i n its BAMS/DSS da tabase. These historical uni t c osts a re available f or the e ntire state a s w ell a s f or e ach district. Apart from storing hi storical uni t c osts a s s tandard c onstruction line ite ms, V DOT a lso categorizes t hem based on different work categories (e.g., grading/excavation, asphalt, bridge, traffic control, etc.) and based on pr oject types (e.g. bridge replacement, lane widening, intersection reconstruction,

39
etc.). PES project details are updated every night in a separate data. This is used to compare the estimates prepared using PCES software.
4.1.1.4 Accessing Unit Cost Information
The B AMS/DSS da tabase i s t he pr imary s ource of hi storical da ta us ed in P ES a nd E stimator. VDOT also maintains a com prehensive t wo-year hi storical bi d price lis ting a s w ell a s the statewide and district averages on its website at http://www.virginiadot.org/business/const/ under the ‘Other Resources’ s ection. Figure 27 provides a s ample of a two-year historical bid price listing ma intained by V DOT. Figure 28 and Figure 29 give a s napshot of t he s tatewide a nd district averages maintained for different work items.
Figure 27. VDOT Two-Year Historical Bid Price Listing.
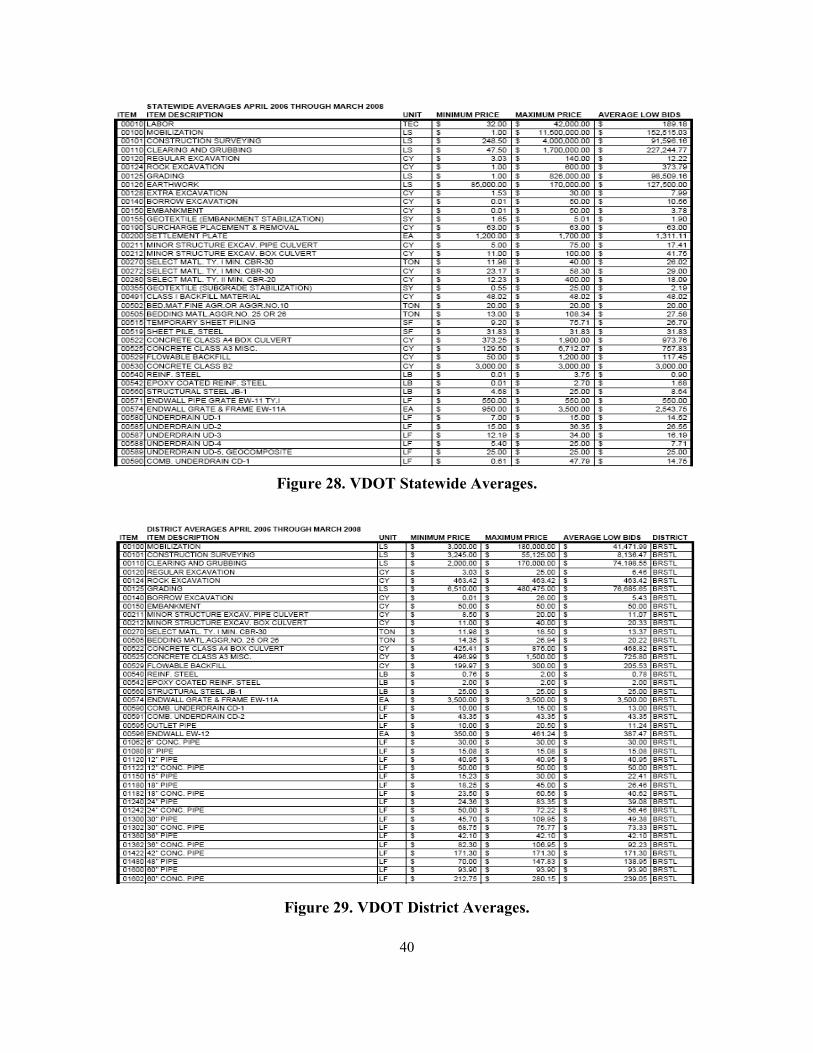
40
Figure 28. VDOT Statewide Averages.
Figure 29. VDOT District Averages.

41
4.1.1.5 Applying Unit Cost Information
VDOT c onsiders va rious f actors f or a djusting t he uni t pr ices generated f rom t he P ES when performing rational cost estimation. T he f ollowing are c ommon factors c onsidered w hen adjusting uni t pr ices, t hough t hese m ight va ry based on w ork i nvolved a nd specific contract provisions:
• Plan and proposal review • Project site conditions • Time limit • Sequence of construction • Seasonal limitations • Regional conditions • Current market conditions • Quantities/price relationships • Inflation and risks involved in the project
In performing the rational estimation, VDOT adjusts unit prices for the above factors based on recent bid history received for particular items of work. The labor rates available from the VEC are escalated at the average rate for the previous two years since these rates are a year old when they are published. This adjustment is applied twice to the published rate, first to bring this rate current and the second to project the cost on future work being performed. Furthermore, this rate is increased by 50 percent to 52 percent to reflect the labor burden. VDOT uses RS Means as guidance on t he pr oduction r ates but r elies m ore on e xperience a nd on s oftware l ike t he S ite Manager and BIDDS for f inding the production rates for various items of work. Site Manager reflects t he c urrent pr oduction r ates f rom va rious ong oing pr ojects i n V DOT a nd B IDDS maintains a historical database of production rates. BIDDS is generally used within VDOT for preparing an estimate on the contract time at the pre-advertisement level, but it is also used to report historical bid item level performance data, which can be used by the estimator to estimate the production rates for individual bid items. Figure 30 shows the role of BIDDS in determining the production rates.

42
Figure 30. VDOT Production Rate Estimation.
VDOT uses 24 months of historical data when establishing the unit prices for its major items of work. A w ork i tem i s c onsidered a m ajor w ork i f i t c onstitutes 60 percent of tot al e stimated contract cost or 10 percent of total quantities, whichever is smaller. If sufficient historical data are available, VDOT co nducts a regression analysis to establish the uni t pr ice. Otherwise, a weighted average is used for determining the unit price. VDOT performs a manual comparison of historical bid data generated by PES with recent bids and adjusts unit costs accordingly. The unit price prepared for non-standard work item by the design division is not modified in the final engineers estimate. Sometimes other s tates are referenced as a check if similar work item have been used.
4.1.2 Maintenance Unit Cost Information
The unit costs for maintenance projects are determined the same way as a construction project. The 30-day rates are used in estimation of maintenance projects along with a database on costs associated with moving, snow plowing, and so on. No separate software is used for estimating maintenance projects. Maintenance unit costs generated through PES are adjusted based on t he recent bids received by VDOT.
BIDDS
Experience
Site Manager
Production Rate

43
4.2 UTAH DEPARTMENT OF TRANSPORTATION
4.2.1 Construction Unit Cost Information
4.2.1.1 General Section
UDOT f ollows the hi storical bi d-based e stimating t echnique r ight f rom t he pl anning ph ase through the PS&E phase of project development. Planning level estimates are prepared using an in-house Excel spreadsheet c alled Concept Cost Estimate Form. UDOT prepares e stimates f or the remaining phases using its in-house application called Project Development Business System (PDBS). P DBS also ge nerates bid do cuments for contractors to s ubmit bi ds and tracks the progress of t he pr ojects a nd c hange or ders. Figure 31 de picts t he e stimation f ramework of UDOT. UDOT maintains an estimation guideline on its website (UDOT’s Statewide Estimation Process: http://www.udot.gov/main/uconowner.gf?n=35214810363450832), which provide estimators with general guidelines for developing project estimates at various phases of project development.
Figure 31. UDOT Estimation Framework.
4.2.1.1.1 Concept Cost Estimate Form
The Cost E stimate F orm de veloped by UDOT e nables the e stimators to estimate the c ost involved for major i tems of work such as roadway and drainage, traffic and safety, structures, environmental mitigation, and ITS a t the planning or conceptual l evel (see Figure 32). Certain percentages a re a ssumed t o c over t he c ontingency, yearly i nflation, r ight-of-way c ost, and utilities. The values for inflation, preliminary engineering, and construction engineering are not fixed and are adjusted based on engineering judgment.

44
Approximate Route Reference Post (BEGIN) = 101.48 (END) = 106.000Accumulated Mileage (BEGIN) = 95.202 (END) = 99.872
Project Length = 4.670 miles 24,658 ftCurrent Year = 2007
Assumed Construction Year = 2012Assumed Yearly Inflation for Construction and Utility Items (%/yr) = 7.0% 5 yrs for inflation For projects 1 Year out use 10%, 2 Years 9%, 3
Assumed Yearly Inflation for Engineering Services (PE and CE) (%/yr) = 6.0%Assumed Yearly Inflation for Urban Residential Right of Way (%/yr) = 6.5%
Assumed Yearly Inflation for Urban Commercial Right of Way (%/yr) = 4.0%Assumed Yearly Inflation for non-Urban Right of Way (%/yr) = 2.0%
Construction Items Contingency (% of Construction) = 20.0% 10% Rural PB; 15% Urban PB; 20% Non PBPreliminary Engineering (% of Construction + Incentives) = 8.0%
Construction Engineering (% of Construction + Incentives) = 10.0%
Item # Cost RemarksConstruction
Roadway and Drainage $1,502,596Traffic and Safety $269,450Structures $65,300Environmental Mitigation $595,000ITS $50,000
Subtotal $2,482,346Construction Items Contingency (for minor items not listed) (20%) $496,469
Construction Subtotal $2,978,815P.E. Cost P.E. Subtotal $245,000 8%
C.E. Cost C.E. Subtotal $306,000 10%Right of Way Urban/Suburban Residential Right of Way Subtotal $5,000Right of Way Urban Suburban Commercial Right of Way Subtotal $15,000Right of Way non-Urban/Suburban Right of Way Subtotal $21,000Utilities Utilities Subtotal $70,500Incentives Incentives Subtotal $86,084Miscellaneous Miscellaneous Subtotal $0
Cost Estimate (ePM screen 505) 2007 2012Concept Report CostP.E. $245,000 $328,000Right of Way $41,000 $48,000Utilities $71,000 $100,000Construction $2,979,000 $4,178,000C.E. $306,000 $409,000Incentives $86,000 $121,000Contingency 10% $372,800 $523,000Miscellaneous $0 $0
TOTAL $4,100,800 TOTAL $5,707,000
TOTAL $4,100,800 TOTAL $5,707,000PROPOSED COMMISSION REQUEST
Cost Estimate - Concept Level
Figure 32. UDOT Concept Cost Estimate Form.

45
Estimators a re a dvised t o c ompare t he pr oject da ta f rom P DBS a nd a bstracts f rom pr evious projects of similar locality, size, and scope while preparing an estimate for any project. Also, the price comparison report generated using PDBS provides a quick method to evaluate the project unit pr ices a gainst r egion or s tatewide averages. T he pr ice c omparison r eport c ompares t he average of t he hi storical da ta and gives ave rages f or each item of work ( including s tandard deviation).
4.2.1.2 Acquiring Unit Cost Information
UDOT utilizes its PDBS to extract all the bid details from the submitted bids.
4.2.1.3 Storing Unit Cost Information
The database within PDBS enables UDOT to store more than five years of historical bid data in its database. T he hi storical uni t c ost i nformation i s a vailable for the entire s tate, districts, and counties. Historical unit costs are also available for the date range specified in PDBS, quantity range, awarded bid only, source of funding, and based on uni ts (English or Metric). All of the historical bid details are stored as standard construction line items.
4.2.1.4 Accessing Unit Cost Information
PDBS e nables th e e stimator to access a ll the historical bi d information. UDOT pr ovides its estimators with a list of statewide average (weighted) low bid for each of the line items of work. Figure 33 s hows a snapshot of t he a verage l ow bi d i nformation. T he l ow bi d i nformation i s generated every year, and it is a vailable on their website a t http://www.udot.utah.gov/main/f?p=100:pg:12302720542229821131:::1:T,V:446. The statewide average low bid price contains the average unit price, total quantity, and unit of measure for each line item of work arranged by the item number.

46
Figure 33. UDOT Statewide Average Unit Low Bid Prices.

47
4.2.1.5 Applying Unit Cost Information
UDOT maintains a set of guidelines for preparing estimates dur ing different phases of project development. The p roject de signer i s r esponsible for c ompiling and upda ting t he pr oject estimates. Each design group within UDOT is required to complete the estimates for a ll work performed on t heir r espective por tion o f a project. F or e xample, t he structural d esigner is required to prepare and update the estimates for structural items. PDBS tracks the history of bid items a nd determines the uni t pr ices f or c ost e stimates. The estimating chapter of U DOT’s Roadway D esign M anual of Instruction provides t he s teps t hat ne ed to be f ollowed w hile preparing the bid portion of Engineer’s Estimate. The guidelines include the following steps:
1. Compiling qua ntities f or e ach i tems of work a nd c hecking their accuracy against the current level of design.
2. Determining and documenting the unit prices for all items of work.
3. Assigning r esponsibility to each department t o provide the qu antities a nd c osts f or all items of work.
4. Adding necessary contingencies for unknown items, miscellaneous items, and inflation.
5. Conducting a Red Flag Analysis on the estimates.
6. Verifying the estimate is on target for project delivery and identifying areas of concerns.
7. Performing Quality Control/Quality Assurance (QC/QA).
Unit prices determined in Step 2 of the general guidelines take into consideration the following factors influencing the unit bid price:
• Location
• Time of year
• Constructability
• Quantity of item
• Limitations of operation
• Availability of materials
• Familiarity of process
• Specialty equipments
• Risk to contractors

48
• Construction schedule
UDOT considers seven to twelve months of historical data for establishing the unit prices using weighted moving average for duration of one year or one quarter. Using PDBS, the estimators can also obtain the weighted unit prices based on a specified time range.
4.2.1.5.1 Red Flag Analysis
PDBS has a bui lt in feature, Red Flag Analysis, that aides the engineers in considering factors affecting the project cost while preparing an Engineer’s estimate. The Red Flag Analysis lowers or raises the Engineer’s Estimate by a certain percentage to address the specific characteristics of the pr oject. T o p erform this a nalysis, t he e stimator i s pr ovided w ith a s creen ( see Figure 34) where specific questions about the project are answered.
Figure 34. UDOT Red Flag Analysis – PDBS.
• Orange/Purple Book Project: Pavement preservation projects (Negative flag since they are simple and straightforward).
• Trail P roject: B ike or pedestrian trail pr oject ( Positive f lag s ince the y are hi storically higher than estimated).
• Local Government Project: Historically higher than estimated due to size and increased number of project stakeholders (Positive flag if local Government project).

49
• Location of Project: Remote project locations can increase the cost of project (Positive flag if project is in a remote location).
• Schedule/Start D ate C onstraints of P roject: Tight s chedules without a llowing any flexibility for contractor increases the project cost (Positive flag, if schedule is tight).
• Plan holders (Contractor Interest): More plan holders provide more bidders leading to more number o f bi ds r eceived a nd l ower bi ds. (Negative flag, if c ontractor int erest is minimal).
• Bidding Season: Advertisement of project in winter leads to a negative red flag.
UDOT c an also perform a R ed Flag an alysis on cost-sensitive ma terials, lump sum/specialty items, and non-bid i tems. E xamples of c ost-sensitive ma terials are hot mix asphalt ( HMA), concrete, and steel. If the cost of these volatile materials is greater than 10 percent of the total estimate on a large project (30% for smaller project), the Red Flag Analysis suggests adding a positive f lag ( 2.5%) t o a ccount f or m arket vol atility. R ed f lag analysis always suggests a n increase or decrease of a constant 2.5 percent. Previous projects and experience established this value. However, the percentage can be overridden if the estimator finds it to be not appropriate for the project.
UDOT sets certain amount (percentages) for minor items of work not covered during the initial phases of project development. Table 7 includes the contingency used by UDOT to cover these minor items of work.
Table 7. UDOT Contingency Percentages.
Project Phase Contingency (%)
Planning 25
Scoping 10
Design 10
PS&E 5
4.2.2 Maintenance Unit Cost Information UDOT e stimates m aintenance p rojects s imilarly to c onstruction pr ojects. P DBS pr ovides t he necessary unit costs to be used in the estimation of maintenance projects.

50
4.3 CALIFORNIA DEPARTMENT OF TRANSPORTATION
4.3.1 Construction Unit Cost Information
4.3.1.1 General Section
Caltrans uses historical bid-based estimating from the Planning phase through the PS&E phase of project development. Caltrans performs cost estimation in all these phases using an in-house developed Excel s preadsheet ( see Figure 35 ). The di strict o ffices, which are responsible f or preparing t he Engineer’s Estimate, rely on t hese s preadsheets f or e stimation pur poses. For preliminary estimates, Caltrans uses Planning Level Excel spreadsheets available on its website under the Division of Engineering Services (http://www.dot.ca.gov/hq/esc/estimates/forms). The Structures Division in Caltrans has identified cost per square unit for typical structural sections, and updates t he v alue annually. T he di strict offices used the va lue for the ir pr eliminary estimation until detailed design information is available. Figure 36 shows the comparative bridge costs developed for the year 2007 i n metric uni ts, and Figure 37 shows the Advance P lanning Estimate E xcel spreadsheet used by t he S tructures of fice for pr eparing t he pl anning l evel estimates.
PlanningExcel
Spreadsheet ScopingExcel
SpreadsheetDesign
Excel Spreadsheet
PS&EExcel
Spreadsheet
Historical Bid-Based Estimation
Figure 35. Caltrans Estimation Framework.

51
Figure 36. Caltrans Comparative Bridge Costs (2007).

52
GENERAL PLAN ESTIMATE ADVANCE PLANNING ESTIMATE
Revised - December 3, 2007
RCVD BY: JTY IN EST:OUT EST:
BRIDGE: BR. No.: DISTRICT:TYPE: RTE:CU: CO:EA: KP:
LENGTH: WIDTH: AREA (SQ. M)=DESIGN SECTION:# OF STRUCTURES IN PROJECT : EST. NO.PRICES BY : COST INDEX:PRICES CHECKED BY : DATE:QUANTITIES BY: DATE:
CONTRACT ITEMS TYPE UNIT QUANTITY PRICE AMOUNT1 TEMPORARY RAILING m2 REMOVE CONCRETE m33 STRUCTURE EXCAVATION (BRIDGE) m34 STRUCTURE EXCAVATION m35 STRUCTURE BACKFILL (BRIDGE) m36 PERVIOUS BACKFILL MATERIAL m37 CIDH CONCRETE PILING m8 FURNISH PILING m9 DRIVE PILES EA10 FURNISH PC/PS CONCRETE GIRDERS EA11 ERECT PC/PS CONCRETE GIRDERS EA12 STRUCTURAL CONCRETE, BRIDGE m313 STRUCTURAL CONCRETE, BRIDGE FOOTING m314 STRUCTURAL CONCRETE, APPROACH SLAB m315 PRESTRESSING STEEL kg16 BAR REINFORCING STEEL (BRIDGE) kg17 FURNISH STRUCTURAL STEEL kg18 ERECT STRUCTURAL STEEL (INCL PAINT) kg19 JOINT SEAL ASSEMBLY (MR = ) >50 mm m20 JOINT SEAL (MR = ) 50mm max m21 SLOPE PAVING m322 CONCRETE BARRIER m23 24 25 26 27 28 29 30
SUBTOTALTIME RELATED OVERHEAD
ROUTING MOBILIZATION ( @ 10 % )1. DES SECTION SUBTOTAL BRIDGE ITEMS2. OFFICE OF BRIDGE DESIGN - NORTH CONTINGENCIES (@ 20%) 3. OFFICE OF BRIDGE DESIGN - CENTRAL BRIDGE TOTAL COST4. OFFICE OF BRIDGE DESIGN - SOUTH COST PER SQ. METER 5. OFFICE OF BRIDGE DESIGN - WEST BRIDGE REMOVAL (CONTINGENCIES INCL.)6. OFFICE OF BRIDGE DESIGN SOUTHERN CALIFORNIA WORK BY RAILROAD OR UTILITY FORCES GRAND TOTAL
COMMENTS: BUDGET ESTIMATE AS OF
Escalated Budget Estimate to Midpoint of Construction *Escalation Rate per Year 5.5%
Years Beyond Escalated Years Beyond EscalatedMidpoint Budget Est. Midpoint Budget Est.
1 42 53
* Escalated budget estimate is provided for information only, actual construction costs may vary. Escalated budget estimates provided do not replace Departmental policy to update cost estimates annually.
etric
Caltrans
Figure 37. Caltrans Advance Planning Estimate Excel Spreadsheet.

53
For e ach i tem of w ork i dentified i n t he pl anning l evel E xcel spreadsheet, t he uni t pr ices a re obtained f rom the District 8 da tabase containing the hi storical bid data and from the Highway Cost Index/Bridge C ost Index. A part f rom t he D istrict 8 da tabase, w hich r epresents s tatewide historical bid data, districts also rely on similar projects to compute the uni t pr ice for di fferent items of work.
The items of work identified in the planning level spreadsheet are broken down into more detail as t he project moves f rom planning ph ase through scoping and design, until the PS&E phase. The estimates are prepared for the current date and escalated to five years in the future. Caltrans has an annual update policy, which dictates an annual review of each project’s estimates and an update with new escalation rates.
4.3.1.2 Acquiring Unit Cost Information
Caltrans uses their Basic Engineering Estimating System (BEES) for preparing the project design cost e stimates. BEES is also us ed i n bi d op ening, t racking the pr ogress of t he pr ojects a nd producing segregated c ost es timates ba sed on t he f und s ource. BEES c onsists of t wo components: (1) District (Highway) Cost Estimate and (2) the Structures (Bridge) Cost Estimate. These two components are combined to estimate the total construction cost for a project. BEES stores these two components separately and permits the recall of the combined or separate cost estimates. District Offices and the Office of Structures use the BEES coded item list for entering the District Cost Estimate and Structure Cost Estimate separately. All the associated quantities and uni t pr ices are entered for each i tem of work. This forms the Preliminary Engineer’s Cost Estimate (blue sheet estimate). Once the contract documents are finalized, the preliminary cost estimate becomes the Final Engineer’s Cost Estimate. Once the project is let, the bid details from all the submitted bids are stored within the BEES database.
4.3.1.3 Storing Unit Cost Information
The BEES d atabase and the D istrict 8 database hol d the hi storical bi d data, which is m ade available to all the Districts. District 8 database is updated with the recent bid details available from the BEES database. Over five years of historical data are stored and made available through the District 8 webpage ( internet) as well through an Excel spreadsheet ( intranet). The database holds bid data for the entire state, districts, counties, and even market areas. The Contract Item Cost Database, located in the main office, is another source for storing historical bid data though only low bid details are stored within this database.

54
4.3.1.4 Accessing Unit Cost Information
Estimators in various districts of Caltrans use the Contract Item Cost Database and the District 8 database (http://sv08data.dot.ca.gov/contractcost/) for accessing the historical bid data. Figure 38 presents the D istrict 8 webpage s howing t he o nline t ool de veloped b y C altrans f or accessing historical bi d data. Figure 39 p rovides the t ypical s earch r esults. Estimators can search for historical data based on such area as districts of interest, year, maximum and minimum amount, maximum and minimum quantities, and relevant unit prices.
Figure 38. Caltrans District 8 Contract Cost Database.

55
Figure 39. Caltrans Search Results for Contract Cost Database.
The Contract Item Cost Database (http://www.dot.ca.gov/hq/esc/oe/costinfo.html) is a tabulation of the BEES item list having weighted averages of the low bidder’s prices for those items (see Figure 40).

56
Figure 40. Caltrans Contract Item Cost Report.
4.3.1.5 Applying Unit Cost Information
Caltrans generally uses four to six months of historical data when establishing the unit price for a line item but a lso considers using older da ta t han that. The District 8 d atabase a long with the Contract Item C ost da tabase s erve a s a good s ource of hi storical bi d da ta f or t he di strict estimators. Based on parameters like the district number, year, minimum and maximum quantity, and minimum and maximum total price, historical bid data can be obtained for various items of work. Apart from the list of historical bid data, the database provides estimators with the simple average, w eighted average (unmodified a nd a djusted) a nd s tandard d eviation f or t he i tems selected from t he s earch r esults. Figure 41 provides t he s ummary of average pr ice/unit a long with the standard deviation. Another feature available is the generation of a trend line for the line item be ing searched. Figure 42 shows the trend line for line item Clearing and Grubbing. The standard deviation allows the estimators to understand the variation with the unit pricing. Though the trend analysis, shown in Figure 42, helps the estimator in modifying the unit costs, unit prices are adjusted based on experience and engineering judgment.

57
Figure 41. Caltrans Summary of Average/Weighted Average Price.
Figure 42. Caltrans Trend Line Feature of Contract Cost Database.
Caltrans has standard sliding scale contingencies for different phases of project development to cover estimate uncertainties. Table 8 outlines t he c ontingency included in C hapter 20 , Project Development Cost Estimates, of Caltrans’ Project Development Procedures Manual.

58
Table 8. Caltrans Contingency Percentages.
Project Phase Contingency (%)
Project Feasibility Cost Estimate 30 – 50
Project Study Report (PSR) Cost Estimate 25
Draft Project Report (PR) Cost Estimate 20
Project Report Cost Estimate 15
Preliminary Engineer’s Cost Estimate 10
Final Engineer’s Cost Estimate 5
The Engineer’s Estimate is c hecked against the low bi d cost e stimate received to draw a comparison be tween the tw o estimates based on t he num ber of bi dders for a ll pr ojects. T his would enable the estimators to analyze the effect of number of bidders on the total project cost. Figure 43 shows the comparison of the low bid with the Engineer’s Estimate for all the projects let between 1993 and 2006.
Figure 43. Caltrans Comparison of Low Bid versus Engineer's Estimate.

59
4.4 MINNESOTA DEPARTMENT OF TRANSPORTATION
4.4.1 Construction Unit Cost Information
4.4.1.1 General Section
MnDOT r elies primarily on C ost-Based Estimating to prepare the E ngineer’s E stimate in the PS&E pha se o f pr oject development. H istorical bid-based estimating is used in the pl anning, scoping and design phase of project development. All the items of work identified in the design phase are re-estimated in PS&E phase. MnDOT uses the CES of Trns*port system for preparing the f inal E ngineer’s E stimate. Preliminary es timates and design l evel estimates ar e pr epared using E xcel s preadsheets, de veloped i n-house, at t he District O ffices. The s ource of hi storical unit cost is an Excel spreadsheet generated by the Trns*port system. This Excel spreadsheet is available on their intranet as well as MnDOT’s website. Bridge estimates are prepared separately and a dded t o t he f inal estimate. Estimators us e the 80/ 20 rule, t hat i s, 20 percent of w ork contributes to 80 percent of the total cost when preparing cost estimates. Major items of work are estimated using a cost-based estimating approach, while the minor items are estimated by taking the arithmetic average of historical bid data.
PlanningExcel
Spreadsheet, in-house Scoping
Excel Spreadsheet,
in-houseDesign
Excel Spreadsheet generated by
Trns*port PS&ETrns*port CES
Cost-Based Estimation
Historical Bid-Based Estimation
Figure 44. MnDOT Estimation Framework.

60
4.4.1.2 Acquiring Unit Cost Information
MnDOT us es di fferent libraries or c atalogs f or s toring t he l abor, m aterials, e quipment, and production rate data in CES. A separate library containing historical data from June 2006 to June 2008 i s us ed a s s ource of hi storical bi d da ta i n C ES. The e stimators use h istorical bi d data extracted from B AMS/DSS w hen preparing the historical cost libr ary. Using B AMS/DSS, the threshold on the number of hi storical bi d da ta us ed i n t he r egression a nalysis a nd a rithmetic average c an be s et. M nDOT us es a m inimum of 15 oc currences o f hi storical da ta w hen performing t he r egression a nalysis a nd a minimum of 10 occurrences w hen pe rforming arithmetic average. The catalogs for labor, material, equipment, and production rates are updated every year from their respective sources given in Table 9.
Table 9. MnDOT Source of Equipment, Labor, Material, and Production Rates.
Equipment Costs Commissioners Equipment Rental Rates, Department of Labor Truck Rental Rates, Rental Blue Book (Vol. 3)
Material Costs Call suppliers and Materials Engineers Labor rates Minnesota department of labor and industry
Production Rates Contract time (Construction Division of MnDOT)
4.4.1.3 Storing Unit Cost Information
The historical unit costs are stored in BAMS/DSS of Trns*port system. The BAMS/DSS stores over five years of historical bid data as standard construction line items. Historical unit costs are available f or the e ntire state, districts, and c ounties. D istrict of fices ha ve hi storical bi d da ta stored in Excel spreadsheets.
4.4.1.4 Accessing Unit Cost Information
MnDOT uses an Excel spreadsheet containing all the bid information available on their intranet (iHub) a nd t heir internet website. This s preadsheet i s generated from B AMS/DSS and made available to all the D istrict of fices for estimation purposes. Estimators c an sort hi storical uni t costs ba sed on Item Id, Item D escription, Quantities, Districts, Engineer’s E stimate, and three low bi dders. Figure 45 and Figure 46 show a s napshot of t he E xcel s preadsheet us ed b y t he estimators at MnDOT.

61
Item Item Description Dist. Quarter Contract County SP Units QTY2011601/00001 CONSTRUCTION LAYOUT STAKING 3 2003Q2 030050 STEARNS 7380-206 LS 12011601/00001 CONSTRUCTION LAYOUT STAKING 4 2003Q3 030165 DOUGLAS 2101-20 LS 12011601/00001 CONSTRUCTION LAYOUT STAKING 7 2003Q2 030080 BLUE EARTH 0703-16 LS 12011601/00001 CONSTRUCTION LAYOUT STAKING M 2003Q2 030073 HENNEPIN 2723-109 LS 12011601/00001 CONSTRUCTION LAYOUT STAKING 2 2003Q2 030067 BELTRAMI 0416-31 LS 12011601/00002 TUNNEL CONSTRUCTION LAYOUT STAKING M 2005Q2 050073 HENNEPIN 2771-31 LS 12011601/00003 CONSTRUCTION SURVEYING 1 2003Q1 030027 KOOCHICHING 3609-30 LS 12011601/00003 CONSTRUCTION SURVEYING 1 2003Q1 030054 CARLTON 0906-42 LS 12011601/00003 CONSTRUCTION SURVEYING 1 2003Q2 030082 CARLTON 0901-72 LS 12011601/00003 CONSTRUCTION SURVEYING 1 2003Q2 030125 VARIOUS 8821-73 LS 12011601/00003 CONSTRUCTION SURVEYING 1 2003Q3 030207 ST LOUIS 6920-37 LS 12011601/00003 CONSTRUCTION SURVEYING 1 2003Q4 030227 ITASCA 3108-56 LS 12011601/00003 CONSTRUCTION SURVEYING 1 2004Q2 040008 ITASCA 3108-63 LS 12011601/00003 CONSTRUCTION SURVEYING 1 2004Q2 040083 LAKE 3805-90 LS 12011601/00003 CONSTRUCTION SURVEYING 1 2004Q2 040128 KOOCHICHING 8821-74 LS 12011601/00003 CONSTRUCTION SURVEYING 1 2004Q3 040161 ST LOUIS 6903-13 LS 12011601/00003 CONSTRUCTION SURVEYING 1 2004Q3 040162 ST LOUIS 6928-26 LS 1
Figure 45. MnDOT Historical Price Database.
Awarded Price Second Bidder Third Bidder Estimate$84,900.00 $84,900.00 $96,000.00 $44,800.00$10,000.00 $13,900.00 $15,000.00 $20,000.00$20,000.00 $10,000.00 $40,000.00 $22,000.00$66,000.00 $60,000.00 $11,800.00 $48,200.00$40,000.00 $42,000.00 $41,200.00 $70,800.00$67,000.00 $15,000.00 $67,000.00 $8,000.00$18,700.00 $14,000.00 $15,368.82 $17,600.00$83,000.00 $118,000.00 $95,000.00 $40,000.00$30,837.00 $30,857.00 $31,600.00 $40,000.00$9,500.00 $15,000.00 $13,300.00 $26,400.00
$275,000.00 $201,840.00 $233,000.00 $125,000.00$105,000.00 $140,000.00 $108,500.00 $85,000.00$50,204.00 $76,000.00 $85,000.00 $85,000.00$10,000.00 $15,000.00 $12,000.00 $15,000.00$16,520.00 $15,863.10 $7,595.25 $4,769.60$30,000.00 $50,000.00 $0.00 $17,520.00$65,000.00 $68,000.00 $61,000.00 $10,700.00
Figure 46. MnDOT Historical Price Database.
Estimators at MnDOT also make use of project abstracts when preparing all types of estimates. Project abstracts can be found on their website at http://www.dot.state.mn.us/bidlet/abstract.html. These abs tracts provide the bid tabulation details based on the year selected. The abs tracts are available for every month in the year selected, and they enable the estimators to consider unit prices used by the contractors in past projects. Figure 47 shows the abstract for a pr oject let in January 2007.

62
Figure 47. MnDOT Project Abstracts.
4.4.1.5 Applying Unit Cost Information
MnDOT generally considers using seven to twelve months of historical data for establishing the unit prices. Labor rates, material rates, and equipment rates are periodically tracked and updated annually. Only the labor and the material rates are adjusted based on project location. According to M nDOT S tandard S pecification 1904 (http://www.dot.state.mn.us/tecsup/spec/2005/1100-1911.pdf), overhead, and profit are assumed as follows for all the estimates:
• Labor – 62% of taxable wages + fringes
• Equipment – 0%
• Material – 15%
• Subcontractor – 10%
Major items of w ork are e stimated using the cost-based estimation technique w hile the minor items of w ork are es timated by t aking t he a rithmetic ave rage or b y regression analysis of historical bi d data when pr eparing t he E ngineer’s E stimate. Production r ates for e ach task are calculated based on labor and equipment rates, material costs, and quantity. Adjustments to unit prices ar e pr imarily ba sed on experience a nd engineering j udgment, a lthough ha ul di stance factors are used for equipment pricing adjustments.

63
4.5 NEW YORK STATE DEPARTMENT OF TRANSPORTATION
4.5.1 Construction Unit Cost Information
4.5.1.1 General Section
NYSDOT’s ma in estimating te chnique is hi storical bi d-based estimating, which t hey us e t o prepare es timates i n the D esign and P S&E p hase of p roject d evelopment (see Figure 48 ). NYSDOT us es t he T rns*port suite of s oftware ex tensively for project de velopment a nd construction m anagement. T rns*port Estimator is us ed to prepare the de sign level e stimate a s well as the Engineer’s Estimate a t the end of the PS&E phase. NYSDOT also uses the Tracer software for pr eliminary cost estimation since it of fers the f lexibility to add many special requirements, typical o f N YSDOT. E stimators a lso use the P reliminary C ost E stimation spreadsheet (see Figure 49 ) available f or br idges to prepare early bridge estimates. This spreadsheet is available on NYSDOT’s Office of Structures webpage and is used to estimate the bridge cost f or n ew a nd r eplacement br idge pr ojects. The P reliminary C ost E stimation spreadsheet is based on Bridge Shoulder Break Area methodology (see Figure 50) developed by NYSDOT and used early i n t he pr oject when br idge pa rticulars l ike t he site location a nd abutment heights are not known. The costs are taken from Weighted Average Item Price Report (WAIPR) or their 2005/2006 Bridge Features Cost Estimate Summary report available under the Engineering Section of their Office of Structures webpage (https://www.nysdot.gov/portal/page/portal/divisions/engineering/structures/manuals/preliminary-cost). Estimates are then validated against the current or recently completed projects of similar scope.
PlanningExcel
Spreadsheet ScopingExcel
SpreadsheetDesign
Trns*port Estimator
PS&ETrns*port Estimator
Historical Bid-Based Estimation
Figure 48. NYSDOT Estimation Framework.

64
Figure 49. NYSDOT Preliminary Cost Estimate Worksheet for New and Replacement Bridges.

65
Figure 50. Shoulder Break Area Diagram – NYSDOT Preliminary Cost Estimate Worksheet.
4.5.1.2 Acquiring Unit Cost Information
Historical unit costs are acquired from the submitted bids by the contractors through the Letting and Approval System (LAS) and Site Manager of Trns*port suite of software. The BAMS/DSS stores t he historical uni t pr ices from the thr ee low est bi ds. Figure 51 explains t he f low o f historical bid data within the Trns*port system.

66
Historical Bid data
Figure 51. NYSDOT Historical Unit Costs within Trns*port System.
4.5.1.3 Storing Unit Cost Information
The historical bid prices s tored in the BAMS/DSS database of the Trns*port system consist of the three lowest historical bid made available from the LAS and Site Manager. The BAMS/DSS database for NYSDOT consists of historical bid data available over a period of five years.
4.5.1.4 Accessing Unit Cost Information
NYSDOT uni t c ost i nformation c an be ac cessed through the W eighted Average Item P rice Report (WAIPR) and the Regional and Statewide Average Awarded Price Report (RSWAAPR) available on their website (http://www.nysdot.gov). WAIPR (see Figure 52) is generated using the Trns*port system and RSWAAPR (see Figure 53) is generated using the Crystal Reports® software. Both of the reports contain all the items let during the period indicated in the report. WAIPR and RSWAAPR ar e g enerated twice a year cont aining t he t otal dol lars and weighted average price of the three low bidders. NYSDOT updates their historical bid prices every quarter.
LAS
BAMS/DSS
Site Manager CES
Estimator

67
Figure 52. NYSDOT Weighted Average Item Price Report (WAIPR) - January 2007 to December 2007.

68
Figure 53. NYSDOT Regional and Statewide Average Award Prices (RSWAAPR) - January 2007 to December 2007.
BAMS/DSS da ta are used i n generating t he R SWAAPR r eport t hrough t he C rystal R eports Software. This reporting tool is much faster and works directly with the historical bid data in the BAMS database to generate customized reports. The data obtained through this tool can be saved to an Excel s preadsheet f or f urther s tatistical a nalysis i n Excel. NYSDOT al so uses C rystal Reports s oftware t o pr epare graphical r eports o n t he accur acy of E ngineer’s E stimate. This software a lso allows grouping of historical bid data based on t he di fferent work t ypes such as grading/excavation, pavements and traffic control.

69
4.5.1.5 Applying Unit Cost Information
NYSDOT considers seven to twelve months of historical data for establishing unit prices through bid-based estimation and the use of WAIPR and RSWAAPR for the necessary weighted average of historical prices. Scatter plots are also used in determining the unit prices. The unit prices are then adjusted based on the quantities used in the project—the higher the quantity, the lower the unit price and vice versa. Adjustment of unit prices for project type and complexity is based on engineering judgment a nd experience. N YSDOT, as p er Federal Highway A dministration (FHWA) guidance on estimating, performs either historical bid-based estimating o r cos t-based estimating or a combination of both. Major items of work, which contribute significantly to the total pr oject c ost, are once again estimated using c ost-based estimating app roach. NYSDOT applies c ertain pe rcentages f or c ontingency during di fferent pha ses of project de velopment. Table 10 provides contingency ranges recommended by NYSDOT for its projects.
Table 10. NYSDOT Contingency Percentage Ranges.
Project Phase Contingency (%)
Planning 25 – 40
Scoping 20 – 25
Design 15 – 20
PS&E 5 -10
4.5.2 Maintenance Cost Information
Maintenance unit costs are stored as regular DOT specification items in the Trns*port system or available as contract work items. A separate group within NYSDOT maintains these unit costs. Maintenance work is either treated like the construction project involving bidding for this work or it is given as a job order to the contractor. A suitable overhead and contractor markup is added to the total a mount. The m aintenance d atabase includes historical pr ices f or such w ork a s mowing and snow plowing.

70
4.6 FLORIDA DEPARTMENT OF TRANSPORTATION
4.6.1 Construction Unit Cost Information
4.6.1.1 General Section
Historical bid-based estimating is FDOT’s primary estimating technique used in the PS&E phase of the project development. Estimators use the Lane Mile Cost information developed from the Long Range Estimation (LRE) s ystem for p reparing the P lanning l evel estimates. The LRE i s extensively us ed i n t he s coping a nd e arly de sign pha ses ( see Figure 54 ). The D istrict of fices prepare the Engineer’s Estimate using the CES of Trns*port system.
PlanningLane Mile Cost based on LRE
systemScoping
LREDesign
LRE + Cost Estimating
System (CES)PS&E
Trns*port CES
Historical Bid-Based Estimation
Figure 54. FDOT Estimation Framework.
The lane mile cost information is available for d ifferent t ypes of rural and urban projects. The unit price used t o de velop l ane m ile c osts a s reflected in the es timate r epresents s tatewide averages. This information is available as a reference and not to be used to predict future costs. Generic C ost per M ile (Figure 55 and Figure 56 ) models developed is available on FDOT’s website at http://www.dot.state.fl.us/estimates/LaneMileCosts/LaneMilecosts.htm.

71
Figure 55. FDOT Generic Cost Per Mile Model - Rural Projects.
Figure 56. FDOT Generic Cost per Mile Model - Urban Projects.

72
4.6.1.1.1 Long Range Estimation System
FDOT uses its LRE system, developed in-house, to prepare project estimates in the scoping and design phase. The Generic Cost per Mile models shown in Figure 55 and Figure 56 are generated using LRE system. LRE uses the same historical database as CES and generates a twelve-month rolling average for each pay item. It also provides the estimators with the statewide, county, and market area averages for a particular pay item. A market area is a grouping of counties based on similar bidding practices within districts. The rolling average is updated annually with new bid information.
FDOT u tilizes the LRE s ystem f or pr eparing t he es timates i n the D esign phase until the 60 percent of design c ompletion point. W hen m ore t han 60 pe rcent of the de sign details are available, FDOT us es CES t o bui ld t he e stimate. F DOT doe s not ha ve a ny guidance on t he development of uni t c osts. F DOT i s l ooking a t us ing a cost-based estimating a pproach to estimate major pay items when preparing the Engineer’s Estimate.
4.6.1.2 Acquiring Unit Cost Information
FDOT uses BAMS/DSS to acquire bid information from all the submitted bids.
4.6.1.3 Storing Unit Cost Information
FDOT stores all its historical unit costs in their BAMS/DSS system. Over five years of historical unit c osts are stored i n t heir da tabase. H istorical uni t c osts a re a vailable ba sed on s tatewide, district, and market areas. All the historical unit costs are stored based on standard construction line items.
4.6.1.4 Accessing Unit Cost Information
FDOT m aintains ni ne di fferent c ost hi story l ibraries us ed i n t he T rns*port C ES. T he l ibraries consist of recent six months, eighteen months, and thirty six months historical bid details for low bidders onl y, all bi dders, c ontracts l ess t han two years, and contracts gr eater t han two years. FDOT of fers annual statewide ave rages ( see Figure 57) for a ll p ay items us ing hi storical da ta stored in BAMS/DSS and also averages for various market areas (see Figure 58) on its website.

73
Figure 57. FDOT Annual Statewide Averages.
Figure 58. FDOT Annual Market Areas Averages.

74
4.6.1.5 Applying Unit Cost Information
FDOT uses four t o s ix months of hi storical bid da ta for establishing the uni t pr ices. LRE and CES enable the estimator to select a weighted average or use a scatter plot when determining the unit prices for both major and minor items of work. LRE also provides estimators with statewide, county, and market area averages from which to choose unit costs for each pay item. Though this approach is just guidance on the prices based on historical data, the estimators have the option to override the uni t pr ice if it is not consistent with current market conditions. The libraries with contracts greater than two years duration have inflation built into the unit costs.
FDOT does not have any guidance on a djusting uni t pr ices based on pr oject complexity, s ize, current m arket c onditions, and i nflation but r elies on e xperience a nd e ngineering j udgment t o adjust uni t pr ices. Estimators ha ndle u ncertainties w ithin t he pr oject by us ing c ontingencies varying from 25 percent at the planning phase to 0−5 percent in the final PS&E phase of project development.
4.6.2 Maintenance Unit Cost Information
Maintenance unit cost information is stored in the BAMS/DSS and pulled into the LRE system for estimating. Maintenance activities have different activity codes, which the LRE uses to group maintenance unit costs. The Maintenance Office in FDOT uses LRE to access maintenance unit costs.

75
4.7 WASHINGTON STATE DEPARTMENT OF TRANSPORTATION
4.7.1 Construction Unit Cost Information
4.7.1.1 General Section
WSDOT relies on hi storical bi d-based estimating t o prepare t he es timates i n the pl anning, scoping, and d esign ph ases of pr oject de velopment (see Figure 59). The Final E ngineer’s Estimate is developed using a combination of cost based and historical bid-based estimating. The use of cost based approach is limited to those items of work that comprise the largest dollar value of the project, typically that 20 percent of i tems of work containing 80 percent of project cost. Along with the above two estimating techniques, WSDOT also uses the parametric estimating approach for planning level estimates. The planning level estimates are prepared using two tools that e mploy p arametric me thods: 1) Mobility P roject P rioritization Process ( MP3) a nd 2) Planning Level P roject C ost E stimating (PLCE). E stimates i n t he s coping, de sign, and P S&E phases ar e pr epared using WSDOT’s i n-house estimating system cal led Estimate a nd Bid Analysis System (EBASE). Along with EBASE, WSDOT uses the Bid Tabs Pro® software of Oman Systems to help in preparing the design level and Engineers Estimates. Figure 59 shows the estimating tools used by WSDOT in various project development phases.
PlanningMP3, PLCE
ScopingEBASE, Excel Spreadsheet
DesignEBASE, Excel Spreadsheet
PS&EEBASE
Cost-Based Estimation
Historical Bid-Based Estimation
Figure 59. WSDOT Estimation Framework.
WSDOT maintains a ma nual pr oviding c ost e stimating g uidelines on its website at http://www.WSDOT.wa.gov/Projects/ProjectMgmt/RiskAssessment/Process/ unde r t he Estimating s ection. T he g uideline pr ovides a n o verview of t he e stimating t echniques us ed b y

76
WSDOT during different project development phases and explains the factors affecting the unit prices.
4.7.1.2 Acquiring Unit Cost Information
Historical bid data from bid tabulations are directly imported into the EBASE system. The bid information from all the submitted bids is stored in the database.
4.7.1.3 Storing Unit Cost Information
WSDOT maintains over five years of historical data within their EBASE system. Historical bid details are also t ransferred to Oman systems for bui lding their Bid Tabs Pro database. EBASE holds data for the entire state, districts/regions, and counties. Apart from storing historical unit costs as standard construction line items, WSDOT also has them categorized based on different work categories ( e.g., grading/excavation, asphalt, b ridge, traffic c ontrol, etc.) and based on project types (e.g., bridge replacement, lane widening, intersection reconstruction, etc.).
4.7.1.4 Accessing Unit Cost Information
WSDOT’s U nit B id Analysis s ystem allows access to historical uni t c osts. This in-house developed system c ontains t he bi d hi story for s tandard bi d i tems us ed i n t heir pr ojects. T his history c onsists of l isting of pr ojects i n w hich bid i tems w ere us ed, t he t hree l ow bi dders’ information, quantities, and units of measurement. Unit Bid Analysis can be accessed on t heir webpage at http://www.WSDOT.wa.gov/Design/ProjectDev/EngineeringApplications/UnitBidHistory.htm. The ‘Search’ hyperlink on the webpage lets the user specify standard item name or number, the region, t he m easurement s ystem ( English or M etric) a nd t he da te r ange f or t he i nquiry. T he results can be viewed online or can be downloaded as an Excel spreadsheet. Figure 60 shows the Unit Bid Analysis system for searching WSDOT’s historical database, and Figure 61 shows the result of the inquiry.

77
Figure 60. WSDOT Unit Bid Analysis.

78
Figure 61. Unit Bid Analysis - Inquiry Results.
WSDOT a lso uses Bid T abs Pro, developed b y O man S ystems, for a ccessing hi storical bi d details. The database for this system is built using the historical data stored in EBASE. Unlike the Unit B id A nalysis s ystem, B id T abs P ro l ets t he us er g enerate hi storical r eports ba sed on different search criterions such as:
• By contractor • By job
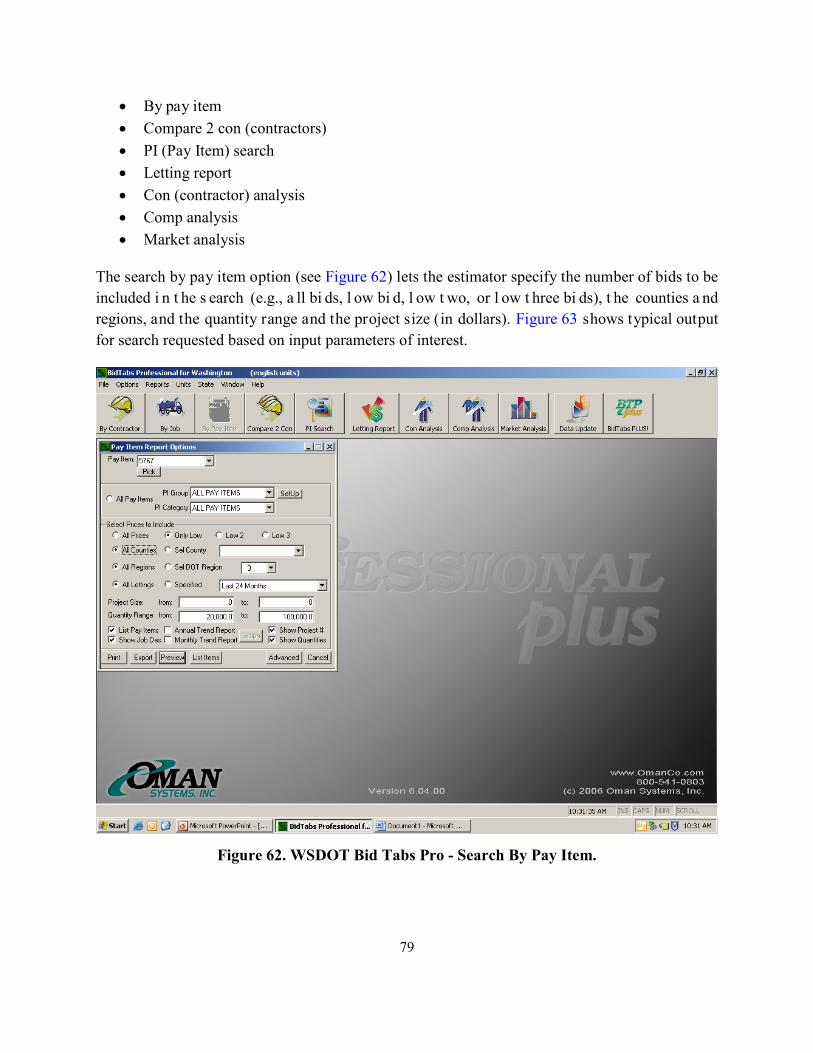
79
• By pay item • Compare 2 con (contractors) • PI (Pay Item) search • Letting report • Con (contractor) analysis • Comp analysis • Market analysis
The search by pay item option (see Figure 62) lets the estimator specify the number of bids to be included i n t he s earch (e.g., a ll bi ds, l ow bi d, l ow t wo, or l ow t hree bi ds), t he counties a nd regions, and the quantity range and the project size (in dollars). Figure 63 shows typical output for search requested based on input parameters of interest.
Figure 62. WSDOT Bid Tabs Pro - Search By Pay Item.

80
Figure 63. WSDOT Bid Tabs Pro - Search Results (By Pay Item).

81
Another search option uses the “By Job” criteria. The estimators can review all the bids or just the bid data for the low bidder based on a job number, as shown in Figure 64. The output of this search (see Figure 65) provides a list of line items used by the winning bidder for that particular job id.
Figure 64. WSDOT Bid Tabs Pro - Search by Job.

82
Figure 65. WSDOT Bid Tabs Pro – Search Results (By Job).
4.7.1.5 Applying Unit Cost Information
WSDOT considers t hree t o s ix m onths of hi storical da ta f or e stablishing t he uni t pr ices, w ith Unit Bid Analysis and Bid Tabs Pro providing the estimators with the necessary historical prices for estimation. The estimating guideline of WSDOT identifies the important factors influencing the development of unit prices. Some of the important factors include:
• Geographic Consideration – The location of the project, urban or rural, distance from location of material sources affects the unit price accordingly.
• Quantity Consideration – Large quantities of a given material leads to lesser unit prices. Very large quantities of certain materials might lead to an increase in the unit prices.
• Item A vailability – Readily available i tems cost le ss tha n materials th at a re in short supply.
• Scheduling/ Lead Time – Contractors schedule their resources to be more efficient and competitive i n t heir bi dding. As a r esult, the l ead time s hould be c onsidered when preparing the estimates based upon the time when it is to be actually built.
• Difficult Construction/ Si te C onstraints – Increases t he cons truction cost f or t he contractor.
• Estimating Lump Sum Items – The contractors take on extra risk due to the use of lump sum items and as a result increase the unit price to counter the extra risk.

83
• Force A ccount – The contractors do not bi d o n f orce account i tems, as t here i s l ess incentive to reduce cost or perform the work diligently. When using force account items, the estimator should try to establish the scope of work to be performed.
• Timing of Advertisement – The timing of advertisement and fluctuations of bid prices due to different seasons affect the unit prices.
• Expected C ompetition/ Contractor Availability – Projects s cheduled late i n the year after the contractors have scheduled their work for the year increases the bid prices.
• Specialty Work/ F irst Time Used – Projects having first time used items or specialty works have to adjust for contractor’s lack of experience with the item and the potential increased risk in construction.
The e stimating guideline pr ovides the estimators onl y with factors to be considered w hen establishing the unit prices, but the adjustment of unit costs is still largely based on engineering judgment and experience of the estimators.

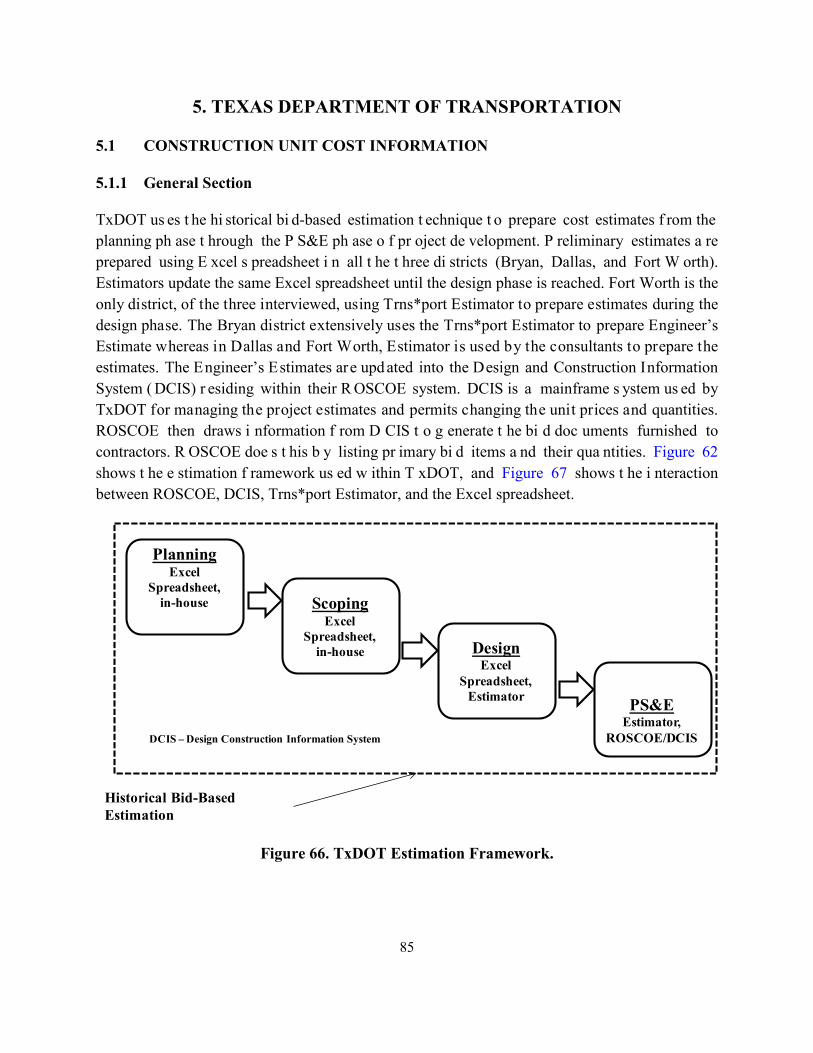
85
5. TEXAS DEPARTMENT OF TRANSPORTATION
5.1 CONSTRUCTION UNIT COST INFORMATION
5.1.1 General Section
TxDOT us es t he hi storical bi d-based estimation t echnique t o prepare cost estimates f rom the planning ph ase t hrough the P S&E ph ase o f pr oject de velopment. P reliminary estimates a re prepared using E xcel s preadsheet i n all t he t hree di stricts (Bryan, Dallas, and Fort W orth). Estimators update the same Excel spreadsheet until the design phase is reached. Fort Worth is the only district, of the three interviewed, using Trns*port Estimator to prepare estimates during the design phase. The Bryan district extensively uses the Trns*port Estimator to prepare Engineer’s Estimate whereas in Dallas and Fort Worth, Estimator is used by the consultants to prepare the estimates. The Engineer’s Estimates are updated into the Design and Construction Information System ( DCIS) r esiding within their R OSCOE system. DCIS is a mainframe s ystem us ed by TxDOT for managing the project estimates and permits changing the unit prices and quantities. ROSCOE then draws i nformation f rom D CIS t o g enerate t he bi d doc uments furnished to contractors. R OSCOE doe s t his b y listing pr imary bi d items a nd their qua ntities. Figure 62 shows t he e stimation f ramework us ed w ithin T xDOT, and Figure 67 shows t he i nteraction between ROSCOE, DCIS, Trns*port Estimator, and the Excel spreadsheet.
PlanningExcel
Spreadsheet, in-house Scoping
Excel Spreadsheet,
in-house DesignExcel
Spreadsheet, Estimator PS&E
Estimator, ROSCOE/DCIS
Historical Bid-Based Estimation
DCIS – Design Construction Information System
Figure 66. TxDOT Estimation Framework.

86
ROSCOE
DCIS
Excel Spreadsheet Trns*port Estimator
Figure 67. Interaction between DCIS, Estimator, and Excel Spreadsheet.
5.1.2 Acquiring Unit Cost Information
TxDOT uses DCIS to acquire all the bid details from the submitted low bids. The district offices use the average low bid information available on the TxDOT website in preparing the estimates. The three districts also review other bids to establish a range of prices used for each bid i tem. The unit costs can also be acquired from a Site Manager Spreadsheet available on their intranet (Crossroads). This spreadsheet provides the estimators with the current prices for each item of work along with their quantities for individual projects under construction.
The T xDOT w ebsite ( http://www.dot.state.tx.us/services/design/estimator.htm) ma intains th e catalog of current historical unit prices, which is downloaded and used in Trns*port Estimator.
5.1.3 Storing Unit Cost Information
Historical uni t costs are stored within DCIS. The database holds one month and twelve month moving averages available for each item of work. The historical unit costs are stored as standard construction line items, and averages are available for the entire state and for each district within TxDOT.
5.1.4 Accessing Unit Cost Information
Districts us e the one -month a nd t welve-month m oving average ava ilable on their w ebsite at http://www.txdot.gov/business/avgd.htm as a s ource of hi storical uni t c osts. T he w ebsite maintains the statewide moving average as well as moving averages for each district. Unit costs are also available for maintenance projects, again sorted based on district and the entire state (see Figures 68 a nd 69). Estimators a lso use bi d da ta f rom s imilar pr ojects c urrently unde r construction or recently completed when arriving at the unit cost.

87
Figure 68. TxDOT Average Low Bid Unit Price.
Figure 69. TxDOT Average Low Bid Unit Prices for Dallas.

88
Estimators at the central office in Austin use a Site Manager spreadsheet to gather the latest unit prices on active p rojects. District es timators can use t his spreadsheet t o compare uni t pr ices derived from other sources. The spreadsheet titled ‘Item Search by Nbr Desc or SupplDesc’ is available under the Contract Administration section within Crossroads. Estimators are given an option to search items of work based on item number, description, and supplemental description. Figures 70, 71, and 72 provide the r esults f or t he t hree s earch opt ions. Knowledge of t his spreadsheet is not widely known within TxDOT.
Figure 70. TxDOT Item Search by Description - Site Manager Spreadsheet.

89
Figure 71. TxDOT Item Search by Number - Site Manager Spreadsheet.
Figure 72. TxDOT Item Search by Supplemental Description - Site Manager Spreadsheet.
Using the f ilter opt ion available within Excel, users can change the search results to suit their requirements. For example, the estimator is estimating the unit price of 200 square yards of Flex Base. By s earching f or F lex B ase i n this E xcel spreadsheet (either by Item N umber or Description s earch) a nd s etting t he filter on ‘ Total B id Q ty’ column t o s how onl y qu antities within a certain range of 200 s quare yards, the estimator can check uni t prices against current price (see Figure 70).
In addition to using one-month and twelve-month moving averages, estimators also look at the bid tabulation details for all the projects (See Figure 73). This helps the estimator assess the price used b y four l ow bi dders f or t he pr oject a nd i dentify the r ange of bids submitted by th e

90
contractors. Bid tabulations and bid totals are maintained under Contract Letting section within the Construction D ivision (http://www.dot.state.tx.us/business/bt.htm). B id i nformation is divided i nto c onstruction, m aintenance and local l et pr ojects. Figure 73 s hows sample bid tabulation from a recently let construction project.
Figure 73. TxDOT Bid Tabulations.
5.1.5 Applying Unit Cost Information
TxDOT uses one-month and twelve-month moving averages based on low bids for establishing unit pr ices. Sometimes a three-month moving a verage i s a lso c onsidered f or greater understanding of the prices. The use of twelve-month moving averages evens out the effect of using onl y t he l ow bi d. Weighted m oving a verages, us ed i n d etermining t he uni t pr ices, are preferred over simple averages since they take into consideration the effect of quantities when arriving at the unit price. Some of the important factors influencing the unit prices are location of the project and quantity. Though there is no process guidance on h ow to adjust uni t pr ices for quantities, a general rule of thumb often followed is the higher the quantity, the lower would be the unit price, but up until a point. Cost estimates are updated on a yearly basis. For example, if

91
four percent annual inflation is considered and the project is five years away from letting, then add 20 percent inflation to the estimates. For items having no historical data or that are unique to a project, prices are established by contacting suppliers and contractors, looking at the statewide and maintenance averages or by contacting adjoining districts. Estimators prefer not to refer to the catalog unit prices for hot mix asphalt, cement, and steel because of their high volatility in recent times. Adjustments to unit prices are completely based on the experience and engineering judgment of the estimators. In its PS&E Preparation manual, TxDOT maintains a list of factors to be considered when adjusting unit bid prices but does not provide the quantitative factors to be used when m aking t he adjustments. Following a re t he f actors outlined i n t he m anual to be considered when adjusting unit prices:
• Project size
• Project location
• Traffic conditions
• Construction season
• Accessibility
• Restrictive conditions
• Availability of materials
• Specifications
• Construction time
• Plan clarity
• Bidder competition
5.2 SIMILARITIES AND DIFFERENCES
The research team compared the responses to the interviews from the seven state agencies to the replies from the three TxDOT districts to identify similarities and differences in the development of uni t pr ices f or c ost e stimating. T he c omparison i s ba sed on r eplies r eceived for t he f ive sections of t he s urvey, namely the g eneral s ection, acquiring unit cost, storing unit cost, accessing unit cost, and applying unit cost information sections.

92
5.2.1 General
The following w ere t he similarities and differences obs erved from t he replies r eceived for t he general section of the surveys and interviews.
• TxDOT, similar to UDOT, NYSDOT, FDOT and C altrans, us es hi storical bi d-based estimating unt il t he f inal pha se of t he pr oject de velopment. T he onl y e xceptions are VDOT and MnDOT, which use cost-based estimating for preparing their final engineers estimate.
• The three districts interviewed within TxDOT rely on Excel spreadsheets for developing estimates in the planning and scoping phase and some in the design phase. This is similar in approach to MnDOT and NYSDOT.
• TxDOT, VDOT and N YSDOT us e t he com mercial E stimator s oftware of T rns*port
system for preparing the final Engineer’s Estimate. VDOT, FDOT and NYSDOT also use a commercial software system (Trns*port CES) for preparing their final estimates.
• UDOT ( PDBS) and WSDOT ( EBASE) are the onl y agencies, a mong t he S HAs interviewed, with an in-house developed system to prepare the Engineer’s Estimates.
• TxDOT, similar to VDOT, UDOT a nd WSDOT, maintains a lis t of f actors to be considered when adjusting uni t pr ices. But unlike them, TxDOT does not maintain any guidance on estimating procedure to be followed in different project development phases.
• Among t he a gencies us ing bi d-based estimating, F DOT a nd NYSDOT are c onsidering the use of cost based approach for estimating major items of work.
5.2.2 Acquiring and Accessing Unit Cost Information
The s imilarities and differences i n the r eplies r eceived for a cquiring an d accessing uni t cos t information section are as follows:
• TxDOT captures only the low bid information (internet), though the districts tend to look at all the bids while preparing the estimates. Similarly, VDOT and Caltrans also capture low bid information to determine the average low bidders for entire state and districts.
• Unlike TxDOT, Caltrans acquires information from all bidders and VDOT from the three low bids as well.
• Other agencies acquiring all the bids are MnDOT, FDOT, WSDOT and UDOT.
• Similar to VDOT, NYSDOT uses the three low bids for determining the unit costs.

93
5.2.3 Storing Unit Cost Information
The r eplies received for t he s toring uni t c ost i nformation s ection s howed t he f ollowing similarities and differences:
• TxDOT (DCIS) like UDOT (PDBS) and Caltrans (BEES), uses an in-house system for storing hi storical bi d details, w hile t he r emaining agencies rely o n commercial BAMS/DSS for storing bid histories.
• All agencies, including TxDOT, have historical unit costs available based on s tatewide, districts, and counties. FDOT and Caltrans are t he onl y t wo agencies with bid da ta for market areas as well.
• Similar to TxDOT, all agencies use standard construction line items as the preferred form for storing historical unit costs. But VDOT, Caltrans, and NYSDOT store these data by work categories and project types as well.
5.2.4 Applying Unit Cost Information
The similarities and differences in the replies received for applying unit cost information section are as follows:
• TxDOT us es only a one-month a nd a t welve-month w eighted m oving a verage f or establishing uni t pr ices. U DOT is the only ot her a gency, s imilar t o T xDOT, us ing a weighted m oving average f or dur ations of one q uarter and one year. UDOT al so uses seven to twelve months of historical data for establishing unit prices.
• The r emaining a gencies di ffer f rom T xDOT on t he c alendar dur ation us ed f or establishing unit prices.
o NYSDOT a nd MnDOT, similar to UDOT, us e s even t o t welve m onths of historical data.
o Caltrans, WSDOT, and FDOT use only four to s ix months of historical data for determining the unit price.
• TxDOT, l ike t he r emaining s even a gencies i nterviewed, uses simple ave rage and weighted average for determining the unit prices. Unlike other agencies, TxDOT does not consider r egression analysis as one o f s tatistical te chniques t o be used for de termining unit costs.
• On the application of th ese s tatistical t echniques, TxDOT, VDOT, UDO T, NYSDOT, Caltrans, W SDOT, and FDOT use i t for de termining bot h m ajor a nd m inor i tems of work.

94
• MnDOT is the only agency to use s imple average o r regression analysis for estimating minor items of work.
Some of the other replies that differed from TxDOT’s approach are:
• VDOT uses regression analysis for determining the unit costs if sufficient historical data is available. Otherwise, VDOT prefers to use the weighted average.
• Caltrans ma intains a c omparison of E ngineer’s Estimate to Low Bidders to study the influence of number of bidders on bid prices.

95
6. CONCLUSION AND RECOMMENDATIONS
The replies from the survey and the interviews were used as basis for drawing conclusions for this s tudy. T he results s howed t hat s tate highway agencies ha ve di fferent appr oaches for developing uni t c osts. T hough s ome state a gencies ha ve a s ystematic pr ocess i n place for preparing project estimates, they have no written documentation on the entire process, including documentation f or de veloping uni t c osts. SHAs that w ere i nterviewed di d not ha ve a f ormal process or m ethod t o a djust uni t pr ices f or pr oject c haracteristics ( e.g., complexity, l ocation, size), c urrent m arket conditions ( e.g., bidding e nvironment), or cur rent da y pr ices ( e.g., inflation). Adjustments to unit costs were based mainly on experience and engineering judgment of the estimators in all the state agencies. Some state agencies, including TxDOT, did have a list of factors to consider bu t did not have a methodology for applying these factors to adjust uni t costs.
After analyzing the replies received from the various state highway agencies for the surveys and the int erviews, the research team i dentified the f ollowing r ecommendations. The r esearchers based these r ecommendations on t he c omparison of replies received from t he t hree T xDOT districts with national l evel r esponses. T he r ecommendations are divided i nto s hort t erm recommendations, r equiring m inimal c hanges t o t he e xisting s ystem, and l ong t erm recommendations. Long term recommendations would likely require considerable changes to the existing s ystem. E ach recommendation ha s a s ection e xplaining i ts potential importance to TxDOT a nd a s ection pr oviding s ources for further i nformation on implementing the recommendation.
The outcomes of this s ynthesis were dependent upon the practices of other SHAs. S ince there were no s tructured and comprehensive processes for development and adjustments of unit costs, this synthesis provides only potential recommendations provided based on obs ervations related to similarities and differences between TxDOT and other SHAs.
6.1 SHORT TERM RECOMMENDATIONS
Consider using Cost-Based Estimating for items of work related to hot mix asphalt, steel, and concrete. These materials have shown vast fluctuations in the recent past.
Why: The final estimate for projects having large quantities of hot mix asphalt, steel, and concrete tend to be dictated by the prices of these three items. Obtaining the right price for these three items is crucial to prepare an accurate Engineer’s Estimate. Due to large fluctuations in the prices of hot mix asphalt, steel, and concrete in the recent past, adopting a historical bid-based estimation for these items of work does not provide an accurate unit price. The historical bid data can no longer be r elied upon because they do not r epresent t he act ual t rend. W hereas a dopting c ost based

96
approach for t hese i tems can help in achieving a m ore accur ate uni t pr ice s ince t his appr oach uses more recent prices and covers different components of work.
Where: NYSDOT, VDOT, and MnDOT us e a cost ba sed a pproach f or e stimating the p rices o f the se three i tems. These agencies generally use a cost based approach for es timating major i tems of work in the final PS&E phase of project development. FDOT is another agency looking at using cost based approach for estimating major items of work.
Consider Estimator (Trns*port) for implementation in all district offices for developing construction project estimates in the PS&E phase as well as in the design phase of project development.
Why: The t hree T xDOT di stricts i nterviewed as part of thi s s ynthesis us e E stimator s oftware in different w ays. In on e d istrict, only the c onsultants us e it f or pr eparing their e stimates w hile another has the district personnel alone using them. Also one of the districts uses Estimator late in the design phase itself, while the rest start to use it for preparing only the Engineer’s Estimate. Having all the di stricts use Estimator software t o build their e stimates, in both t he design and PS&E phases, can ensure uniformity in the estimation process and consistency in the estimates. This c ould be a n i mportant s tep i f T xDOT de cides t o a dopt a c ost-based e stimation us ing Estimator software for preparing design level and final Engineer’s Estimate.
Consider the Site Manager Database spreadsheet that is available on Crossroads (TxDOT’s intranet) for accessing more current unit cost data on various line items in all district offices.
Why: The Site Manager spreadsheet, available on C rossroads, provides the estimators in all d istricts with the latest unit prices for the line item being estimated. Apart from using the one-month and twelve-month averages, this spreadsheet provides the unit prices from current/recently completed projects.
Using the spreadsheet, the unit prices for the last three, six, and nine months can be searched to observe their trend. Further analysis of unit prices can be carried out after arranging them based on the quantity being estimated. This spreadsheet can be a valuable source for obtaining current unit prices from ongoing TxDOT projects.
Where: Site Manager Spreadsheet is available on Crossroads (TxDOT’s intranet) under the Construction Division’s Contract Administration section.

97
6.2 LONG TERM RECOMMENDATIONS
Consider reviewing the use of Cost-based estimating for project estimation in the Design and PS&E phases or a combination of both cost-based estimating and historical bid-based estimating, with cost- based estimating used to estimate major items of work.
Why: The cost b ased approach i s pr eferable f or estimating uni que pr ojects or pr ojects w here t he location, market factors, and the volatility of material prices make the use of historical bid-based estimation unreliable. Also, contractors use a cost based approach to prepare t heir bids. W hen using cost-based estimation, different components of work like the equipment rate, material rate, production rate, and crew size are considered for preparing the estimates. Since this is similar to the cont ractors’ appr oach, there i s a possibility f or reducing t he di fference b etween the Engineer’s Estimate and the low bids submitted. As a result, overall accuracy improves.
Where: State age ncies l ike M nDOT, VDOT, and CDOT ex tensively us e cost-based e stimation f or preparing their Engineer’s Estimate as well their design level estimates.
Consider studying the effort required to implement cost-based estimation in the Estimator software.
Why:
Though cost-based estimation provides better estimates, performing the estimation is more time consuming t han t he hi storical bi d-based a pproach. Substantial effort is ne eded f or s etting up libraries f or equi pment r ates, material r ates, production rates, and c rew s ize t o be us ed i n t he system. Performing a study on t he effort required to transition to cost based approach becomes all t he m ore i mportant. T his c ould pr ove c rucial if T xDOT decides t o a dopt a c ost-based estimating.
Where: Colorado D epartment o f Transportation ( CDOT) moved a way f rom t he bid-based estimation approach t o a c ombination of c ost-based/historical bi d-based estimating to prepare t heir Engineer’s E stimate using E stimator s oftware. TxDOT c ould l ook t o t he e ffort unde rtaken by CDOT for this conversion as guidance when implementing the cost-based estimating.
Consider using other information systems to access unit costs more efficiently.
Why: Accessing recent bid history is critical to developing accurate prices for various l ine i tems. An efficient system that quickly and effectively sorts through historical data can be a va luable asset

98
to estimators. Software like B id Tabs P ro a llow the us er to s earch th rough hi storical d ata, identify the usage of particular pay i tem, obtain pricing t rends, and double check current costs based on r egions, c ounty, and state av erages. As a result the time s pent b y the estimator searching the database for unit costs is cut down. Before implementation, TxDOT might have to sort out possible problems with the use of Bid Tabs Pro in terms of licensing and availability of data within the system.
Where: Oman Systems makes this software, and WSDOT is one of the state agencies currently using Bid Tabs Pro. WSDOT is a source to understand the full capabilities of this tool. (Refer Appendix C for complete contact information of all the respondents.)
Consider developing an approach similar to the Red Flag Analysis of the Utah Department of Transportation to adjust estimates based on unique project and site characteristics.
Why: UDOT makes use of Red Flag Analysis to aid estimators in developing an Engineer’s Estimate that takes into consideration the di fferent f actors a ffecting th e project cost. It helps e stimators increase or decrease the final estimate based on factors like location, start date of construction, bidding s eason, contractor i nterest, that affect th e pr oject c osts. This a llows the estimators to account for project characteristics influencing the final estimate.
Where: UDOT’s Red Flag Analysis can be further studied for a similar implementation by TxDOT that is suited to its requirements.
Consider developing guidelines for adjusting unit prices during different project phases.
Why: TxDOT could benefit from having a guideline on adjusting unit prices, outlining the factors to be considered when arriving at a cos t for a pa rticular pay item. This makes the estimation process more standardized and enables the estimators, especially the new estimators, to better understand the f actors tha t the y need to l ook i nto w hen de termining t he uni t c osts a nd how to m ake adjustments based on project characteristics. There can also be a knowledge database that serves as a repository of various challenges faced while estimating different TxDOT projects and how the estimators handled these challenges. This can be an important source of information for all estimators.
Where: UDOT, WSDOT, and VDOT ha ve g uidelines on factors t hat t he es timators ne ed to l ook i nto when determining the cost for a particular item of work.

99
REFERENCES
Anderson, S.D, Molenaar, K., and Schexnayder, C.S, “The Guidebook: Guidance for Cost Estimating and Management During Planning, Programming, and Preconstruction,” NCHRP Report 574, National Cooperative Highway Research Program, Transportation Research Board, National Research Council, National Academy Press, 2007.
AASHTO. “A Practical Guide To Estimating”, Design Task Force Technical Committee on Cost Estimating. 2007.
De La Garza, J., and Oralkan, G., “Implicit Design Knowledge and its Impact on Cost Estimating,” Construction Congress Proceedings: Preparing for Construction in the 21st
Century, American Society of Civil Engineers, New York, NY, 1991.
Schexnayder, C., Weber, S., and Fiori, C., “Cost Estimating: A Synthesis of Highway Practice,” Final Report, National Cooperative Highway Research Program, Project 20-7, Task 152, Transportation Research Board, 2003.
Williams, R., Hildreth, J., and Vorster, M., “A Bid Item Level Performance Time Database Management System as Part of a Framework for Progressively Estimating Contract Time”, Transportation Research Board, Annual Meeting, 2007.


101
BIBLIOGRAPHY
Anderson, S.D, Molenaar, K., and Schexnayder, C.S, “Procedure for Cost Estimation and Management for Highway Projects During Planning, Programming, and Preconstruction,” Research Report, Project 8-49, National Cooperative Highway Research Program, Transportation Research Board, National Research Council, July 2006.
CALTRANS. Project Development Procedures Manual, Chapter 20 (12/2007). http://www.dot.ca.gov/hq/oppd/pdpm/pdpmn.htm
Kyte, C., Perfater, M., Haynes, S., and Lee, H., “Developing and Validating A Highway Construction Project Cost Estimation Tool”, Virginia Transportation Research Council, December 2004.
ODOT, Construction Management System. http://www.odotonline.org/cmsportal
PennDOT Guidelines on Cost Estimating (Draft - 01/2008).
Rothrock, T.P., “Highway Construction Cost Estimating Work Station”, Federal Highway Administration, FHWA-PA-90-017, Research Report 86-27, July 1990.
TxDOT. PS&E Preparation Manual (05/2007).
UDOT. Statewide Estimate Review Process. http://www.udot.utah.gov/main/uconowner.gf?n=35214810363450832
UDOT. Roadway Design Manual of Instruction-Estimating Chapter. http://www.udot.utah.gov/main/uconowner.gf?n=519455313302721722
VDOT. “Guidelines and Procedures For Estimating and SAAP Section-Scheduling & Contract Division”. http://www.virginiadot.org/business/const/internalprocesses.asp
Walton, J., and Stevens, J., “Improving Conceptual Estimating Methods using Historical Cost Data”, Transportation Research Board, Issue 1575, 1997.
WSDOT. Cost Estimating Guidance for WSDOT Projects. http://www.WSDOT.wa.gov/Projects/ProjectMgmt/RiskAssessment/


103
APPENDIX A
TxDOT SURVEY RESULTS


105

106

107

108

109
APPENDIX B
ONLINE SURVEY QUESTIONNAIRE


111

112

113

114

115

116
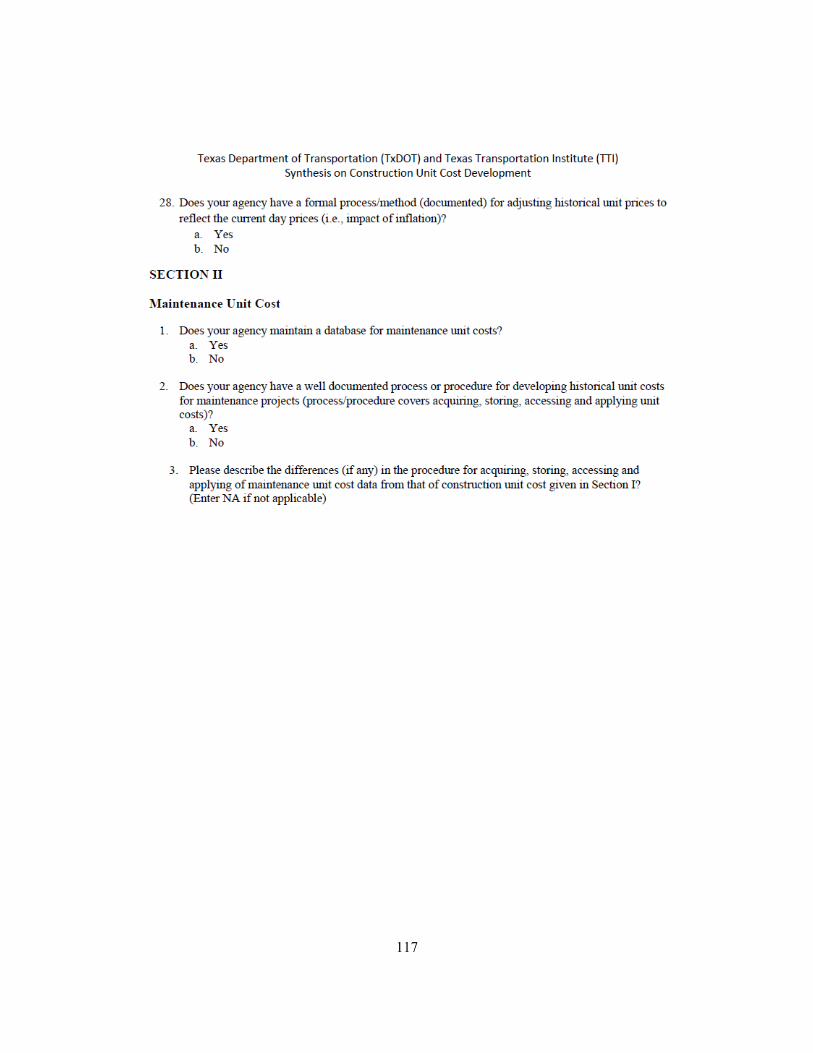
117


119
APPENDIX C
RESPONDENTS CONTACT INFORMATION


121


123
APPENDIX D
FOLLOW UP INTERVIEW QUESTIONNAIRE – VDOT


125

126

127

128